1. Introduction
Diabetes mellitus is a metabolic disorder of multiple aetiologies characterized by chronic hyperglycaemia with disturbances of carbohydrate, fat, and protein metabolism resulting from defects in insulin secretion, insulin action, or both [
1]. The original damage caused by diabetes mellitus is due to all kinds of diabetic complications, such as diabetic nephropathy, which is one of the most harmful. The World Health Organization (WHO) estimates that more than 180 million people worldwide have diabetes and this number is likely to be more than 350 million by 2030 [
2].
Blood Glucose Measurement technology is necessary for people whose blood glucose is unbalanced to control their glucose level. According to recent researches, continuous glucose monitors (CGM) can greatly improve control of blood glucose [
3]. James C. Boyd has pointed out that a blood glucose measurement with an error of less than 10% every 5 min can significantly reduce the harm caused by hyperglycemia or hypoglycemia [
4]. However, most of the blood glucose meters currently available on the market are invasive, which needs to puncture the fingers to collect blood as a measurement sample. This measurement method will cause pain to the patient and is particularly not convenient for young children, which can lead to inefficient self-monitoring and is not suitable for continuous glucose monitoring.
In order to reduce the trauma to patients during blood glucose measurement, and increase the frequency of glucose monitoring, some medical device companies began to study mini-invasive or non-invasive blood glucose meters. In recent years, some devices have even obtained Communate Europpene (CE) or U.S. Food and Drug Administration (FDA) certification. The most famous product is Abbott
™
[
5,
6], a mini-invasive blood glucose meter attached to the patient’s arm, which was approved by FDA in September 2017. Although
™ can provide 24-h continuous blood glucose monitoring, it still needs to use a micro-needle to puncture the skin, and long-term wear can easily lead to wound infection. Not only that,
™ needs to be replaced every 14 days, making the measurement cost too large. In addition, this mini-invasive glucose meter measures the glucose concentrations of the subcutaneous interstitial fluid, instead of blood. Numerous studies have pointed out that there is a time lag between the glucose concentration in the blood and that in the interstitial fluid [
7,
8], which leads to a lower accuracy in blood glucose fluctuations or hypoglycemia, making it difficult to promptly alert. For these reasons, the research of non-invasive glucose measurement (NGM) technology has become one of the most popular topic in the medical treatment and the sensor field.
The history of NGM research has been more than 30 years, but the methods of NGM are still not systemic. Fortunately, many technologies have been applied to make the measurement more accurate. The most common ways of NGM are optical, thermodynamic, and other chemical or physical methods [
9]. Although there is still no method whose accuracy can satisfy the requirements of clinic application, progresses on some important aspects have been made, e.g., the relation between glucose concentration and Raman spectroscopy acquired from physical tissue has been proved in [
10]. The major techniques of optical methods are based on spectrum analysis of subcutaneous structures in the near or mid infrared (0.8–2.5
m), in which the absorbance of the glucose bonds (
) is strong [
11]. With the development of artificial intelligence, there are many researches that combines physical and physiological data with machine learning algorithm to predict glucose levels [
12]. In
Table 1 and
Section 2, we will detail and analyze the mini-invasive and non-invasive blood glucose meters currently available on the market.
Overcoming Individual Discrepancies (IDs) is one of the key technical issues in NGM by spectrum analysis methods. In the light propagation path in skin tissue, there are many individual factors that can affect the final spectrum and glucose measurement results, e.g., the thickness and color of skin tissue, cuticle, epidermis, dermis and subcutaneous tissue, muscle, bone, etc. [
13]. In non-invasive optical measurement of other blood components, e.g., blood oxygen, hemoglobin, etc., some methods have been proposed which are able to eliminate the interference of IDs. The dynamic spectroscopy method is able to extract the information of blood’s components, removing background and noise at the same time [
14]. Double-sampling is used to improve signal-to-noise ratio of dynamic spectroscopy [
15]. In the field of NGM, different measurement methods need different ways to overcome IDs, which needs further research.
In this paper, a learning NGM model that can overcome IDs, to a certain extent, is presented. This model is based on human earlobe light absorbances with five different wavelengths and a glucose estimating algorithm with automatically parameters tuning for individuals. The earlobe was chosen due to the absence of bone tissues, and also because of its relatively small thickness [
16]. We choose three wavelengths (
, and 930 nm) in the near infrared wavelength range whose absorbance mainly depends on the amount of glucose in blood to measure blood glucose level. In order to overcome the IDs, green (490 nm) and red (660 nm) light is used to estimate the tissue thickness and blood volume separately to compensate the measurements [
12]. Based on the linear relation between absorbances of the five lights and blood components, we use Independent Component Analysis (ICA) [
17] to extract independent components from transmittances data, and use them as new features data. Glucose concentration is obtained with Random Forest (RF) [
18], and test its performance with a reference invasive glucose meter in terms of measurement accuracy. ICA is a method for separating complex signals to independent signals by matrix decomposition which is frequently used in signal processing [
17]. RF is a machine learning model, which can be used for black-box modeling in the case of mechanism is not clear [
18]. Prototype test result shows the effectiveness of this approach by Clarke Error Grid Analysis (EGA) [
19].
The rest of this paper is structured as follows: In
Section 2, some products of blood glucose meters are discussed.
Section 3 focuses on analyzing the measurement theory that supports the NGM through absorbance spectrum.
Section 4 describes the circuit of the prototype for getting light absorbance data.
Section 5 presents the glucose estimation model based on ICA and RF.
Section 6 shows the results of the measurement accuracy with EGA, and discusses the convergence speed of our proposal. Finally, this paper is concluded in
Section 7.
2. Related Works
In this section, we will list the mini-invasive and non-invasive blood glucose meters currently certified by CE or FDA, and introduce them in detail, including their measurement principles and advantages and disadvantages. An overall comparison is shown in
Table 1. It is worth mentioning that since
™
,
™, and
™ measures the interstitial glucose concentrations rather than the blood glucose concentration, some scholars do not consider these devices to be blood glucose meters. In this paper, considering that the original intention of these devices is to monitor the blood glucose levels by monitoring the interstitial glucose concentrations, we classify them as mini-invasive blood glucose meters, but the readers should know that they are not true blood glucose meters.
2.1. Mini-Invasive
™
: This is a wearable continuous glucose monitoring device from Abbott, and consists of a coin-sized disposable circular sensor that is attached to the upper arm by a miniature needle of
mm long and
mm wide and a small adhesive tape. The user can obtain his/her blood glucose level through a handheld device. It should be noted that this product measures the glucose concentration of the interstitial fluid, which exists a time lag compared to blood glucose level, which means that a finger prick test using a blood glucose meter is required during times of rapidly changing glucose levels when interstitial fluid glucose levels may not accurately reflect blood glucose levels, or if hypoglycemia or impending hypoglycemia is reported but the symptoms do not match the system readings [
6]. In addition,
™
needs to be replaced every 14 days, to avoid wound infection.
™: It was developed by Echo Therapeutics, Inc., as a mini-invasive continuous glucose monitoring device. A special skin preparation device is used to permeate the skin before placing the sensor. The device abrades the skin, removing about mm of the outer layer of skin using adaptive micro-abrasion technology. This process takes 10–20 s, and removal of the outer layer of skin for allowing the measuring of a number of physiological properties, including interstitial glucose levels. All the measured values are transmitted wirelessly to a remote monitor that is equipped with alarm alerts if the glucose level is outside the normal range. Like ™ , since ™ measures the interstitial glucose levels, it also does not accurately reflect blood glucose levels.
™: Dexcom
™ is a patch device, and composed of three parts: A sensor that measures glucose in the fluid under the skin, a processor that is embedded on the sensor and transmits the data to the receiver every five minutes, and a receiver that displays the blood glucose level to the user [
20]. The measurement principle of this device is similar to
™ and
™, and is indicated by the FDA for use as both a standalone CGM and for integration into automated insulin dosing (AID) systems [
21].
™: It is a watch-type glucose meter that contacts the human skin through an electrode, which generates a micro current to the skin. The charged ions and glucose in the subcutaneous interstitial fluid can migrate to the skin surface under the action of the electric field, and the glucose concentration is measured by glucose oxidase. This device has high requirements on the physiological condition of human body. Factors, e.g., skin sweating, environmental temperature, electrostatic interference, etc. will affect the measurement results. Due to its low accuracy, ™ has been revoked by the FDA and is required to recall products that have already been sold.
2.2. Non-Invasive
: This is a smart contact lens project developed by Google on 16 January 2014. This project aims to assist people with diabetes by constantly measuring the glucose levels in their tears. Tears will flow into the monitor through a small holes in the lens, which containing a sensor that measures the glucose level in the tears. The users obtain their glucose levels by observing the change of the color of the lens. Unfortunately, Google announced the termination of the project on 16 November 2018, due to the large measurement error and difficult sample collection [
22].
™ : It is a learning non-invasive glucose meter, developed by Cnoga Medical Ltd, that requires more than 100 invasive and more than 50 non-invasive data calibrations before use. The basis for measuring blood glucose is the absorption spectrum of the finger.
HG1-c: MediSensors is San Jose, California, USA based company that developed compact continuous NGM device i.e.,
, which is based on Raman spectroscopy [
23].
: It consists of two parts, the handheld monitor and the ear-clip sensor, and integrates three measurement techniques: Ultrasound, electricity, and thermal. Ultrasound technique is used to measure the velocity of sound waves passing through the earlobe, and the velocity is affected by the concentration of blood glucose in the capillaries of the earlobe; electrical technique is used for measuring the change in conductivity of the tissue; and the heat transfer features of the tissue is obtained by the thermal technique.
: This device is based on infrared spectrum. It is inserted in the ear canal, and emitting different wavelengths of light to the eardrum, analyzing the reflected signals to calculate glucose levels.
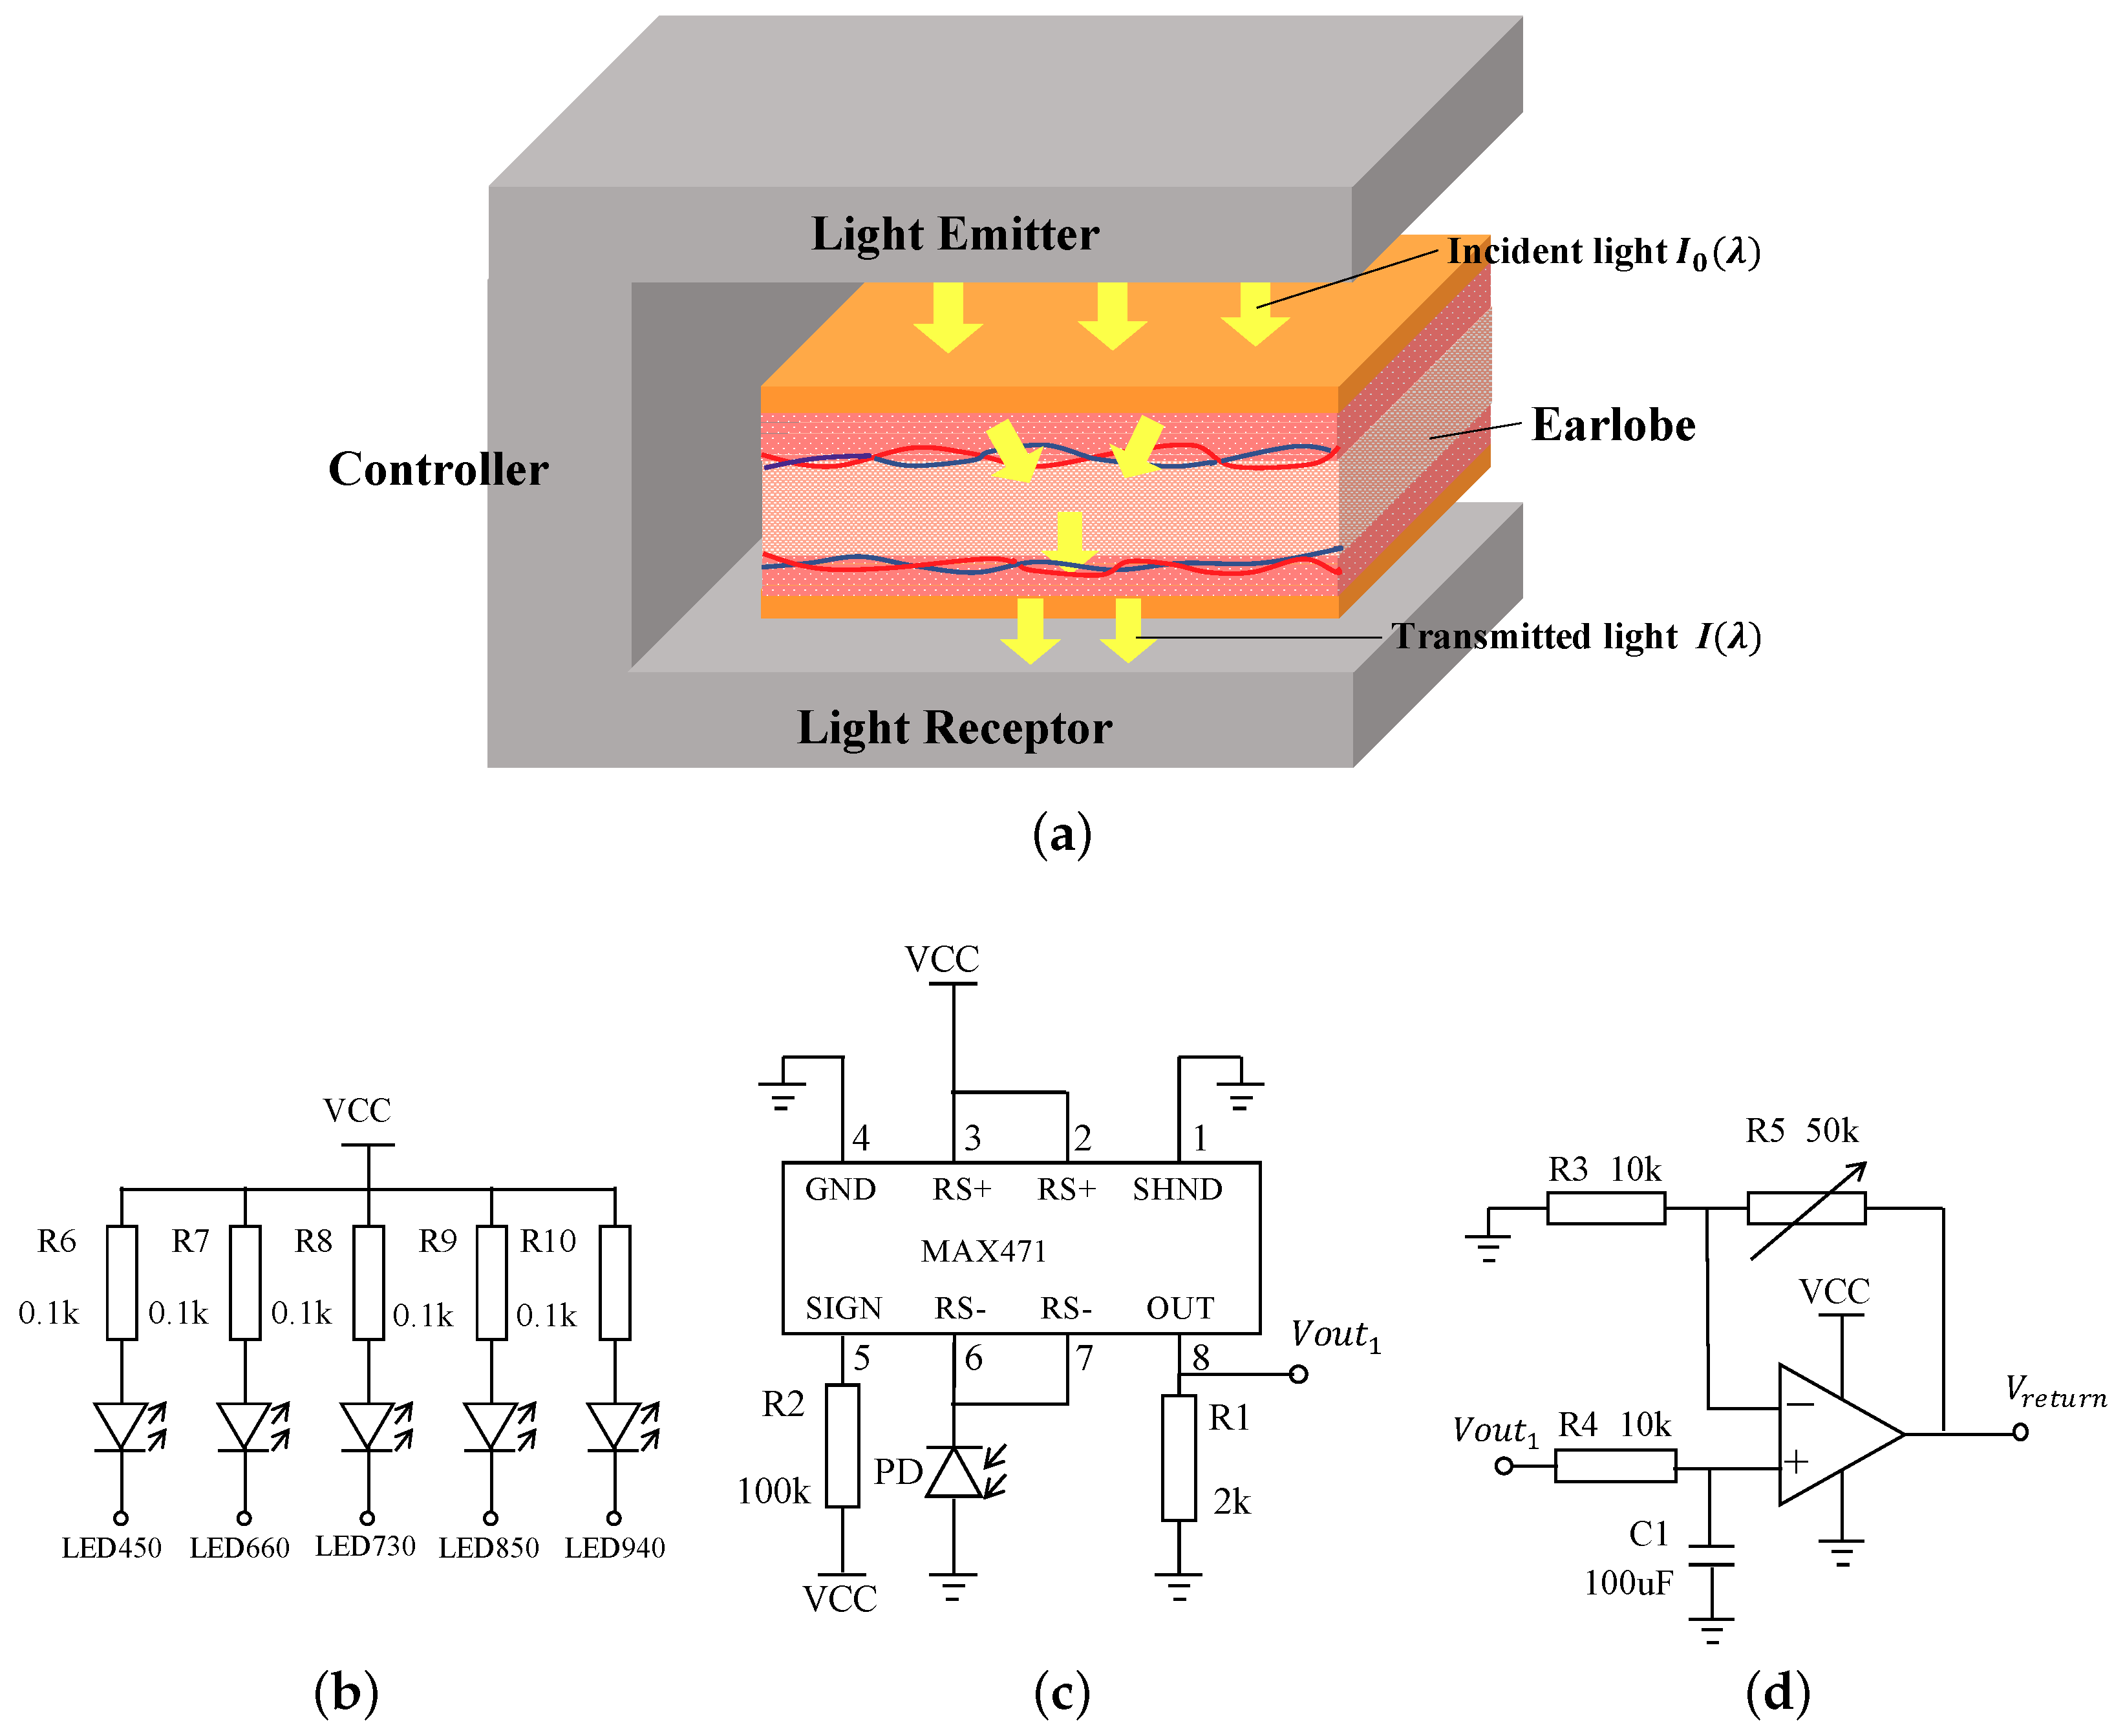
4. Circuit of Blood Glucose Sensor
Earlight is the blood glucose sensor used in this paper for collecting absorbance data of different wavelengths. In this section, we focus on the circuit design of the Earlight, which is composed of three parts, i.e., light emitter, light receptor, and controller, as shown in
Figure 2a.
The light emitter is used to emit incident light of different wavelengths, and contains five different wavelengths of LED light source (490 nm, 660 nm, 730 nm, 850 nm, and 930 nm), and a power dissipation of 120 mW. These LEDs are connected by using shared anode,
Figure 2b.
The light receptor is used to receive transmitted light and measure its intensity. Light receptor includes two parts, current to voltage convertor (I-V converter) and filter amplifier circuit (F-A circuit),
Figure 2c. In I-V converter, the silicon photodiode (PD) whose bandwidth spans from 300 nm to 1100 nm is able to produce a current whose intensity is proportional to the received light intensity, and the current signal is transformed to a voltage signal (
) by MAX471 (Maxim, San Jose, San Jose, CA, USA), which is a current sensing IC presented by MAXIM company. In F-A circuit, the
is filtered and amplified to
that can be loaded into an analog to digital converter (ADC) via a low-pass first order filter and a proportional amplifier.
The controller is applied to control the LEDs and calculate measurement result. The controller is a SCM STM32f103 (STMicroelectronics, Geneva, Switzerland) minimum system with a small liquid-crystal display. There is a 12-bit ADC in this system, that can be used to measure the voltage signal produced by the light receptor and calculate absorbance of light according to Equation (
2). There are two reasons for using a 12-bit ADC: 1. The 12-bit ADC provides 4096-level resolution, and we found that the acquired voltage signal varies from 0 to 3.6 V with an accuracy of 0.001 V, which needs a resolution of
. So a 4096 resolution of a 12-bit ADC is sufficient. 2. The STM32f103 microcontroller we use has a 12-bit ADC, so there is no need to add an external ADC, which will reduce the cost.
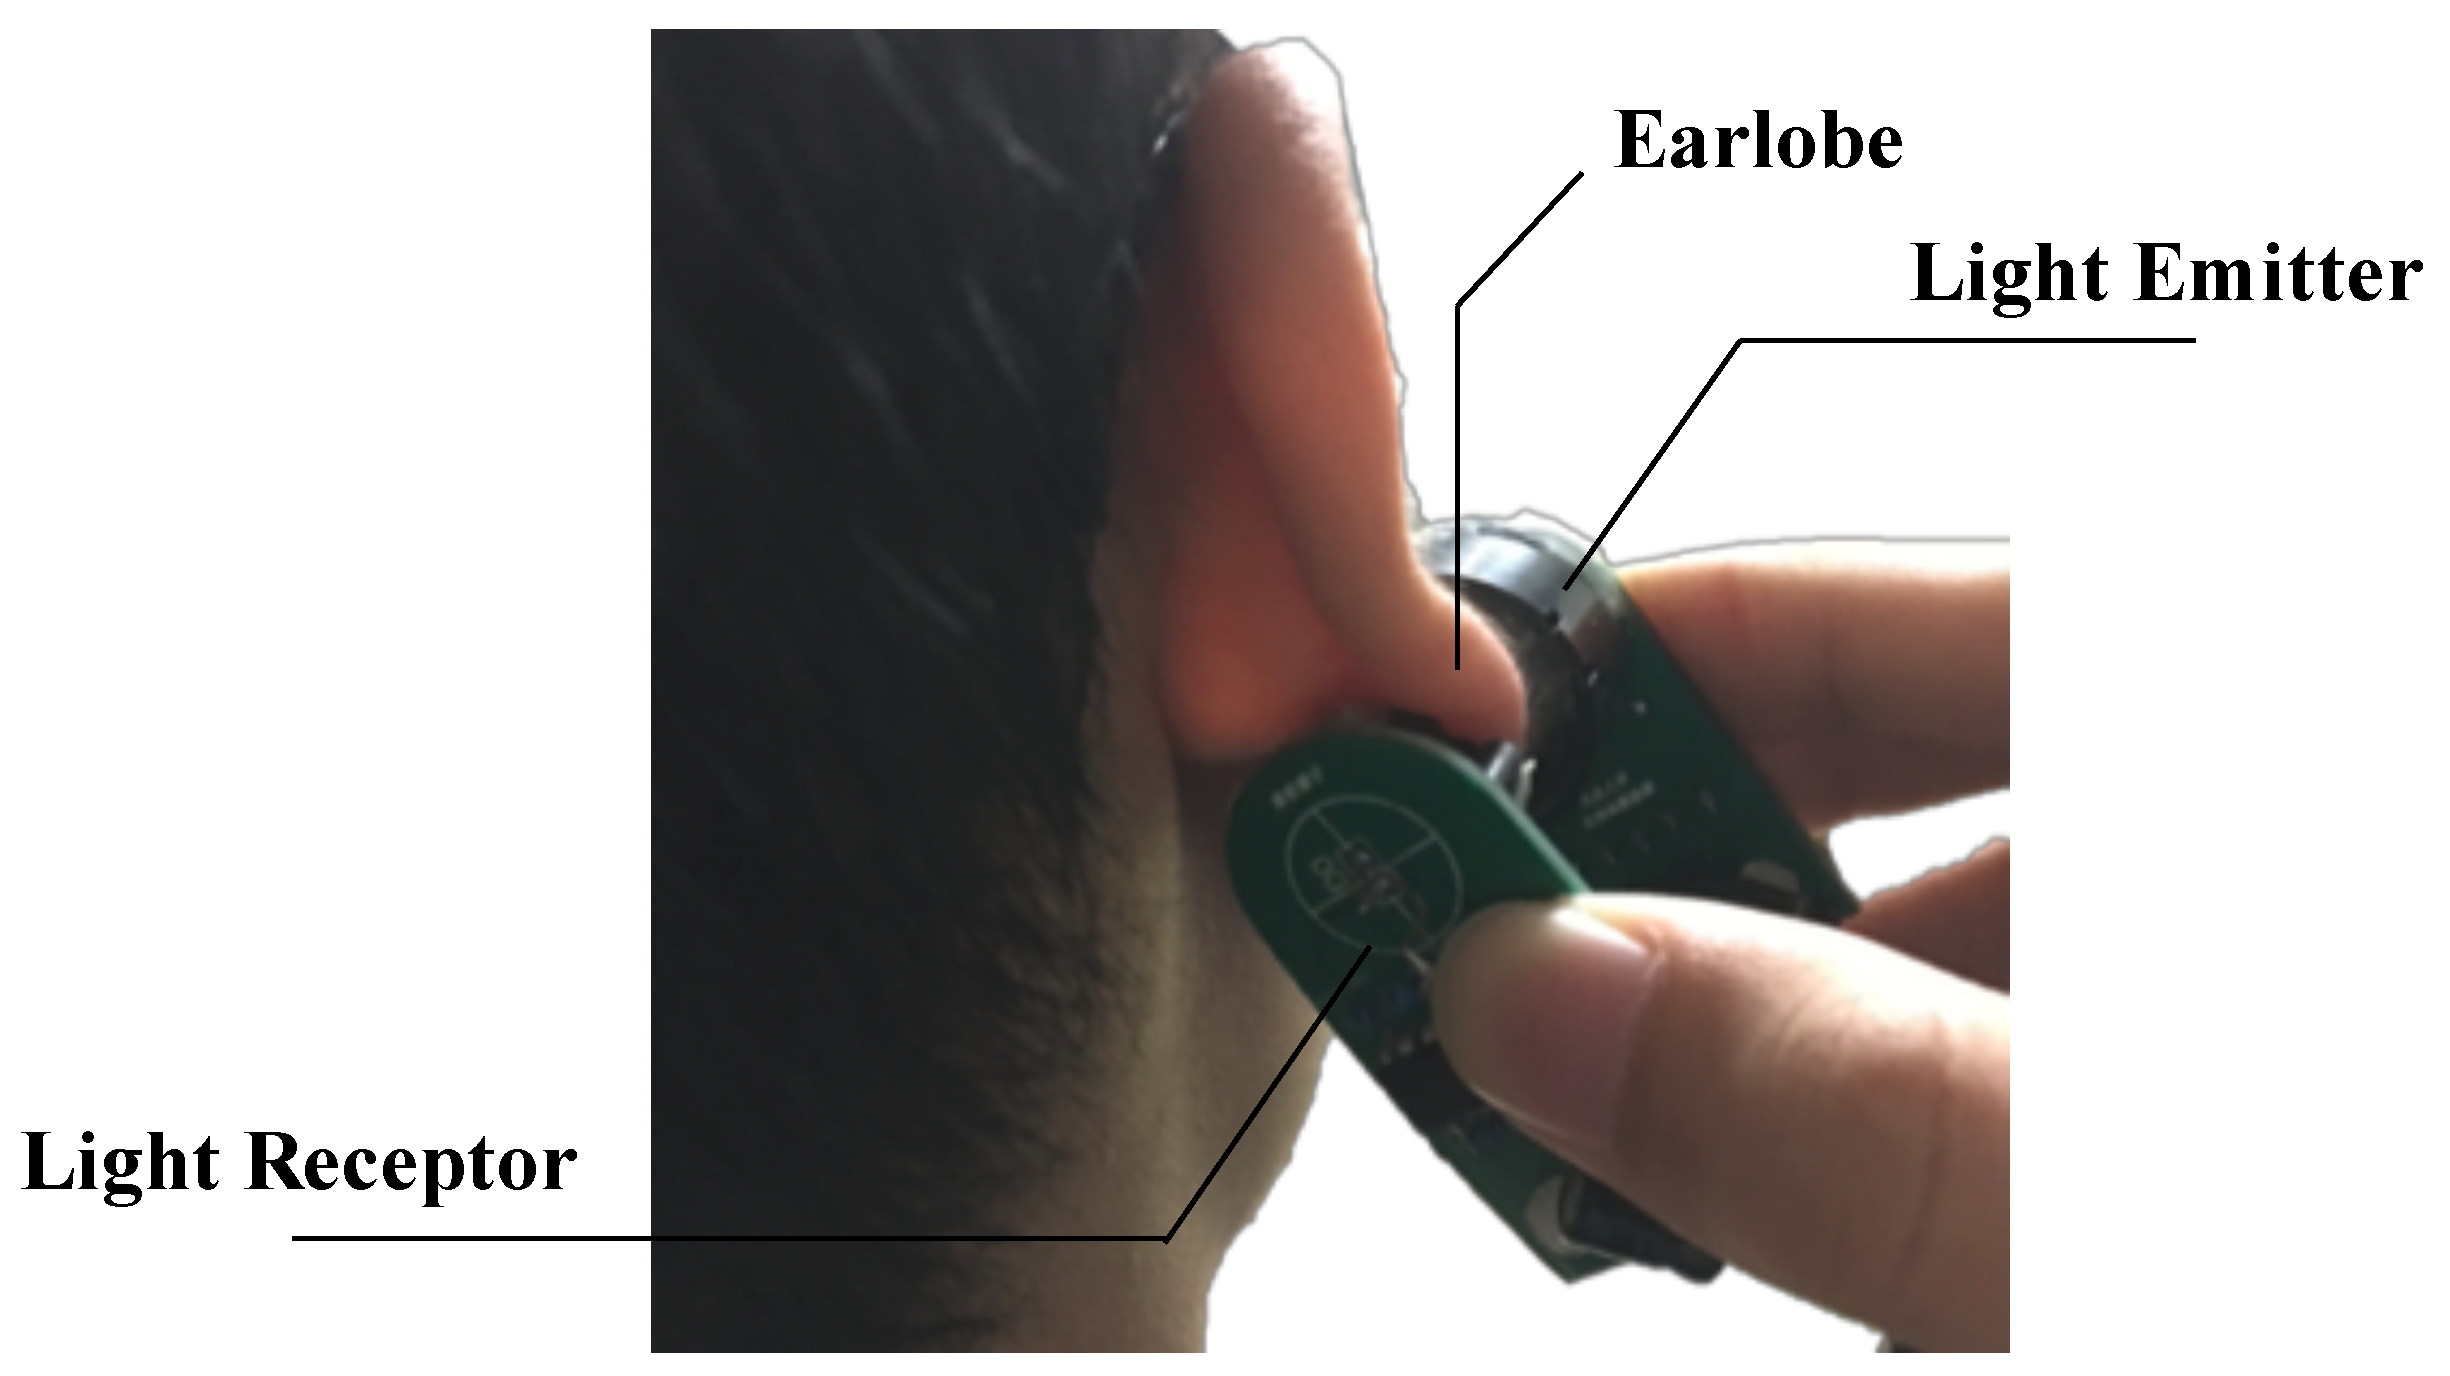
The demonstration of using the prototype of blood glucose sensor is showed in
Figure 3. Using this prototype, the data of absorbance can be collected, and the algorithm to estimate the blood glucose concentration will be presented in
Section 5.
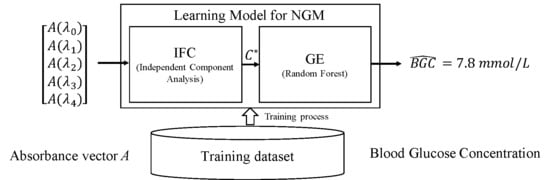
5. Algorithm of NGM
This section will introduce the algorithm to build an Independent Feature Converter (IFC) and a Glucose Estimator (GE) that can be used to calculate the Blood Glucose Concentration (BGC) from the absorbance data collected by the sensor presented in
Section 4. The process for parameter adjustment of IFC and GE is called training process, which needs a set of training sample data set that include six attributes, five absorbance attributes and one reference BGC attribute. The schematic diagram of this algorithm is showed in
Figure 4.
5.1. Independent Feature Converter
IFC is used to transform absorbance vector
A to independent components concentration vector
. According to Equation (
5), any component concentration can be nearly calculated by multiplication of the inverse of coefficient matrix
with absorbance vector
A. The key is determining the coefficient matrix
that is hard to measure and, to some extent, varies from person to person. Although
cannot be determined accurately, the approximate matrix can be figured out by Independent Component Analysis (ICA) [
17] based on the training data set.
ICA is an effective liner-transformation algorithm in multivariate and linear algebra where a matrix is factorized into two matrices, with the property that can extract independent components from a complex data matrix [
17]. These independent components make the resulting matrices easier to inspect. In this paper, the two resulting matrices represent independent feature matrix
F and coefficient matrix
respectively. The algorithm of ICA in this paper is called fast fixed-point algorithm [
27], which uses maximum entropy to determine factorized results.
In the ICA, there is a basic premise that all the component concentrations are independent. This premise is not very strong, thus making some errors in BGC estimating, but the premise is very useful and the error can be compensated by the following GE.
First, we get an absorbance data matrix
T from the training dataset, as
where
means the transpose of the absorbance vector for the
i-th record in training dataset. Based on Equation (
5), the matrix
T can be factorized to
F and
where
means the transpose of concentration vector, and
is the
j-th component concentration of the
i-th record.
F is called independent feature matrix which is immeasurable. Matrix
is the same coefficient matrix in Equation (
5).
Since the physical significance of the decomposition of matrix
T has been elucidated, let us start discussing how to decompose the matrix
T. The principle of decomposition is to make matrix
F contain as much information as possible. Considering
A and
C as random variables, matrix
F contains the most information when random variable
C obeys a Gaussian distribution according to the information theory. But [
17] has pointed out that the signal analyzed by ICA cannot be subject to a Gaussian distribution and has proposed an alternative—the sigmoid function. Let
C subject to a distribution whose probability density function (PDF) is the first order derivative of sigmoid function, as
where
is the PDF of vector
C and
is first order derivative of the Gaussian distribution function.
Combining Equations (
5) and (
11), the PDF of vector is
and then the coefficient matrix
is estimated by means of maximum likelihood estimation (MLE). The likelihood function is
where
is the
j-th row of
. Using Adam method [
28], the approximation of maximum point
can be obtained. Adam is an algorithm for first-order gradient-based optimization of stochastic objective functions, based on adaptive estimates of lower-order moments. Adam is well suited for optimization problems that are large in terms of data parameters. The iterative formulas are
where
is the gradient of
and
t is the number of iterations.
m and
v are the first and second momentum, which are initialized at zero, and
and
are the momentum parameters ranging from 0 to 1.
is iteration step which is known as learning rate.
and
are bias corrections that are only relevant in first few iterations when
t is small. The bias correction compensates for the fact that
m and
v are initialized at zero and need some time to “warm up”.
Calculating by directly using all of T data requires much computing and memory resource. In practice, we randomly select a mini subset of T to calculate the gradient of at each iteration. This strategy is called mini-batch strategy, and the length of mini subset is called batch size. The pseudo-code of ICA based on Adam and mini-batch is in Algorithm 1.
| Algorithm 1 ICA based on Adam and Mini-batch |
- Require:
T, , , , and - Ensure:
- 1:
Initialize the matrix randomly. - 2:
, - 3:
, - 4:
fordo - 5:
Randomly select a subset of size from T - 6:
Calculate the gradient of - 7:
- 8:
- 9:
- 10:
- 11:
- 12:
if then - 13:
- 14:
- 15:
end if - 16:
end for - 17:
return
|
The IFC based on ICA, referred to by use of matrix
, has been built, and the absorbance vector
A can be transformed to independent components concentration vector
C by Equation (
15)
5.2. Glucose Estimator
The function of GE is to estimate BGC by reducing the errors and differences between the independent component concentration vector and the true components concentration vector C. These errors and differences are cased by the weak premise made in ICF, inaccurate measuring and any other unexpected factors. The input and output of GE are and BGC respectively. Because of some unknown factors, the transform process becomes a black-box process that can only be modeled by a machine learning model, such as Random Forest (RF), Adaboost, support vectors machine (SVM), decision tree (DT), etc. Plus, Deep Learning would also seem to be a good choice, but that requires thousands of training data, which is hard to get in our project at present.
By comparison (see
Table 2), we use random forest (RF) to model the transform process in GE in this paper. Random forest is an ensemble learning method for classification and regression by constructing a multitude of decision trees [
18]. As other supervised model, RF needs a training data set to adjust parameters, and then RF can be used to estimate BGM from
. The estimating value of RF is mean estimating value of the individual trees. The training data set contains a set of
vectors that are transformed from data matrix
T by IFC and a set of reference BGC data acquired by invasive glucose meter.
There are two reasons why we choose RF to model GE. The first reason is that ICF is based on maximizing entropy of
, which has the same optimization goal with RF. Secondly, comparing with other machine learning models in
Table 2, its accuracy is proved. Through cross-validation, the number and depth of RF is set to 200 and 2, and the aggregating method is averaging the predictions of all tress in forests. Let Equation (
16) represent GE.
In summary, the IFC and GE have been built and represented by Equations (
15) and (
16), which can estimate BGC from absorbance vector
A acquired via the prototype designed in
Section 4.
6. Experiment and Results
After producing the prototype, a series of clinical trials have been performed to verify the accuracy of the non-invasive glucose meter. This section is divided into two parts, which are data acquisition and experimental results. The former introduces how to gather experimental data from subjects, while the latter introduces how to prove the accuracy of the non-invasive glucose meter through the data gathered from subjects.
6.1. Data Acquisition
The purpose of data acquisition is to obtain a training dataset and a testing dataset, for ease of training the algorithm through these datasets and testing the accuracy of blood glucose estimation. For data gathering, each record includes nine attributes, of which the first one is the record’s ID, and the second to the sixth gathering from our prototype are absorbance data of earlobe at each wavelength of 490 nm, 660 nm, 730 nm, 850 nm, and 930 nm. The seventh is blood glucose concentration for reference which is collected by a standard invasive glucose meter. The eighth attribute is the name of subject, and the ninth and tenth are date and time of the collection.
The data acquisition experiment is performed during September of the year 2017 from 1st to 15st. There are six yellow race adult subjects participating in the experiment, among them we have five diabetic patients and one healthy individual. The characteristics of each subjects are presented in
Table 3. The prototype designed in this paper and a
invasive glucose meter are adopted as data acquire equipment. We obtain blood glucose data from each subject five times a day, which happened at morning on an empty stomach, 2 h after breakfast, right before lunch, 2 h after lunch, and right before dinner. During the data acquisition process, due to personal reasons of some subjects, such as physical examination, outing, etc., blood glucose measurement cannot be performed at the specified time, resulting in some data missing. In addition, we have excluded some abnormal data due to hardware reasons, such as signal loss, signal anomalies, etc. Finally, 286 valid records are received after eliminating unmeasurable or invalid data. Among these records, 84 records that are rather complete come from a subject on focus tracking who is labeled as subject #1, while the remaining 202 records come from the other five subjects who are labeled as subject #2 to subject #6.
6.2. Experiment Results
This paper has carried on four test experiments to verify the performance of NGM with the data acquired in
Section 6.1. The first experiment called accuracy experiment is designed for accuracy testing. The second experiment called convergence experiment is used to determine the convergence speed of the NGM algorithm and the minimum number of samples for training. Through the third transplant experiment, we try to test whether this NGM can be directly transplanted to use for another person. The gauge of the performance of NGM are Clarke Error Grid Analysis (EGA) and the correlation coefficient for estimation and reference BGC formulated as
where
is the correlation coefficient,
and
c are estimation and reference BGC vector respectively, and
n is the length of BGC vector.
EGA is designed to quantify clinical accuracy of blood glucose estimates generated by meters as compared to a reference value [
19]. The grid breaks down a scatterplot of a reference glucose meter and an evaluated glucose meter into five regions. The meanings of each region are listed in
Table 4.
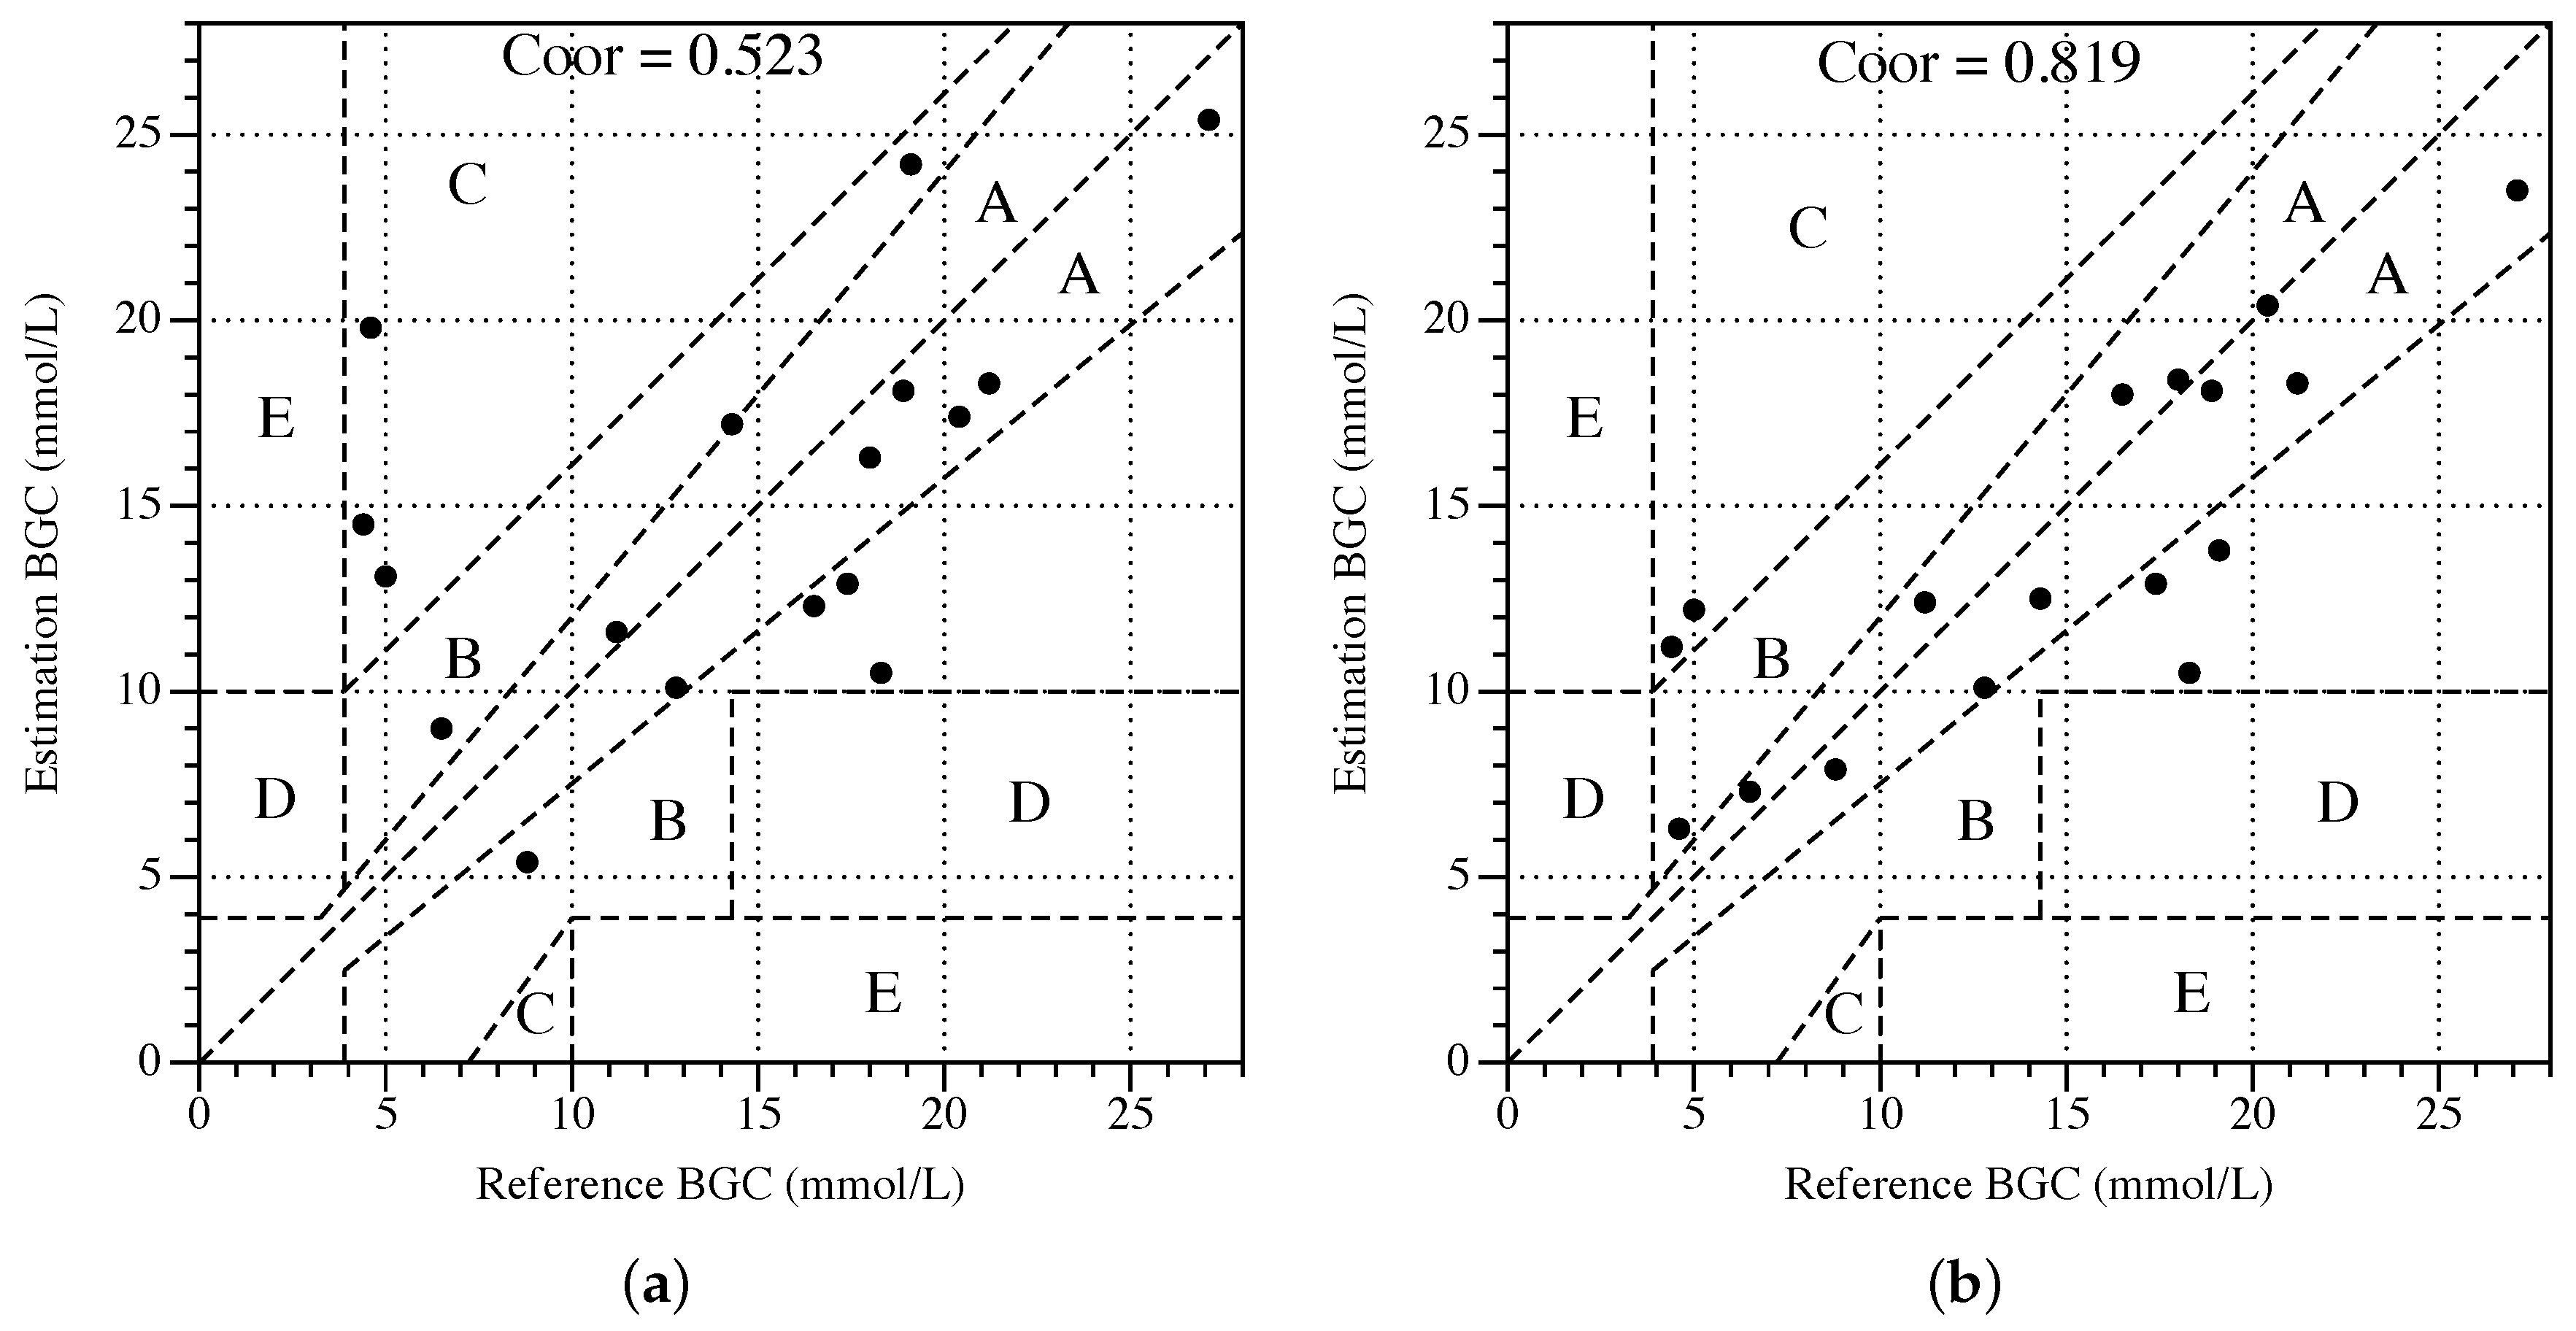
6.2.1. Accuracy Experiment
We randomly select 80% samples from the dataset acquired from subject #1 as training dataset, and the other 20% is used as testing dataset. There are three steps in the accuracy experiment. Step1: Training the algorithm through the training dataset. Step2: Estimating BGC value through the obtained algorithm. Step3: Calculate the correlation coefficient for estimation and reference of BGC, and then draw the Clarke Error Grid. After this experiment, the correlation coefficient
of Random Forest with ICA equals to 0.819, and the Clarke Error Grid is shown as
Figure 5b, which places 88.2% of points in regions A or B, 11.8% in region C, and no point in regions D or E. For comparison, the results of the Random Forest without ICA are shown in the
Figure 5a. It can be concluded that ICA helps to improve the accuracy of Random Forest.
6.2.2. Convergence Experiment
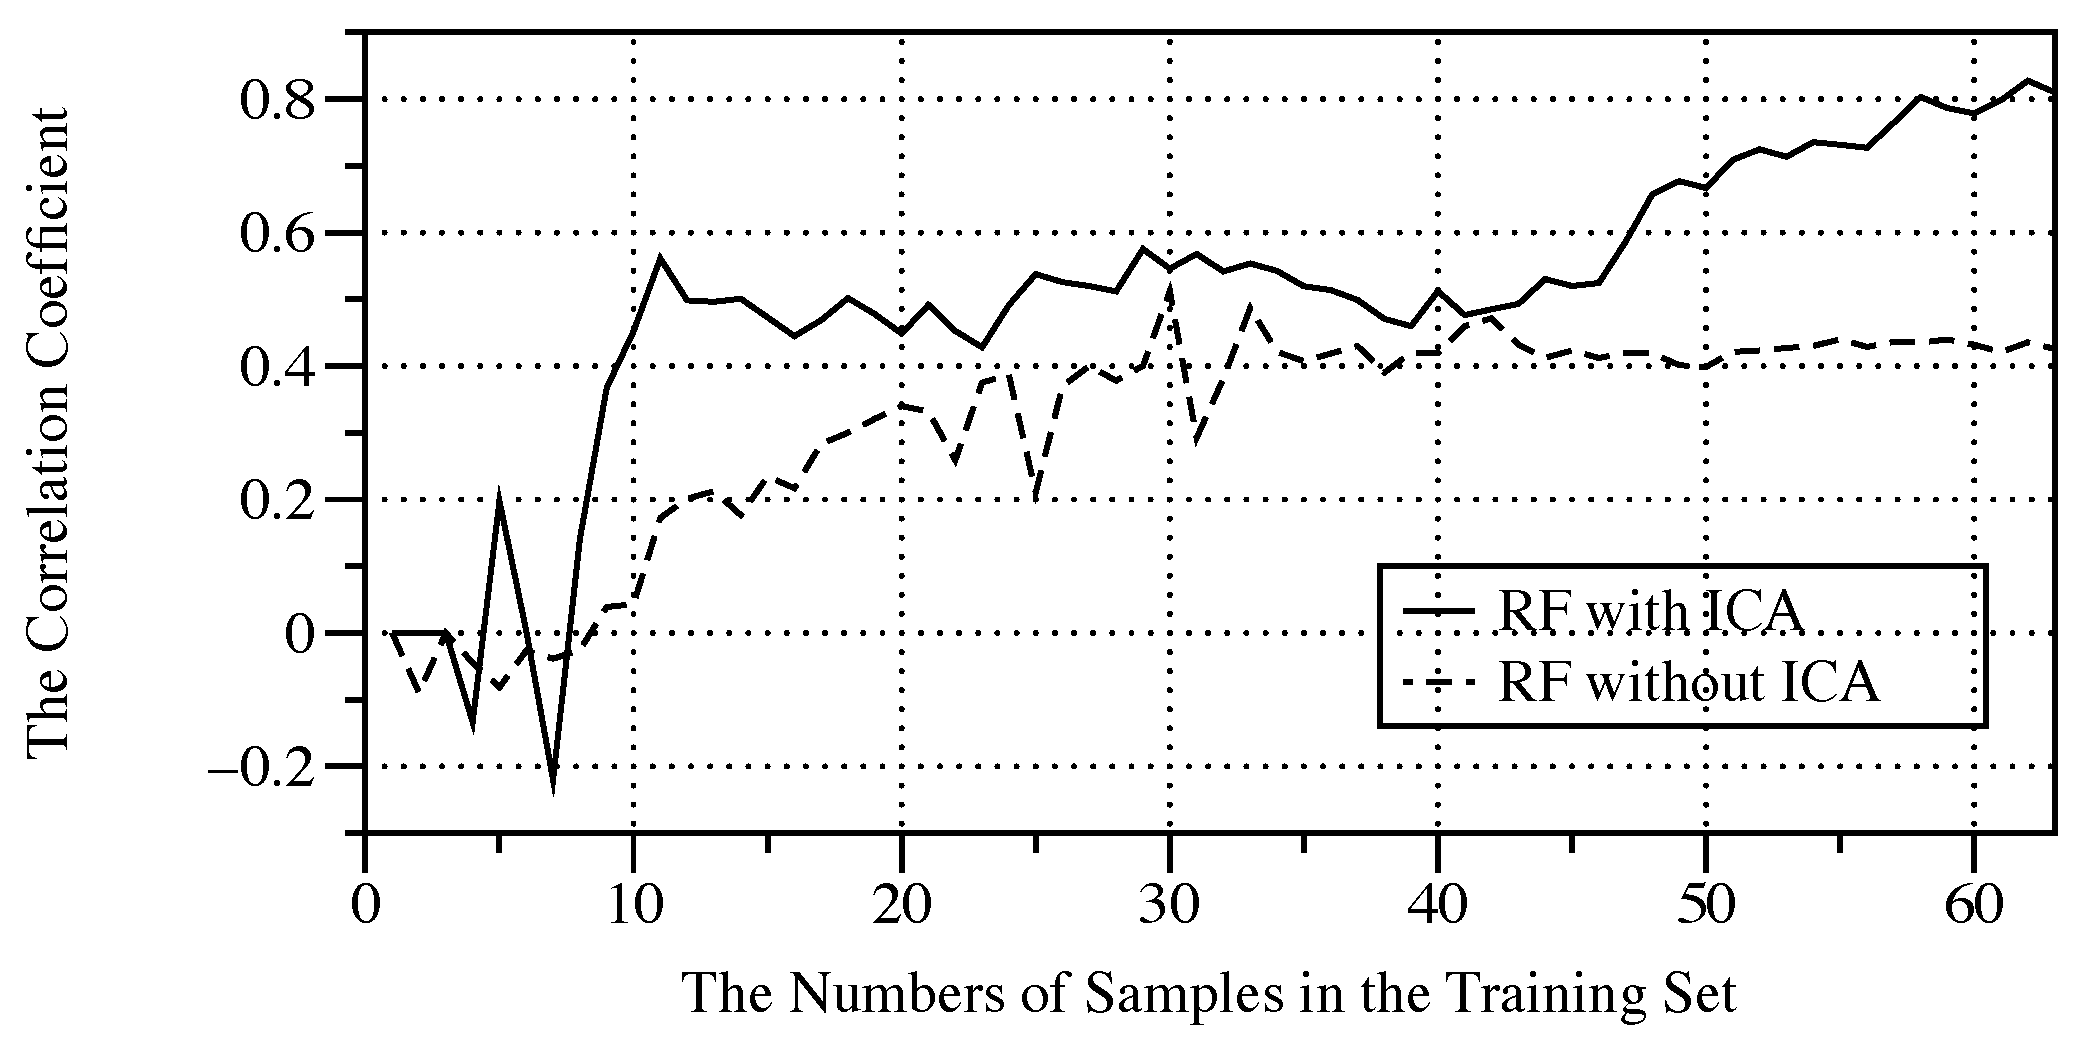
We are particularly interested in finding how the size of training dataset affects the algorithm performance, because the size is related to how soon a good model can be built for a patient once he/she starts using our Earlight device. For this purpose, we construct a series of training datasets of different sizes, and use these training datasets to train the algorithm while recording the correlation coefficient in testing dataset. The relationship between the correlation coefficient and the number of samples in the training dataset is shown in
Figure 6.
From
Figure 6, we find that the correlation coefficient reaches 0.5 rapidly where the number of samples is merely 10, and finally tend to a steady value of 0.80 where the number of samples is close to 60. This experiment result proves the convergence of the algorithm. In other words, the NGM system in this paper can partially complete the parameters adjustment after 10 times of training by a standard blood glucose meter, and reaches to a high accuracy estimation state after 60 times of training. Similarly, as a comparison, we also did a convergence experiment on RF wihout ICA, and the experimental results are shown with dotted line in the
Figure 6. As can be seen, without the help of ICA, the convergence speed of RF is significantly reduced.
6.2.3. Comparative Experiment
To select regression method for glucose estimating is a critical but difficult work, which can only be accomplished contrasts of various methods through experiments. Before we chose the RF as glucose estimator (GE), a comparative test of RF [
18], Adaboost [
30], kNN [
31], SVM [
33], and Decision Tree (DT) [
32] for glucose estimating has been conducted. This experiment is designed for two causes which are to compare performances of different regression methods and to analyze the performance of ICA.
The comparative experiment consists of two parts. The first part is about the selection of the optimal parameters for each regression method. Since the performance of regression method depends on the parameters directly, to make sure the experimental results can represent its peak performance, it is of great importance to select a best group of parameters for regression method before conducting the comparative test. In this paper, we use 5-fold cross-validation to select best parameters for each regression method [
34]. First, select a group of parameters for cross-validation. Secondly, use cross-validation to test the accuracy of this group of parameters. In 5-fold cross-validation, the original training data set is randomly partitioned into 5 equal sized subsamples. Of the 5 subsamples, a single subsample is retained as the validation data for testing the model, and the remaining 4 subsamples are used as training data. The cross-validation process is then repeated 5 times, with each of the 5 subsamples used exactly once as the validation data. The 5 results from the folds can then be averaged to produce a single accuracy (correlation coefficient,
) that can be used as the accuracy of this group of parameters. Thirdly, try some other groups of parameters and test their accuracy. Finally, select the group of parameters that has the highest accuracy as the best group of parameters to conduct the next part of the experiment. Column 3 in
Table 2 has listed the best parameters settings of different regression methods. All these methods are realized by the scikit-learn [
29], which is a Python machine learning program package.
The second part of the comparative experiments, like accuracy and convergence experiments, is designed to compare the accuracy of different regression methods with or without ICA. First, randomly select 80% of samples from the dataset acquired from subject #1 as training dataset, and the other 20% of samples is used as testing dataset. Secondly, training various regression methods with the best parameters acquired from the first part of this experiment. Thirdly, calculate the accuracy (
) as the same way in accuracy experiment. Finally, draw the convergence curves of different models. In
Table 2, column 4 has listed the best
of different regression methods, and their required number of samples in the training set that can make
reach to 0.5 and the best are listed in column 5 and 6 respectively. It can be noted that using RF with ICA model, it takes 60 times to train the algorithm to achieve an accuracy of
, which means that each patient should prick himself/herself 60 times to inform the algorithm with his/her 60 blood concentration levels before performing non-invasive measurements. Still, this is twice as fast as
’s 100 times of training.
As is presented in
Table 2, it is safe to say that RF shows a better performance than other regression methods. Although RF does not seem to have a fast convergence speed as Adaboost do, it does show a better convergence stability and a higher accuracy than Adaboost can provide. Since kNN and DT both put up a much lower accuracy comparing with RF, they can be ruled out of consideration. For glucose estimating, SVM represents a quite terrible performance, of which the possible reason is that we have not found out a proper kernel function.
As can be seen from
Table 2, ICA has some positive effect on the accuracy and convergence speed of three regression methods which are RF, Adaboost, and DT. The reason of this phenomenon is that ICA is to be equivalent to introduce prior knowledge of blood glucose measurement into regression methods. Thanks to ICA, convergence speed of these algorithms have been improved, which make sure a higher accuracy with less amount of training samples. This kind of improvement is of great importance to NGM. In addition, all the three regression methods of RF, Adaboost, and DT are based on maximum entropy which ICA also sees as the objective of decomposition, therefore ICA is helpful to enhance the accuracy of these three regression methods. As for kNN, ICA does not do any good for improving its convergence speed or accuracy as imagined, on the contrary, it brings a negative effect. It is because that kNN is a regression method based on Euclidean distance, while ICA decomposition simply transfer from one space to another, which not only does no help but also brings in more uncertainties when it comes to distance calculation.
In conclusion, RF [
18] combined with ICA shows the best performance, therefore this kind of combination has been chosen for the NGM in this paper.
6.2.4. Transplant Experiment
In the transplant experiment, we try to use the algorithm trained through the dataset acquired from subject #1 to estimate the BGC of other five subjects. The correlation coefficient turns out to be 0.153, 0.021, −0.172, 0.017, and −0.221. These results are not as ideal as expected which proves that the individually-tailored algorithm cannot be transplant to others for use. Meanwhile, this experiment result indicates the great influence of individual discrepancies on optical glucose measurement. To overcome the effect of individual differences, it is necessary to have a personal customized NGM, but that is almost never the case. Although the NGM proposed in this paper cannot be transplant to others for use directly, it can be transplant after a brief learning process to readjust parameters.
6.3. Comparision with other NGMs
NGM is a hotspot in the field of glucose detecting nowadays. So far, a large amount of NGM methods have been proposed, among them some have achieved a pretty high accuracy, however most of these methods are lab-only with unsolved issues of transition and popularization. The limitations of these methods themselves lead to this awkward situation, since all the methods require support from large amount of sophisticated instruments at high expenses with complex operation procedures and strict experimental conditions. A comparison on input, accuracy, hardware cost and condition requirement of the methods proposed in this paper and three other recently published methods is listed in
Table 5.
Different measurement methods have different levels of accuracy. Among them, some have a lower accuracy but a higher practicability. The quality of a method is not only judged by accuracy, instead more indicators should be taken into consideration when it comes to a comprehensive evaluation. As demonstrated by these experiments, the method proposed in this paper not only has a preferable accuracy, but also has the advantages of low cost and good robustness. In a word, our method shows an excellent comprehensive performance.
7. Conclusions and Future Works
In this paper, a non-invasive blood glucose meter based on multi-wavelength absorbance is studied. To deal with the individual discrepancies (IDs), a learning algorithm has been proposed, along with a device prototype. The experiments demonstrate that the correlation coefficient between measuring results of the prototype and an invasive glucose meter can reach 0.5 after merely 10 times of parameters correction, not to mention that after 60 times of correction the correlation coefficient rises to 0.80, which means that if you measure blood glucose 7 times a day, it only takes about 8 days to perform invasive calibrations, and then you can perform non-invasive measurement. This kind of glucose meter is able to reduce the effect of IDs in optical measurement method. In other words, in order to eliminate the impact of IDs, the model parameters of this type of learning glucose meter are individually customized. This type of glucose meter also has a shortcoming, i.e., it cannot be used interchangeably, since the parameters of a meter are adjusted through an individual training dataset. Compared with other NGM methods which require high-precision instruments, this learning non-invasive glucose meter has a lower hardware cost at only about $50, which will lead to a higher market prospect. In summary, the main contributions of this paper are as follows:
We have conducted a survey on the FDA or CE certified mini-invasive or non-invasive glucose meters currently available on the market;
For non-invasive blood glucose modeling, we propose a learning model framework, including an independent feature converter (IFC) and a glucose estimator (GE);
Based on our model, we designed a prototype of a non-invasive blood glucose meter, and collected real-world data with it;
Through experimental verification, we found that the combination of ICA and RF has the highest accuracy for estimating blood glucose concentration, and ICA helps to speed up the convergence of the model;
We confirmed the existence of individual discrepancies in NGM through the transplant experiment, and verified that the glucose meters based on a learning model cannot be used interchangeably.
This paper is only a preliminary/exploratory study of non-invasive blood glucose measurement techniques due to the efficiency and performance of our device and algorithm were evaluated on only 6 subjects. In the future, we will improve our equipment design and conduct clinical trails with more subjects and longer durations. The technologies of NGM has been developing rapidly in recent years, but most of them are in the lab-only stage, and there is still a long way to go for clinical use.


