Evaluation of Design Parameters on Drying of Kiwi Fruit


Abstract
:1. Introduction
2. Experimental Study
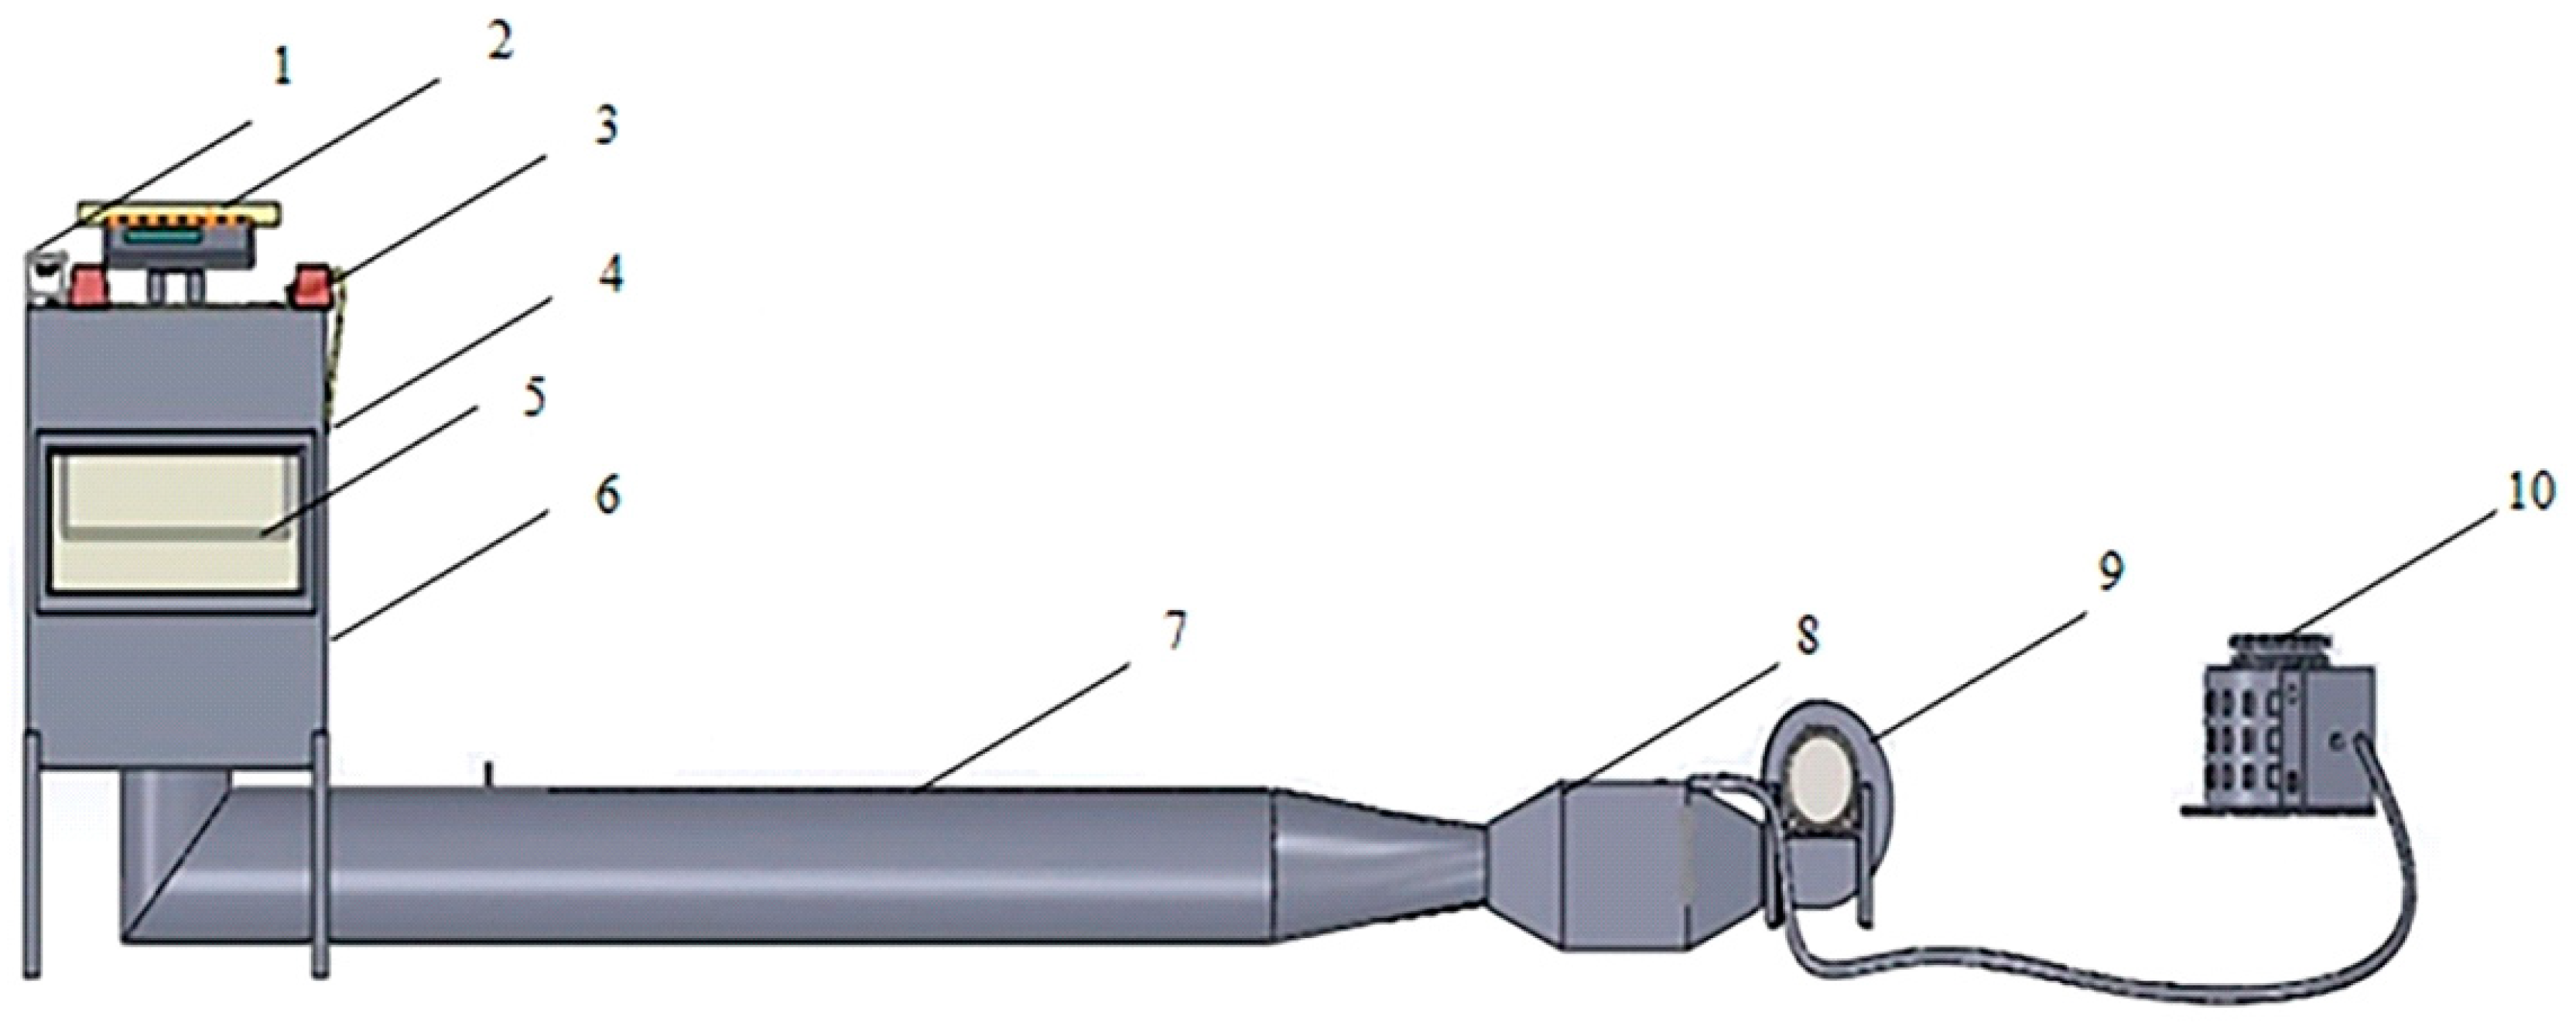
2.1. Setup
2.2. Data Reduction
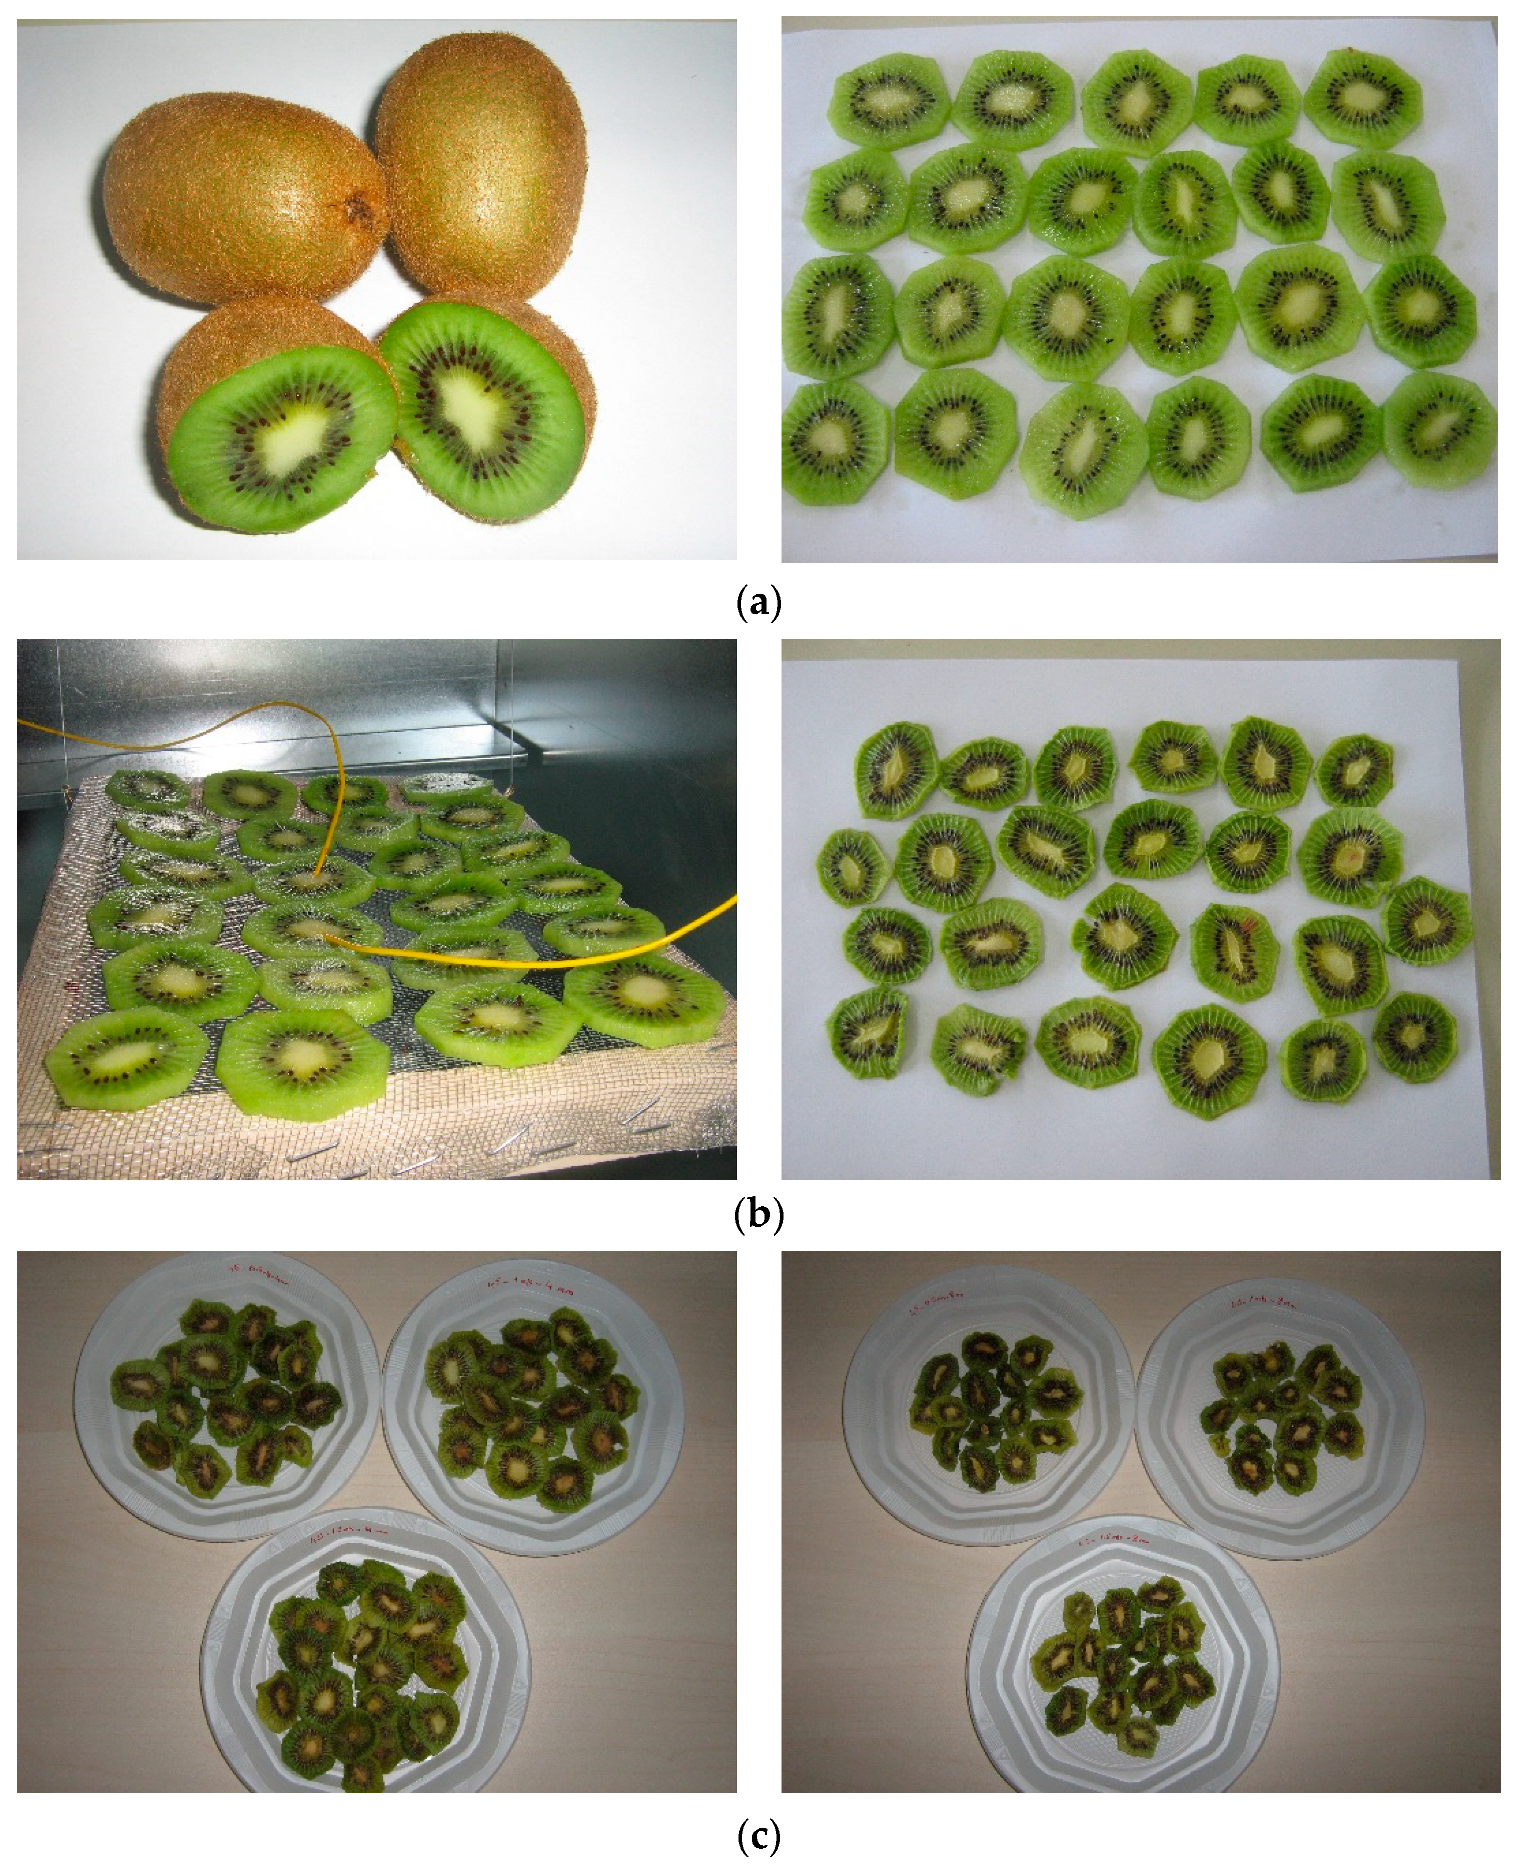
2.3. Material and Methods
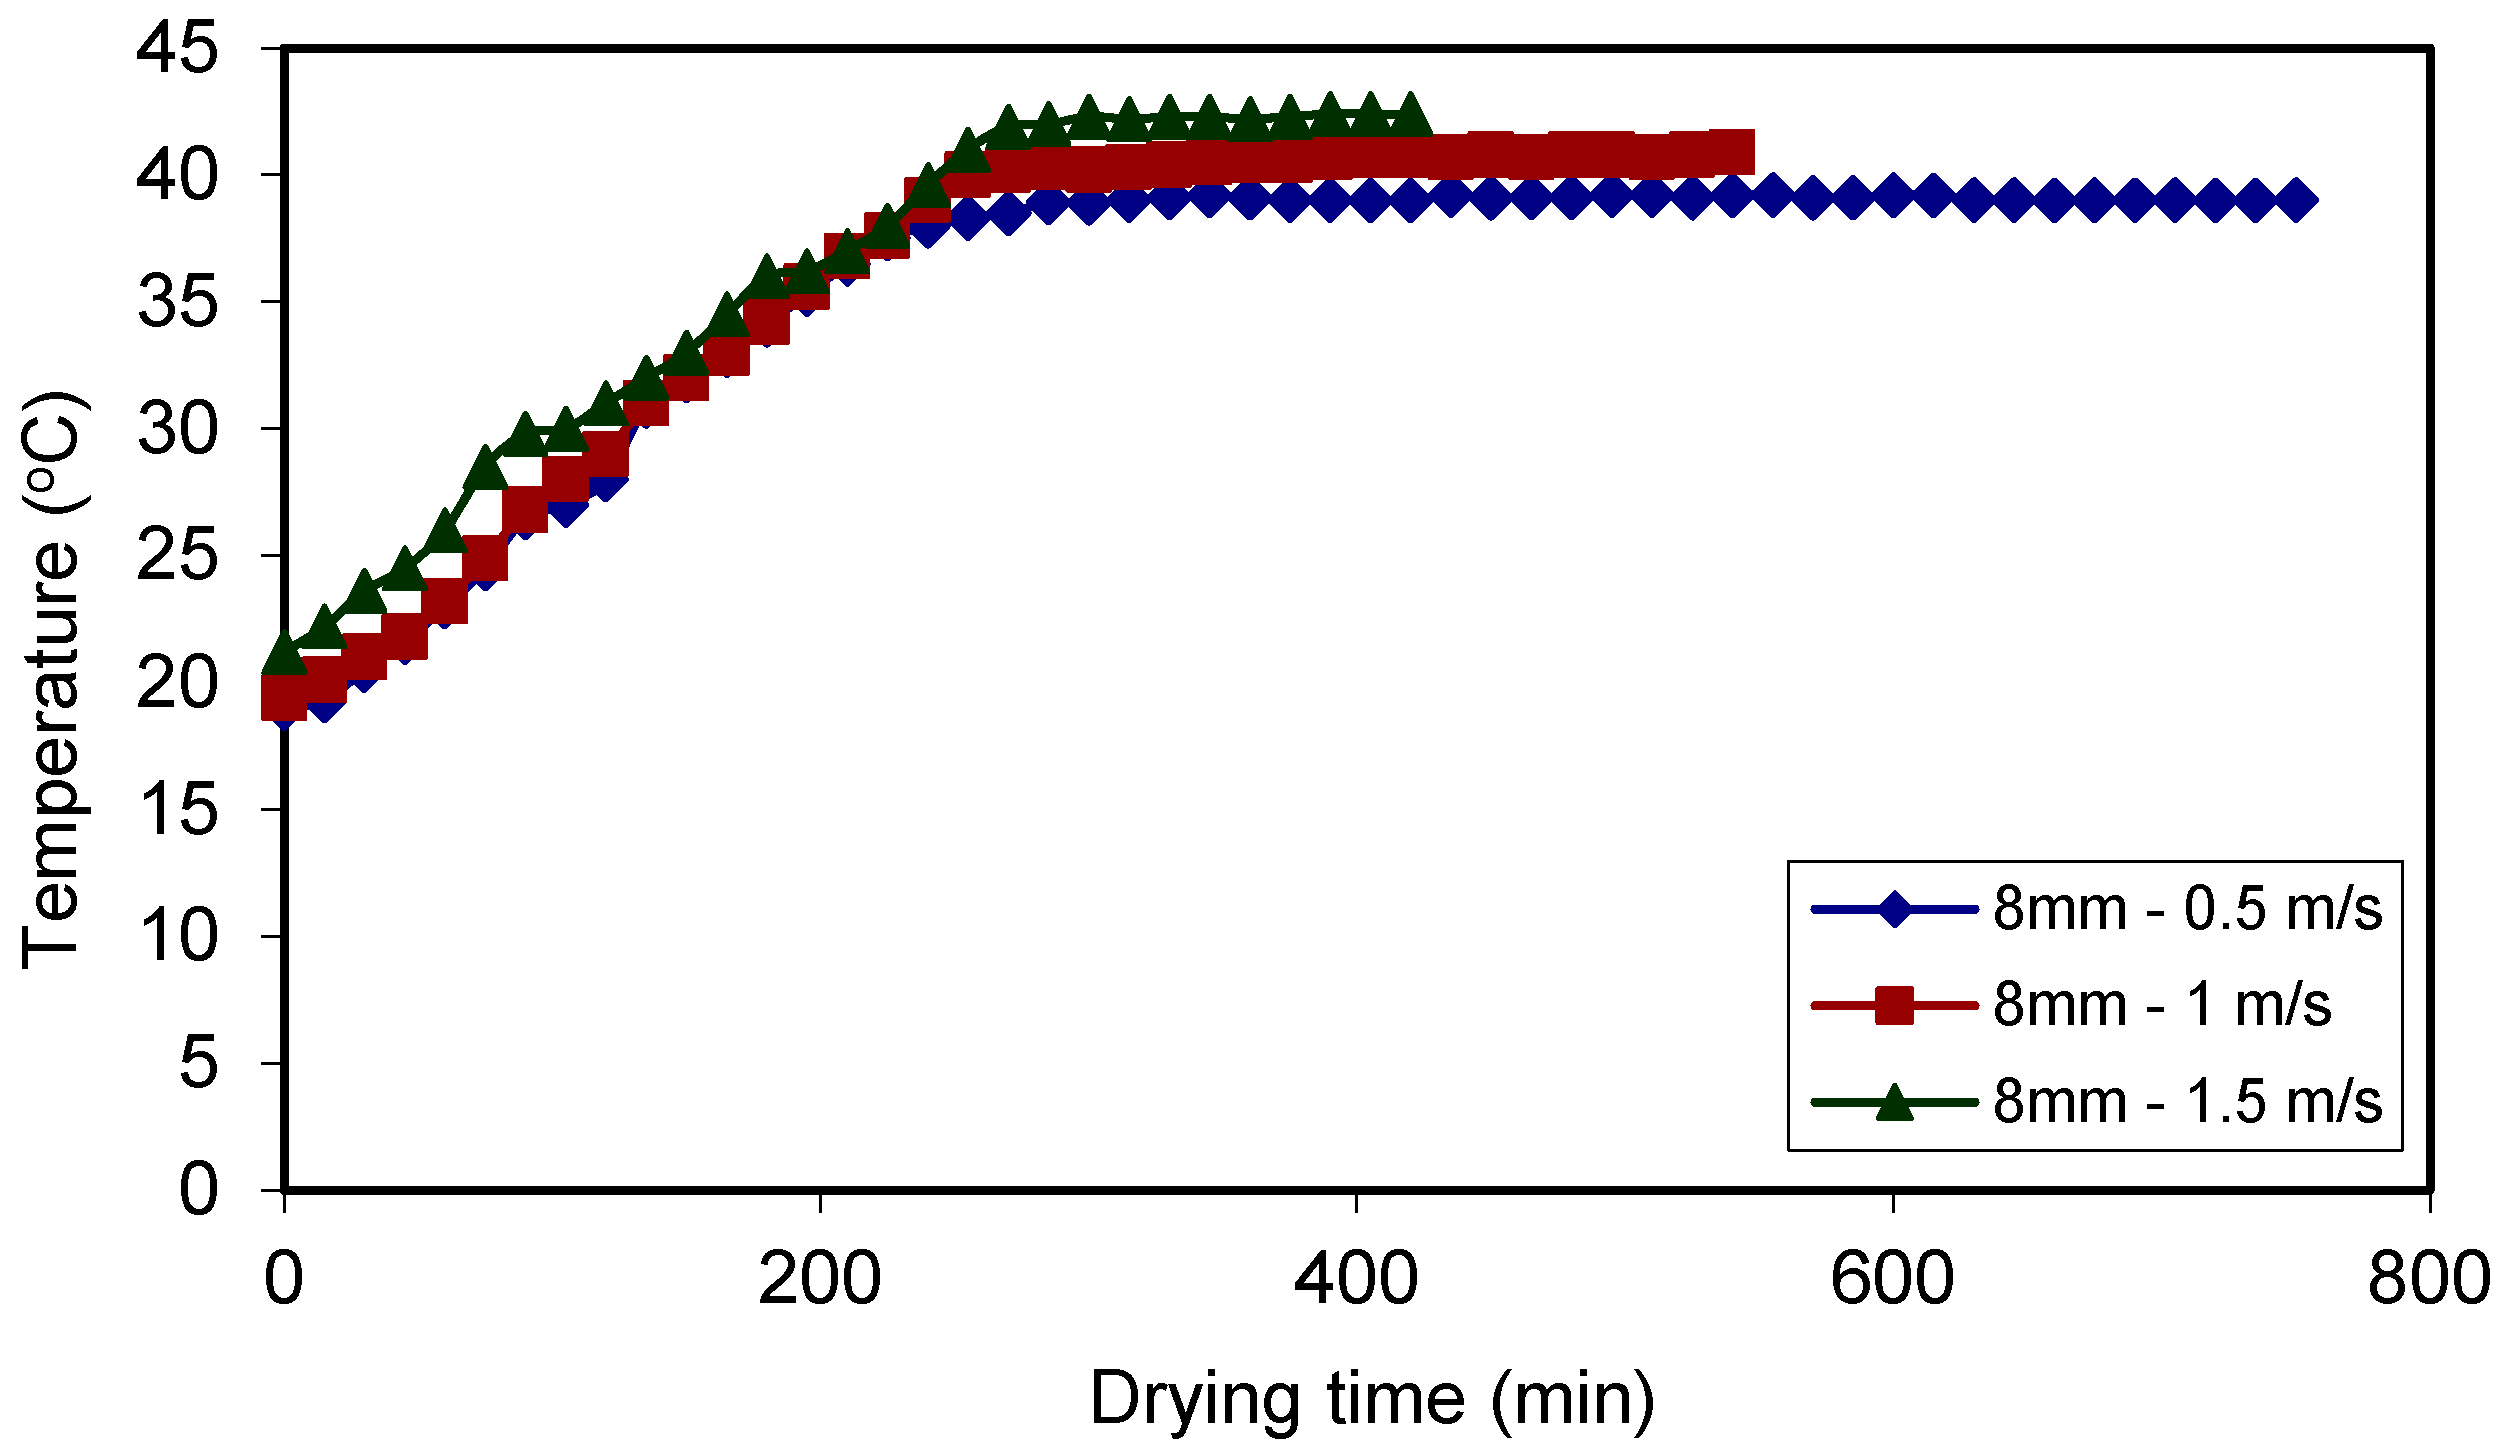
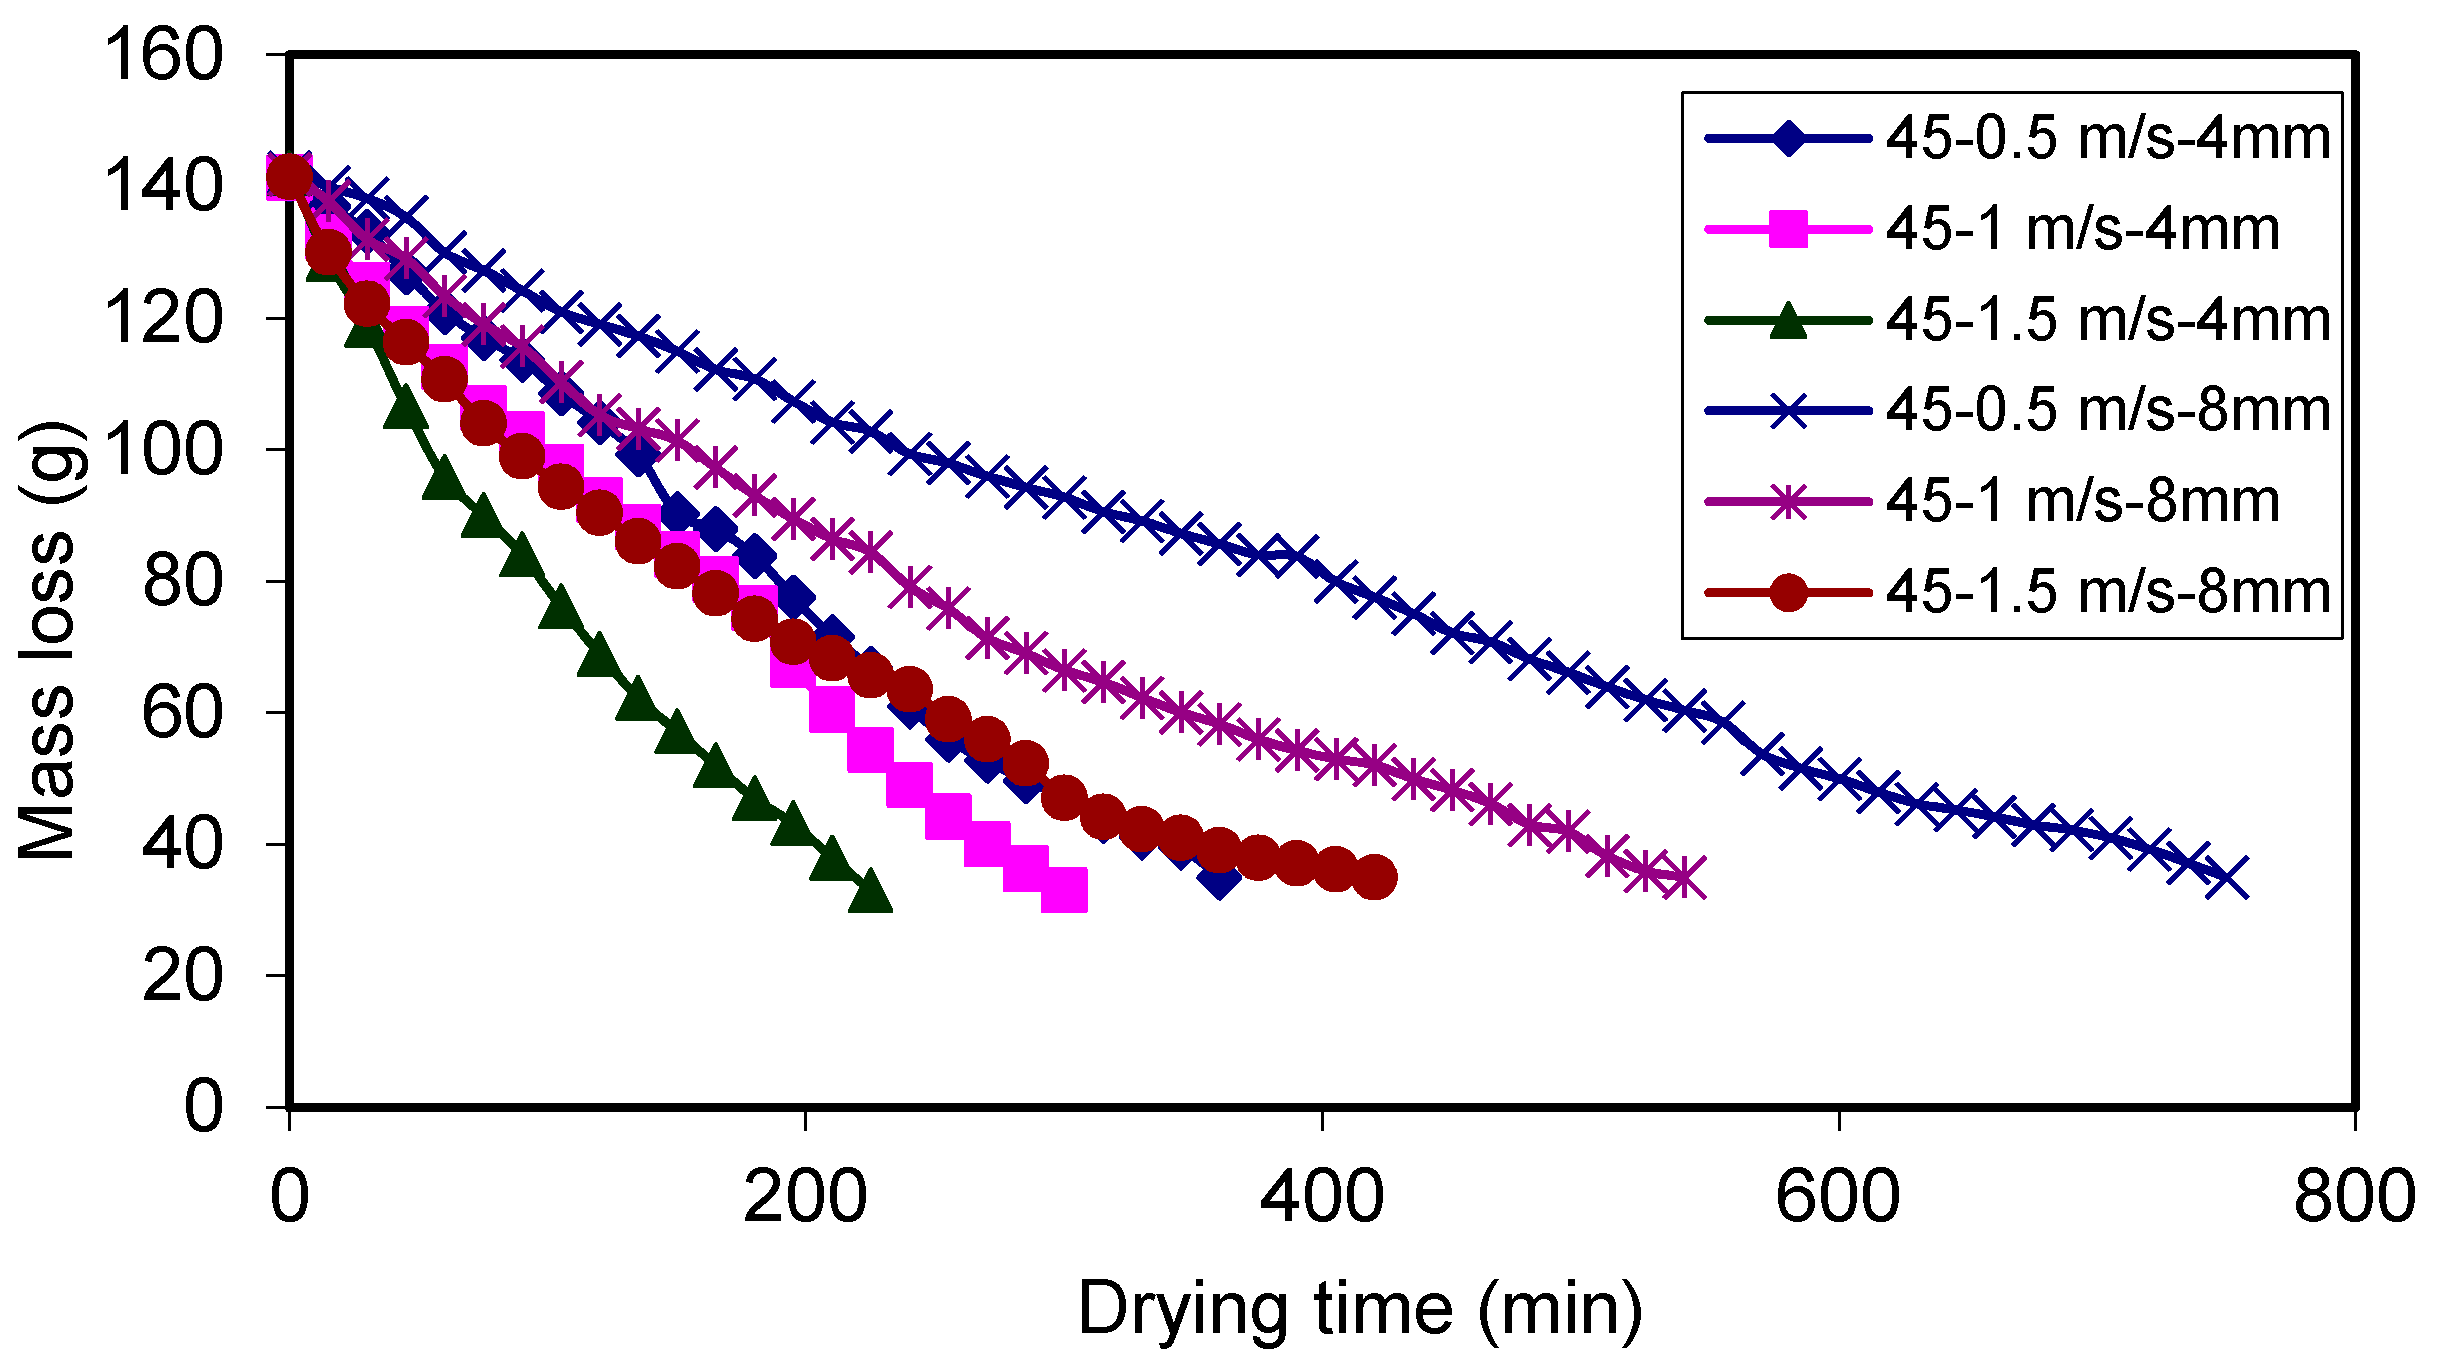
3. Results and Discussions
3.1. Results of Experiments
3.2. Design Analysis and Analysis of Variance (ANOVA)
4. Conclusions and Recommendations
- ✓
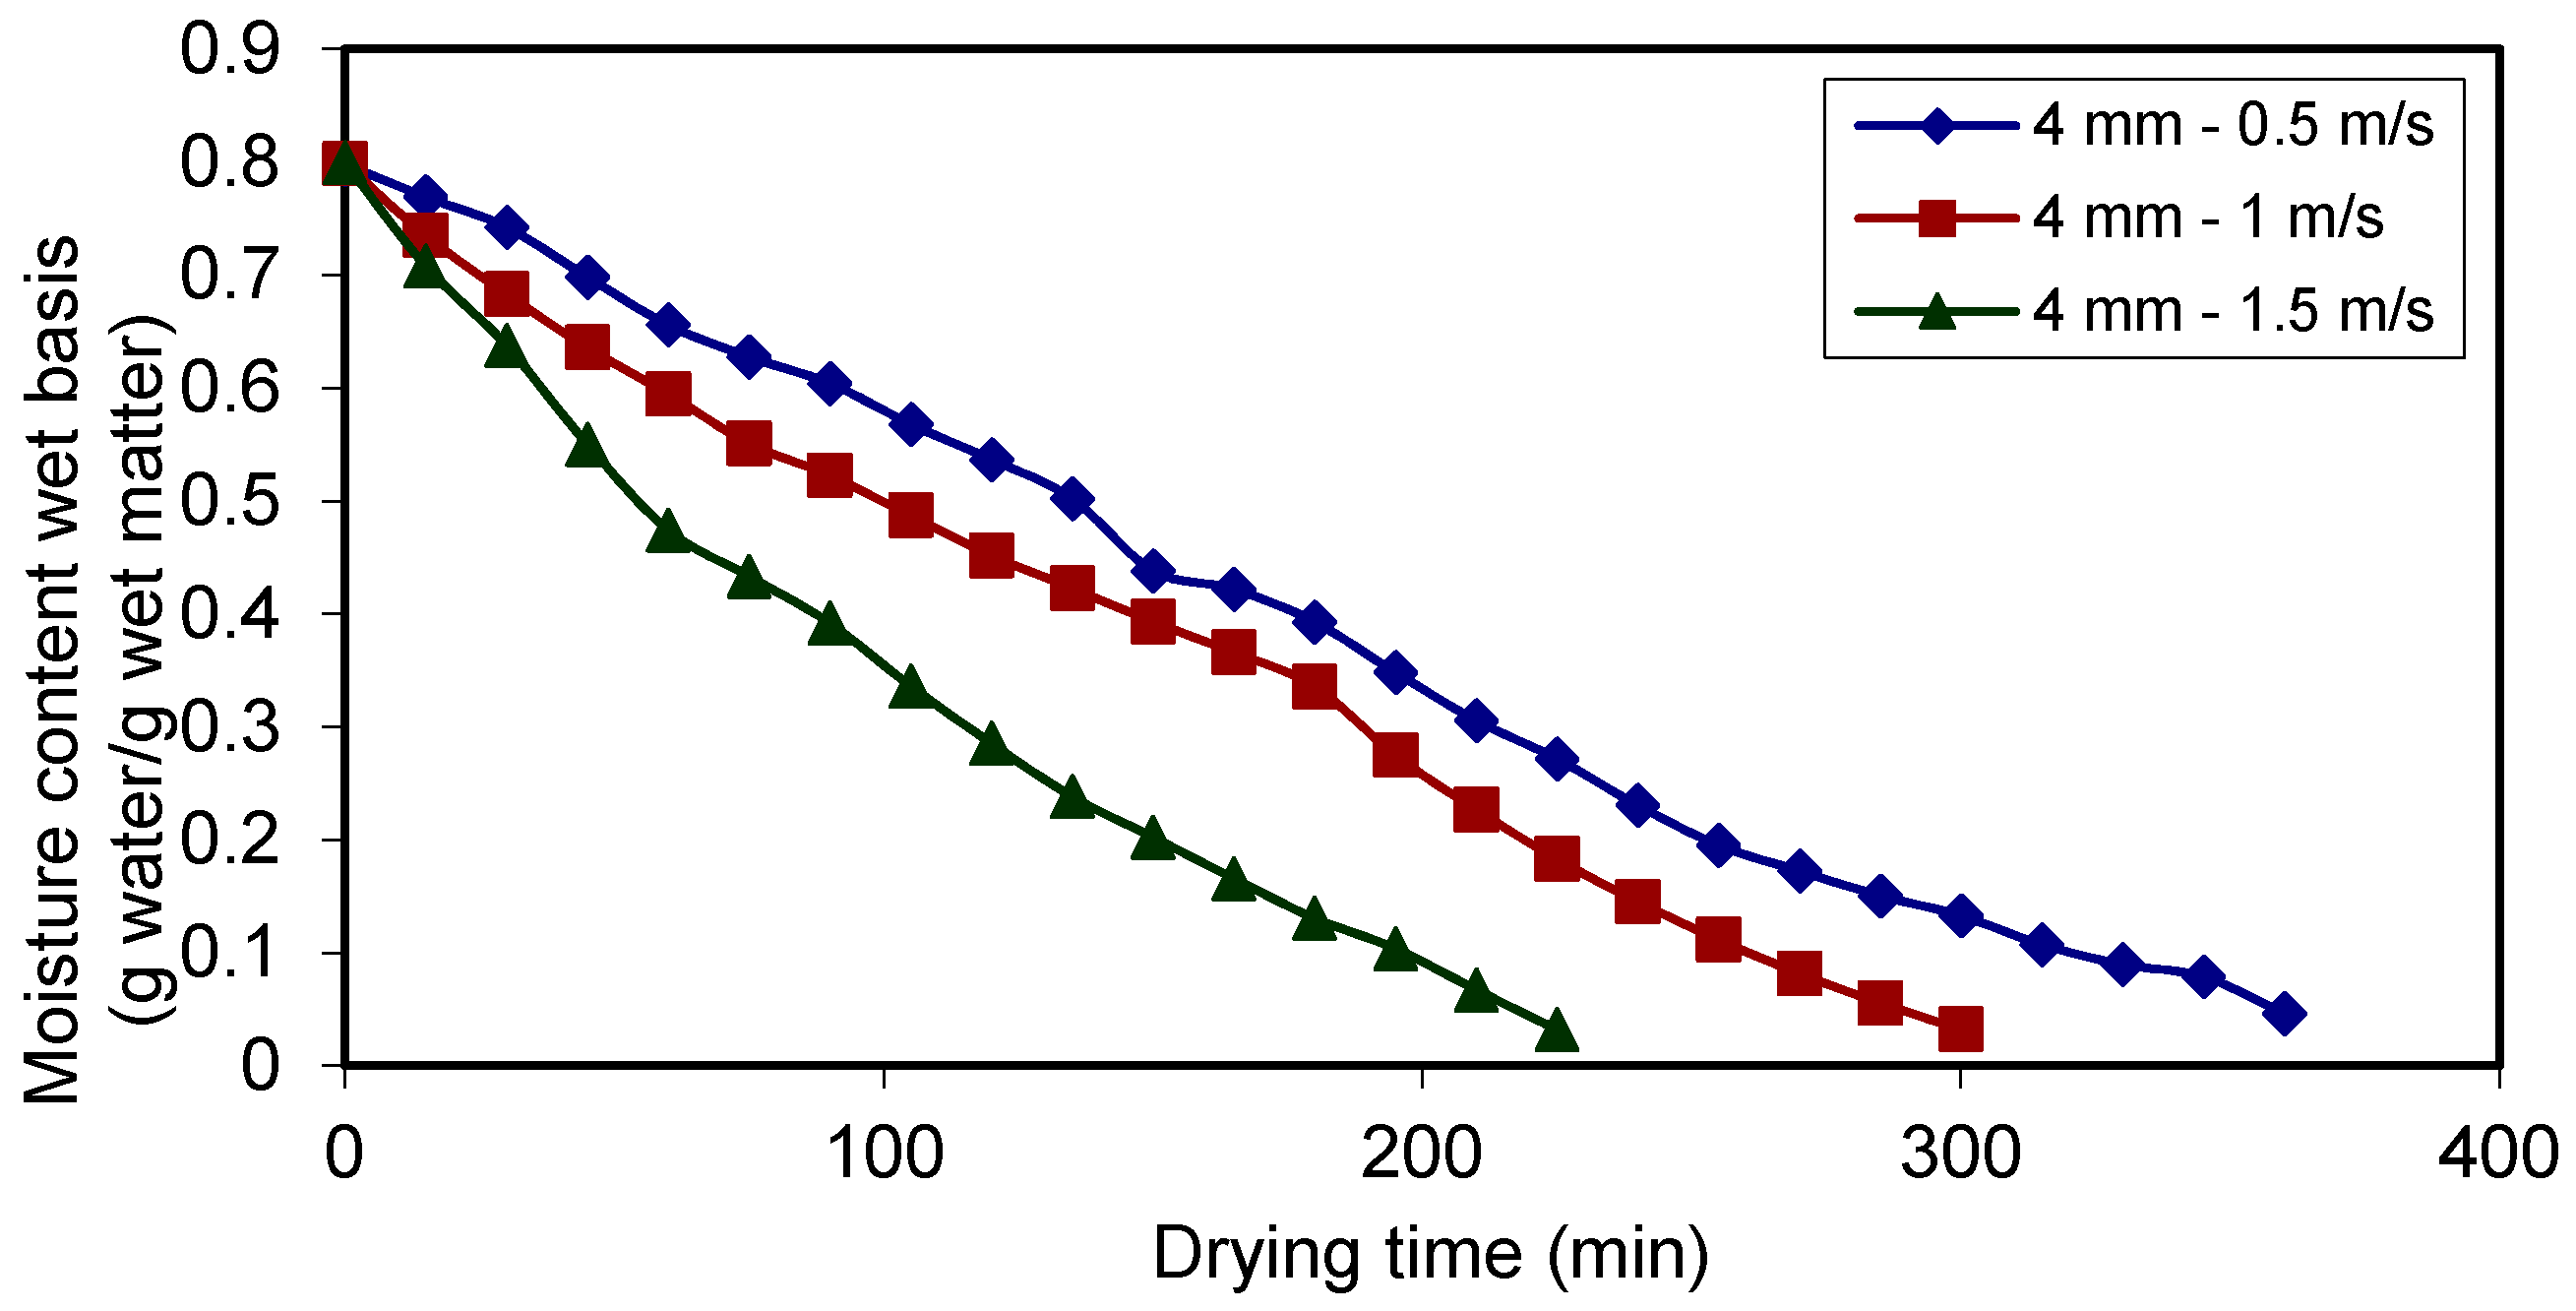
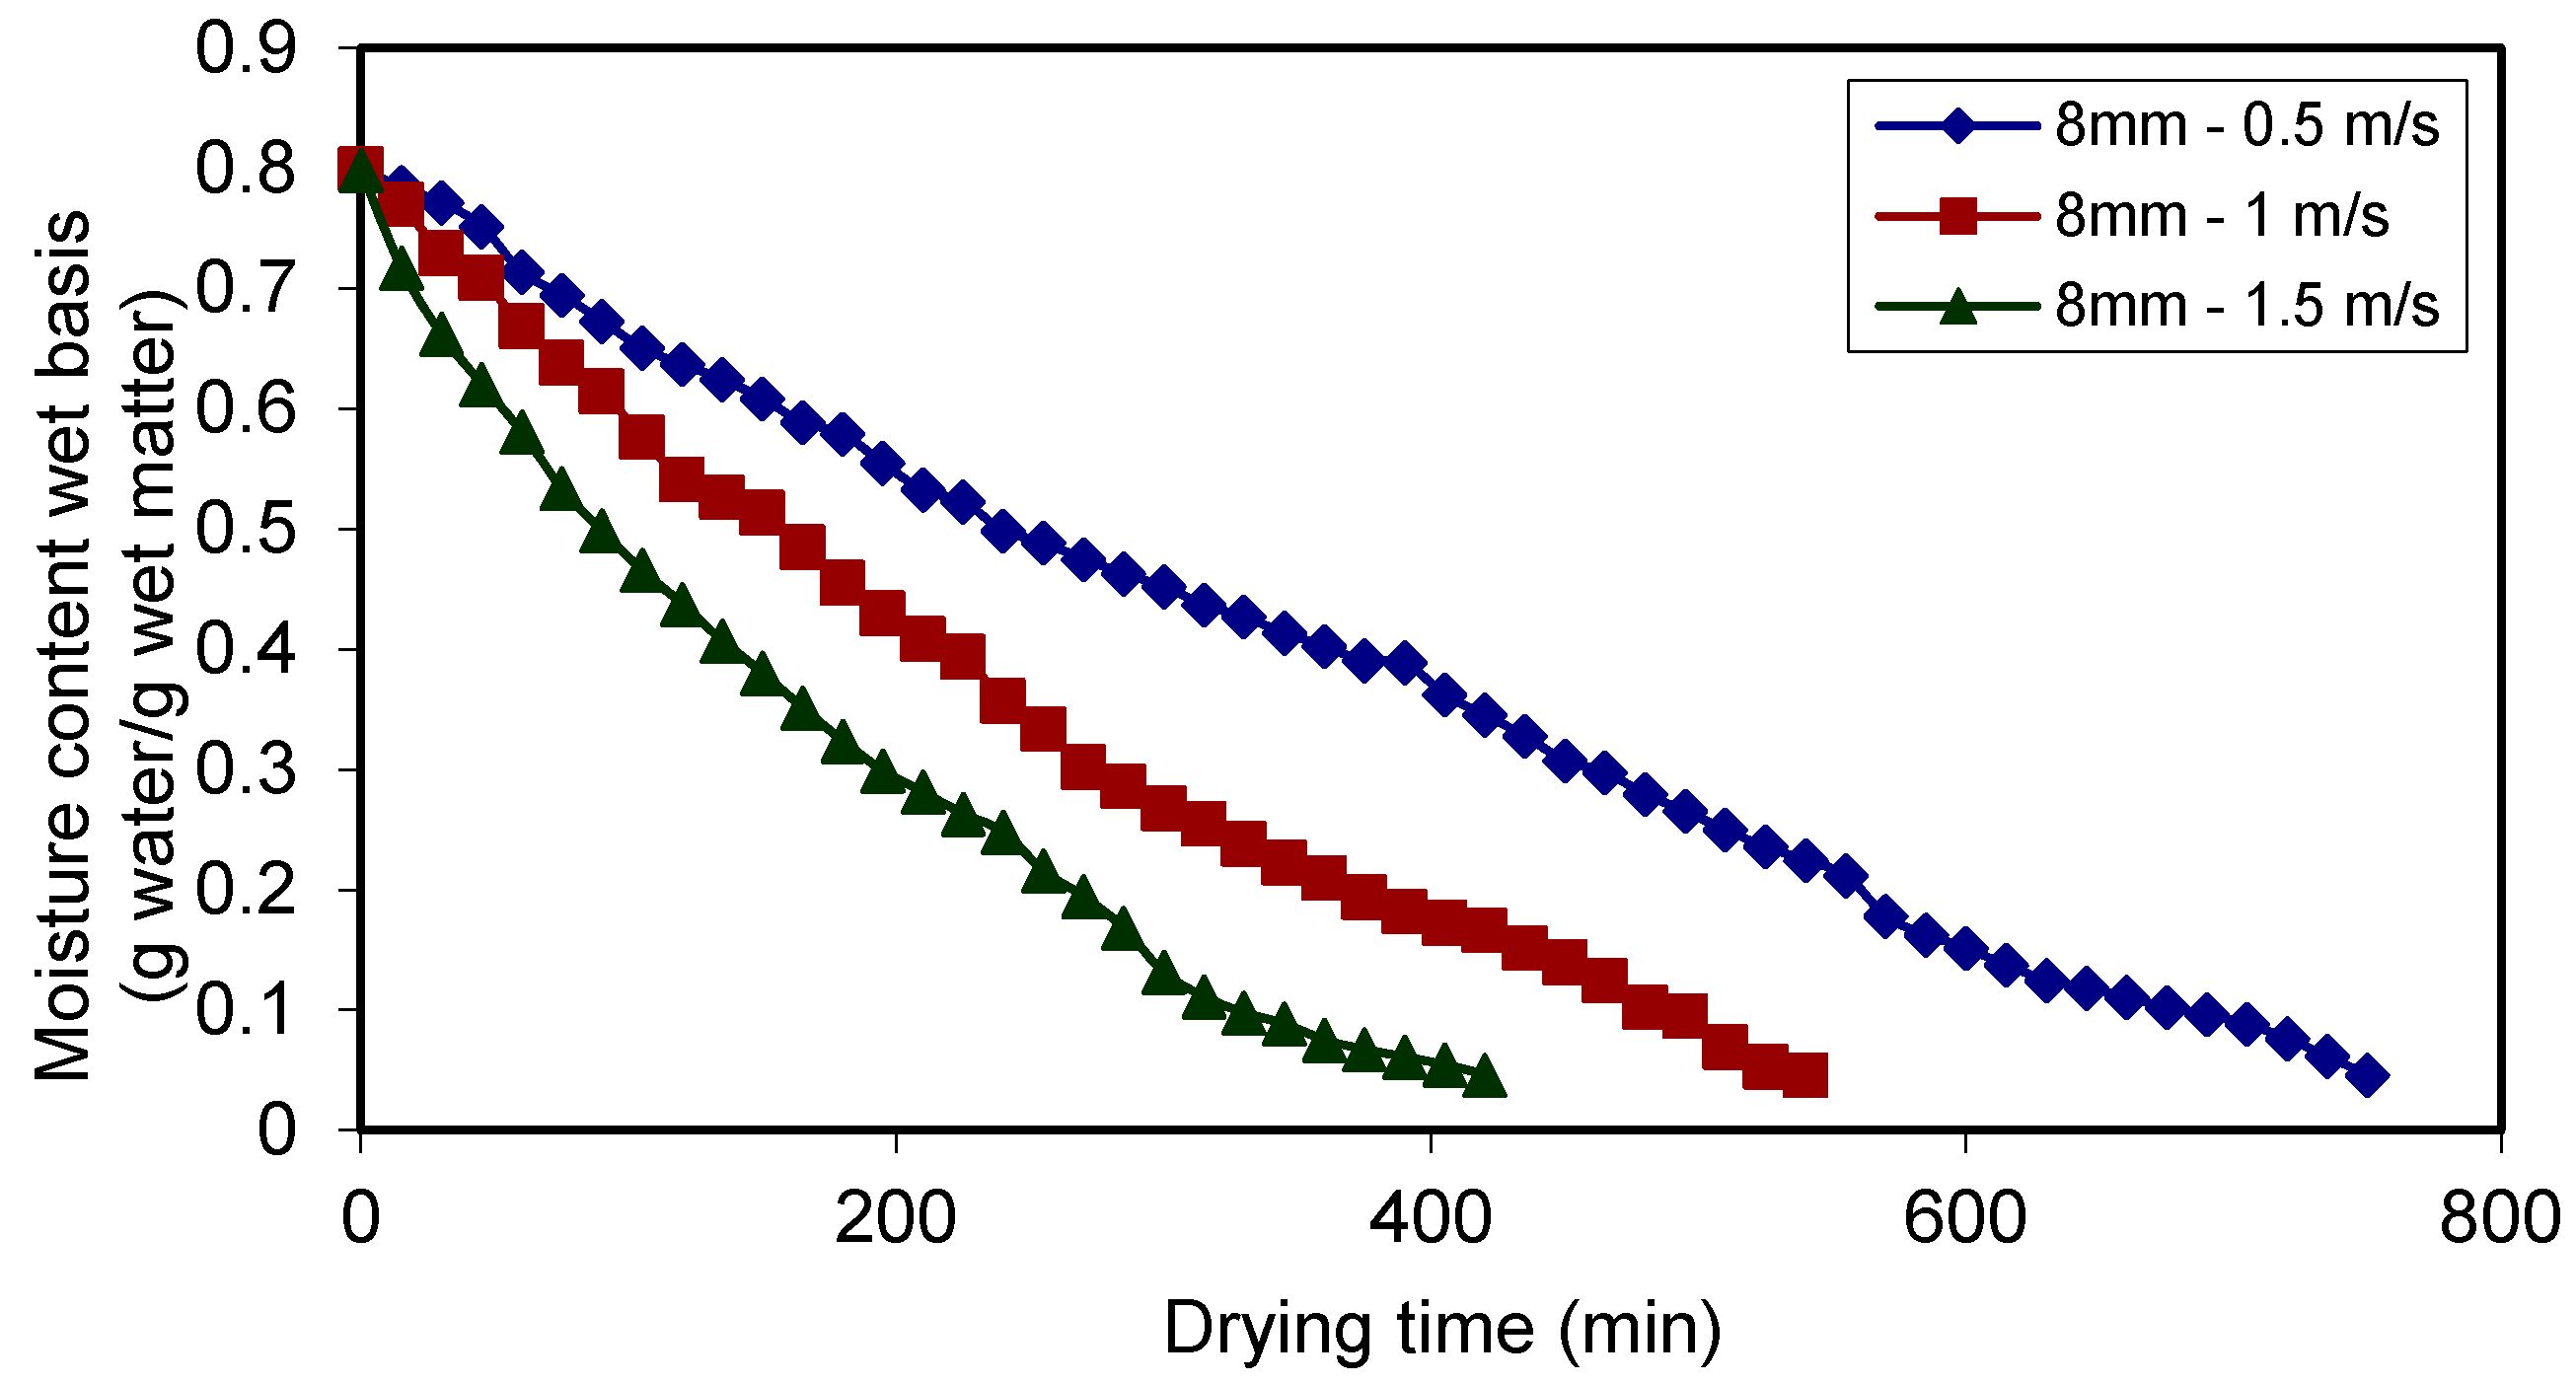
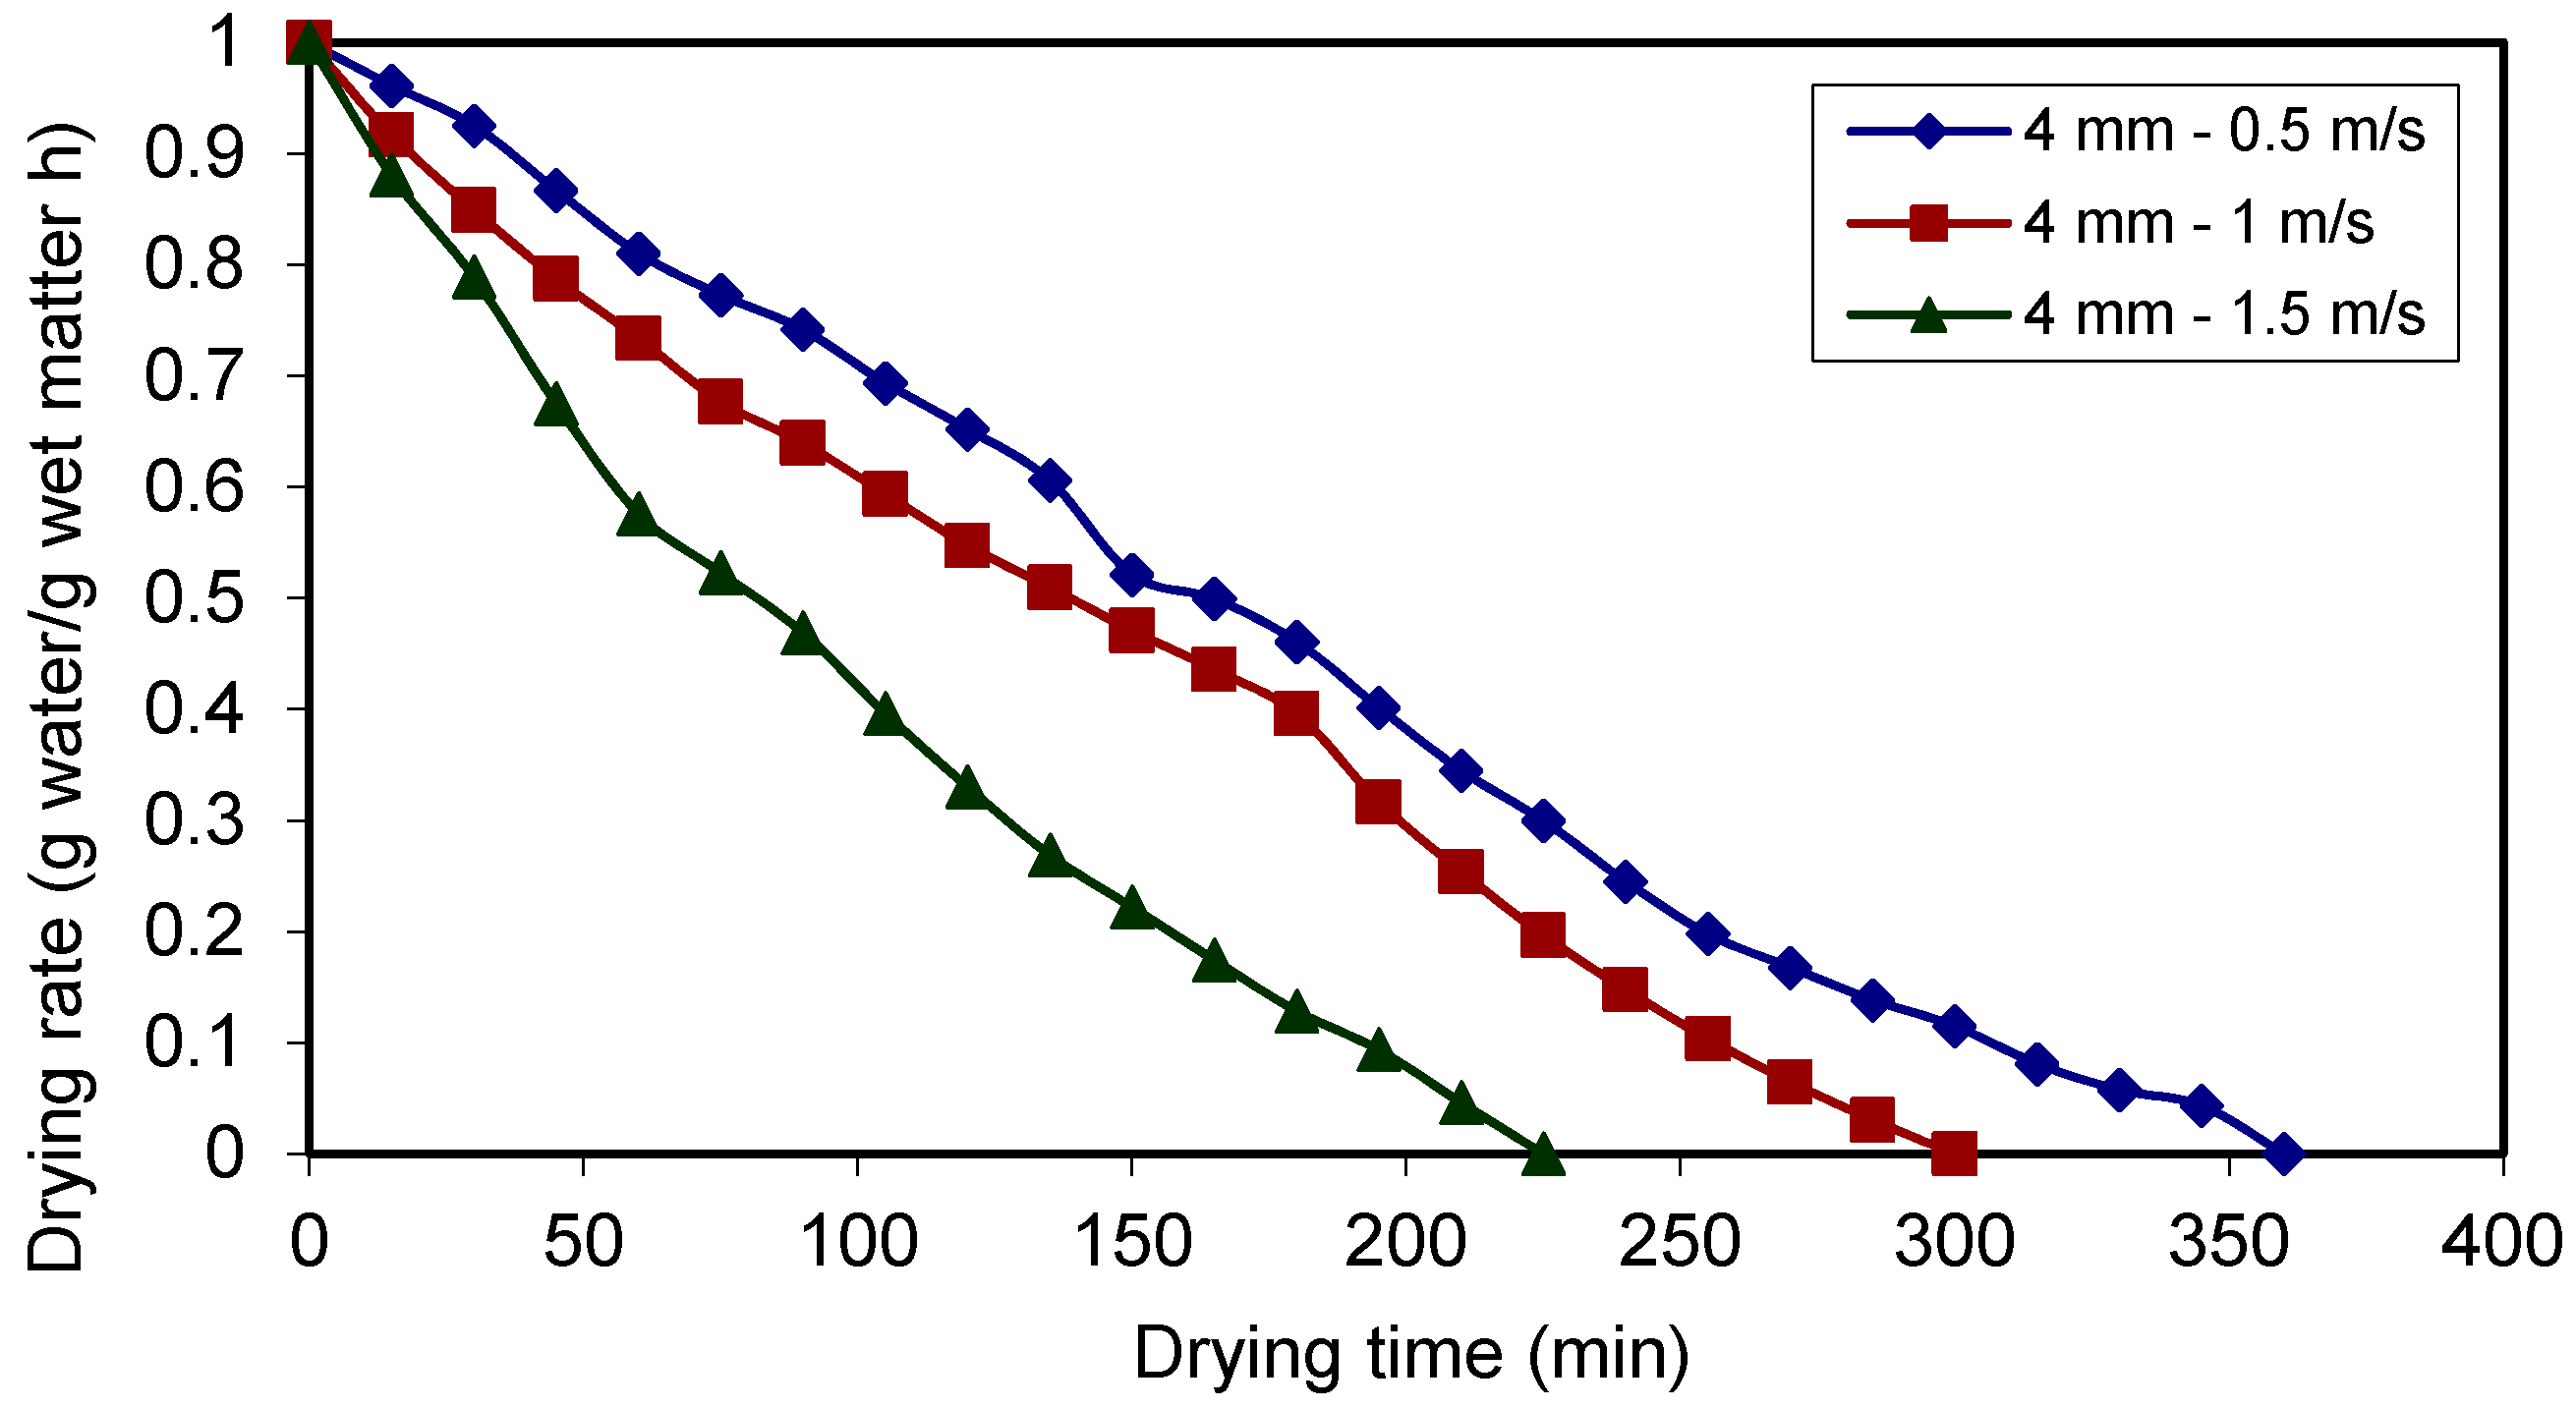
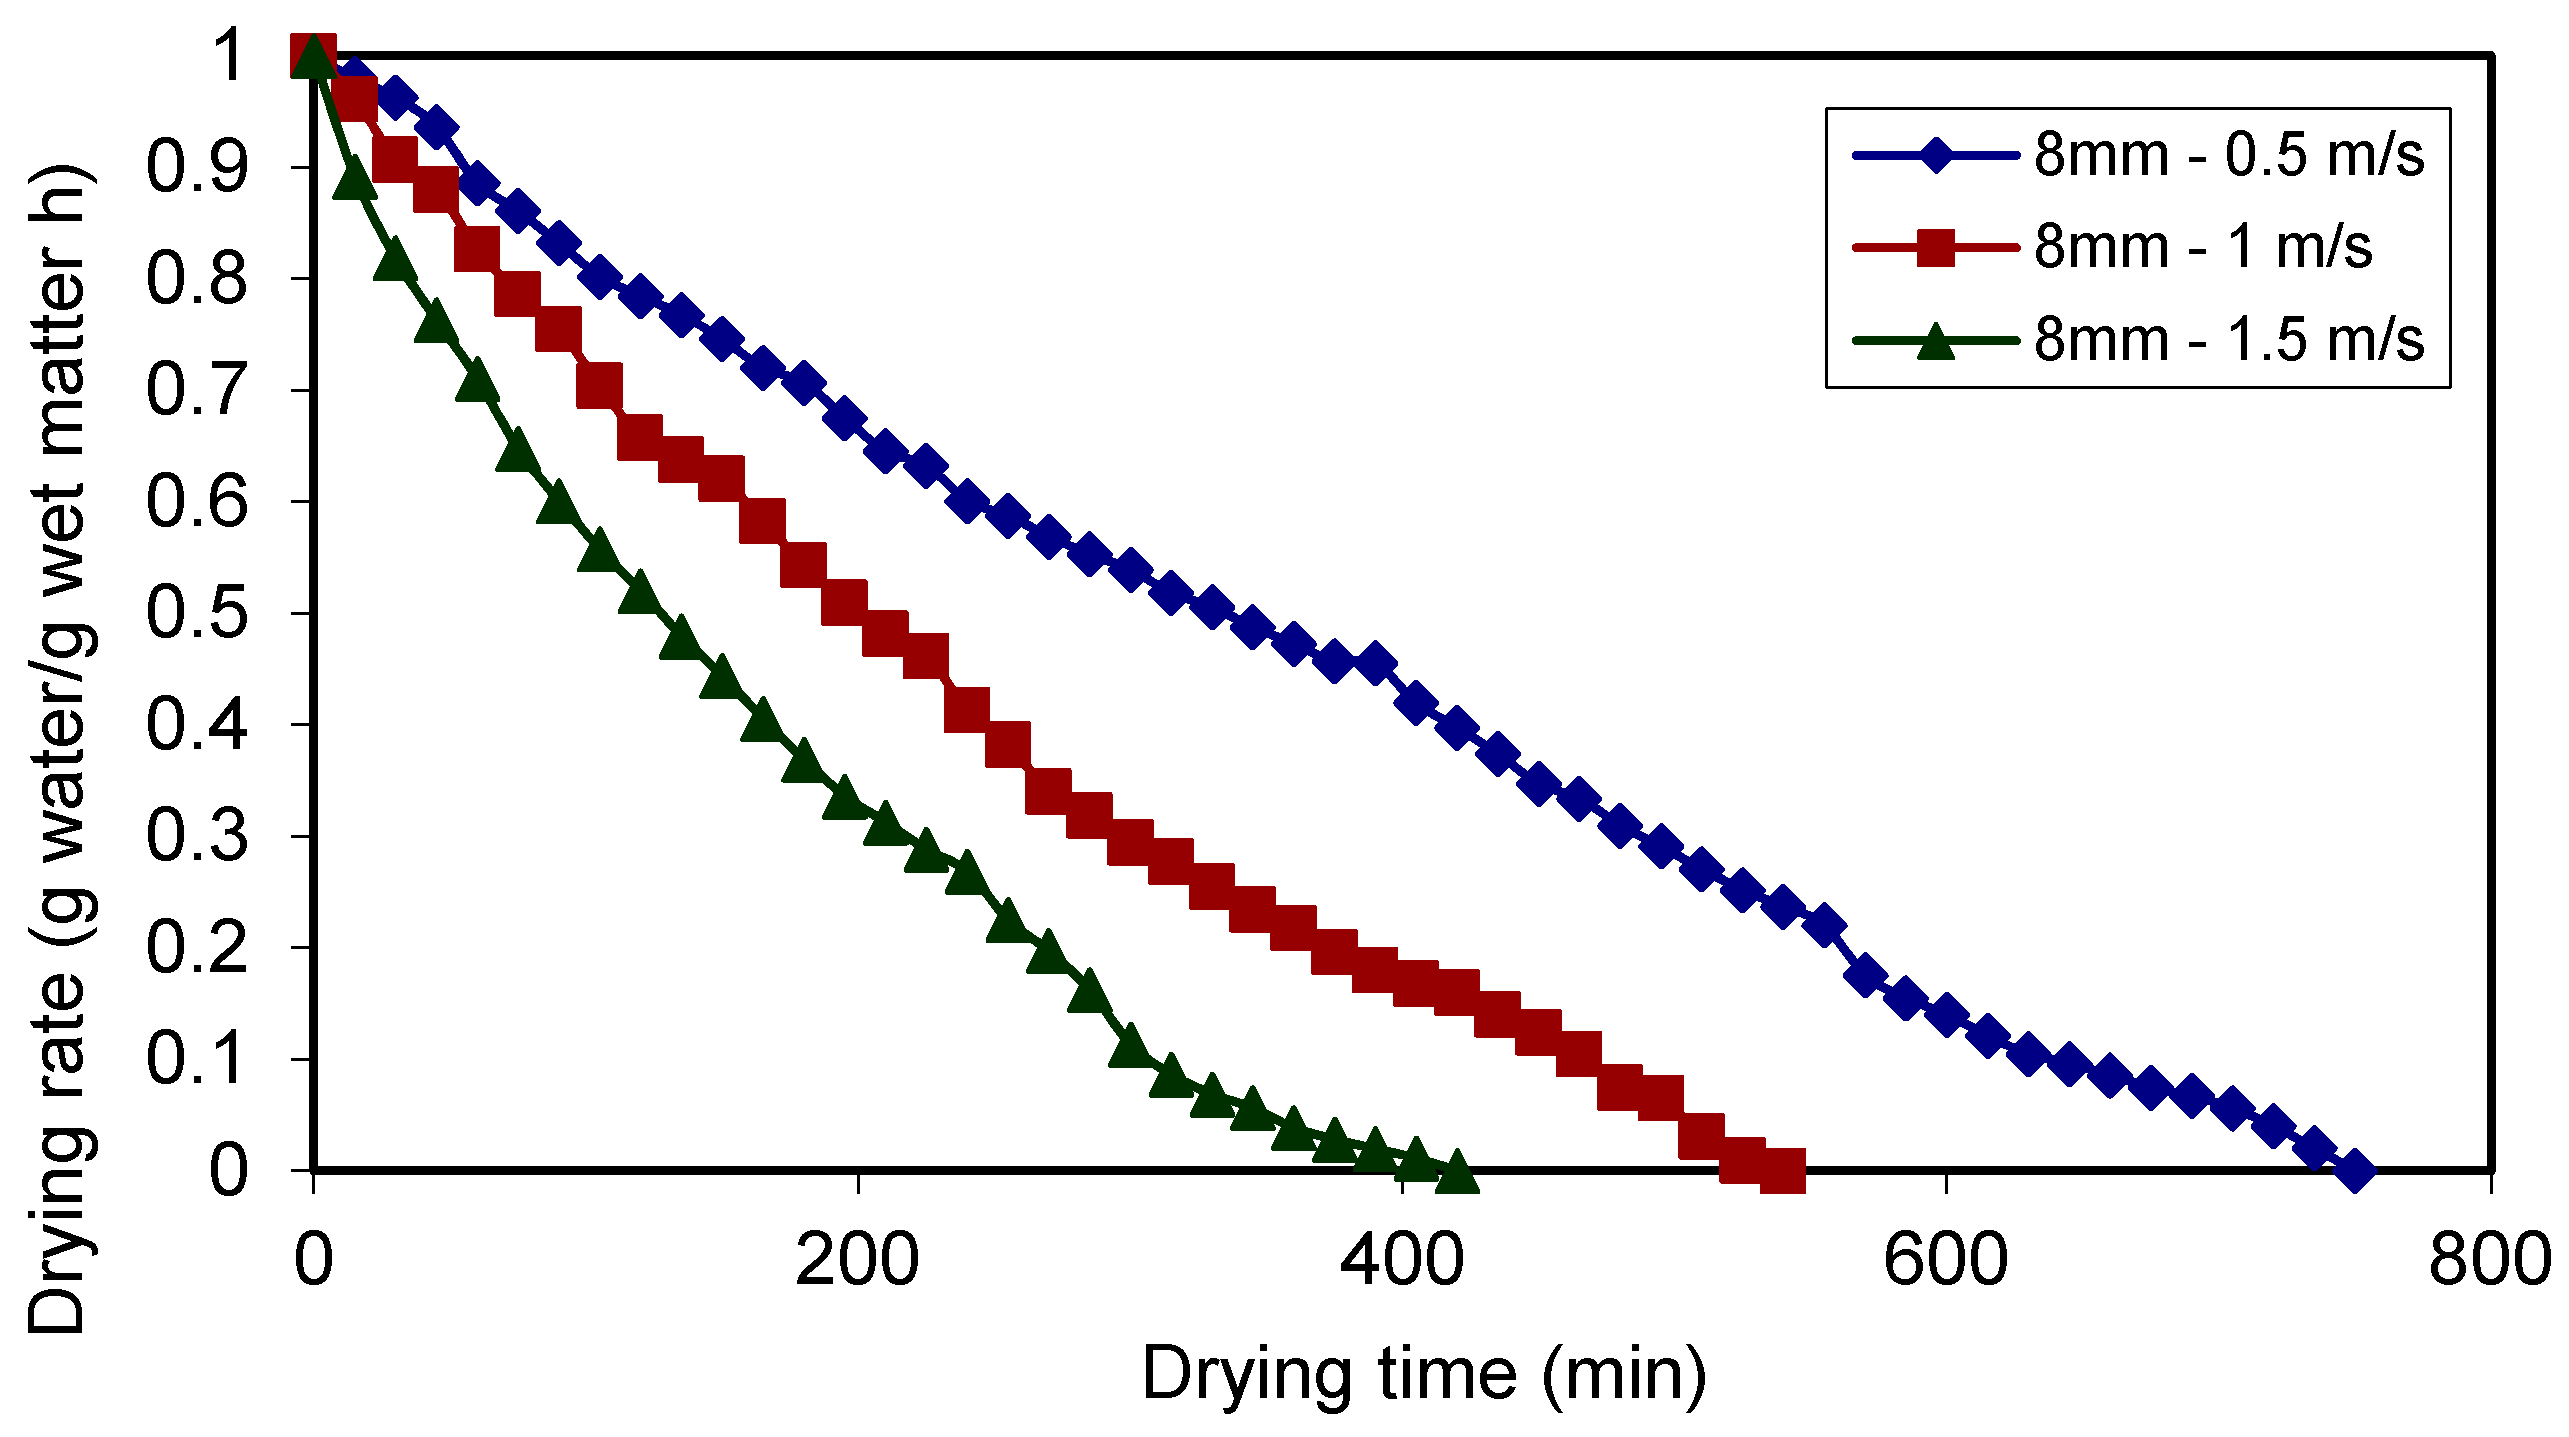
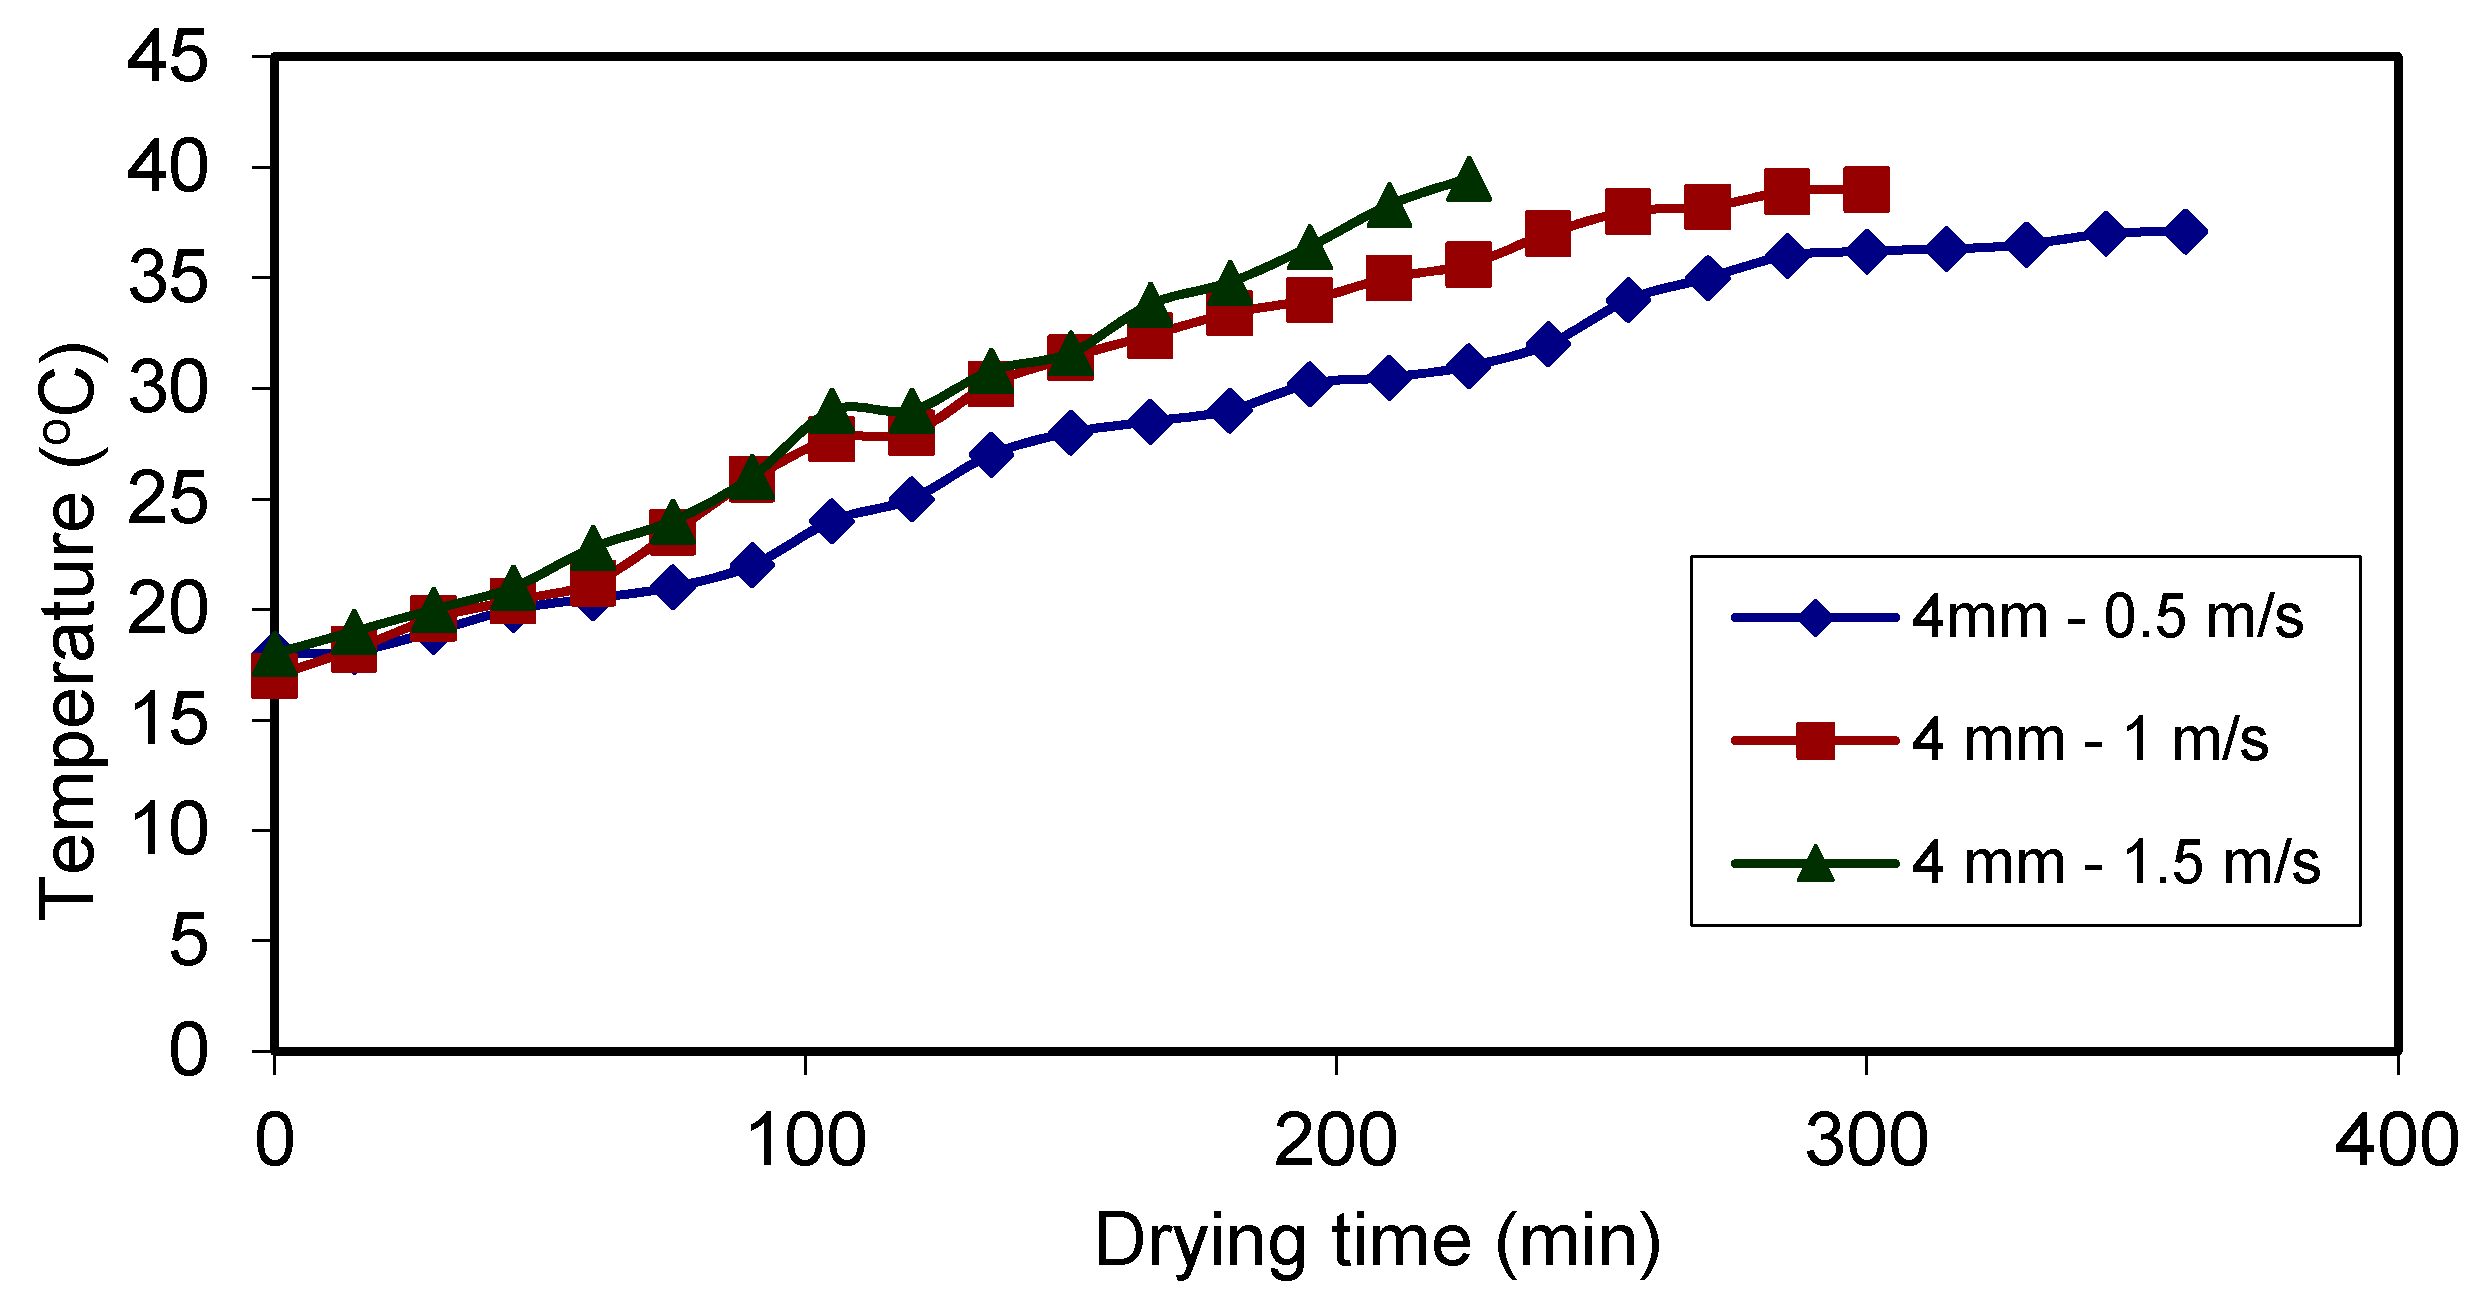
- The drying rate and the moisture content of the sample are affected by the thickness of the kiwifruit and the speed of the drying air. Increased drying air velocity and reduced fruit thickness cause drying time to be reduced.
- ✓
- The lowest drying time (225 min) was obtained at 4 mm slice thicknesses and 1.5 m/s. The highest drying time (750 min) was obtained at 8 mm slice thicknesses and 0.5 m/s velocity.
- ✓
- The drying was carried out to final moisture content of 10% from initial moisture content of about 80% (wb).
- ✓
- Freshly harvested kiwifruit was successfully dried in the convective dryer at different speeds and at different thicknesses. It has been determined that working the convective dryer at different speeds is advantageous in terms of preserving brightness and color quality.
- ✓
- By applying ANOVA to the test results it was found that, the most dominant parameter affecting the amount of moisture was drying time with 45.79%. Drying time was followed by air velocity with 29.54% and thickness of the slices with 17.32%.
- ✓
- The taste quality of the samples are not tasted, hence this study gives only information about the drying process. Further nutrition analysis are recommended by the co-authors of this study.
Author Contributions
Conflicts of Interest
Appendix A
Appendix B. NOMENCLATURE
| Mw | mass of water in the sample, g |
| MT | total mass of sample, g |
| Mk | dry mass of sample, g |
| Mwb | moisture content according to wet basis, g/g |
| Mdb | moisture content according to dry basis, g/g |
| Mt | mass at time t of sample, g |
| Mt+Δt | mass at time t + Δt of sample, g |
| M0 | initial mass of undried sample, g |
| Me | equilibrium moisture content of sample (g water/g dry matter) |
| n | number of experiments |
| SSe | sum of square due to error |
| SSfactor | sum of square due to factor |
| SSm | mean sum of square |
| SST | total sum of square |
| S/N | signal to noise ratio (η) |
| air density, kg/m3 | |
| ν | drying air speed, m/s |
| Vfactor | variance of the factor |
| W | drying air velocity, m/s |
| Ws | drying rate, g water/g dry matter h |
| ΔT | temperature difference, K |
References
- Cerci, K.N.; Kavak Akpinar, E. Experimental determination of convective heat transfer coefficient during open sun and greenhouse drying of apple slices. J. Therm. Eng. 2016, 2, 741–747. [Google Scholar]
- Togrul, I.T.; Pehlivan, D. Modelling of drying kinetics of single apricot. J. Food Eng. 2003, 58, 23–32. [Google Scholar] [CrossRef]
- Nimmol, C.; Devahastin, S.; Swasdisevi, T.; Soponronnarit, S. Drying and heat transfer behavior of banana undergoing combined low-pressure superheated steam and far-infrared radiation drying. Appl. Therm. Eng. 2007, 27, 2483–2494. [Google Scholar] [CrossRef]
- Sacilik, K.; Elicin, A.K. The thin layer drying characteristics of organic apple slices. J. Food Eng. 2006, 73, 281–289. [Google Scholar] [CrossRef]
- Kavak Akpinar, E.; Midilli, A.; Bicer, Y. Single layer drying behavior of potato slices in a convective cyclone dryer and mathematical modelling. Energy Convers. Manag. 2003, 44, 1689–1705. [Google Scholar] [CrossRef]
- Arslan, D.; Ozcan, M.M. Study the effect of sun, oven and microwave drying on quality of onion slices. LWT Food Sci. Technol. 2010, 43, 1121–1127. [Google Scholar] [CrossRef]
- Brasiello, A.; Iannone, G.; Adiletta, G.; De Pasquale, S.; Russo, P.; Di Matteo, M. Mathematical model for dehydration and shrinkage: Prediction of eggplant’s MRI spatial profiles. J. Food Eng. 2017, 203, 1–5. [Google Scholar] [CrossRef]
- Proietti, N.; Adiletta, G.; Russo, P.; Buonocore, R.; Mannina, L.; Crescitelli, A.; Capitani, D. Evolution of physicochemical properties of pear during drying by conventional techniques, portable-NMR, and modeling. J. Food Eng. 2018, 230, 82–98. [Google Scholar] [CrossRef]
- Gorinstein, S.; Haruenkit, R.; Poovarodom, S.; Park, Y.; Vearasilp, S.; Suhaj, M.; Ham, K.; Heo, B.; Cho, J.; Jang, H.G. The comparative characteristics of snake and kiwi fruits. Food Chem. Toxicol. 2009, 47, 1884–1891. [Google Scholar] [CrossRef]
- Dalvand, M.J.; Mohtasebi, S.S.; Rafiee, S. Study on effective structural parameters on drying rate of kiwi fruits in a solar EHD dryer. Int. J. Multidiscip. Sci. Eng. 2012, 3, 66–70. [Google Scholar]
- Mohammadi, A.; Rafiee, S.; Keyhani, A.; Emam-Djomeh, Z. Estimation of thin-layer drying characteristics of kiwifruit (cv. Hayward) with use of page’s model. Am. Eurasian J. Agric. Environ. Sci. 2008, 3, 802–805. [Google Scholar]
- Wang, H.; Ng, T.B. Isolation of an antifungal thaumatin-like protein from kiwi fruits. Phytochemistry 2002, 61, 1–6. [Google Scholar] [CrossRef]
- Kaya, A.; Aydın, O.; Dincer, I. Experimental and numerical investigation of heat and mass transfer during drying of Hayward kiwi fruits (Actinidia deliciosa Planch). J. Food Eng. 2008, 88, 323–330. [Google Scholar] [CrossRef]
- Singh, N.J.; Pandey, R.K. Convective air drying characteristics of sweet potato cube (Ipomoea batatas L.). Food Bioprod. Process. 2012, 90, 317–322. [Google Scholar] [CrossRef]
- Guine, R.P.F.; Fernandes, R.M.C. Analysis of the drying kinetics of chestnuts. J. Food Eng. 2006, 76, 460–467. [Google Scholar] [CrossRef]
- Karim, M.A.; Hawlader, M.N.A. Drying characteristics of banana: Theoretical modelling and experimental validation. J. Food Eng. 2005, 70, 35–45. [Google Scholar] [CrossRef]
- Maskan, M. Kinetics of color change of kiwi fruits during hot air and microwave drying. J. Food Eng. 2001, 48, 169–175. [Google Scholar] [CrossRef]
- Velic, D.; Planınic, M.; Tomas, S.; Bilic, M. Influence of airflow velocity on kinetics of convection apple drying. J. Food Eng. 2004, 64, 97–102. [Google Scholar] [CrossRef]
- Ozgen, F. Experimental investigation of drying characteristics of cornelian cherry fruits (Cornus mas L.). Heat Mass Transf. 2015, 51, 343–352. [Google Scholar] [CrossRef]
- Darici, S.; Şen, S. Investigation of effects of drying air velocity on drying at drying of kiwi (Kivi meyvesinin kurutulmasında kurutma havası hızının kurumaya etkisinin incelenmesi). Tesisat Mühendisliği 2012, 130, 51–58. [Google Scholar]
- Doymaz, I. Air drying characteristics of tomatoes. J. Food Eng. 2007, 78, 1291–1297. [Google Scholar] [CrossRef]
- Wang, J.; Xi, Y.S. Drying characteristics and drying quality of carrot using a two-stage microwave process. J. Food Eng. 2005, 68, 505–511. [Google Scholar] [CrossRef]
- Celik, N.; Turgut, E. Design analysis of an experimental jet impingement study by using Taguchi method. Heat Mass Transf. 2012, 48, 1407–1413. [Google Scholar] [CrossRef]


| Indices | Kiwi |
|---|---|
| P | 2640 ± 111 |
| K | 17.418 ± 639 |
| Ca | 1512 ± 15 |
| Mg | 864 ± 41 |
| Na | 242 ± 12 |
| Fe | 16.1 ± 0.8 |
| Mn | 22.4 ± 1.2 |
| Cu | 1.14 ± 0.1 |
| Zn | 10.8 ± 0.3 |
| B | 6.11 ± 0.3 |
| S | 164 ± 5.7 |
| Unit | Technical Specification | Photos |
|---|---|---|
| Drying chamber | iron sheet (3 mm); length: 60 mm; width: 40 mm; height: 60 mm. |  |
| Air flow channel | galvanized sheet; length: 2.5 m; pipe diameter: 120 mm; insulation thickness 30 mm. | 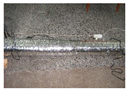 |
| Precision scale | Measurement range 0–6100 g and an accuracy of 0,1 g; digital scale length 30 cm; width 19 cm; sample tray length 27 cm; width 21 cm. AVERY BERKEL (Model CC061) | 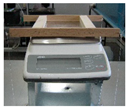 |
| Radial Fan | 0.537 kW power; 220 V; 50 Hz; 2.5 A; 2800 1/min [SB908AN-22-3]. | 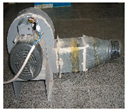 |
| Heating system | 2000 W heater placed inside duct | 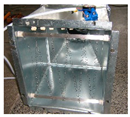 |
| Thermometer-Anemometer | Temperature measuring ranges: from −20 to +80 °C; Air velocity measuring ranges; from 0.15 to 3 m/s; sizes 50–34.9 mm; Thermocouple K, J or T [KIMO]. | 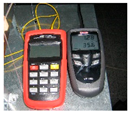 |
| Variac | From 0 to +260 V; 2.5 A; 50 Hz [STACO 3PN1520B]. | 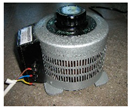 |
| Hygrometer and temperature measurement | from 0 to +45°C (±5 °C), from 10 to 90% RH (± 5% RH) [HTC-1]. | 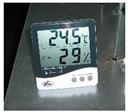 |
| Experiment No. | Control Factors | S/N Ratio | ||
|---|---|---|---|---|
| A | B | C | ||
| 1 | 1 | 1 | 1 | 2.947656 |
| 2 | 1 | 1 | 2 | 5.154078 |
| 3 | 1 | 1 | 3 | 12.59733 |
| 4 | 1 | 2 | 1 | 2.685227 |
| 5 | 1 | 2 | 2 | 5.231762 |
| 6 | 1 | 2 | 3 | 12.99799 |
| 7 | 1 | 3 | 1 | 7.795295 |
| 8 | 1 | 3 | 2 | 13.54313 |
| 9 | 1 | 3 | 3 | 22.39837 |
| 10 | 2 | 1 | 1 | 0.129565 |
| 11 | 2 | 1 | 2 | 1.065896 |
| 12 | 2 | 1 | 3 | 6.835554 |
| 13 | 2 | 2 | 1 | 0.658958 |
| 14 | 2 | 2 | 2 | 1.664354 |
| 15 | 2 | 2 | 3 | 6.343403 |
| 16 | 2 | 3 | 1 | 4.421369 |
| 17 | 2 | 3 | 2 | 7.954719 |
| 18 | 2 | 3 | 3 | 13.04653 |
| Average S/N Ratios (dB) | ||||
|---|---|---|---|---|
| Control factors | Level 1 | Level 2 | Level 3 | |
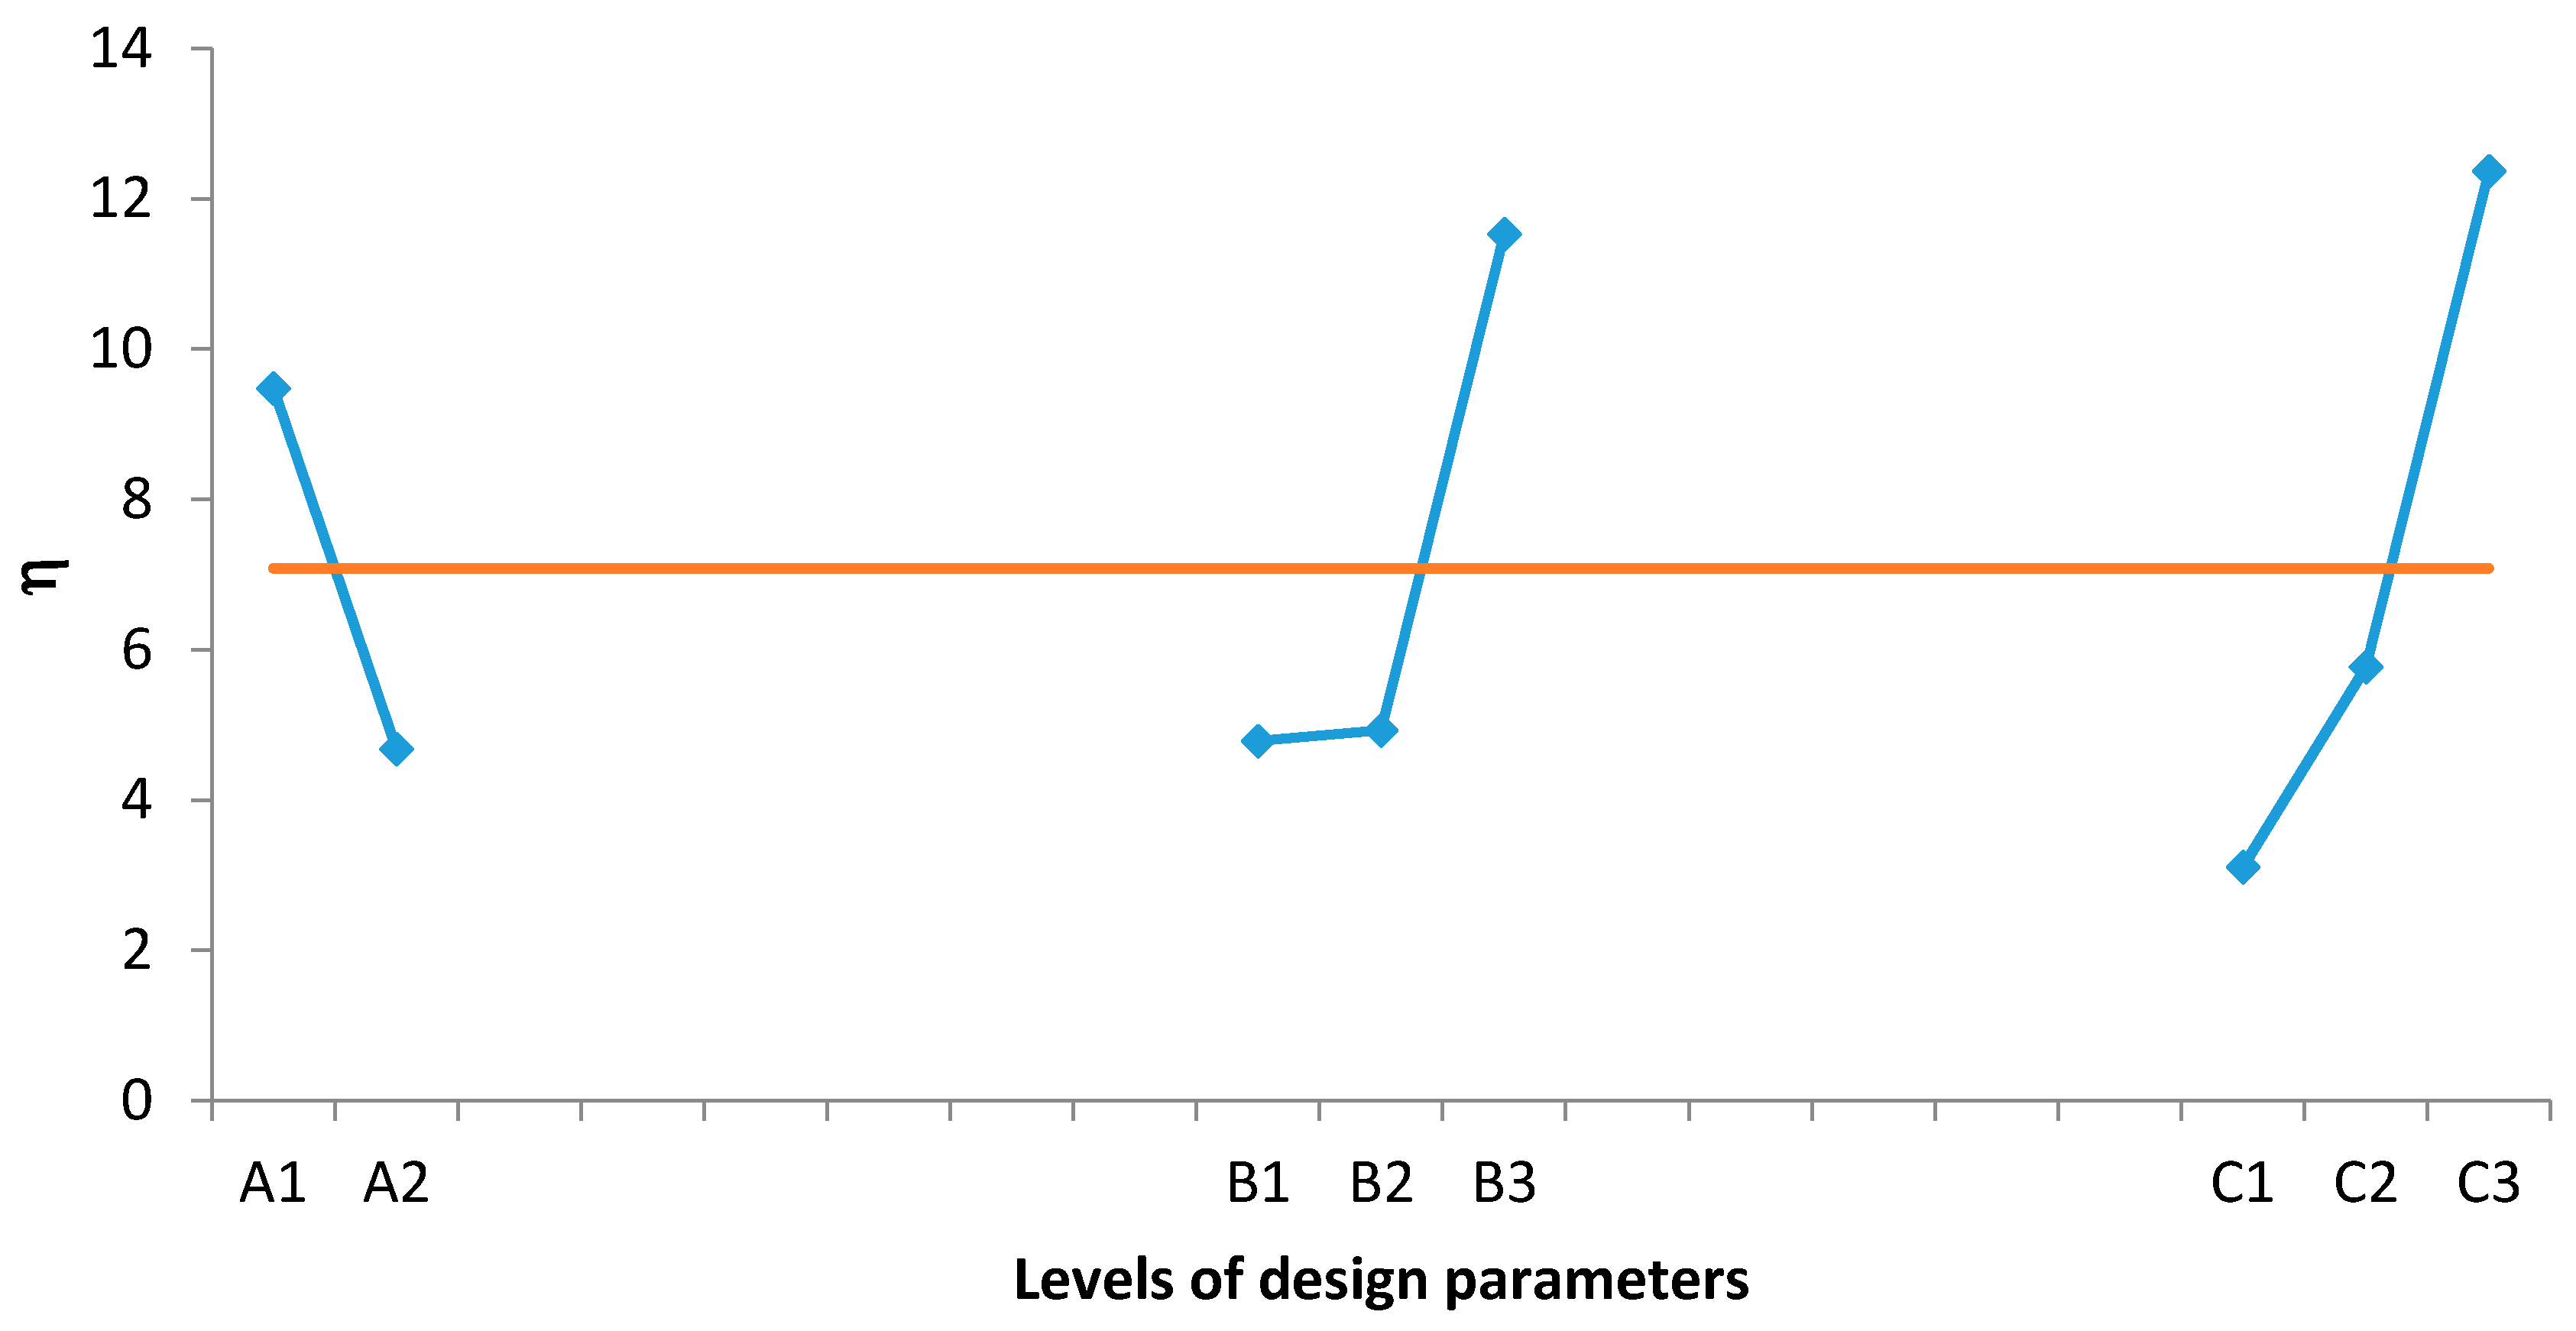
| A | Thickness of the slices (mm) | 9.48 * | 4.68 | -- |
| B | Air velocity (m/s) | 4.79 | 4.93 | 11.53 * |
| C | Drying time (min) | 3.11 | 5.77 | 12.37 * |
| Factor | Degree of Freedom (df) | Sum of Square (SS) | Variance (V) | F | Contribution (%) |
|---|---|---|---|---|---|
| A | 1 | 103.8263775 | 103.8264 | 41.06048 | 17.31623091 |
| B | 2 | 177.8696111 | 88.93481 | 35.17128 | 29.54121585 |
| C | 2 | 272.9478971 | 136.4739 | 53.9717 | 45.79426629 |
| Error | 12 | 30.34344542 | 2.52862 | 0 | 7.348286946 |
| Total | 584.9873311 |
© 2018 by the authors. Licensee MDPI, Basel, Switzerland. This article is an open access article distributed under the terms and conditions of the Creative Commons Attribution (CC BY) license (http://creativecommons.org/licenses/by/4.0/).
Share and Cite
Ozgen, F.; Celik, N. Evaluation of Design Parameters on Drying of Kiwi Fruit. Appl. Sci. 2019, 9, 10. https://doi.org/10.3390/app9010010
Ozgen F, Celik N. Evaluation of Design Parameters on Drying of Kiwi Fruit. Applied Sciences. 2019; 9(1):10. https://doi.org/10.3390/app9010010
Chicago/Turabian StyleOzgen, Filiz, and Nevin Celik. 2019. "Evaluation of Design Parameters on Drying of Kiwi Fruit" Applied Sciences 9, no. 1: 10. https://doi.org/10.3390/app9010010
APA StyleOzgen, F., & Celik, N. (2019). Evaluation of Design Parameters on Drying of Kiwi Fruit. Applied Sciences, 9(1), 10. https://doi.org/10.3390/app9010010