1. Introduction
Light-sensitive liquid crystalline elastomers (LS-LCEs) are soft materials that combine an orientational order of liquid crystals and the rubber elasticity of elastomers with the photoresponsivity of photoisomerizable compounds [
1,
2,
3]. As optical holographic materials, they show many intriguing properties. For instance, they exhibit recording sensitivity that is several orders of magnitude larger than conventional (non-liquid crystalline) elastomers containing similar photoisomerizable moieties [
4,
5,
6,
7,
8,
9]. The recording process takes place in a very nonlinear manner that allows an intricate control over the spatial structuring of the refractive index modulation. The associated diffraction effects are particularly interesting in the temperature region close to the nematic–paranematic phase transition, in which phenomena such as the recording of “hidden holograms” and “hologram dark enhancement effect” can be observed [
10]. Light-sensitive LCEs are also very efficient for recording polarization gratings generated by the superposition of orthogonally polarized writing beams. In the vicinity of the Bragg angle, those gratings exhibit an unusual splitting of the diffraction peak, which is a consequence of the strong absorption anisotropy for the actinic optical radiation [
11].
All of the above-mentioned properties are predominantly associated with the liquid crystalline character of the LCEs. However, their elastomeric character can also yield several interesting features. The most evident one is the possibility of regulating the spatial periodicity of optical patterns by mechanical straining, which was demonstrated in our recent study, and which makes LCE films very promising for applications in mechanically tunable diffractive optical elements, such as adjustable optical filters or stretchable diffractive lenses [
12]. However, in designing practical devices, it is very important to know not only how mechanical manipulation affects the diffracted patterns, but also how it affects the efficiency of the related diffractive phenomena. Consequently, in this work, the emphasis is on the effects of stress and strain on the diffraction efficiency of some selected holographic grating structures.
The stress–strain relationship
σ(
ε) of an orientationally aligned (monodomain) LCE film strongly depends on the straining direction. For straining along the preferential orientation of the liquid crystalline (mesogenic) molecular units, known as the nematic director
n0, stress increases proportionally to strain, similar to conventional elastomers. For straining in the direction perpendicular to
n0, a nonlinear behavior known as (semi)soft elasticity is observed, which is characterized by a plateau region in which stress remains nearly constant during the increasing strain [
1,
13]. This phenomenon is associated with a continuous reorientation of the mesogenic molecular units in the embedding polymer network. The exact dependence of
σ(
ε) is affected also by the sample preparation procedure and by the temperature. For LCE materials with a smooth (continuous) phase transition from the nematic to the isotropic phase (also called paranematic phase) [
14,
15], as the one used in our study, the behavior of
σ(
ε) is also smooth at all temperatures. The anisotropy of the stress–strain relationship decreases with the increasing temperature, and more or less vanishes at the transition temperature
T0 [
16,
17]. In LS-LCEs, illumination with ultraviolet (UV) light affects the stress–strain relationship in a similar manner as heating, i.e., it causes a decrease of the liquid crystalline order that is governed by the illumination intensity [
2,
18,
19,
20]. The experiments exploring this effect are usually performed either with homogeneous or with macropatterned UV illumination generated with the use of photolithographic masks [
4,
13,
21,
22,
23], while in our study, we used micropatterned UV illumination generated by holographic lithography.
2. Experimental
Macroscopically aligned (single domain) polysiloxane-based LS-LCE films were prepared by the two-step “Finkelmann cross-linking procedure” [
24]. The cross-linker concentration was 5 wt% and the photosensitive azomesogen concentration was 9 wt%. The azomesogens and also the conventional mesogens were attached to the polysiloxane backbone as side groups. The details of the synthesis method and sample preparation procedures are described elsewhere [
6]. The thickness of the films was 150 μm. Samples of rectangular shape with a typical surface area of around 5 × 5 mm
2 were cut out from the films. For probing strain-induced modifications of diffractive properties, one edge of the sample was clamped to the frame of the sample holder, while the other edge was attached to the translation stage used for imposing a controlled tensile strain (see
Figure 1). The straining was performed either along or perpendicular to the initial alignment direction
n0. For probing illumination-induced stress modifications, the sample was slightly prestrained, and then clamped to the strain gauge that was used to measure the tensile force. The force was measured via two resistive type sensors, in which resistance is very sensitive to contraction/expansion. They were attached to the frame of the sample holder, as indicated in
Figure 1b.
The investigated one-dimensional and two-dimensional holographic transmission gratings were recorded either with two or four intersecting UV laser beams from an argon ion laser operating at the recording wavelength of
λR = 351 nm. All of the beams were expanded to the area with a diameter
dR ~ 10 mm, which was considerably larger than the LCE film, and were linearly polarized in the direction parallel to
n0 (extraordinary polarization). The average power density of UV radiation on the sample during the recording process was ~20 mW/cm
2, and the typical illumination time was several minutes. In the two-beam configuration, the intensity pattern is described as [
7]:
where
k⊥ =
k0 sinα is the transversal component of the wave vector of incident beams, α is the incidence angle (with respect to surface normal), and
k0 is the wave vector in vacuum. This pattern induces a one-dimensional modulation of the optical properties of the sample with a periodicity of
Λ =
π/
k⊥ along the
x axis. In the four-beam configuration, the intensity pattern is given as [
25]:
which corresponds to the quadratic lattice oriented at 45° with respect to the
x and
y axes. The lattice distance (unit cell dimension) is
a =
and the diagonal of the unit cell is
D =
.
The diffraction properties of the recorded grating structures were probed with a low-power beam (<1 mW) from a HeNe laser operating at a probing wavelength of
λP = 633 nm. As this wavelength is far from the absorption peaks of the material, it is affected mainly by the phase-type modulation of optical properties [
26]. The probe beam was linearly polarized in the direction of extraordinary polarization, and entered the film at normal incidence. The spot size of the probe beam in the film was
dp ~ 0.2 mm, which is much smaller than the diameter of the recording beams [
27]. The far field diffraction pattern was detected either with a CCD camera (strain-induced effects) or by a set of photodiodes (experiments with fixed sample length) placed at the distance of 0.5 m behind the sample.
3. Results
The dominant origin of holographic recording in LS-LCEs is UV illumination-induced
trans-to-
cis isomerization of azomesogenic side groups [
5,
28,
29]. The rate of this process is proportional to the intensity of the UV irradiation; therefore, it predominantly takes place in the regions of high intensity, while in the regions of low intensity, it is nearly absent. Consequently, a spatially modulated concentration of the
cis isomers
Nc(
r) is established.
Cis isomers act as impurities in the liquid crystalline phase [
18], so they cause a local decrease of the scalar nematic order parameter
S (
S =< (3cos
2θ − 1)/2>), where
θ is the angle between the long axis of the mesogenic molecules and the direction
n0, and brackets denote averaging), which can be described as:
where
S0 corresponds to the order parameter in the dark (when all of the azomesogens are in the
trans state), Δ
S < 0 is the isomerization-induced modification of
S,
Nc(
r) the concentration of
cis azomesogens at a selected position
r, and
T is the temperature.
Local modifications of
S result in modifications of optical birefringence of the material
nb = (
ne −
no) ∝
, where
e and
o denote the extraordinary and the ordinary ray, respectively. Therefore, after illumination with the periodic UV interference pattern,
no as well as
ne become periodically modulated, i.e., an anisotropic optical grating structure is formed [
9]. This structure decays with time due to spontaneous
cis-to-
trans back isomerization of the azomesogens. The decay process is exponential, and the corresponding decay time
τ, as a function of the temperature, exhibits the Arrhenius behavior [
30]. For the investigated LCE material, the value of
τ at room temperature (23 °C) is around 250 min, while at transition temperature
T0 = 81.6 °C, it decreases to about 5 min. The spontaneous decay of the grating structure is of course not suitable for practical applications, but it is very convenient for research purposes, because the one and same sample can be used to perform different experiments. The decay of recorded patterns can be prevented by using photosensitive mesogens with very long lifetimes of the
cis isomer, or by using the light-induced covalent attachment of mesogenic groups to the polymer backbone [
31,
32].
In the experiments performed at room temperature, we first recorded the grating, and then analyzed its diffraction properties as a function of strain. The length of the sample was increased or decreased in steps of few micrometers, corresponding to strain in the interval from 0 to a maximum of 15%. The time interval between subsequent measurements was 1 min, which provided enough time for the equilibration of the structure.
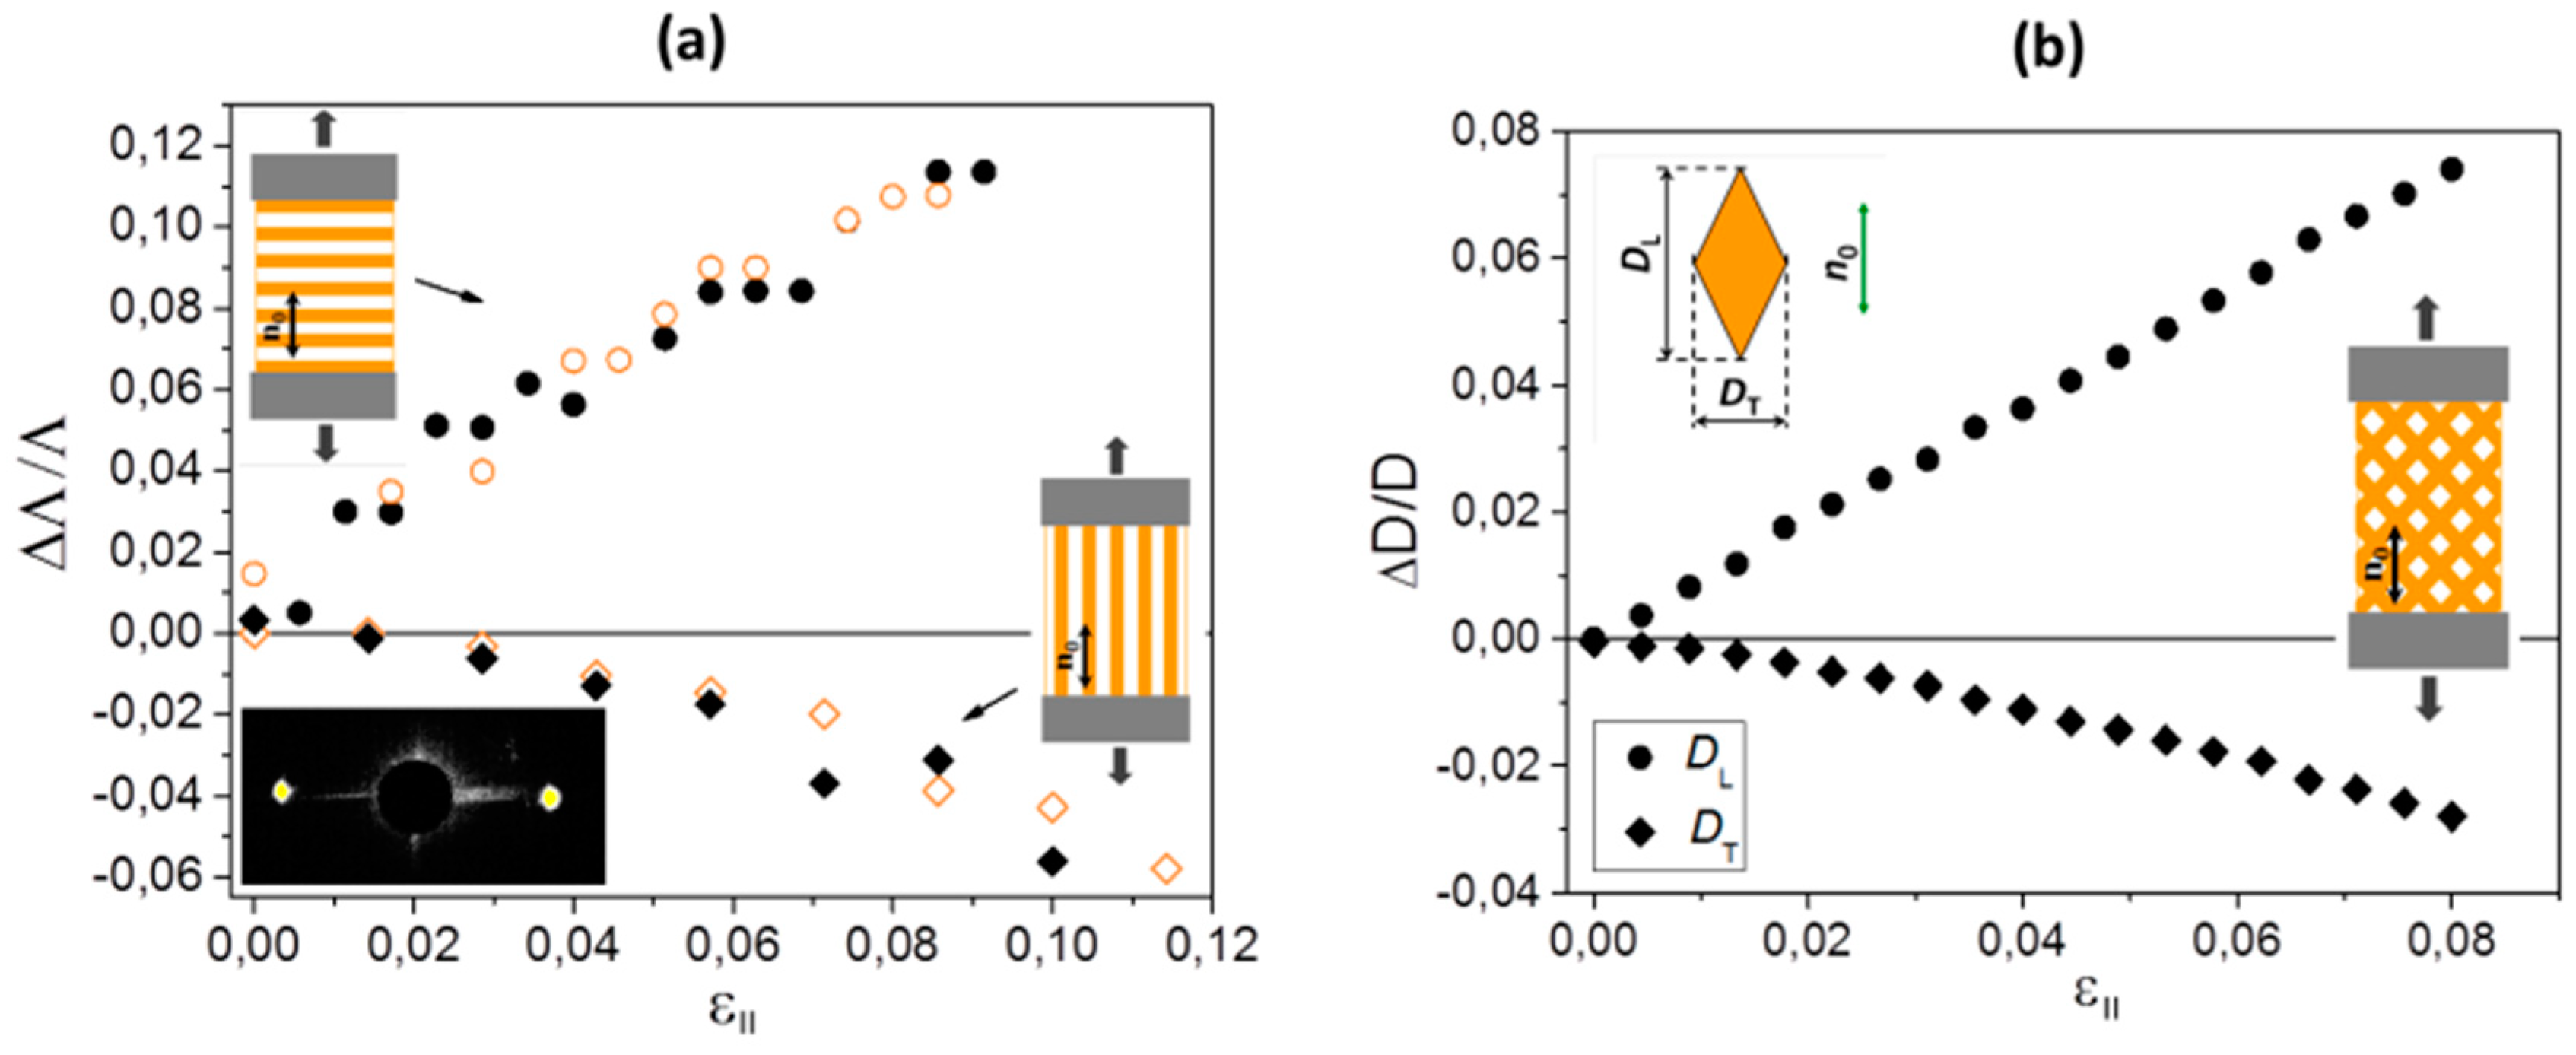
Figure 2a shows the observed dependence of a relative elongation of the lattice period of a one-dimensional grating (line grating) with
Λ = 2.3 μm as a function of the tensile strain
ε∥ applied in the direction parallel to
n0. For modulation along
n0, the value of Δ
Λ/
Λ increases with increasing strain, while for modulation perpendicular to
n0, it decreases with increasing strain. The decrease observed in the latter case is about two times smaller than the increase observed in the former case, which is in agreement with the volume conservation of the material [
1]. The values of Δ
Λ/
Λ obtained during increasing (solid symbols) and decreasing strain (open symbols) are very similar, i.e., the behavior is reversible.
Figure 2b shows the results of an analogous experiment performed with a two-dimensional grating with unit cell dimensions
a = 13.5 μm and
D = 19.1 μm. Due to stretching, the square lattice is transformed to a diamond (rhomboidal) lattice with different unit cell diagonals
DL and
DT in directions parallel and perpendicular to
n0, respectively (see insert). The observed relative modifications Δ
DL/D and Δ
DT/D as a function of
ε∥ are very similar to those obtained for one-dimensional gratings.
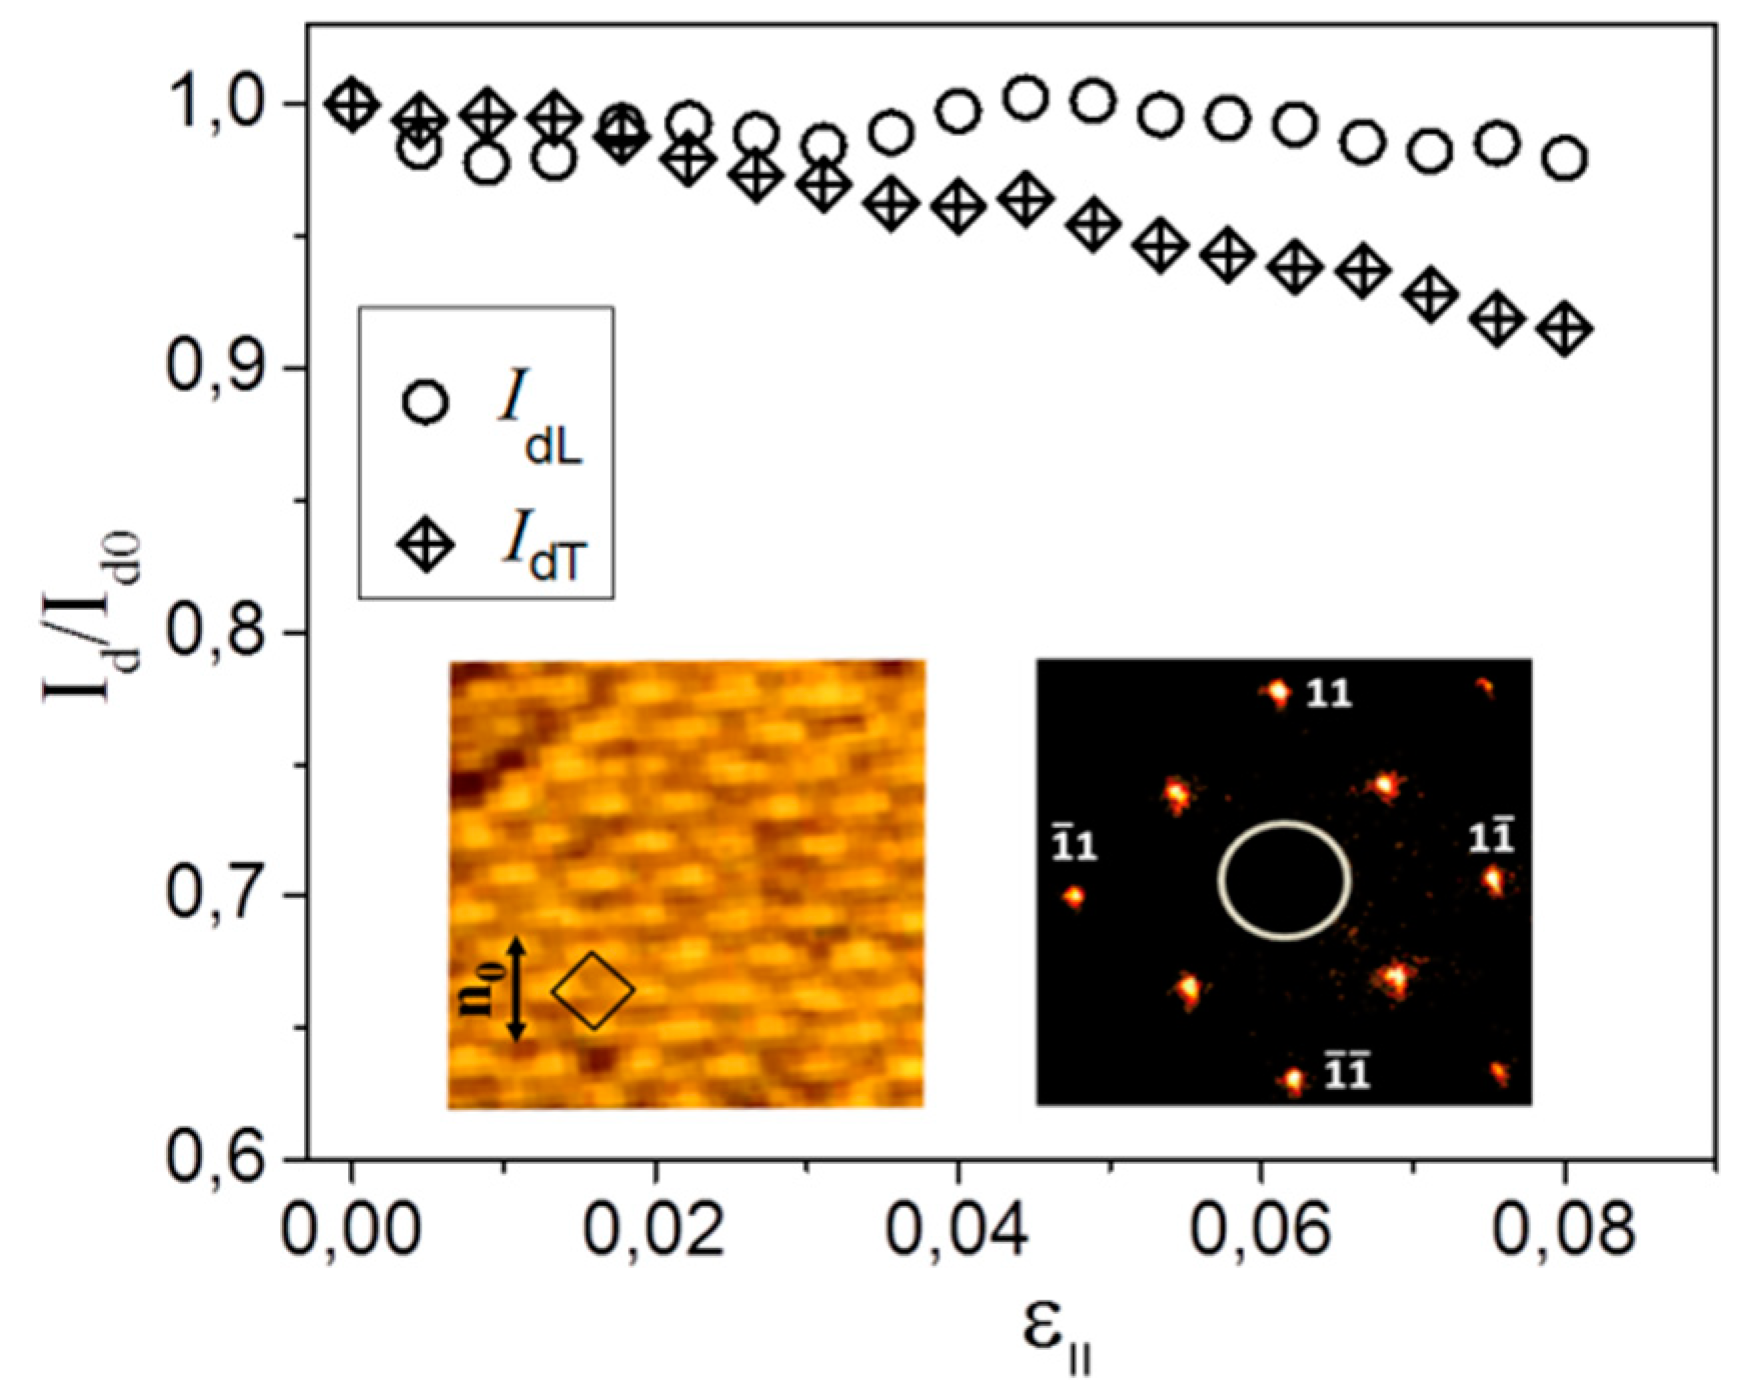
Figure 3 shows the relative intensity of diffraction peaks
Id/
Id0 as a function of
ε∥, where
Id0 denotes diffracted intensity at
ε∥ = 0. The peaks associated with diffraction from diagonal lattice planes separated for
DL/2 (denoted in the insert as peaks
and
) and
DT/2 (peaks
and
) were analyzed. For longitudinal (L) peaks, the intensity is practically constant, while for transversal (T) peaks, it slightly decreases with increasing strain. At this point, it should be mentioned that the data shown in
Figure 3 are already renormalized for the decrease of intensity associated with the
cis-to-
trans back isomerization, i.e., the original measured intensity is multiplied with the factor e
(t/τ), where
τ is the
cis-to-
trans back-relaxation time measured at
ε∥ = 0, and
t is the time passed since switching off the recording beams [
30], so they solely reveal the effects associated with strain.
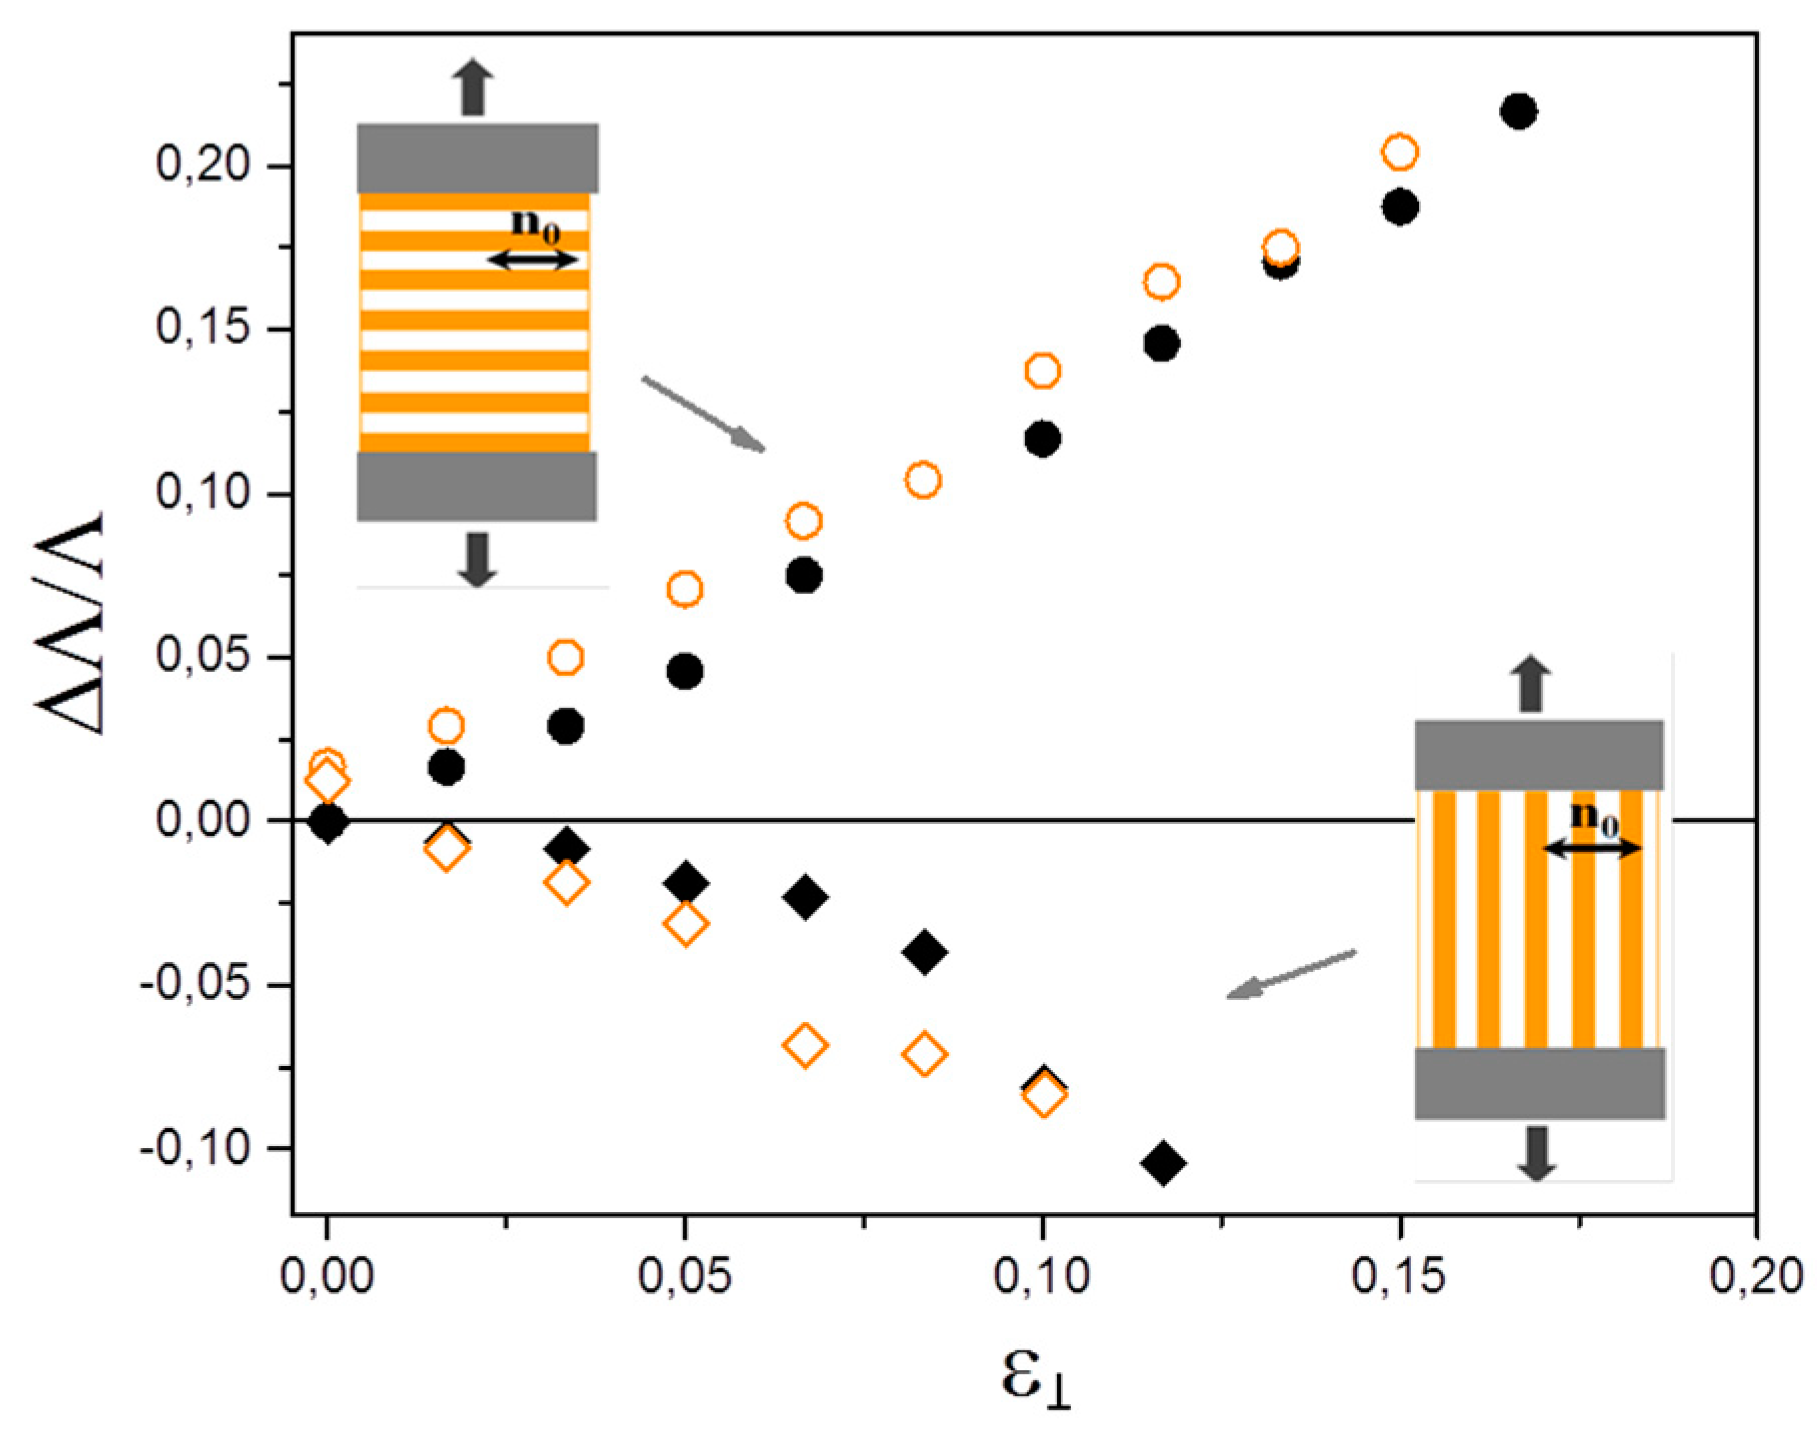
If the film is strained in the direction perpendicular to
n0, strain-induced modifications of the grating periodicity show similar behavior as observed for straining along
n0.
Figure 4 shows the dependence of a relative elongation of the period of a one-dimensional grating with
Λ = 2.5 μm as a function of the tensile strain
ε⊥ applied in the direction perpendicular to
n0. Also in this case, for modulation along
n0, the value of Δ
Λ/
Λ increases with increasing strain, while for modulation perpendicular to
n0, it decreases with increasing strain. However, a decrease observed in the latter case has nearly the same magnitude as the increase observed in the former case, which signifies an asymmetry in the transversal shrinking process. Further studies of grating structures with different values of
Λ are needed to resolve the details of this interesting process. The values obtained during increasing (solid symbols) and decreasing strain (open symbols) are quite similar, but they exhibit some hysteresis.
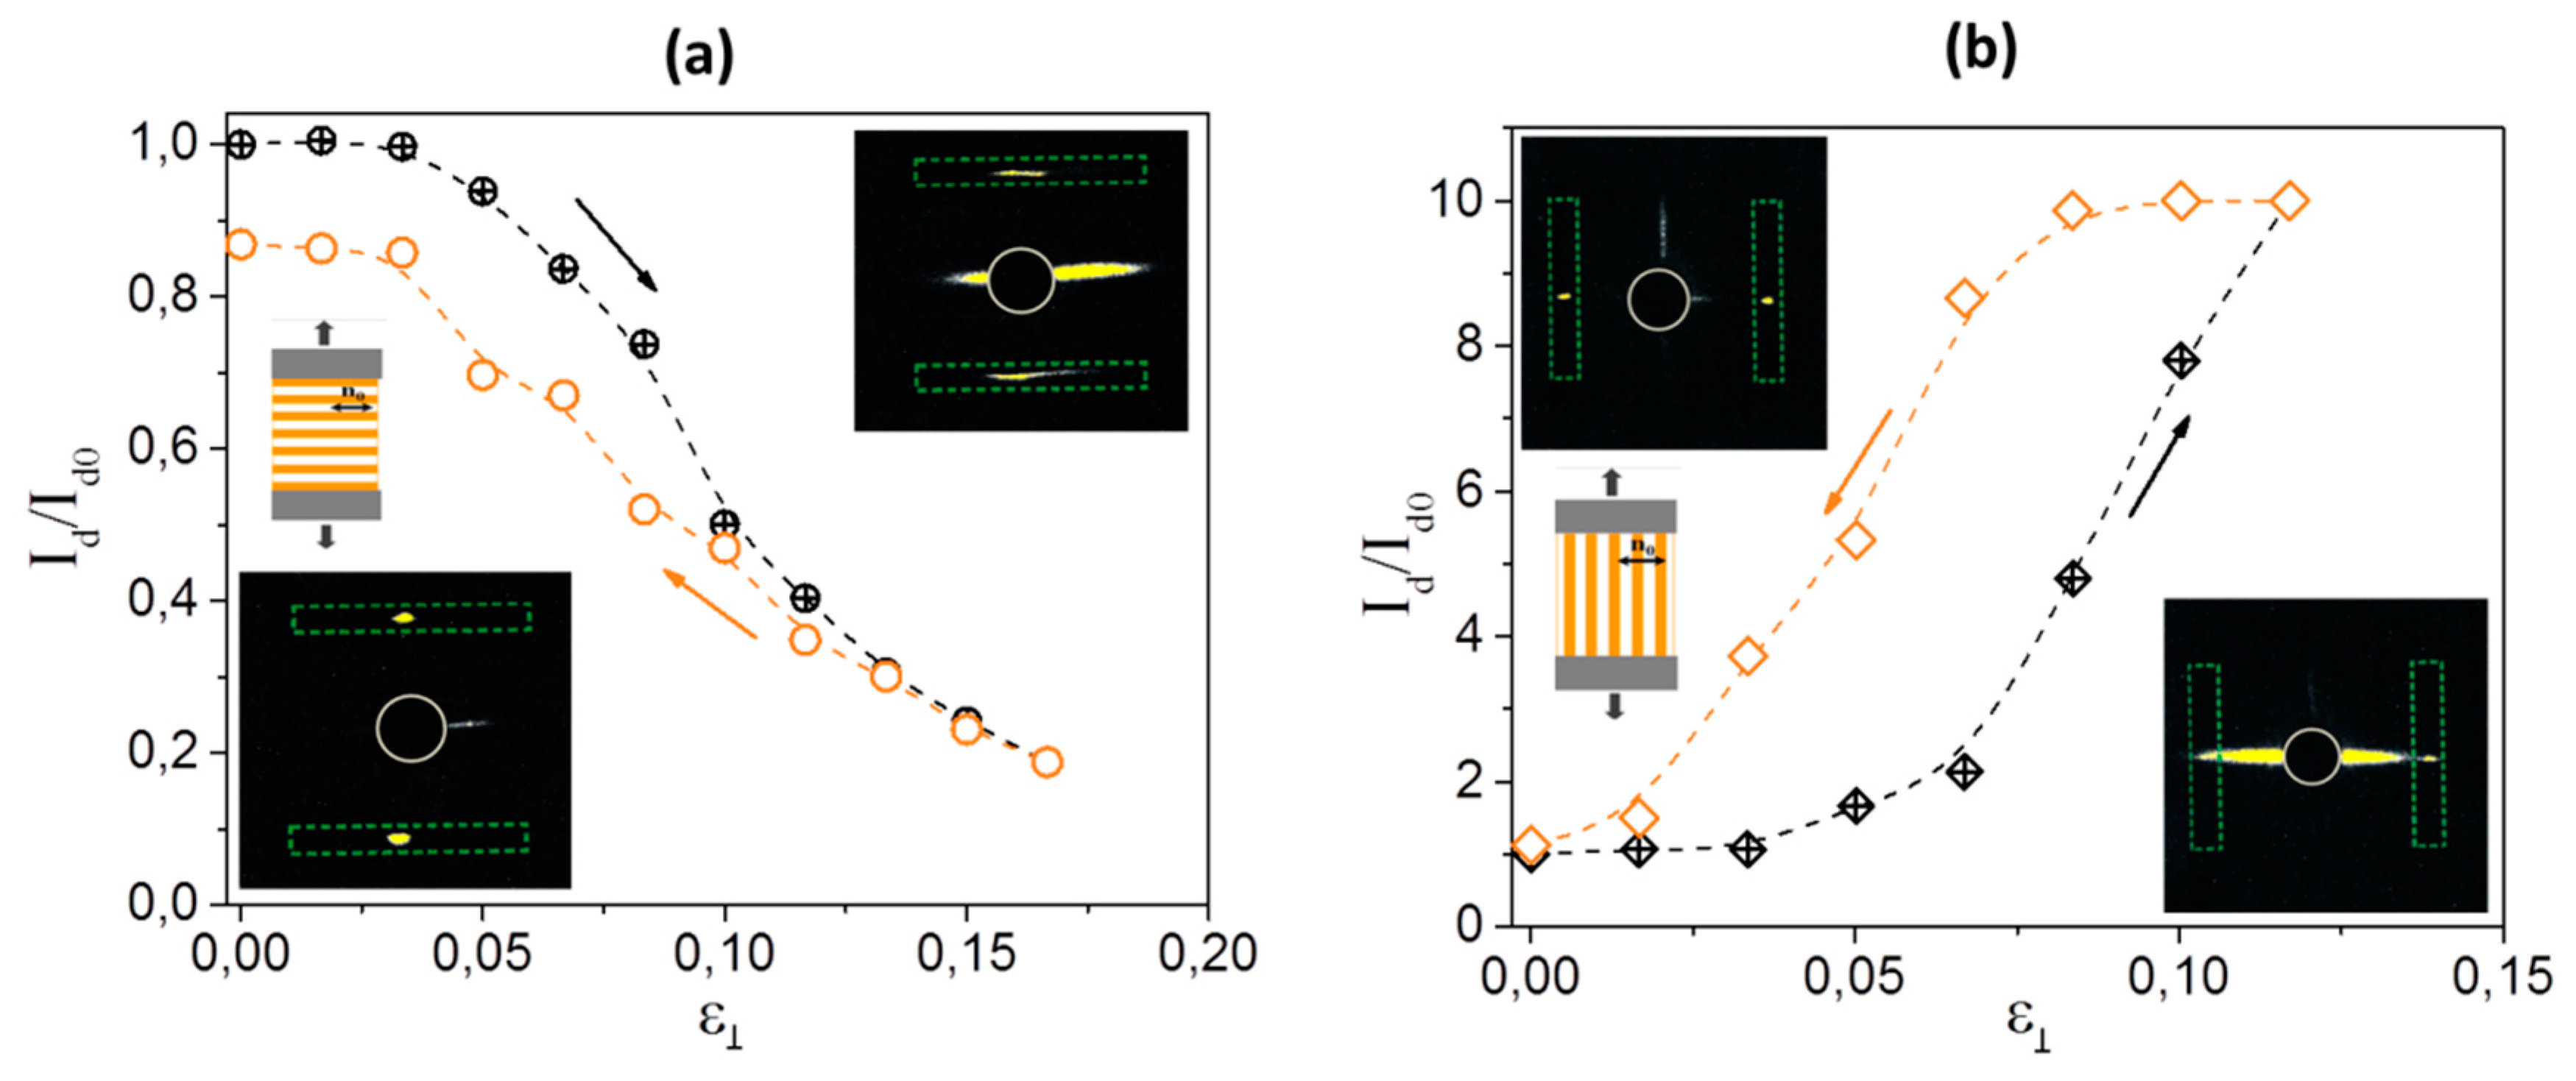
The hysteresis is even more evident in the dependence of the diffracted intensity
Id of the first-order diffraction peaks on
ε⊥ shown in
Figure 5a. The diffracted intensity observed after a full cycle of stretching and contraction of the sample is also about 10% lower than in the beginning. However, the most evident observation of this experiment is that the value of
Id/
Id0 strongly decreases with increasing strain, and drops for about a factor of five during straining from
ε⊥ = 0 to
ε⊥ = 0,17. Another interesting observation is that with increasing strain, the form of the diffraction peaks is transformed from a nearly circular spot to an elongated cloud. This is attributed to the formation of shear–stripe domains that accompany the reorientation process of the director field [
33,
34]. The stripes are oriented perpendicular to
n0, and typically have a thickness of around 10 μm. Consequently, they cause strong light scattering in the direction parallel to
n0 (see insets in
Figure 5a), and therefore, the outgoing peaks become elongated. In determination of the diffraction efficiency, this effect was taken into account by integrating the diffracted intensity in the elongated regions marked as rectangles in the inset of
Figure 5a.
The results obtained for the grating with grating lines parallel to
n0 are shown in
Figure 5b. In this case, the two effects mentioned above are superimposed on each other (see inset of
Figure 5b) and for
ε⊥ ≥ 0.12, it is practically impossible to separate the diffraction from holographic grating from the diffraction from the strain-induced striped structure. For that reason, the measurements of
Id/
Id0 as a function of
ε⊥ were limited to
ε⊥ < 0.12. A profound hysteresis is observed during the stretching–contraction cycle. Besides this, opposite to the situation in
Figure 5a, the value of
Id/
Id0 strongly increases with increasing strain. The increase for a factor of 10 is obtained for straining from
ε⊥ = 0 to
ε⊥ = 0.12. Also in this case, the data shown are already renormalized for the decrease associated with the
cis-to-
trans back-isomerization.
For a square holographic grating with the lattice distance
a = 13.5 μm, the scattering from stripe domains smears out the diffraction from the grating structure already for
ε⊥ ≥ 0.03, which prevents reasonable measurements of the strain-induced effects on the holographic pattern. Consequently, this grating structure was not investigated in the configuration in which the strain is applied perpendicular to
n0. For a specific measurement in the selected sample region, the uncertainty of the experimental data shown in
Figure 2,
Figure 3,
Figure 4 and
Figure 5 is within the size of the data points. However, when measurements are performed in different sample regions, the variations might be larger, as some imperfections and inhomogeneities are usually present within the sample structure.
At temperatures in the vicinity of T0 (81.6 °C), the cis-to-trans back-isomerization of the azomesogens is so fast that systematic measurements of the effect of strain on diffraction properties, as described above, are not possible. Hence, at these temperatures we used another setup, in which the sample was clamped to the frame with two sides and consequently had a fixed length, and we performed in situ monitoring of the tensile force and diffraction intensity during recording and relaxation of the holographic patterns. Before clamping, the sample was slightly prestrained. Also in this case, the measurements were performed in two configurations: for clamping along n0 and for clamping perpendicular to n0.
Figure 6 shows the results obtained for clamping along
n0 at
T = 75 °C. One-dimensional UV interference pattern with
Λ = 9.5 μm was recorded.
Figure 6a shows relative modifications of the force Δ
F/
F0 as a function of time obtained for three different prestraining forces
F0 applied to the film. The value
F0 = 1 mN corresponds to the tensile stress of
σ ~ 2 kPa. The exact value of
σ is difficult to be determined, because clamping affects the cross-section of the film. The tensile force
F increases during the recording process (0 < t < 5 min), while after switching off the UV light, it decreases back to the initial value. The relaxation process is monotonic, and takes place in two stages: a fast one on a time scale of seconds, which is attributed to thermal effects, and a slower one on a time scale of minutes, which is attributed to
cis-to-
trans back isomerization.
Figure 6b shows the temporal dependence of diffracted intensity
Id of the probe beam. Despite the sample being clamped at two opposite edges and hence being unable to be shrunk due to UV illumination, the value of
Id strongly fluctuates during the recording process. The fluctuations differ from one recording process to another, and are in general larger at larger clamping forces. They are attributed to inhomogeneous modifications of the material structure during the illumination. Regions of film that are slightly softer than the surrounding expand on behalf of the harder regions. If the structure is fully homogeneous, contraction cannot happen due to clamping. However, if some parts of the sample are softer than others, the softer parts can extend so that the harder ones can shrink, but the entire sample length remains the same. Consequently, the recording medium moves with respect to the interference pattern. The effect is similar to the fluctuations caused by vibrations in the optical setup [
35]. The two effects are difficult to be resolved from each other. Consequently, it is difficult to compare the values of diffracted intensity observed at the end of subsequent recording processes with each other; therefore, we show absolute instead of relative results. However, after the UV beams are switched off, the behavior observed for all three cases is very similar, and exhibits an increase of diffraction intensity known as “dark hologram enhancement effect”. This effect is associated with a strongly nonlinear relationship between the concentration of the
cis azo-mesogens
Nc and the nematic order parameter
S that is characteristic for temperatures in the vicinity of
T0, which was extensively discussed in our previous work [
10]. The present study reveals that the enhancement significantly increases with the increasing prestraining force
F0.
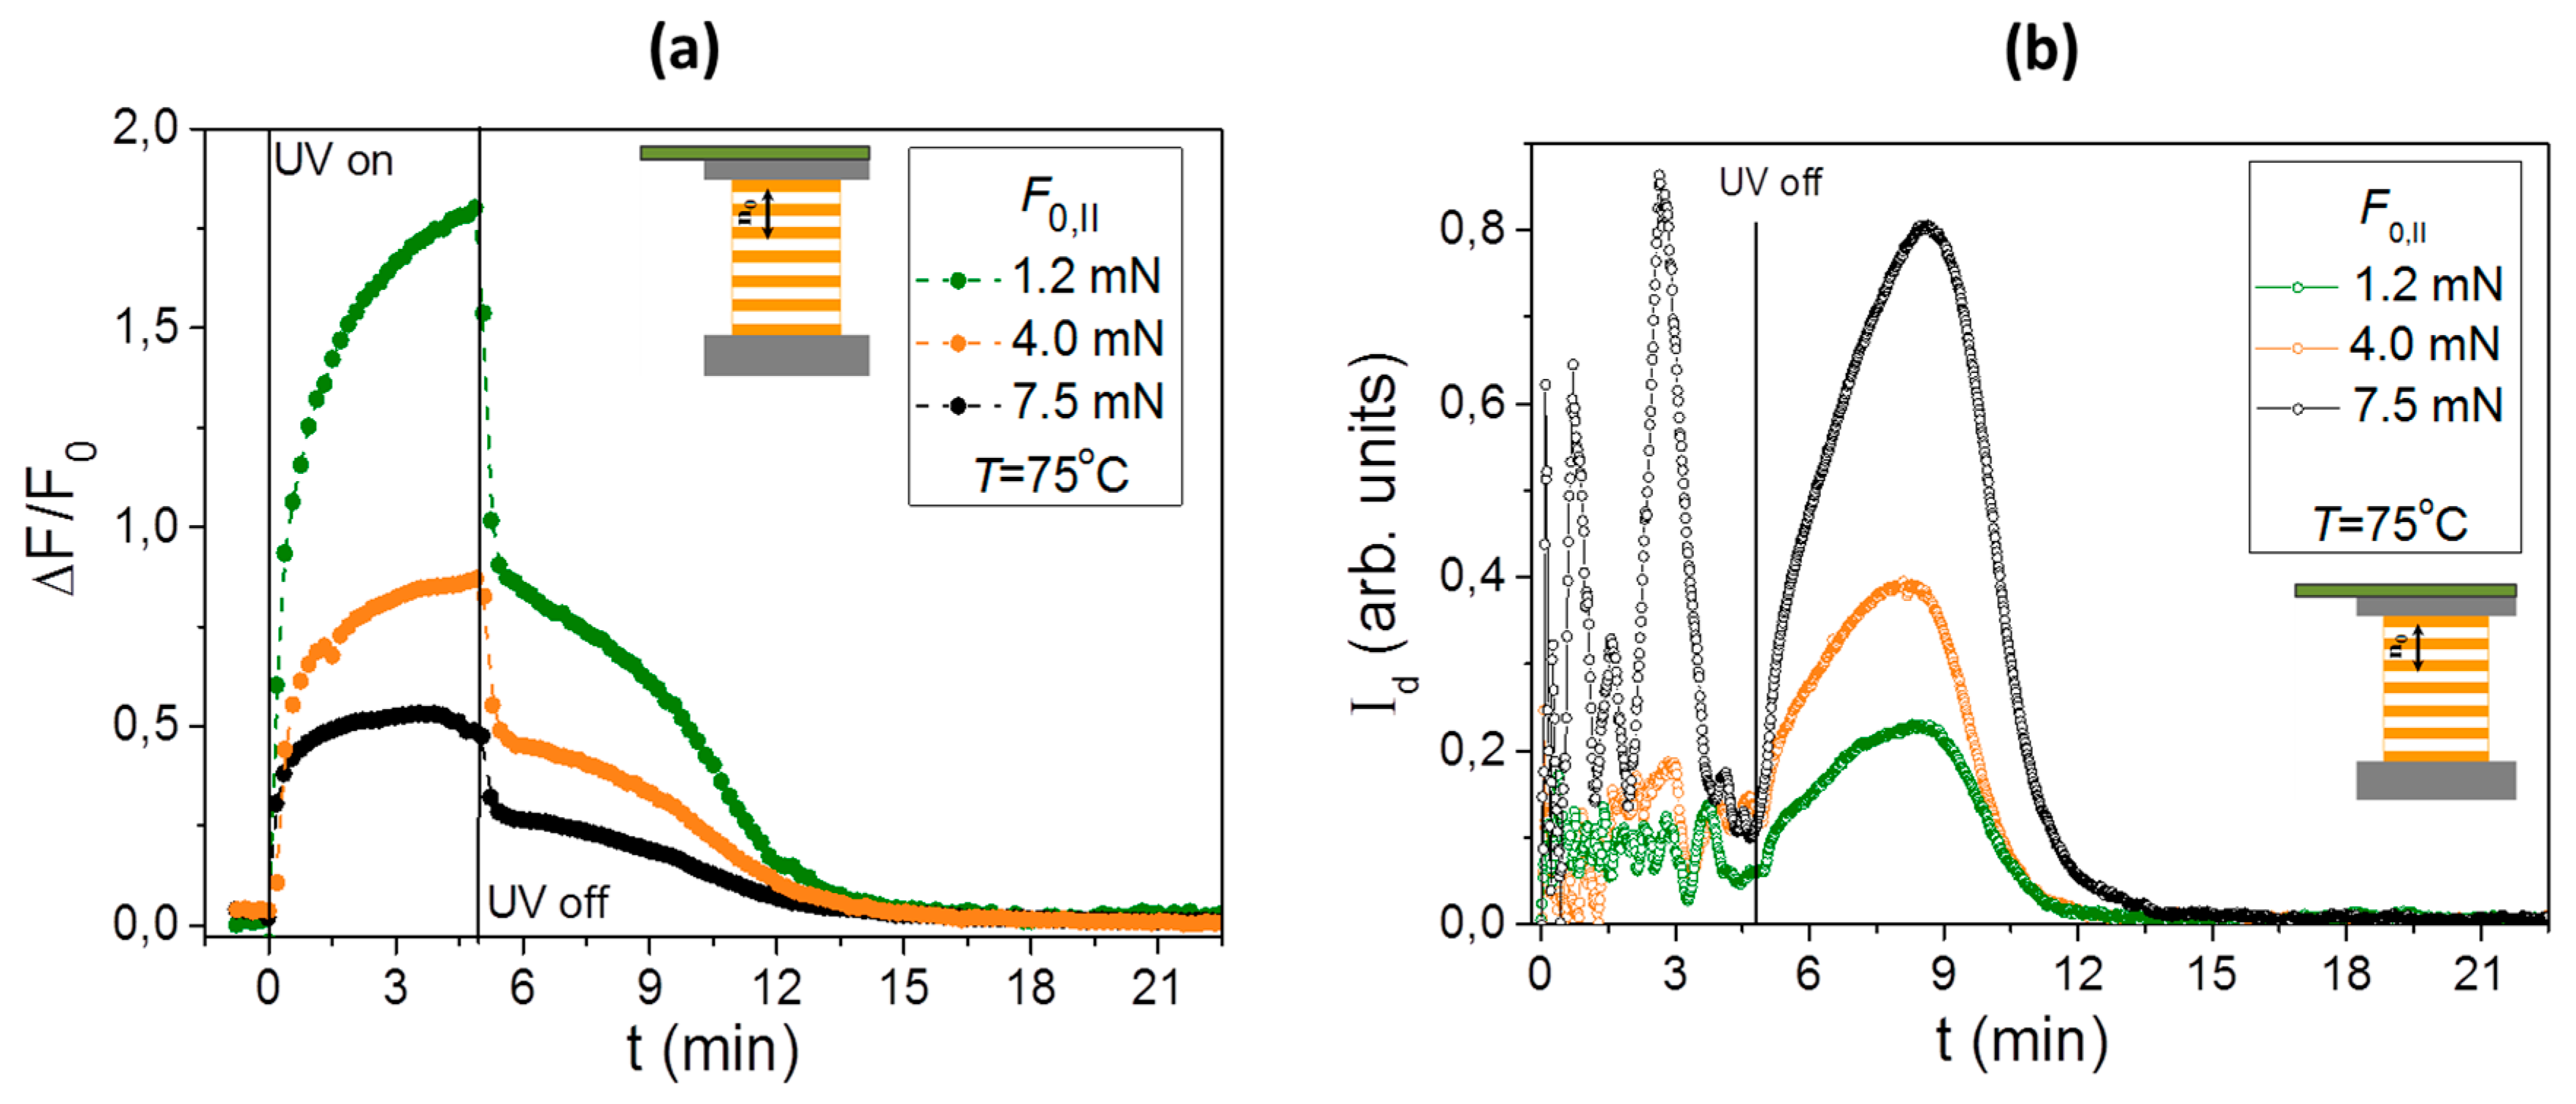
The results of an analogous experiment with straining in the direction perpendicular to
n0 are shown in
Figure 7. The observed features are very similar to those obtained for straining along
n0. Only the sign of the force modifications Δ
F/
F0 is opposite, which means that the tensile force decreases during UV illumination. The graphs for Δ
F/
F0 and
Id as a function of time are plotted together.
Figure 7a shows the results obtained for a recording time of 3 min, and
Figure 7b shows the results for a recording time of 15 min. Modifications of Δ
F/
F0 saturate at Δ
F/
F0 ~ −0.8, which corresponds to the net tensile force
F = 0.2
F0 being present in the sample after a prolonged UV illumination. After switching off the UV beams, a two-stage relaxation process takes place again. The effect of dark hologram enhancement is slightly smaller than for clamping in the direction parallel to
n0, but otherwise, the observed behavior of
Id(
t) is very similar and exhibits similar characteristic times.
4. Discussion
In the following, we present a qualitative explanation of the effects of
ε∥ and
ε⊥ on refractive index modulation in a monodomain nematic LCE film. As shown in our recent paper [
10], the temperature dependence of the order parameter
S(
T) and consequently also of the extraordinary refractive index
ne(
T,
T0) of such a film can be described by the heuristic function that is in agreement with the Landau theory of supercritical phase transitions [
9,
36]:
where
is dielectric permittivity in the paranematic phase (
T >>
T0), and
β is determined by the molecular anisotropy. The values of material parameters
γ and
B for the investigated material were obtained from the experimental data on the spontaneous elongation of the sample during cooling from the paranematic to the nematic phase, and are
γ = 4.8 and
B = 29 [
10]. The values of the parameters
A and
can be deduced from the values of refractive indices of the material at room temperature and at
T >>
T0. For side-chain LCE materials of the type as the one used in our study, those values are
ne(
T >>
T0) ~
no(
T >>
T0) = 1.58,
ne(
T0 − 50 °C) = 1.66, and
no(
T0 − 50 °C) = 1.54 [
37,
38], which gives
= 2.5 and
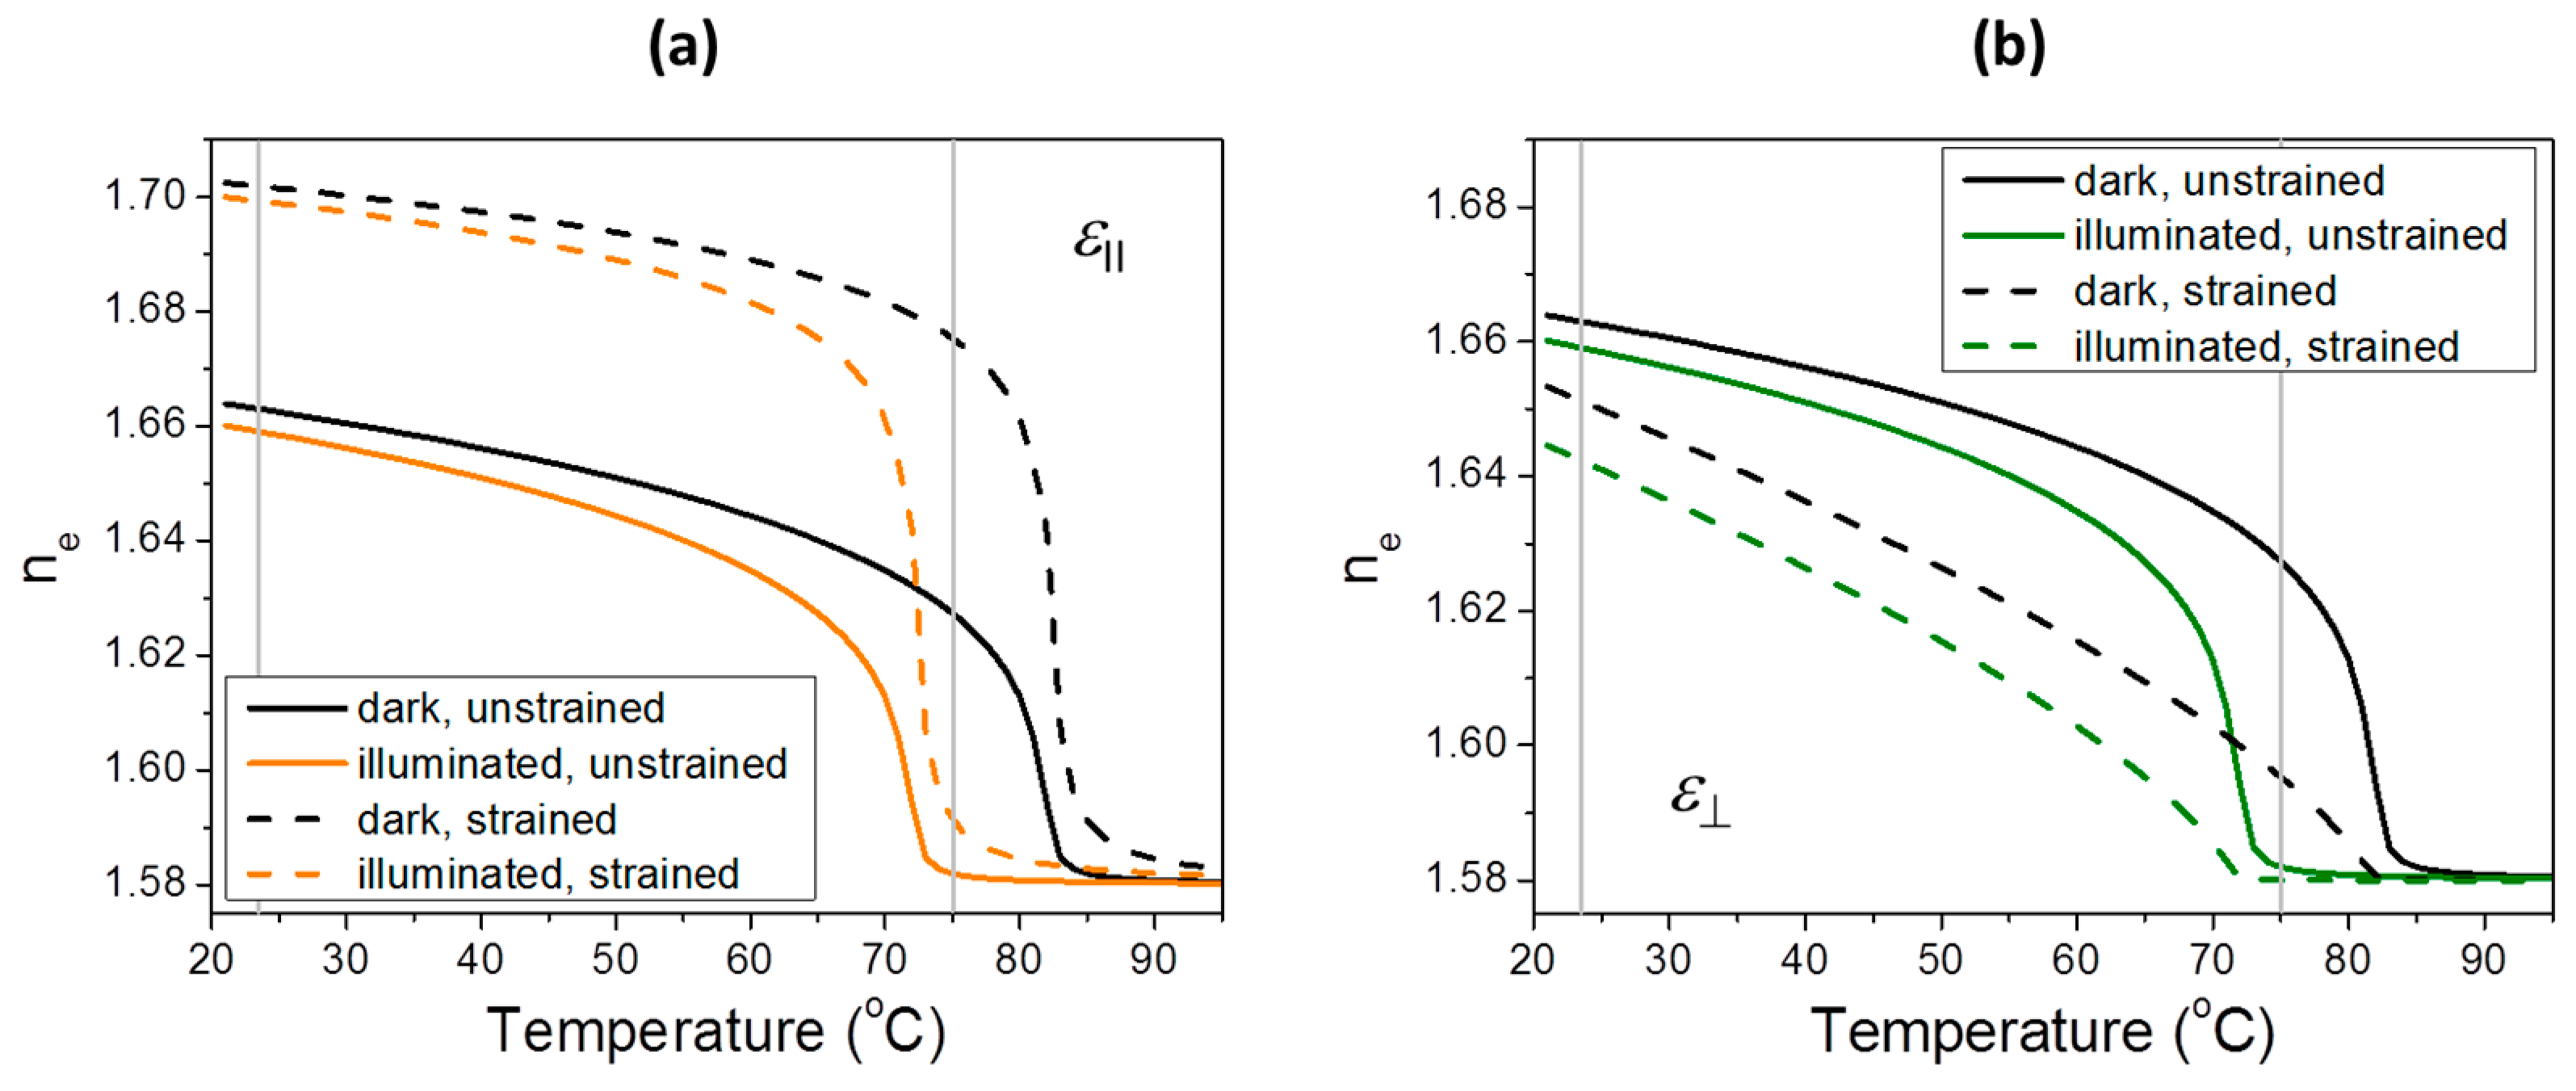
A = 0.077. The resulting dependence of
ne(
T,
T0) is shown as the black solid line in
Figure 8a.
The effect of UV illumination-induced
trans-to-
cis isomerization on
ne(
T) can be modeled as a decrease of the transition temperature
T0’ =
T0 −
CcNc, where
Cc is a proportionality constant [
18]. The corresponding dependence of
ne(
T,
T0’) for
T0’ =
T0 − 10 °C, which is typically realized in the experiments, is shown as the orange solid line in
Figure 8a. The vertical difference between the two curves, namely Δ
ne(
T) =
ne(
T,
T0) −
ne(
T,
T0’), corresponds to the refractive index modulation between the dark and the UV-illuminated regions of the unstrained sample.
The effect of
ε∥ (and of the corresponding stress
σ∥), which adds up to the intrinsic strain imposed during the fabrication process, can be modeled as a decrease of the critical exponent
ζ = 1/(
γ − 1). In addition to this, the value of
A needs to be modified due to the strain-induced increase of the order parameter that can be described as Δ
S = Cεε∥, where
Cε is the proportionality constant dependent on the properties of the polymer network [
39]. This effect in general results in the increase of
ne with increasing
ε∥ [
40]. To illustrate the resulting behavior, the dependences of
ne(
T,
T0,
ε∥) and
ne(
T,
T0’,
ε∥) corresponding to
γ’ = 2
γ = 9.6 and
A’ = 3
A = 0.23 for the unilluminated and for the UV-illuminated strained material are shown as dashed lines in
Figure 8a. Also in this case, the vertical difference between the two (dashed) curves Δ
ne(
T,
ε∥) =
ne(
T,
T0,
ε∥) −
ne(
T,
T0’,
ε∥) gives the refractive index modulation between the dark and the UV-illuminated regions of the strained sample.
By comparing the vertical separation between the two solid and the two dashed lines, one can notice that at room temperature (23 °C), the modulation of
ne in the strained material is smaller than in the unstrained material, which is in agreement with the experimentally observed decrease of the diffraction efficiency shown in
Figure 3. In contrast, at
T = 75 °C, the modulation of
ne in the strained material is larger than in the unstrained material, which is in agreement with the results shown in
Figure 6b. Therefore, the above described model can well explain the effect of
ε∥ on the diffraction efficiency of the grating structures in LS-LCEs.
Straining in the direction perpendicular to
n0 in its initial stage (before reaching the plateau region in the
σ(
ε⊥) curve) causes a decrease of the internal strain, and consequently also a decrease of the order parameter
S [
39]. This corresponds to the increase of the critical exponent
ζ= 1/(
γ − 1) and the decrease of the parameter
A in Equation (4). To illustrate the associated effects, the dependences of
ne(
T,
T0,
ε⊥) and
ne(
T,
T0’,
ε⊥) corresponding to
γ’ =
γ/2 = 2.4 and
A’ =
A/10 = 0.008 for the unilluminated and for the UV-illuminated strained material are shown as dashed lines in
Figure 8b. The vertical difference between the two (dashed) curves Δ
ne(
T,
ε⊥) =
ne(
T,
T0,
ε⊥) −
ne(
T,
T0’,
ε⊥) is again expected to describe the refractive index modulation between the dark and the UV-illuminated regions of the strained sample. Consequently, it follows that at room temperature, the refractive index modulation and consequently also the diffraction efficiency in the strained sample should be larger than in the unstrained sample, while at
T = 75 °C, it should be vice versa.
However, the experimental results on the influence of
ε⊥ (and of the corresponding stress
σ⊥) on the diffraction efficiency of the grating structures are quite different from the predictions described above. We attribute this discrepancy to the formation of shear–stripe domains [
34,
41,
42], which is not at all included in the presented model. The domain structure causes an additional refractive index modulation that competes with the modulation induced by the holographic patterning. The shear–stripe domains are always oriented along the straining direction. The experimental results shown in
Figure 5 suggest that when those domains are oriented perpendicular to the line patterning from the holographic structure, they cause a reduction of the diffraction efficiency from the holographic pattern. In contrast, when they are oriented parallel to the line patterning from the holographic structure, both modulations constructively support each other, and consequently, the diffraction efficiency is considerably increased.
The width of the stripe domains increases with the increasing temperature and in the vicinity of
T0, the sample area probed by the probe beam is more or less in a single domain state [
34]. Consequently, the influence of domains on the diffraction efficiency is expected to decrease by the increasing temperature. This is in agreement with the results shown in
Figure 6 and
Figure 7, which reveal that at
T = 75 °C, the diffraction effects observed for
ε⊥ and
ε∥ are quite similar.


 and
and 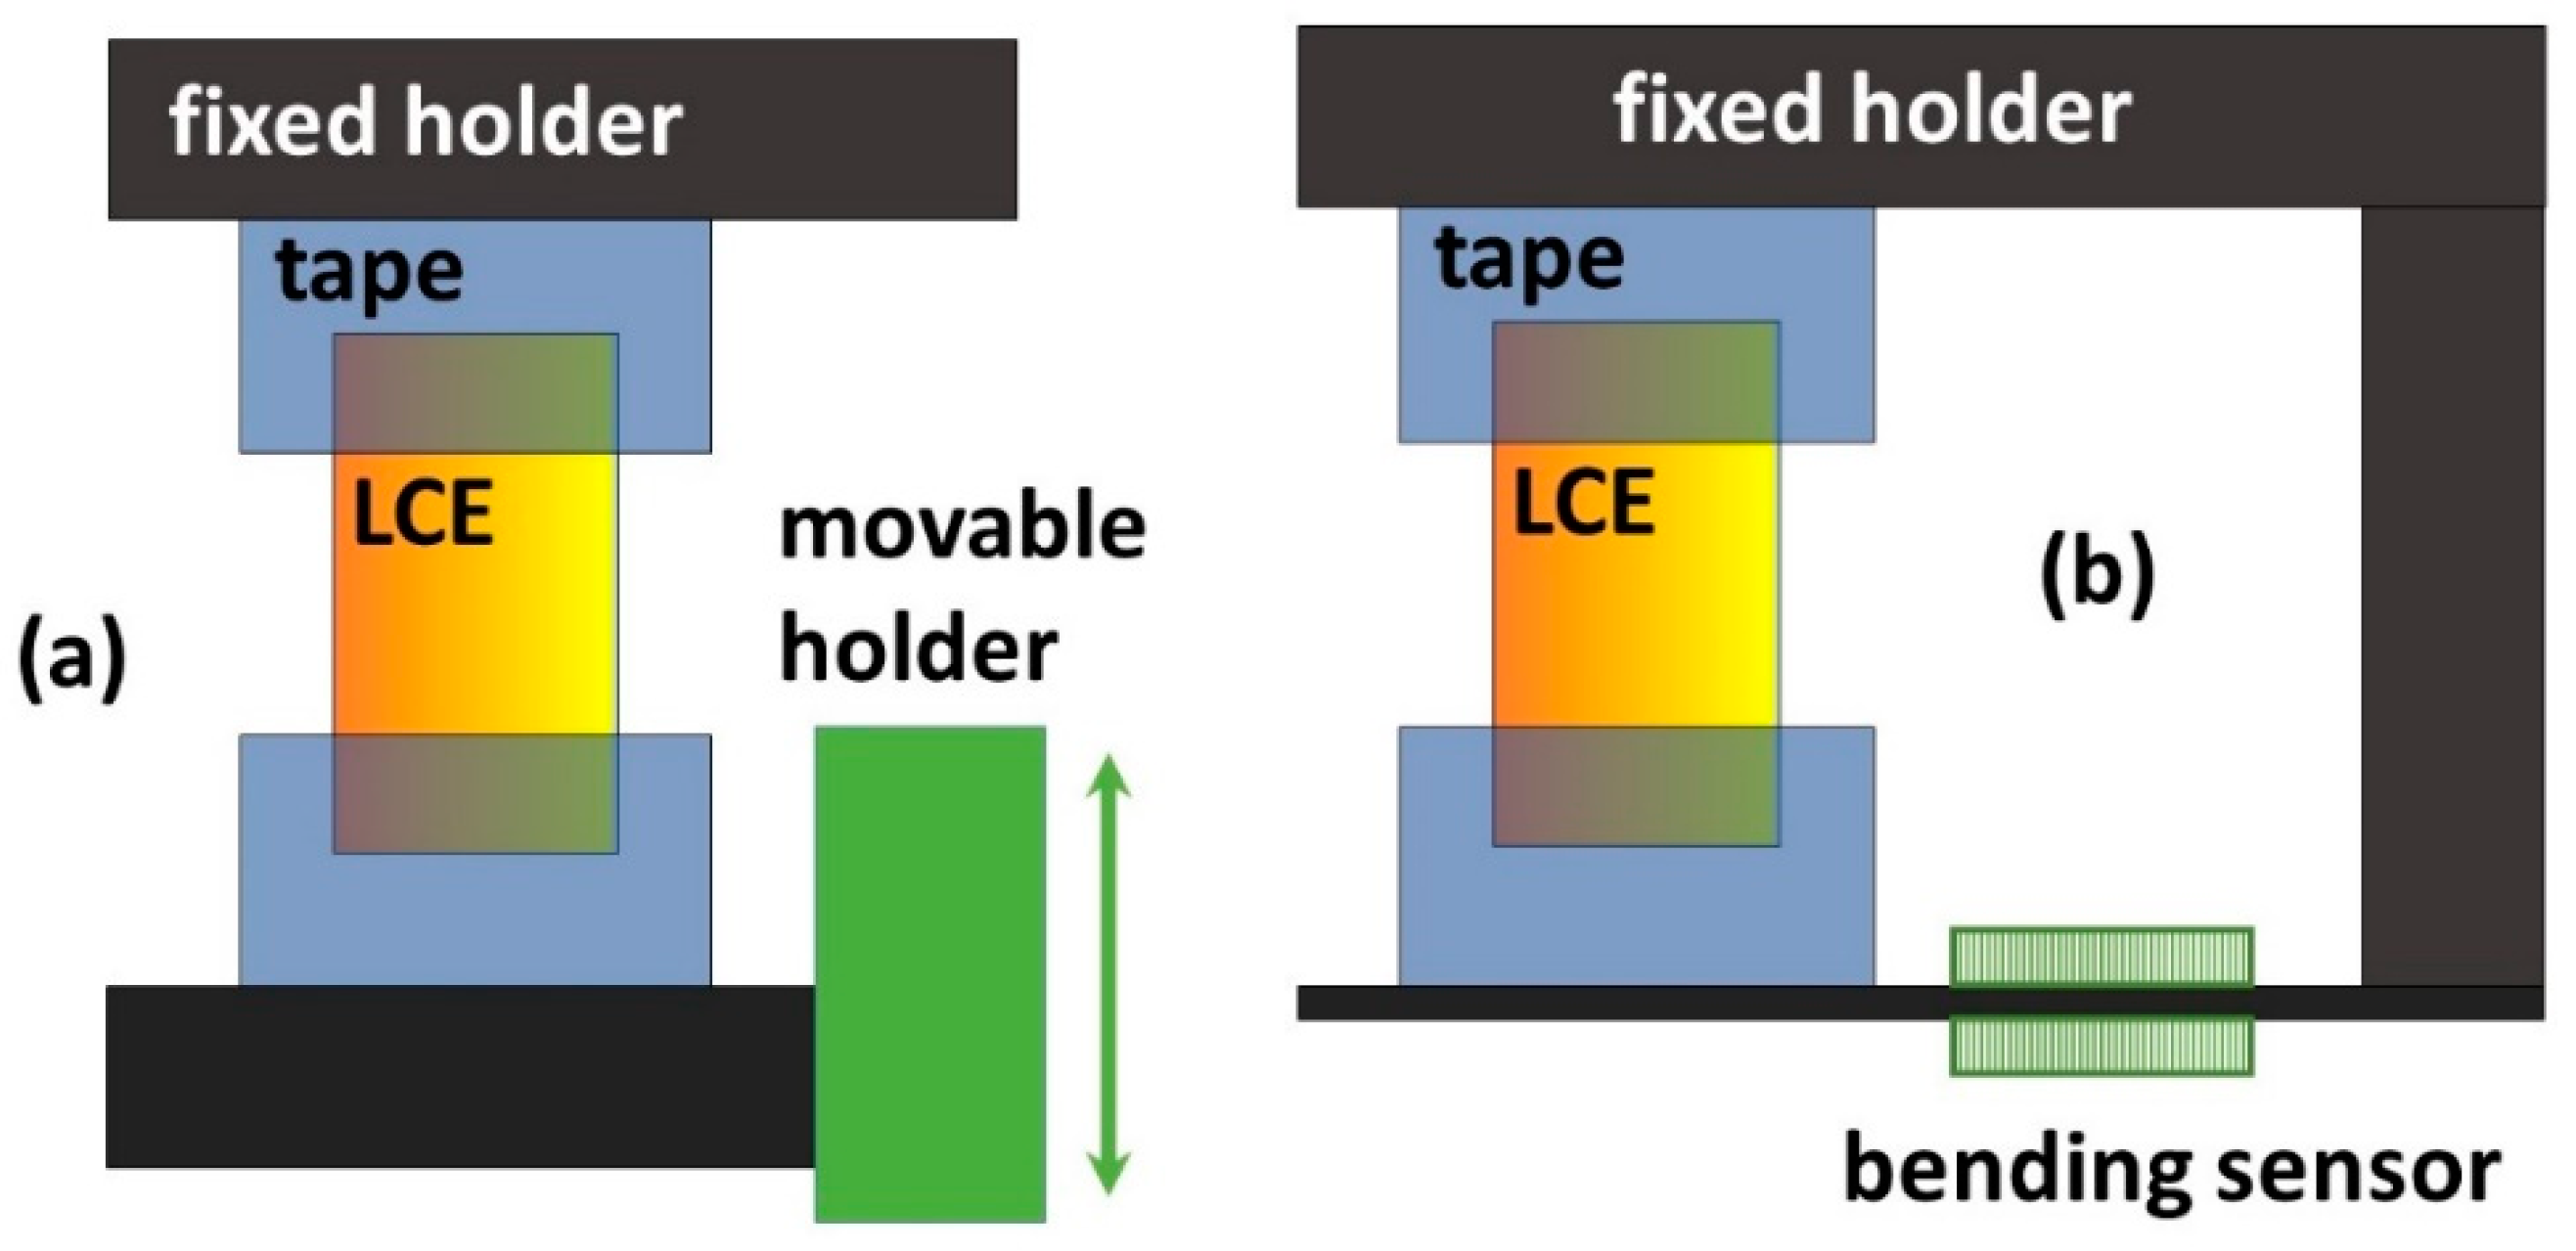