Long-Term Monitoring of Radiocesium Concentration in Sediments and River Water along Five Rivers in Minami-Soma City during 2012–2016 Following the Fukushima Dai-ichi Nuclear Power Plant Accident

Abstract
:Featured Application
Abstract
1. Introduction
2. Materials and Methods
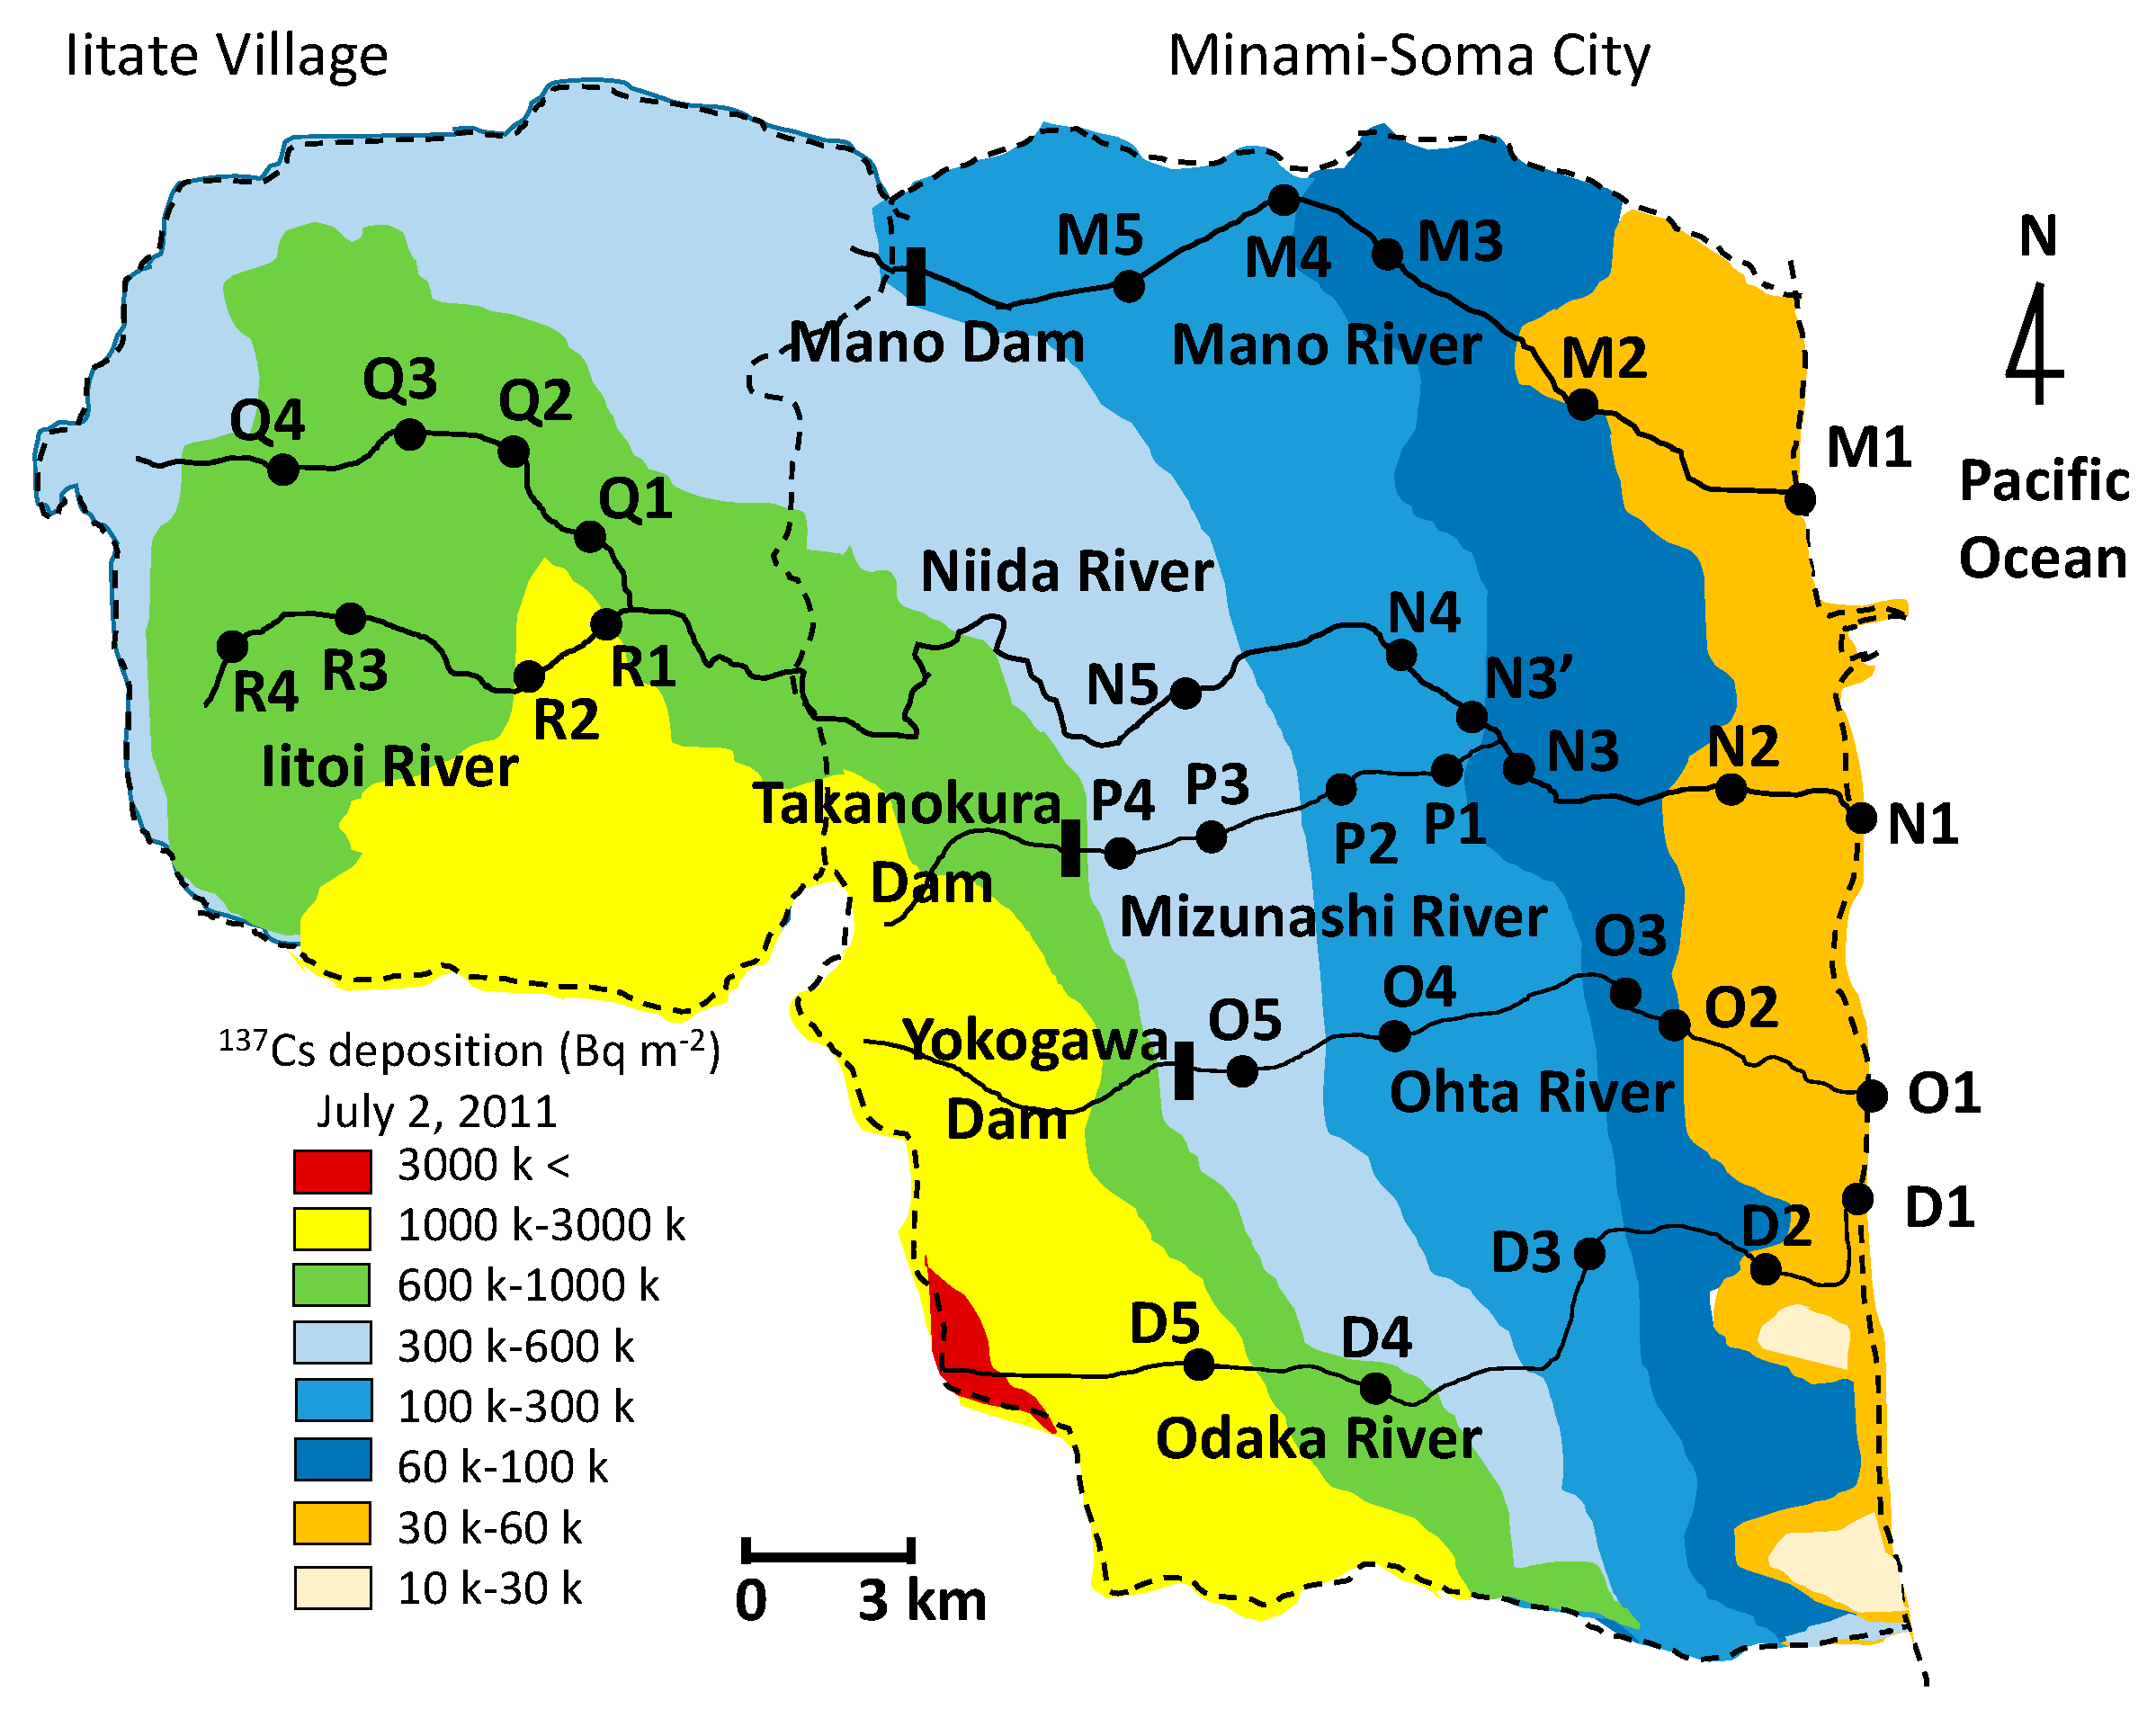
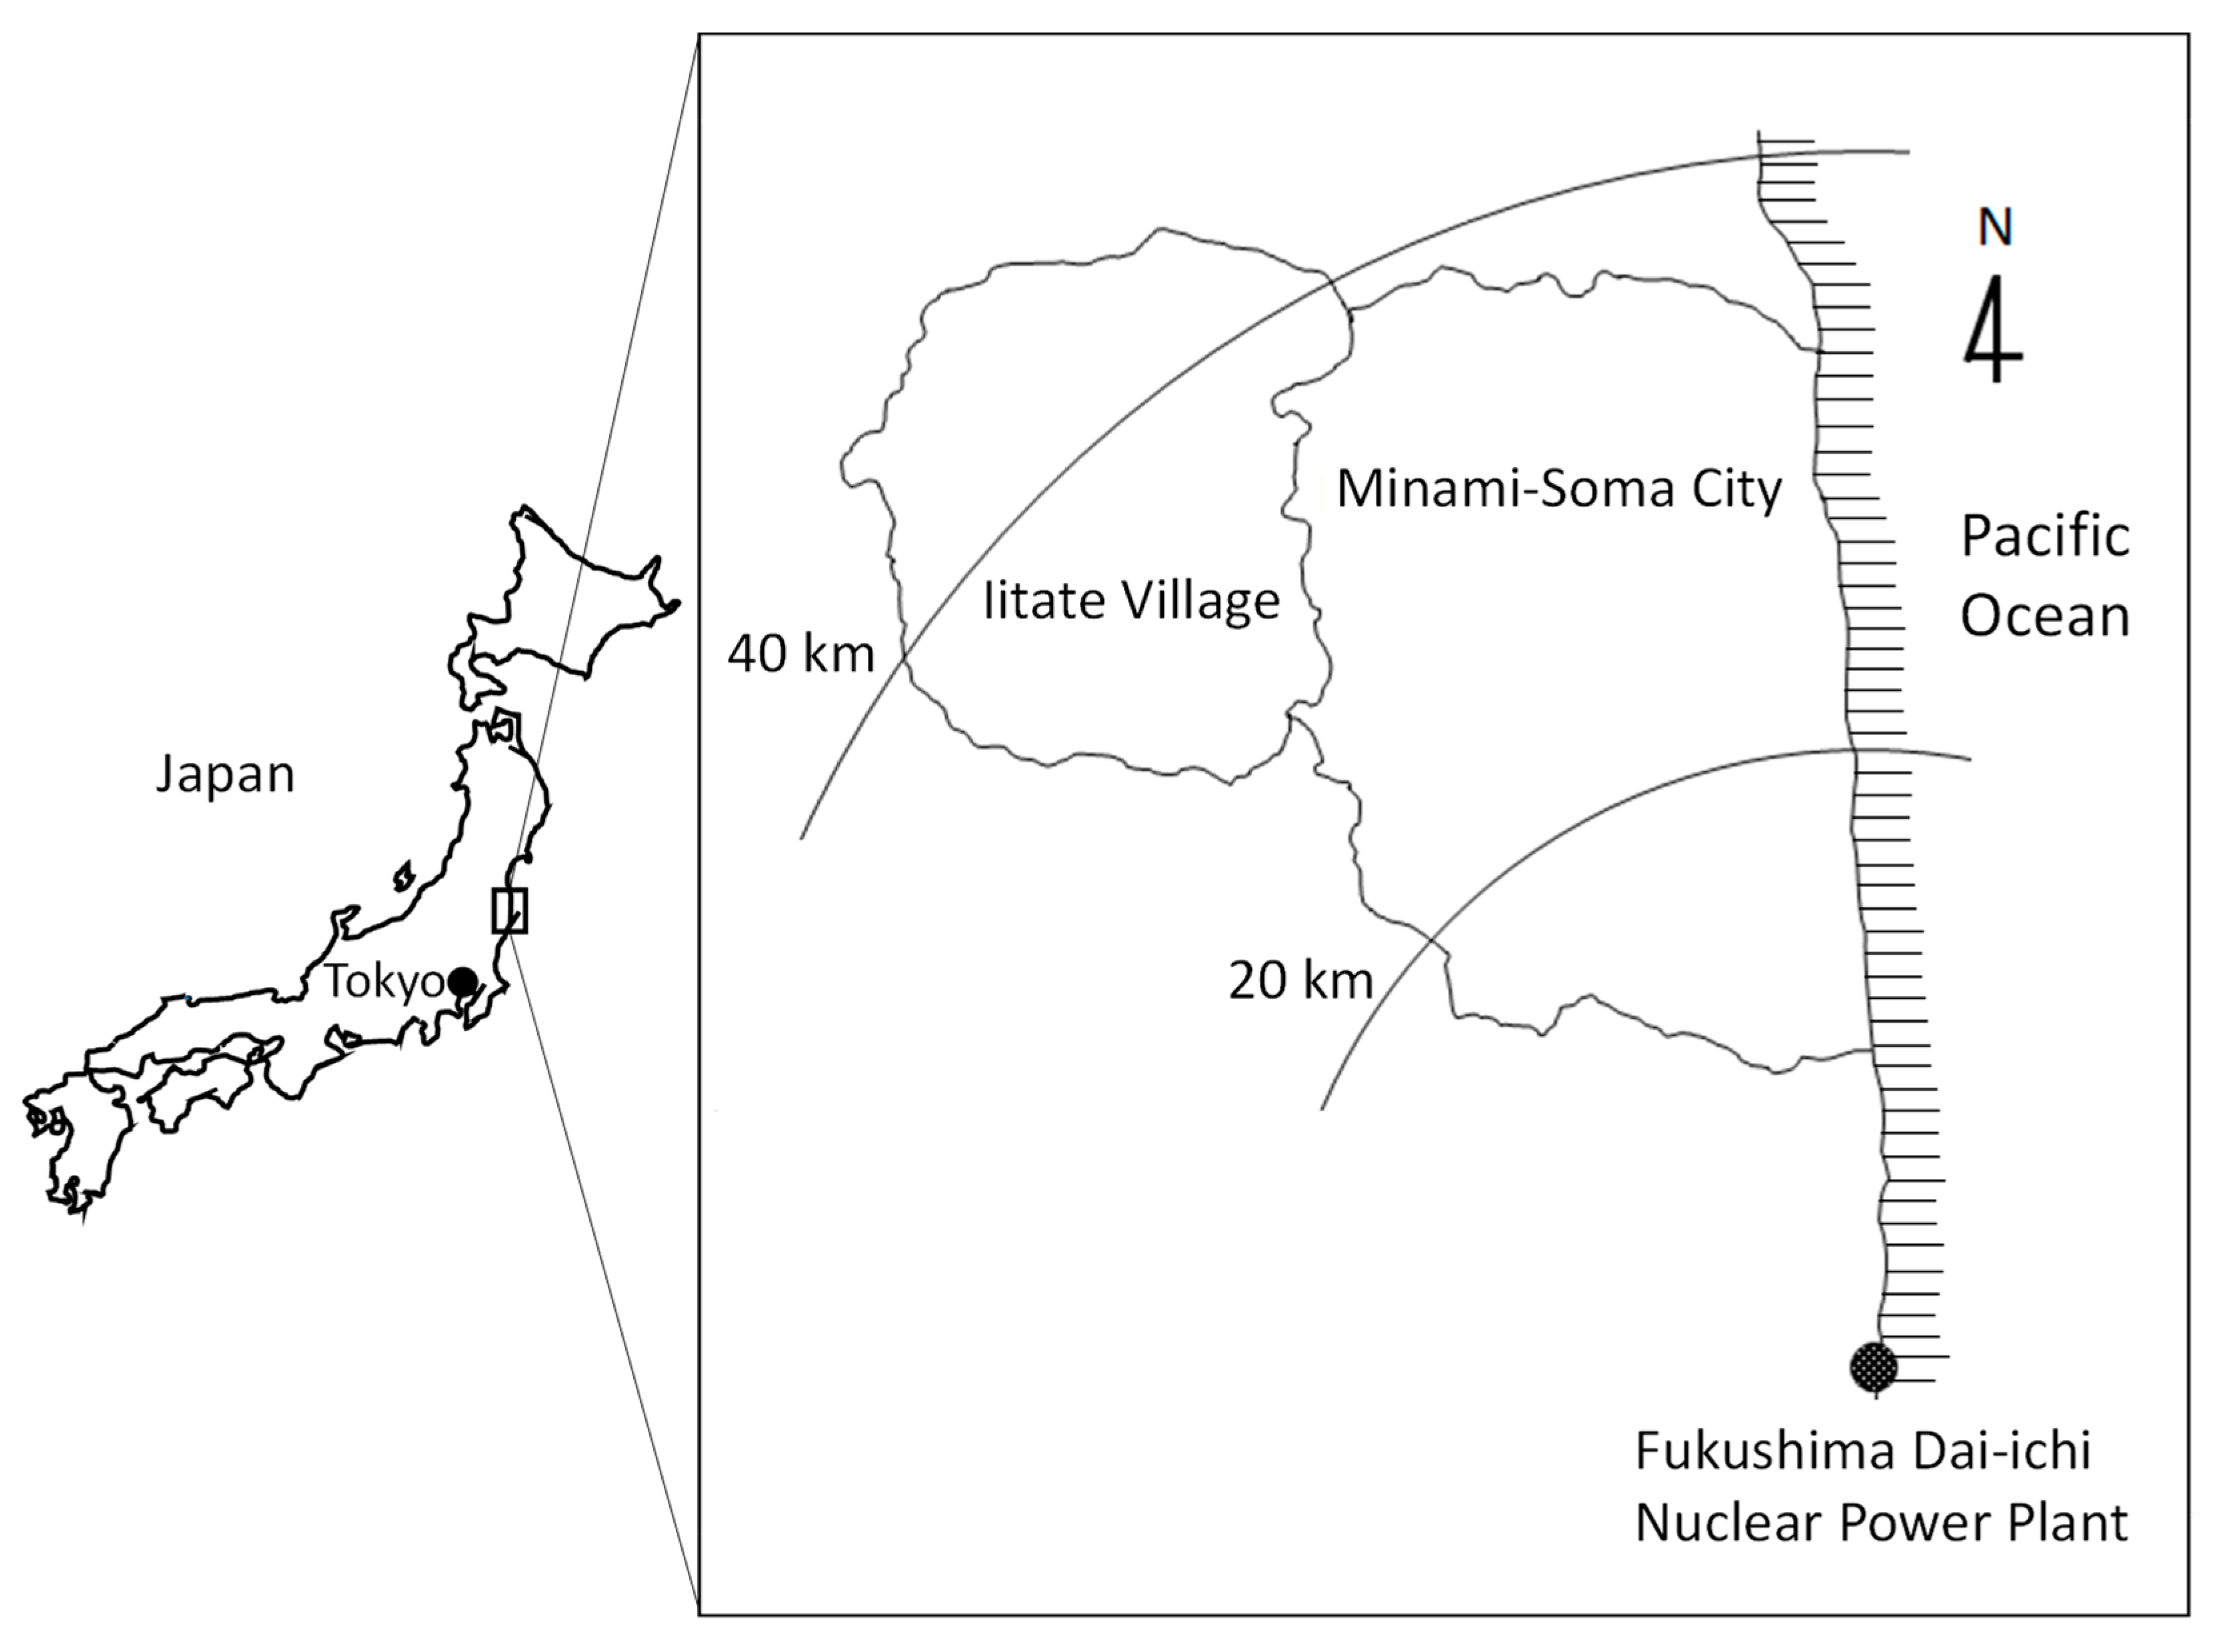
2.1. Study Sites and Sampling
2.2. Sample Preparation and Gamma-Ray Measurement
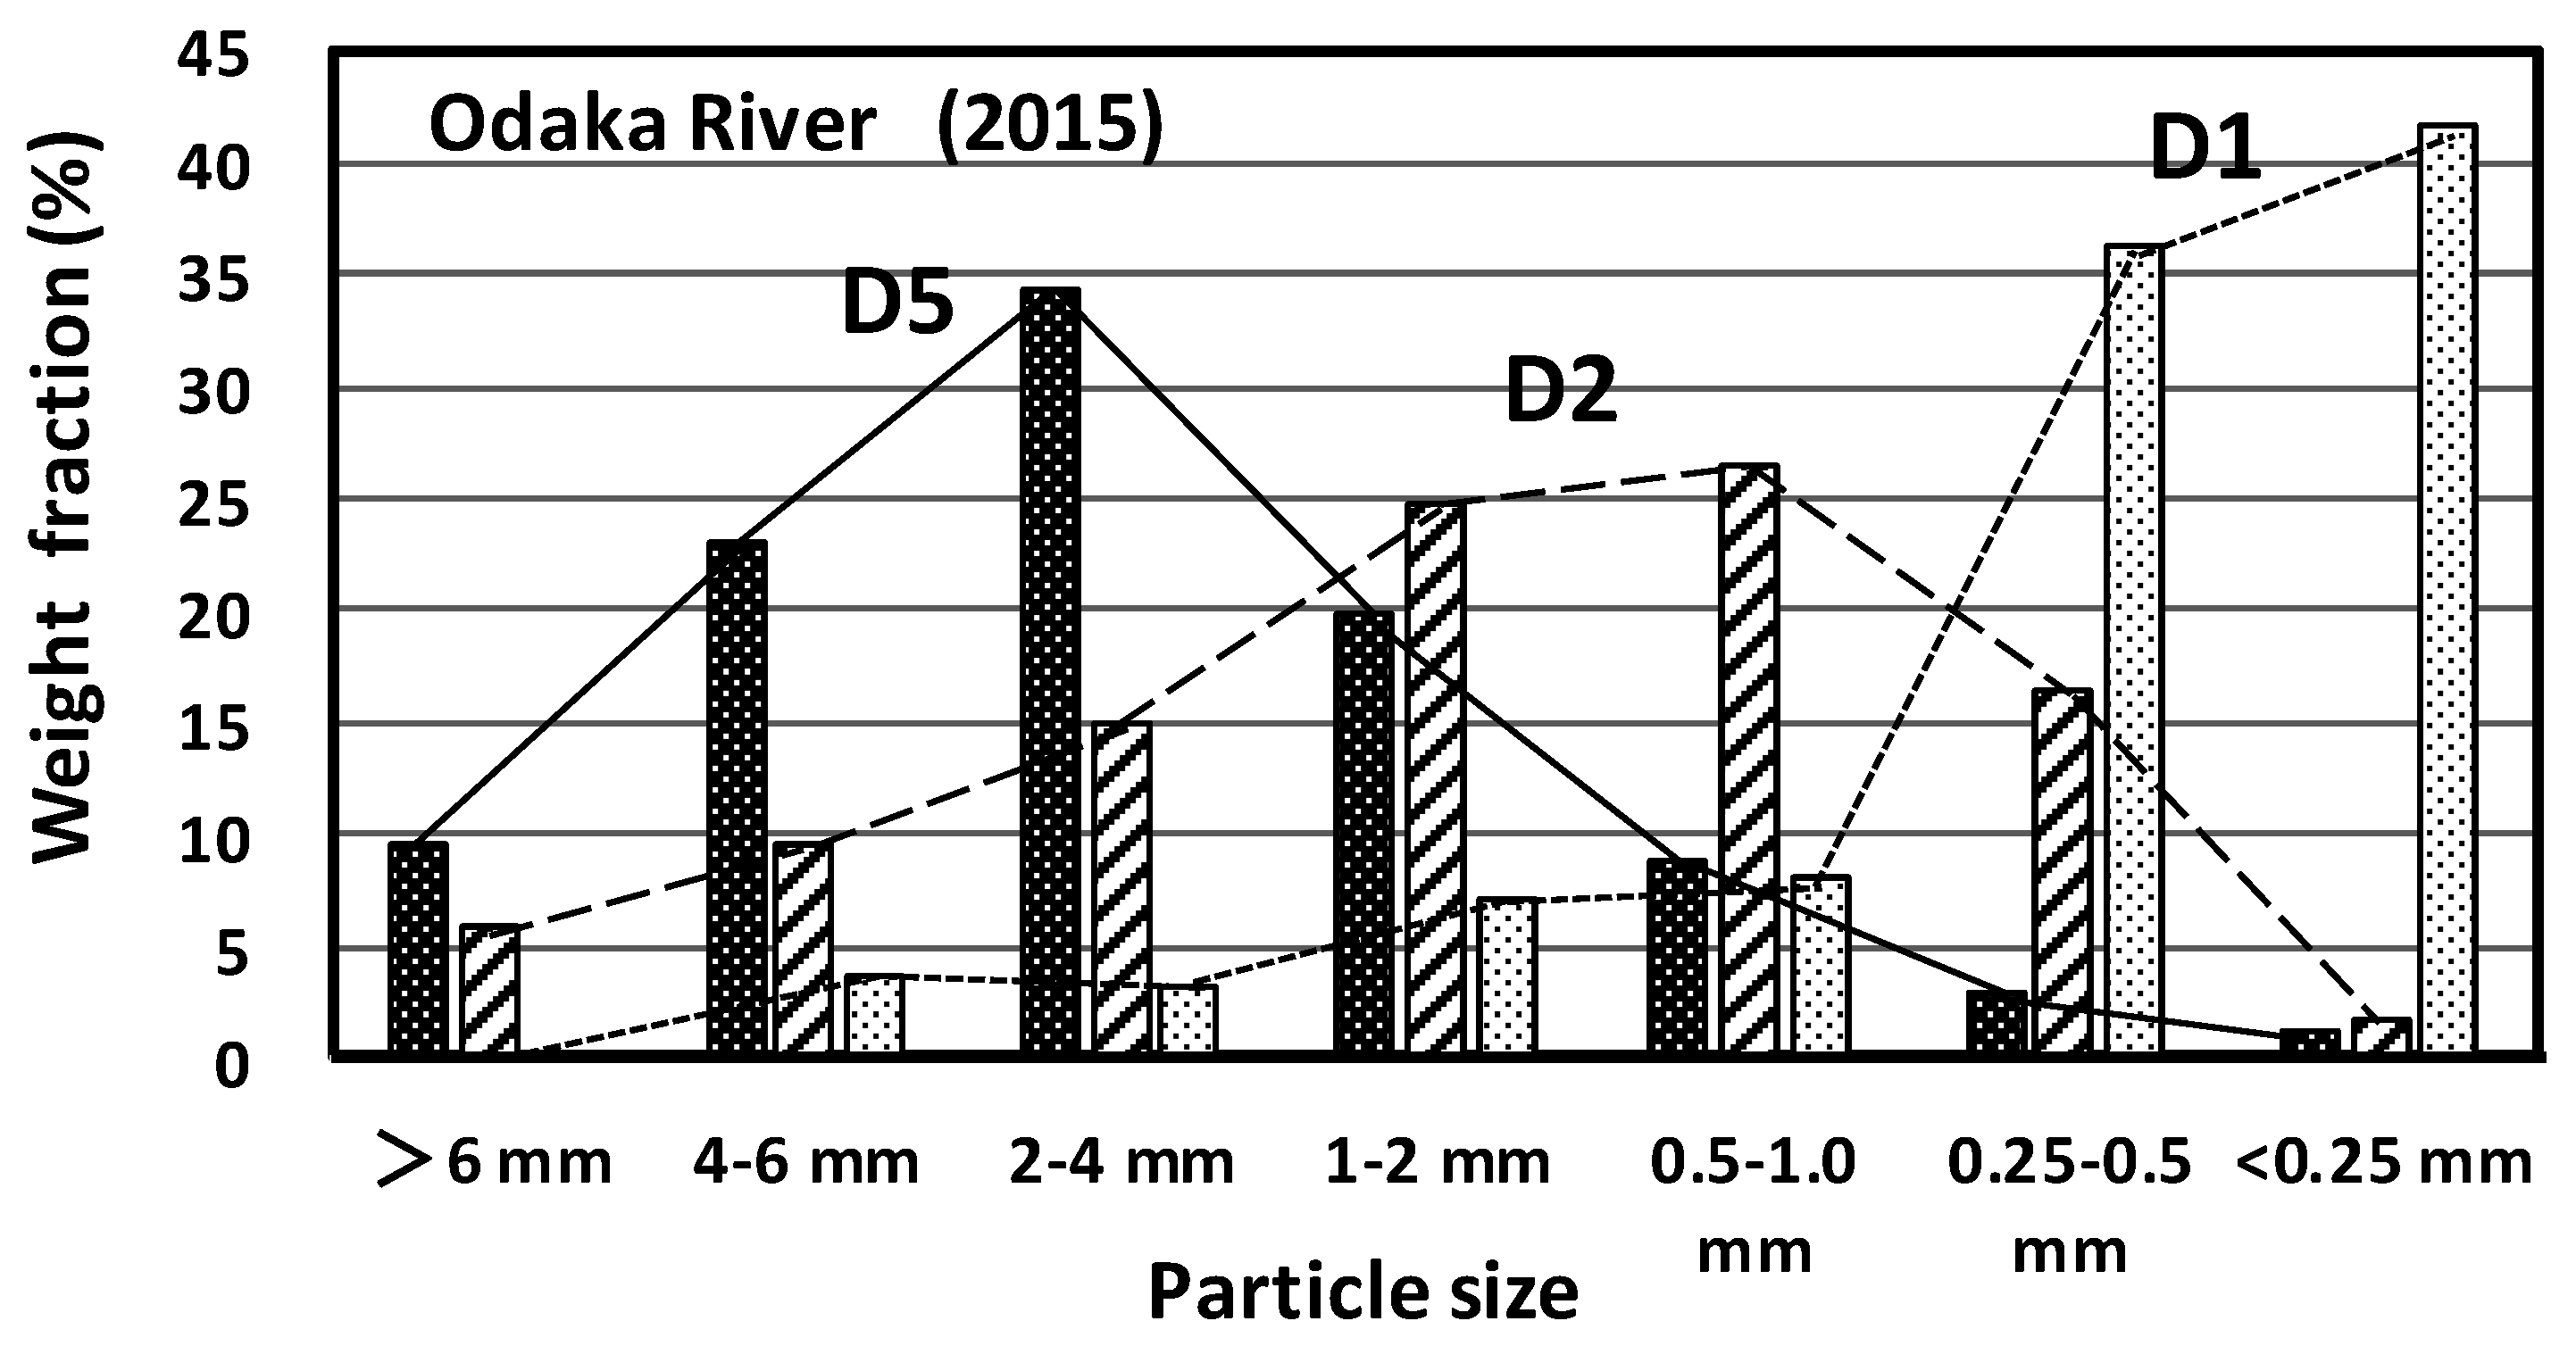
2.3. Particle Size Distribution and 137Cs Concentration in Sediment
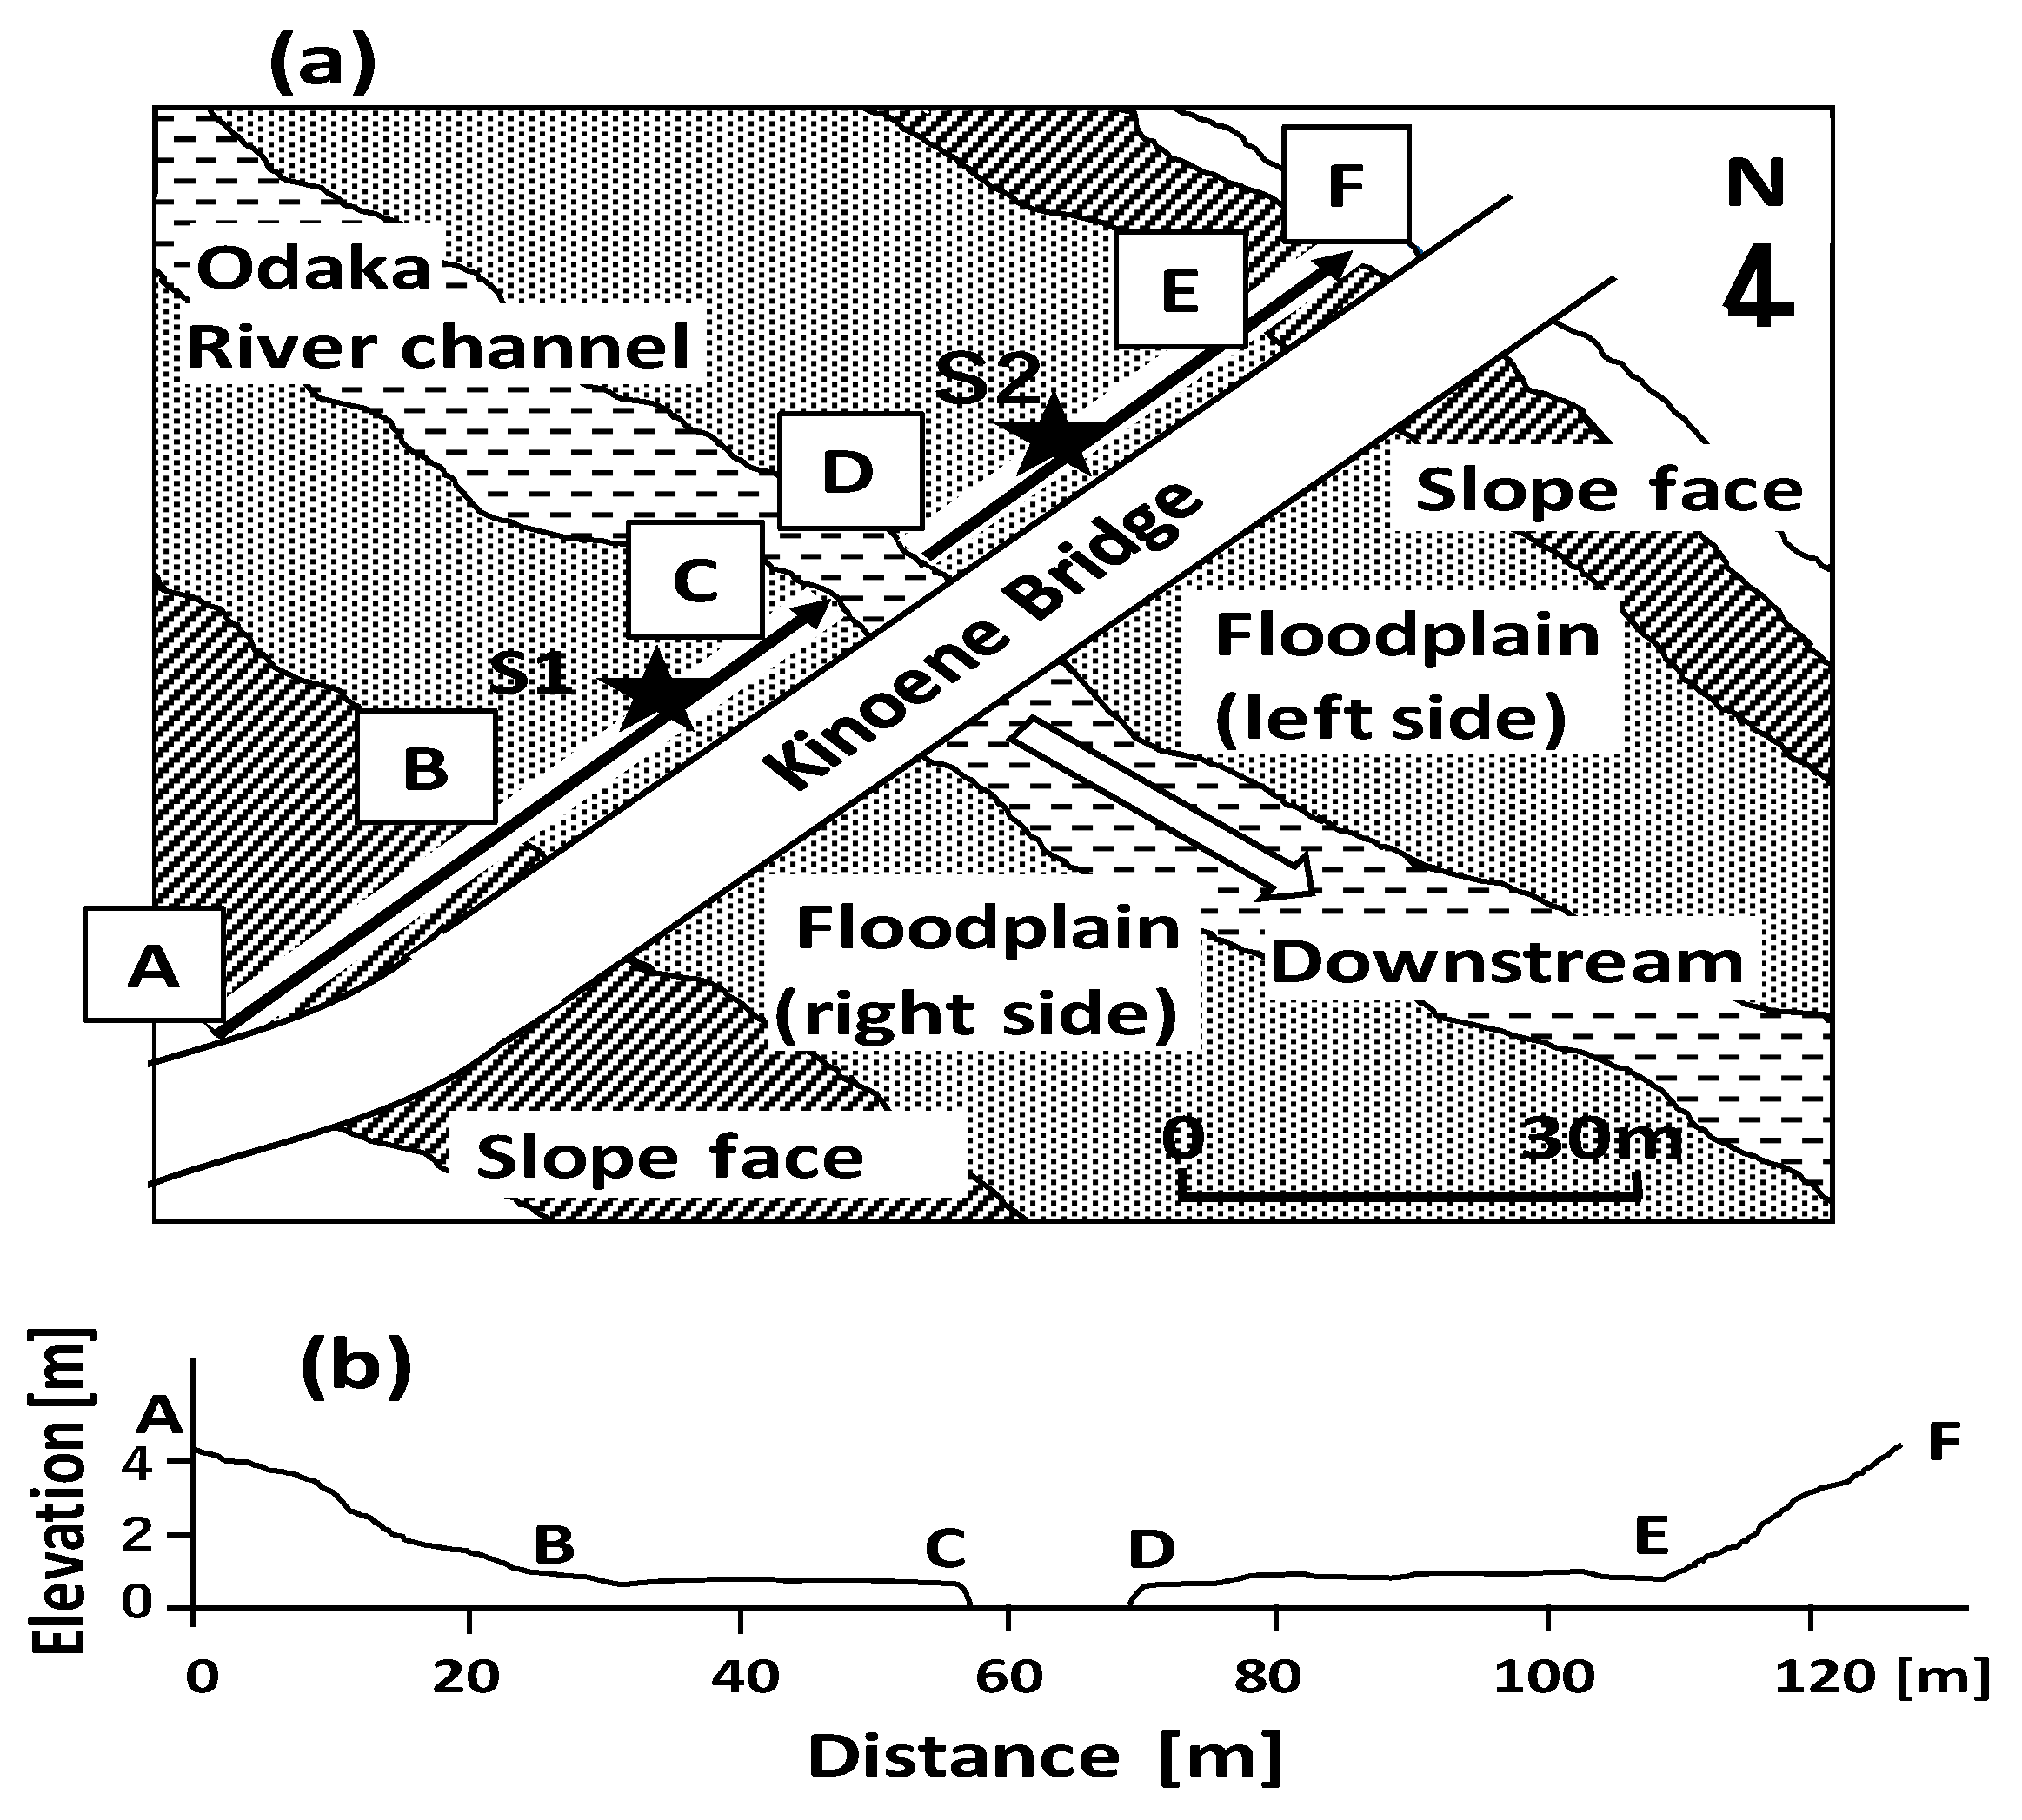
2.4. Air Dose Rate Survey over Downstream Floodplains
3. Results
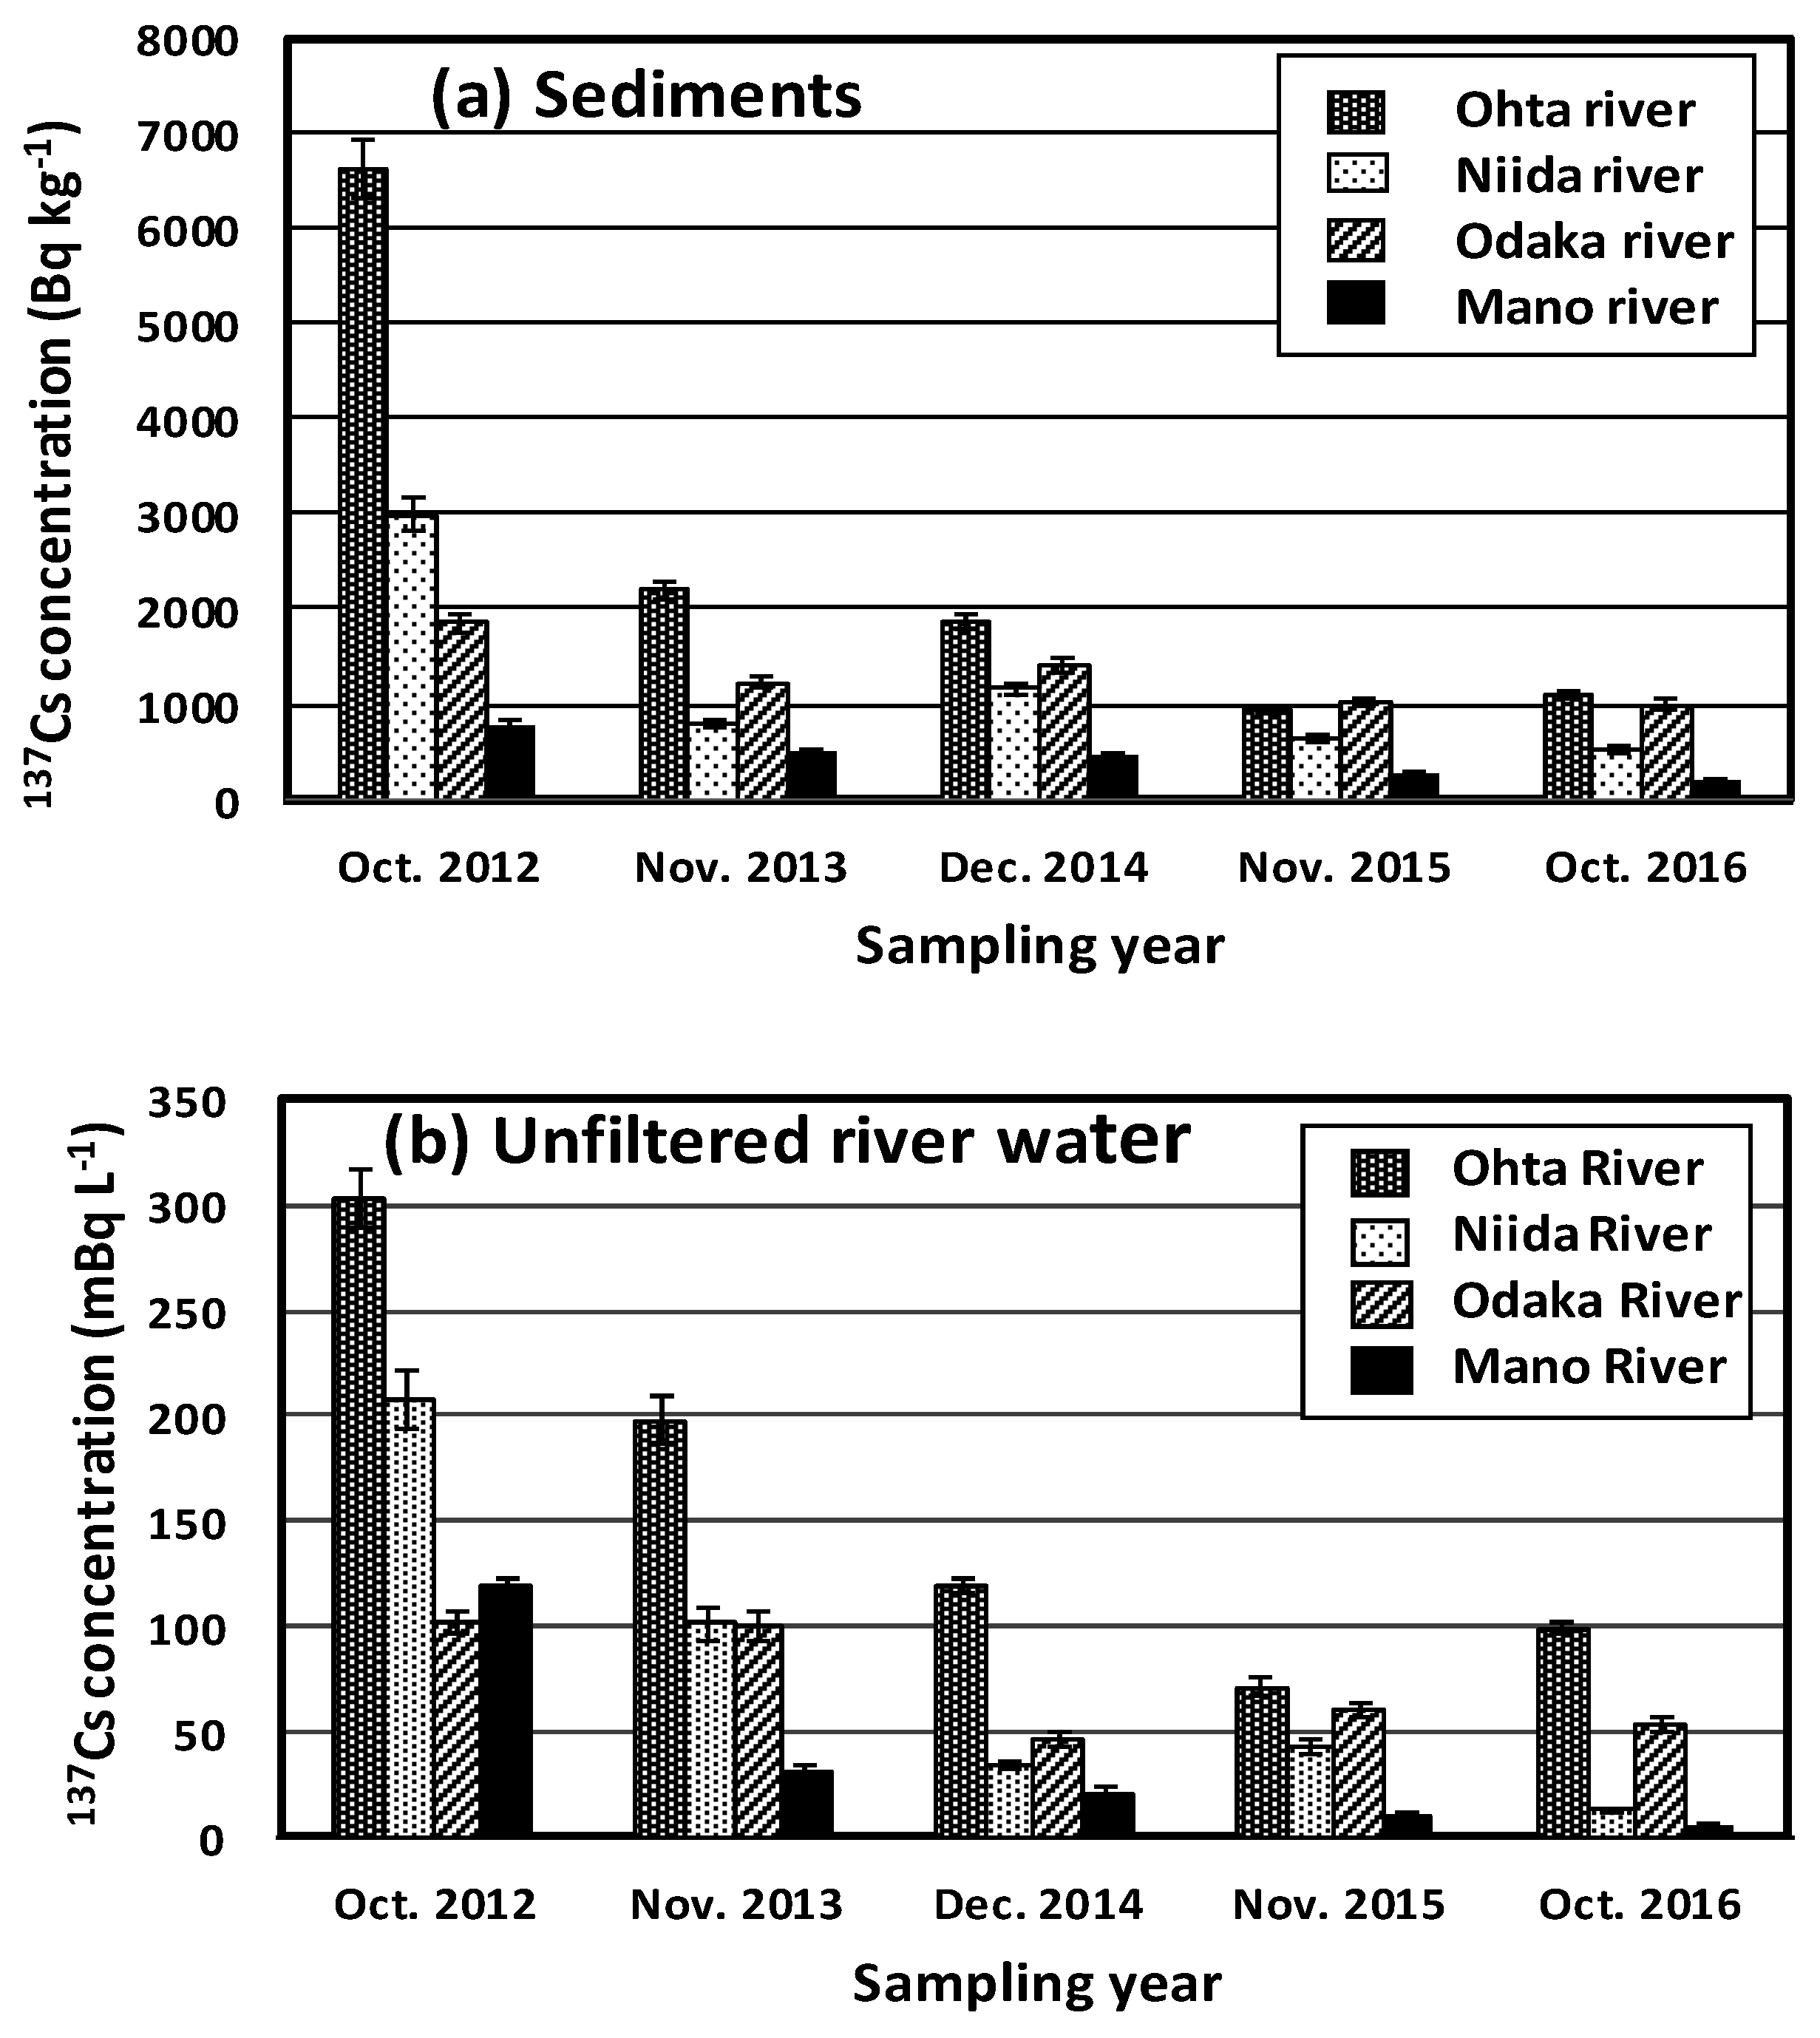
3.1. River Sediments in Minami-Soma City
3.2. River Water
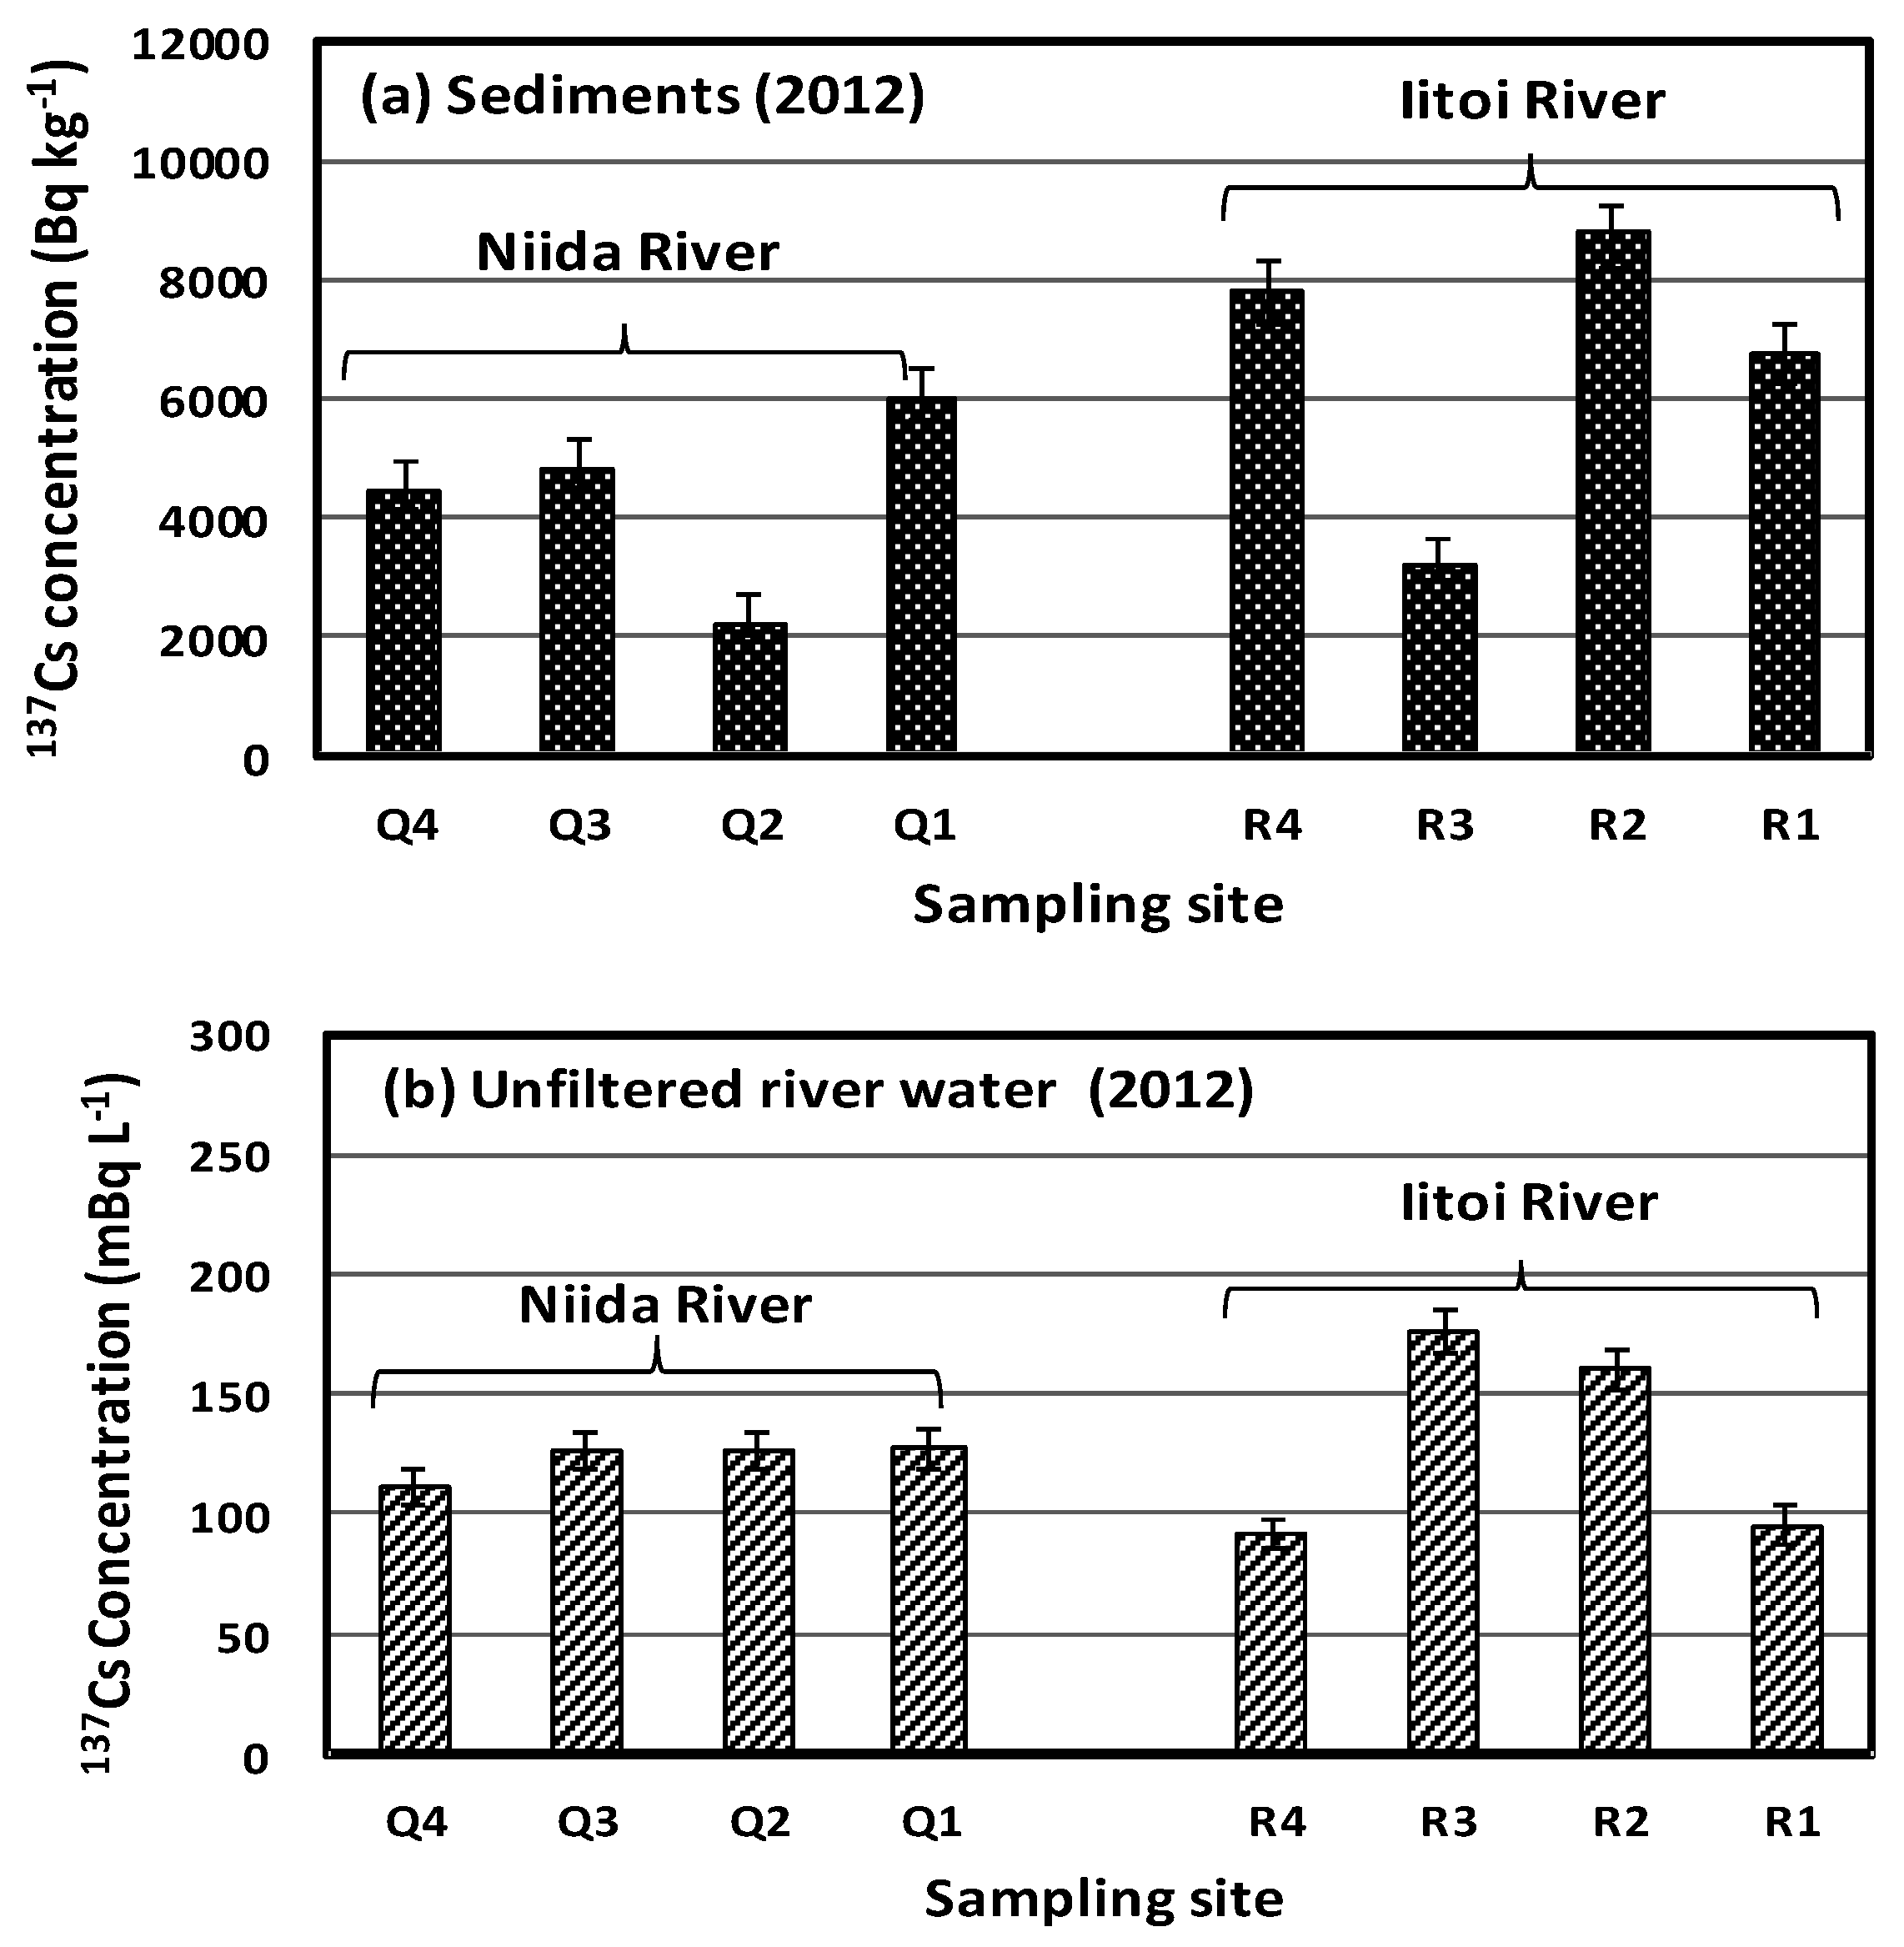
3.3. Iitate Village
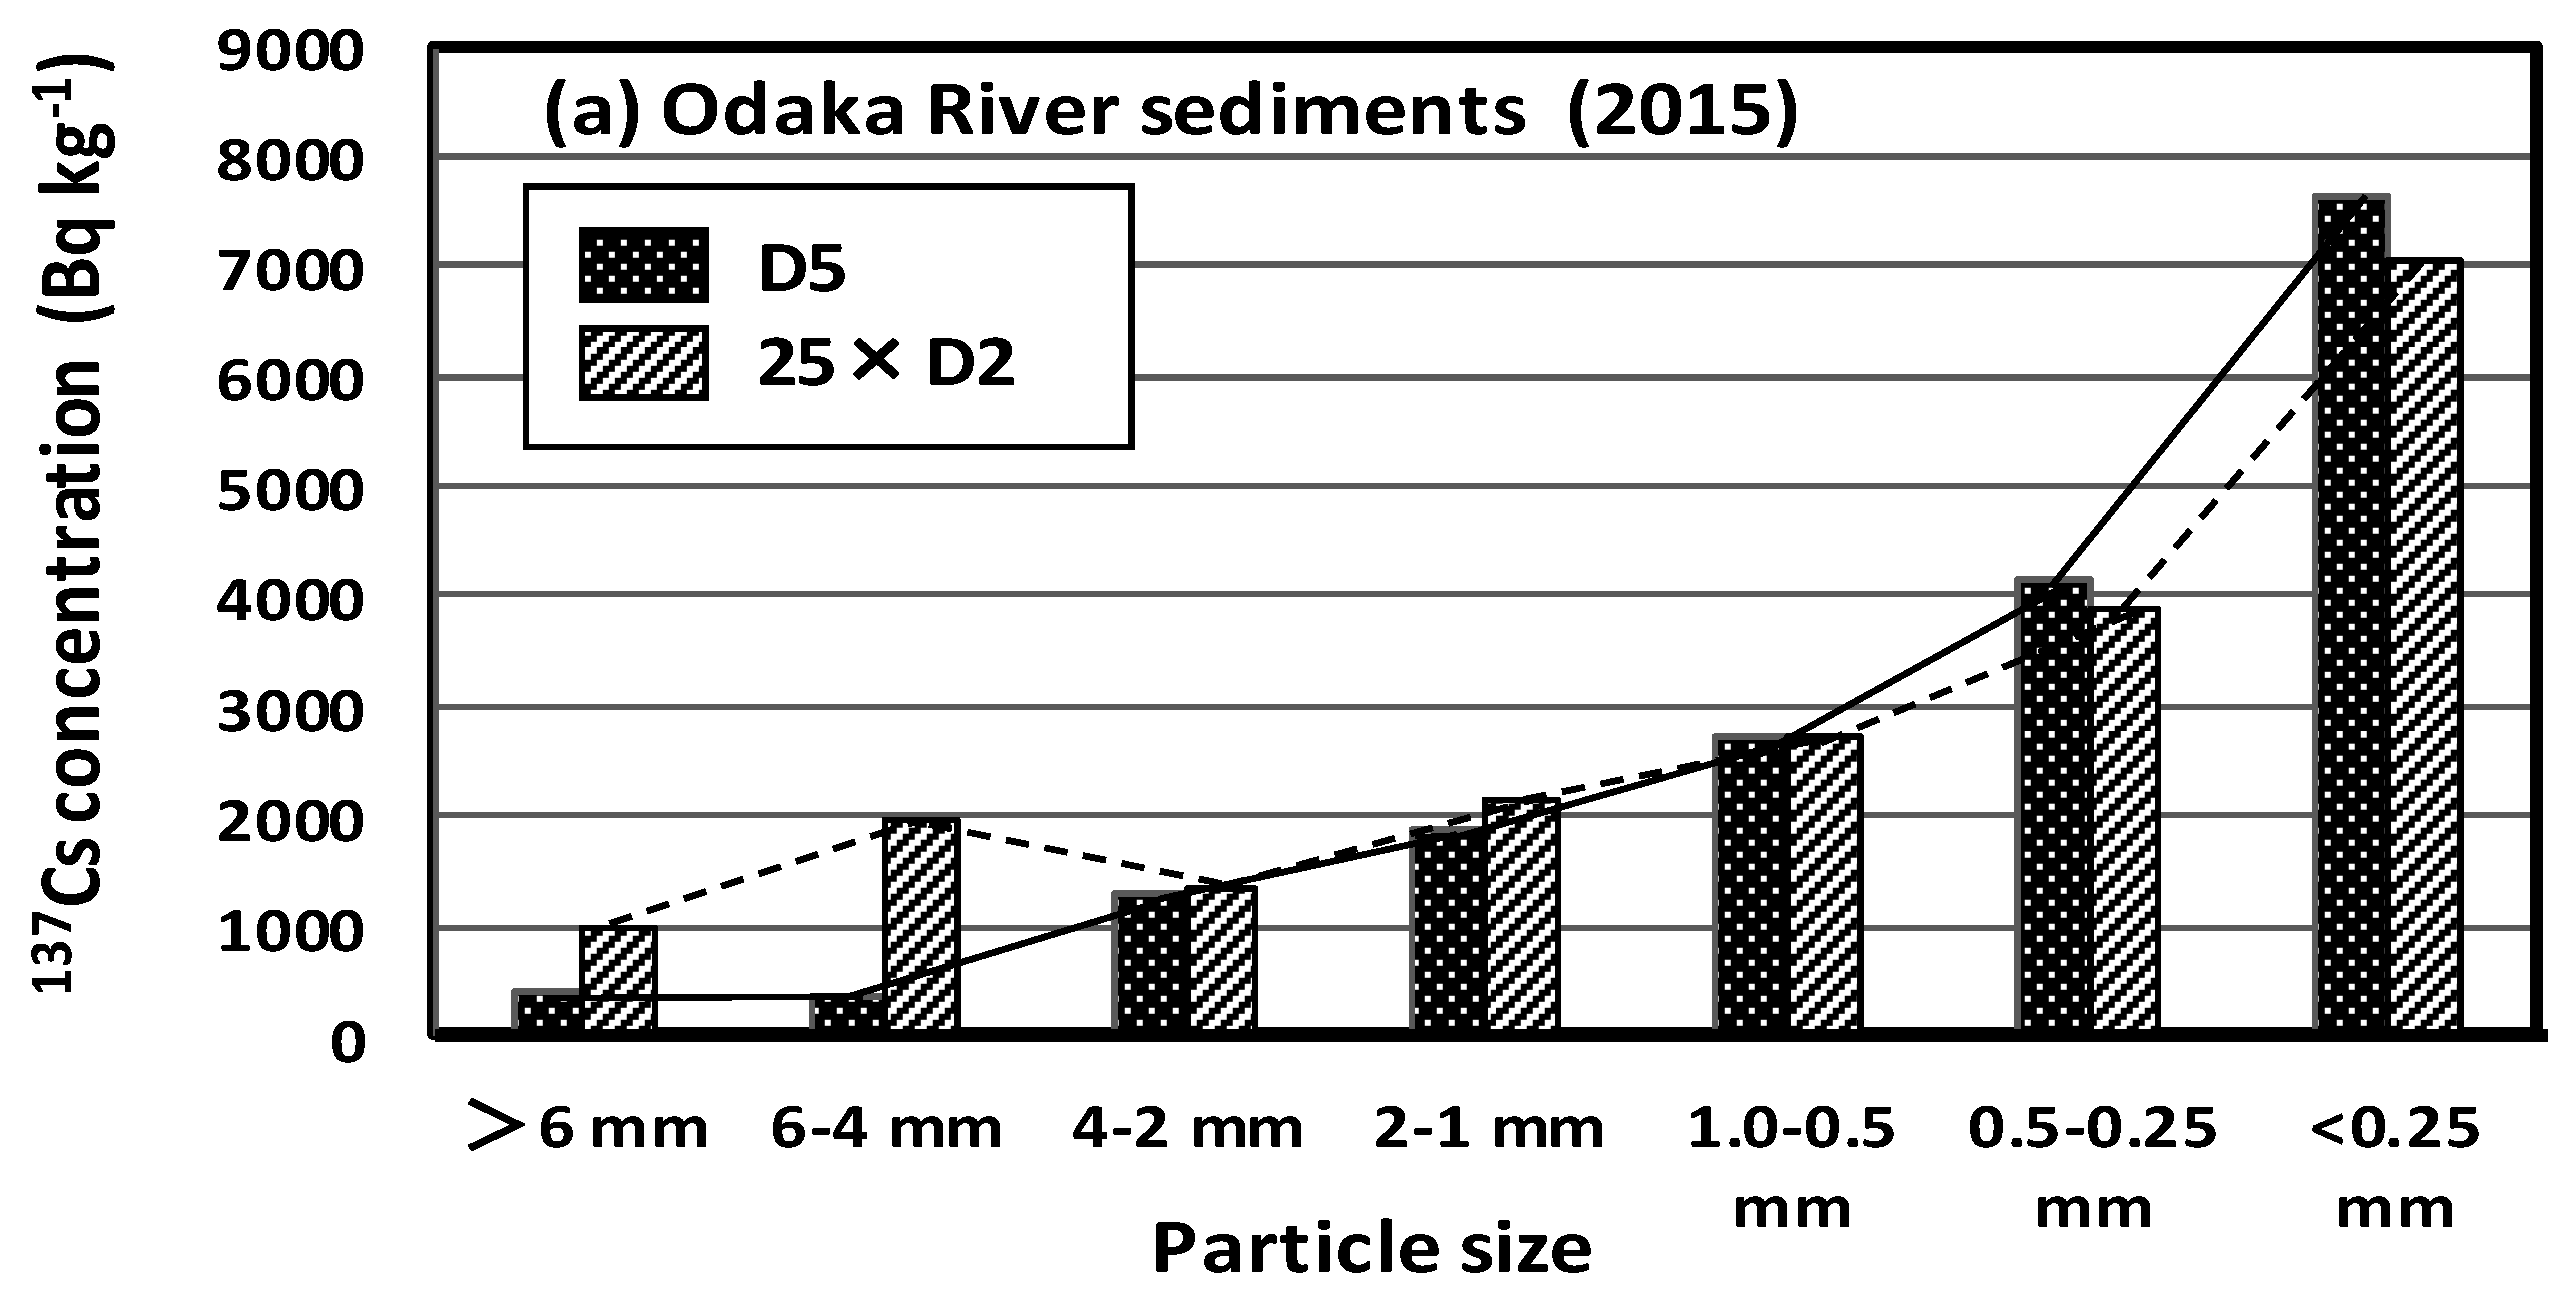
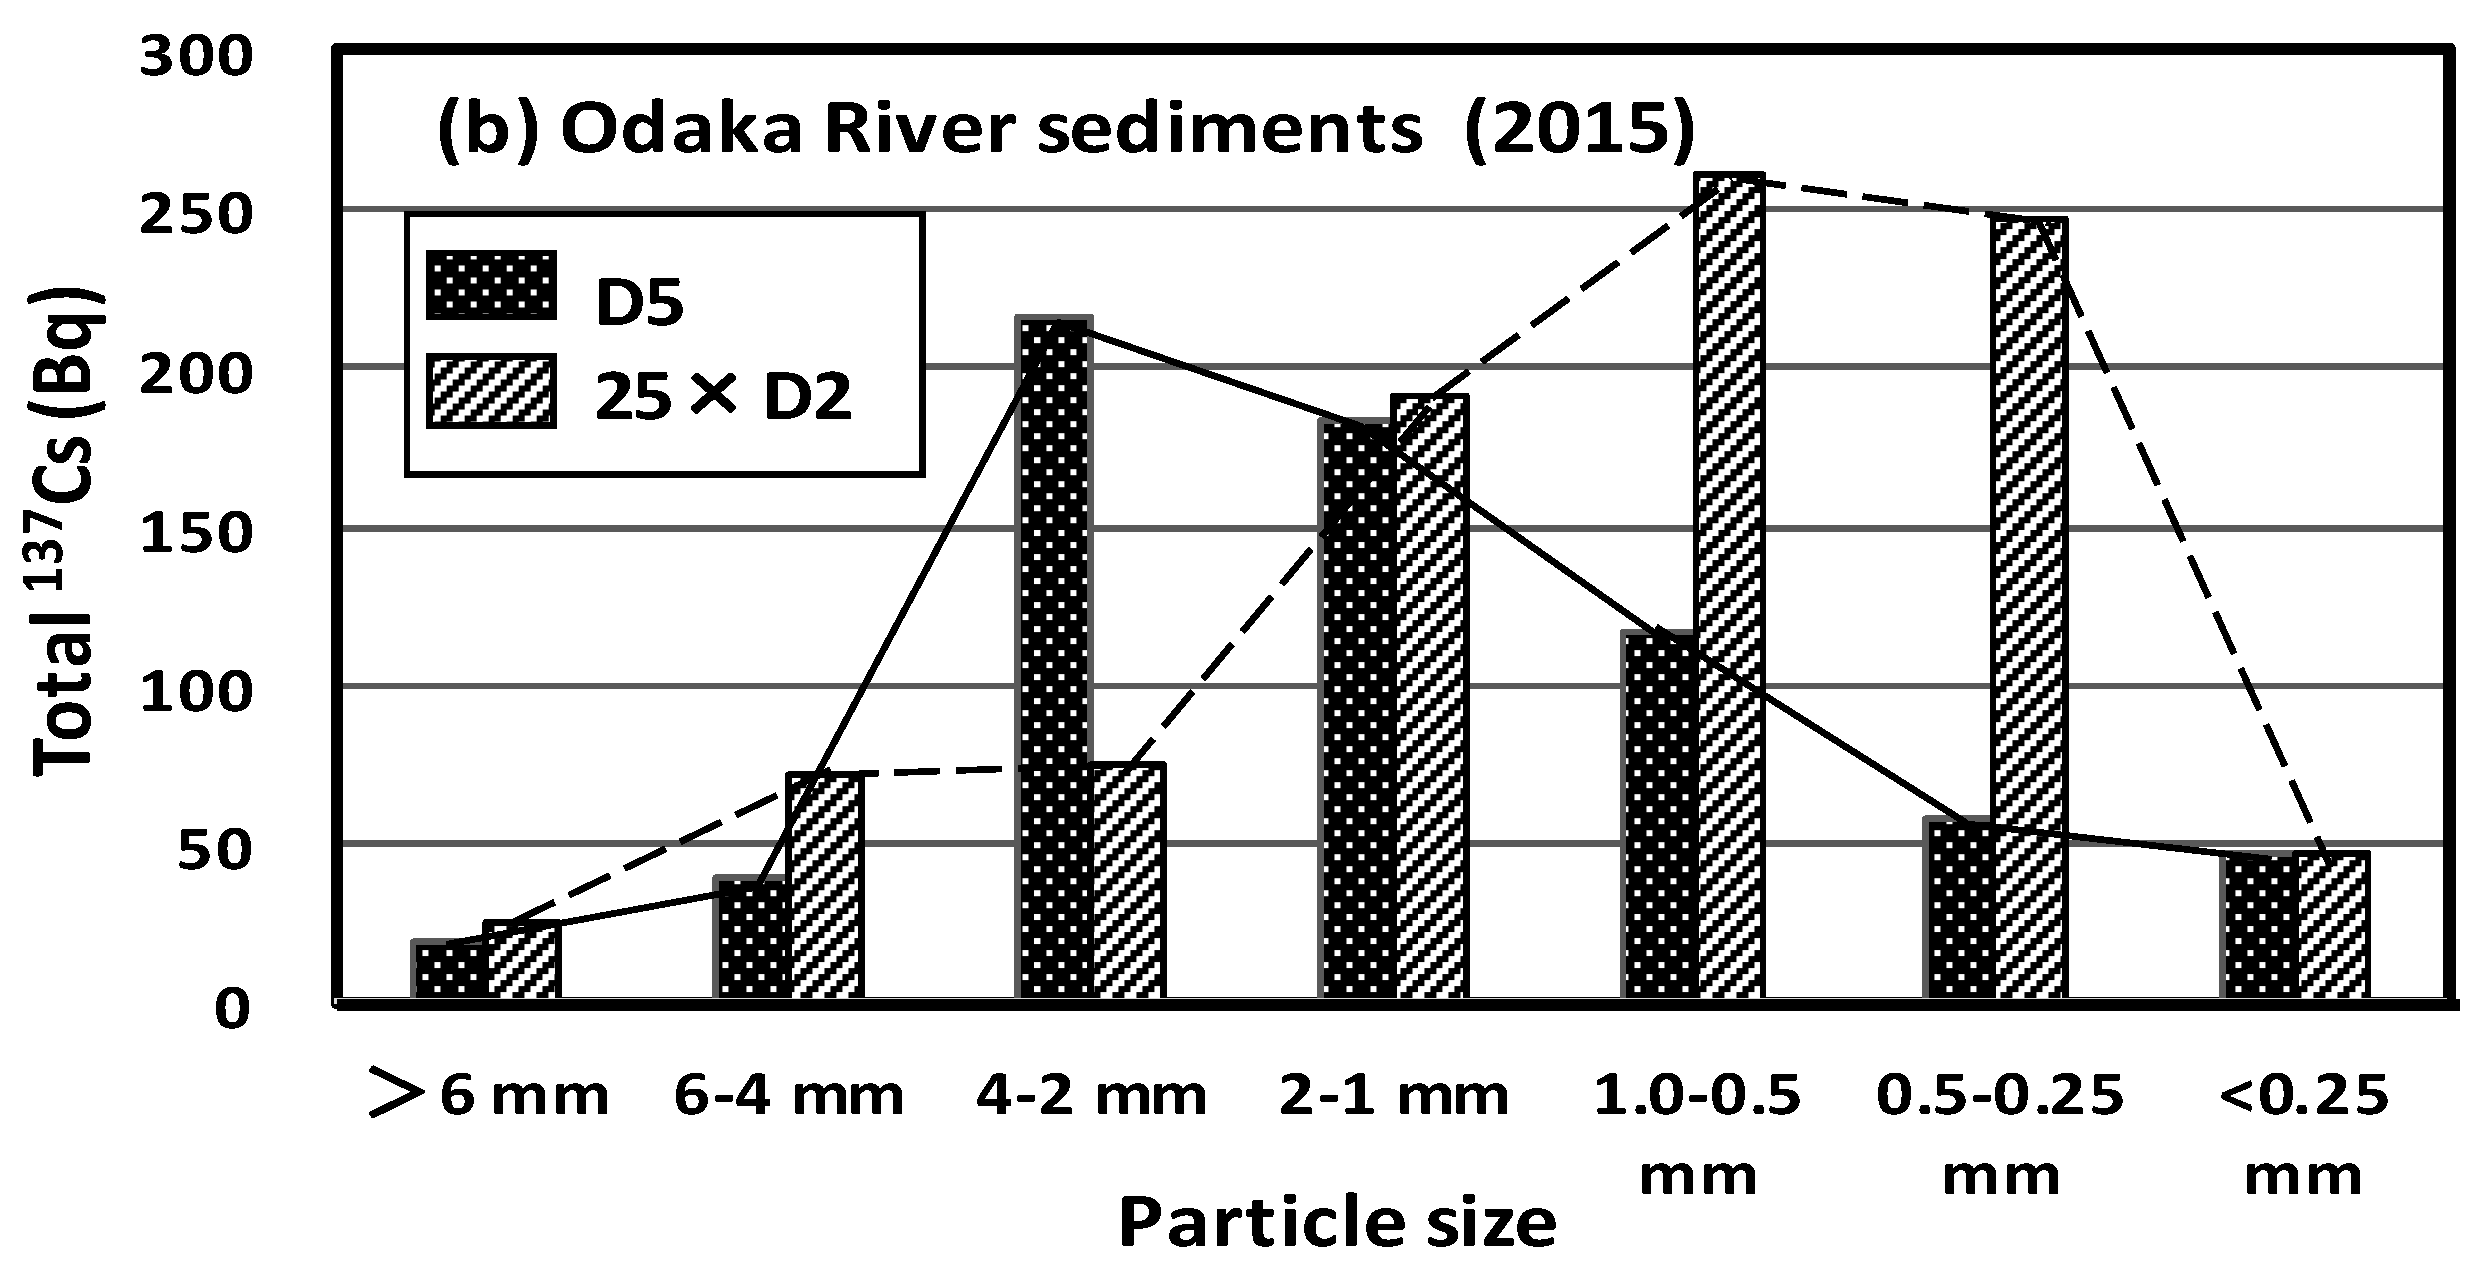
3.4. Particle Size Dependence of 137Cs Concentration in Sediment
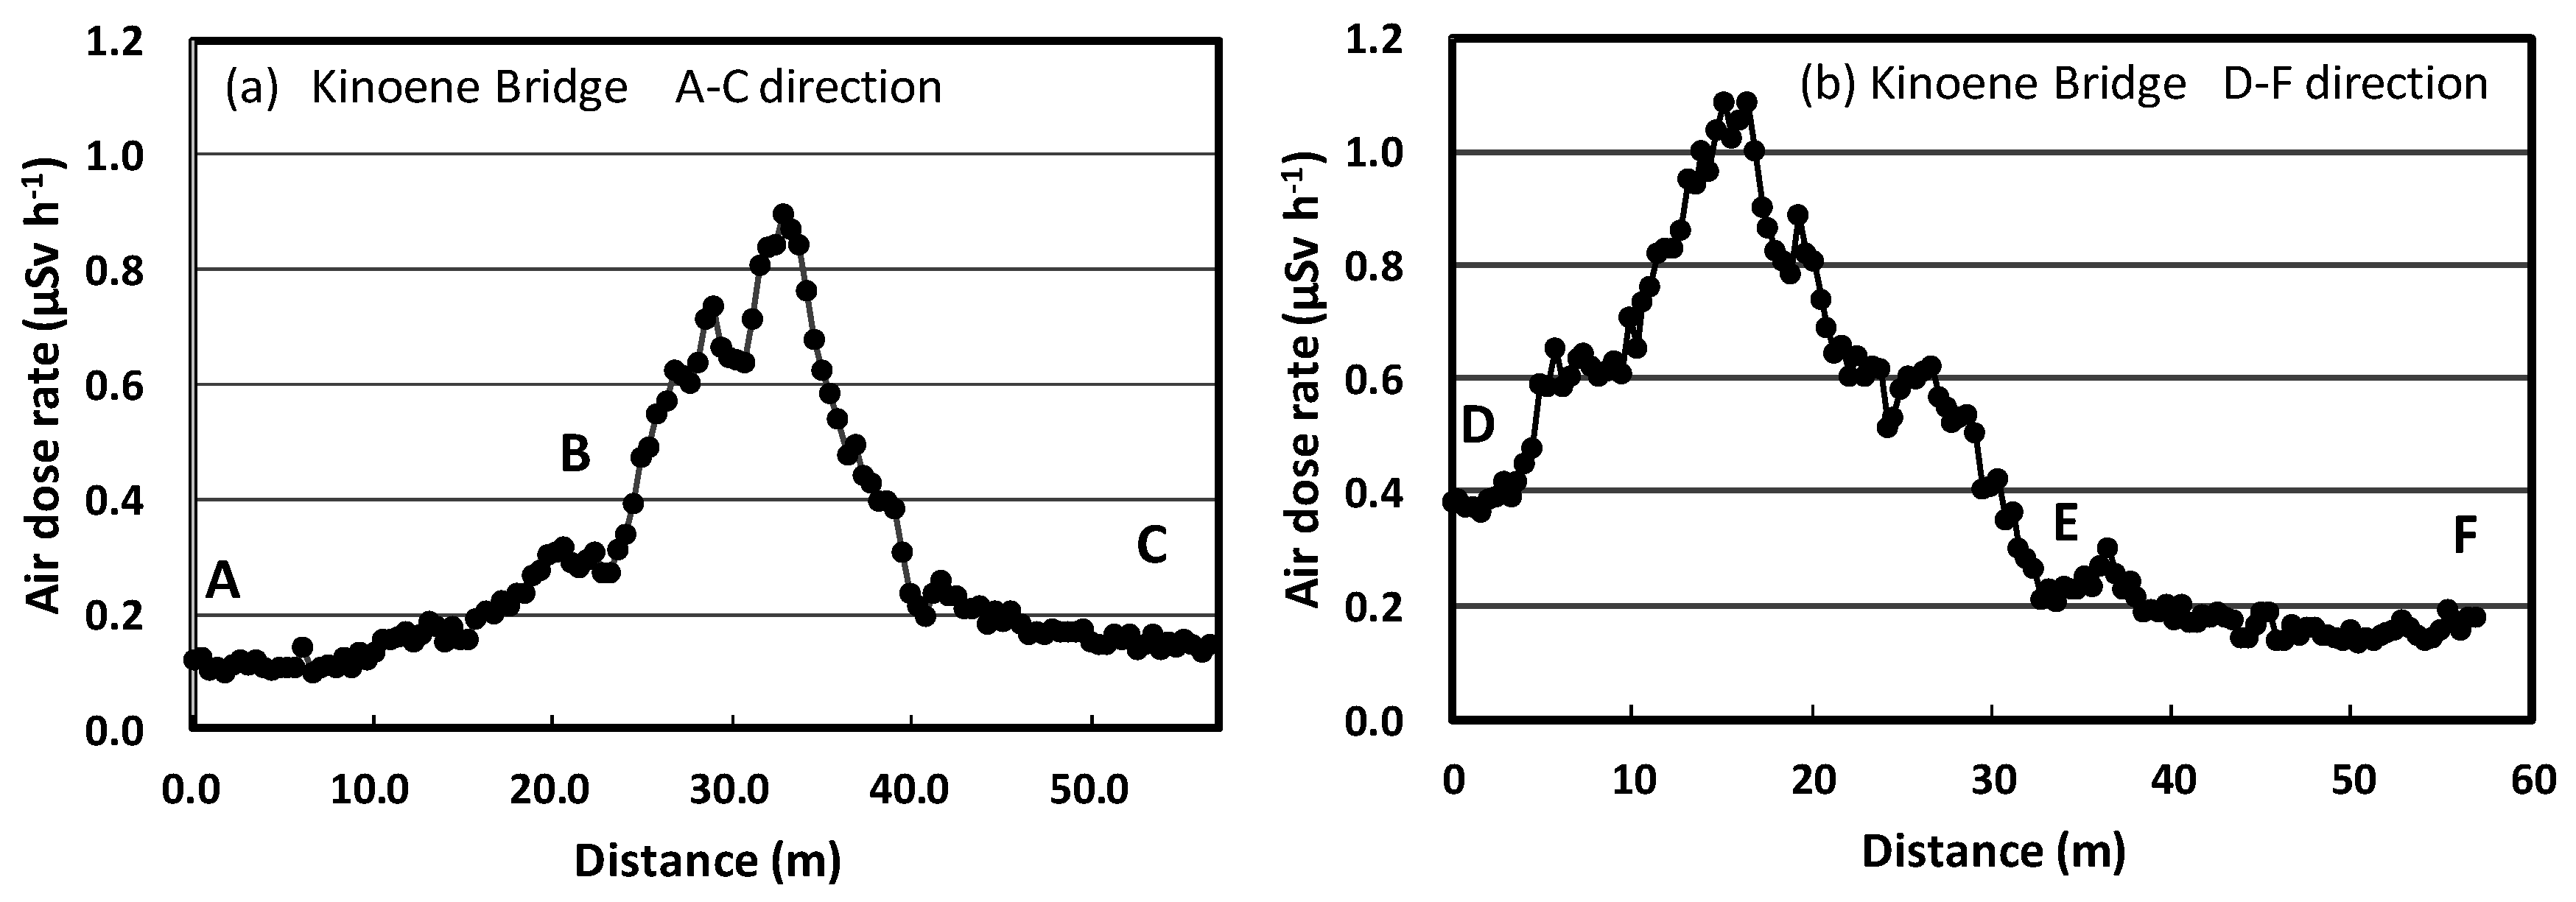
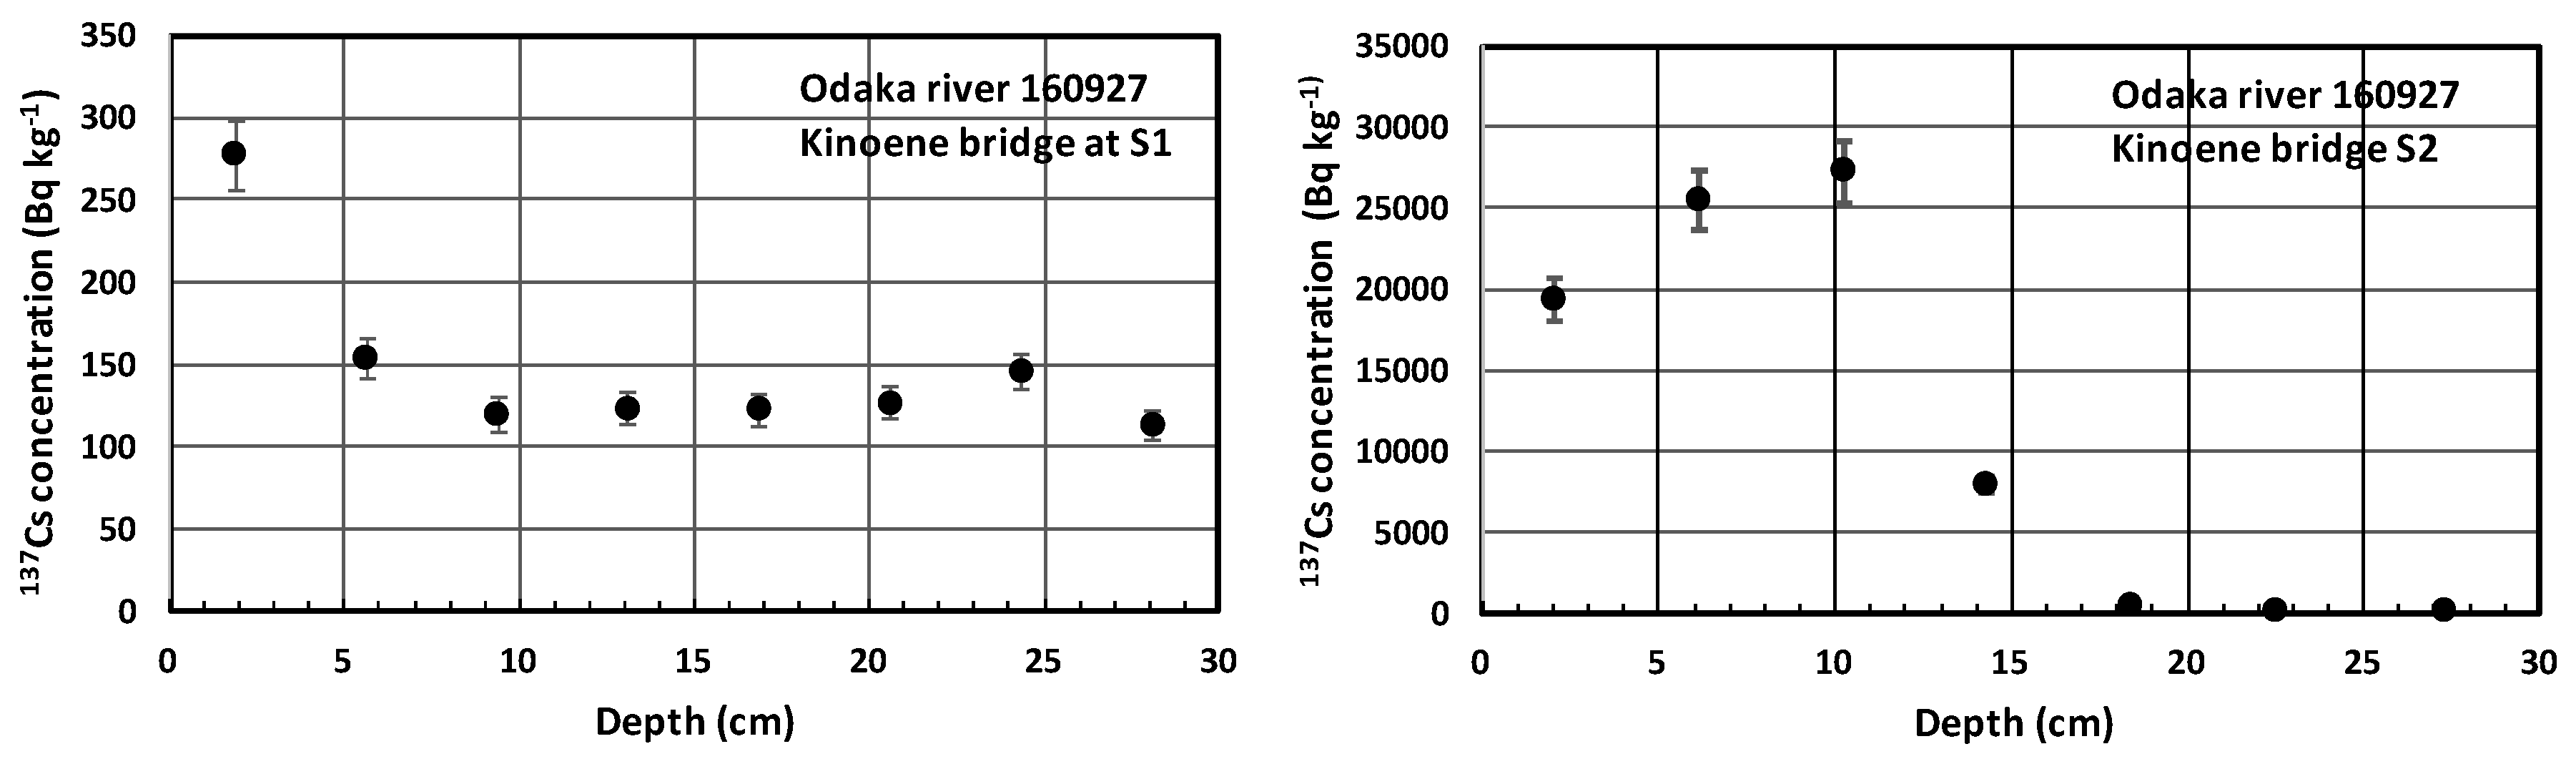
3.5. Air Dose Rate and 137Cs Depth Profile over the Floodplain
4. Discussion
4.1. Initial Deposition of the 137Cs and Distribution Profile along the River
4.2. Temporal Decrease of 137Cs Concentration in Sediment and River Water
4.3. Transport of Radiocesium along a River
5. Conclusions
Author Contributions
Funding
Acknowledgments
Conflicts of Interest
References
- Steinhauser, G.; Brandl, A.; Johnson, T.E. Comparison of the Chernobyl and Fukushima nuclear accidents: A review of the environmental impacts. Sci. Total Environ. 2014, 470, 800–817. [Google Scholar] [CrossRef] [PubMed]
- Ministry of Education, Culture, Sports, Science and Technology (MEXT). Monitoring Information of Environmental Radioactivity Level about Strontium Concentration, 2012, Japanese. Available online: http://radioactivity.mext.go.jp/ja/ (accessed on 10 October 2012).
- Endo, S.; Kimura, K.; Takatsuji, T.; Nanasawa, K.; Imanaka, T.; Shizuma, K. Measurement of soil contamination by radionuclides due to the Fukushima Dai-ichi Nuclear Power Plant accident and associated estimated cumulative external dose estimation. J. Environ. Radioact. 2012, 111, 18–27. [Google Scholar] [CrossRef] [PubMed]
- Shozugawa, K.; Nogawa, N.; Matsuo, M. Deposition of fission and activation products after the Fukushima Dai-ichi Nuclear Power Plant accident. Environ. Pollut. 2012, 163, 243–247. [Google Scholar] [CrossRef] [PubMed]
- Saito, K.; Tanihata, I.; Fujiwara, M.; Saito, T.; Shimoura, S.; Otsuka, T.; Onda, Y.; Hoshi, M.; Ikeuchi, Y.; Takahashi, F.; et al. Detailed deposition density maps constructed by large-scale soil sampling for gamma-ray emitting radioactive nuclides from the Fukushima Dai-ichi Nuclear Power Plant accident. J. Environ. Radioact. 2015, 139, 308–319. [Google Scholar] [CrossRef] [PubMed] [Green Version]
- Mikami, S.; Maeyama, T.; Hoshide, Y.; Sakamoto, R.; Sato, S.; Okuda, N.; Demongeot, S.; Gurriaram, R.; Uwamino, Y.; Kato, H.; et al. Spatial distributions of radionuclides deposited onto ground soil around the Fukushima Dai-ichi Nuclear Power Plant and their temporal change until December 2012. J. Environ. Radioact. 2015, 139, 320–343. [Google Scholar] [CrossRef] [PubMed]
- Ministry of Education, Culture, Sports, Science and Technology (MEXT). Monitoring Information of Environmental Radioactivity Level about Aircraft Monitoring, 2011. Japanese. Available online: http://radioactivity.mext.go.jp/ja/ (accessed on 5 November 2012).
- He, Q.; Walling, D.E. Interpreting particle size effects in the adsorption of 137Cs and unsupported 210Pb by mineral soils and sediments. J. Environ. Radioact. 1996, 30, 117–137. [Google Scholar] [CrossRef]
- Tsukada, H.; Takeda, A.; Hisamatsu, S.; Inada, J. Concentration and specific activity of fallout 137Cs in extracted and particle-size fractions of cultivated soils. J. Environ. Radioact. 2008, 99, 875–881. [Google Scholar] [CrossRef] [PubMed]
- Evrard, O.; Laceby, J.P.; Lepage, H.; Onda, Y.; Cerdan, O.; Ayrault, S. Radiocesium transfer from hillslopes to the Pacific Ocean after the Fukushima Nuclear Power Plant accident: A review. J. Environ. Radioact. 2015, 148, 92–110. [Google Scholar] [CrossRef] [PubMed]
- Ueda, S.; Hasegawa, H.; Kakiuchi, H.; Akata, N.; Ohtsuka, Y.; Hisamatsu, S. Fluvial discharge of radiocaesium from watersheds contaminated by the Fukushima Dai-ichi Nuclear Power Plant accident, Japan. J. Environ. Radioact. 2013, 118, 96–104. [Google Scholar] [CrossRef] [PubMed]
- Yoshimura, K.; Onda, Y.; Sakaguchi, A.; Yamamoto, M.; Matsuura, Y. An extensive study of the concentrations of particulate/dissolved radiocaesium derived from the Fukushima Dai-ichi Nuclear Power Plant accident in various river systems and their relationship with catchment inventory. J. Environ. Radioact. 2015, 139, 370–378. [Google Scholar] [CrossRef] [PubMed]
- Sakaguchi, A.; Tanaka, K.; Iwatani, H.; Chiga, H.; Fan, O.; Onda, Y.; Takahahi, Y. Size distribution studies of 137Cs in river water in the Abukuma Riverine system following the Fukushima Dai-ichi Nuclear Power Plant accident. J. Environ. Radioact. 2015, 139, 379–387. [Google Scholar] [CrossRef] [PubMed]
- Tanaka, K.; Iwatani, H.; Sakaguchi, A.; Fan, Q.; Takahashi, Y. Size-dependent distribution of radiocesium in riverbed sediments and its relevance to the migration of radiocesium in river system after the Fukushima Daiichi Nuclear Power Plant accident. J. Environ. Radioact. 2015, 139, 390–397. [Google Scholar] [CrossRef] [PubMed]
- Iwasaki, T.; Nabi, M.; Shimizu, Y.; Kimura, I. Computational modeling of 137Cs contamination transfer associated with sediment transport in Abukuma River. J. Environ. Radioact. 2015, 139, 416–426. [Google Scholar] [CrossRef] [PubMed]
- Saegusa, H.; Ohyama, T.; Iijima, K.; Onoe, H.; Takeuchi, R. Deposition of radiocesium on the river flood plains around Fukushima. J. Environ. Radioact. 2016, 164, 36–46. [Google Scholar] [CrossRef] [PubMed]
- Iwagami, S.; Tsujimura, M.; Onda, Y.; Nishino, M.; Konuma, R.; Abe, Y.; Hada, M.; Pun, I.; Sakaguchi, A.; Kondo, H.; et al. Temporal changes in dissolved 137Cs concentrations in groundwater and stream water in Fukushima after the Fukushima Dai-ichi Nuclear Power Plant accident. J. Environ. Radioact. 2017, 166, 458–465. [Google Scholar] [CrossRef] [PubMed]
- Kurikami, H.; Kitamura, A.; Yokuda, S.T.; Onishi, Y. Sediment and 137Cs behaviors in the Ogaki Dam Reservoir during a heavy rainfall event. J. Environ. Radioact. 2014, 137, 10–17. [Google Scholar] [CrossRef] [PubMed]
- Eyrolle-Boyer, F.; Boyer, P.; Garcia-Sanchez, L.; Metivier, J.M.; Onda, Y.; Vismes, A.D.; Cagnat, X.; Boulet, B.; Cossonnet, C. Behaviour of radiocaesium in coastal rivers of the Fukushima Prefecture (Japan) during conditions of low flow and low turbidity—Insight on the possible role of small particles and detrital organic compounds. J. Environ. Radioact. 2016, 151, 328–340. [Google Scholar] [CrossRef] [PubMed]
- Vakulovsky, S.M.; Nikitin, A.I.; Chumichev, V.B.; Katrich, I.Y.; Voitsekhovich, O.A.; Medinets, V.I.; Pisarev, V.V.; Bovkum, L.A.; Khersonsky, E.S. Cesuim-137 and Strontium-90 contamination of water bodies in the areas affected by releases from the Chernobyl nuclear power plant accident: An overview. J. Environ. Radioact. 1994, 23, 103–122. [Google Scholar] [CrossRef]
- International Atomic Energy Agency (IAEA). Environmental Consequences of the Chernobyl Accident and Their Remediation: Twenty Years of Experience; IAEA: Vienna, Austria, 2006. [Google Scholar]
- International Atomic Energy Agency (IAEA). Radiological Conditions in the Dnieper River Basen: Assessment by an International Expert Team and Recommendations for an Action Plan; IAEA: Vienna, Austria, 2006. [Google Scholar]
- Saxén, R.; Ilus, E. Discharge of 137Cs and 90Sr by Finnish rivers to the Baltic Sea in 1986–1996. J. Environ. Radioact. 2001, 54, 275–291. [Google Scholar] [CrossRef]
- Spezzano, P.; Bortoluzzi, S.; Giacomelli, R.; Massironi, L. Seasonal variations of 137Cs activities in the Dola Baltea River (northwest Italy) after the Chernobyl accident. J. Environ. Radioact. 1994, 22, 77–88. [Google Scholar] [CrossRef]
- Shizuma, K.; Fujikawa, Y.; Kurihara, M.; Sakurai, Y. Identification and temporal decrease of 137Cs and 134Cs in groundwater in Minami-Soma City following the accident at the Fukushima Dai-ichi nuclear power plant. Environ. Pollut. 2017, 234, 1–8. [Google Scholar] [CrossRef] [PubMed]
- Nagao, S.; Kanamori, M.; Ochiai, S.; Tomihara, S.; Fukushi, K.; Yamamoto, M. Export of 134Cs and 137Cs in the Fukushima river systems at heavy rains by Typhoon Roke in September 2011. Biogeoscience 2013, 10, 6215–6223. [Google Scholar] [CrossRef]
- Ministry of Education, Culture, Sports, Science and Technology in Japan. Radioactivity Measurement; Series No. 13; Japan Chemical Analysis Center: Chiba, Japan, 1982. (In Japanese)
- Hirose, K.; Aoyama, M.; Sugimura, Y. Plutonium and Cesium isotopes in river waters in Japan. J. Radioanal. Nucl. Chem. 1990, 141, 191–202. [Google Scholar] [CrossRef]
- Aoyama, M.; Hirose, K.; Miyano, T.; Igarashi, Y. Low-level 137Cs measurements in deep seawater samples. Appl. Radiat. Isot. 2000, 53, 159–162. [Google Scholar] [CrossRef]
- Sakaguchi, A.; Kadokura, A.; Steier, P.; Tanaka, K.; Takahashi, Y.; Chiga, H.; Matsushima, A.; Nakashima, S.; Onda, Y. Isotopic determination of U, Pu, and Cs in environmental waters following the Fukushima Daiichi Nuclear Power Plant accident. Geochem. J. 2012, 46, 355–360. [Google Scholar] [CrossRef]
- Godoy, J.M.; Guimaraes, J.R.D.; Carvalho, Z.L. 137Cs pre-concentration from water samples using a Prussian blue impregnated ion-exchanger. J. Environ. Radioact. 1993, 20, 213–219. [Google Scholar] [CrossRef]
- Shizuma, K.; Takatori, H.; Takenaka, K.; Murataka, A.; Kojima, Y.; Endo, S. Measurement of uranium, radium and radon concentration in groundwater sampled over Hiroshima Prefecture, Japan. Radioisotopes 2010, 59, 163–171. [Google Scholar] [CrossRef]
- Shizuma, K.; Fukami, K.; Iwatani, K.; Hasai, H. Low-background shielding of Ge detectors for the measurement of residual 152Eu radioactivity induced by neutrons from the Hiroshima atomic bomb. Nucl. Instrum. Methods Phys. Res. 1992, B66, 459–464. [Google Scholar] [CrossRef]
- Shizuma, K.; Oba, Y.; Takada, M. A practical method for determining γ-ray full-energy peak efficiency considering coincidence-summing and self-absorption corrections for the measurement of environmental samples after the Fukushima reactor accident. Nucl. Instrum. Methods Phys. Res. 2016, 383, 183–190. [Google Scholar] [CrossRef]


| River | Site | October 2012 | November 2013 | December 2014 | November 2015 | October 2016 | |||||
|---|---|---|---|---|---|---|---|---|---|---|---|
| 137Cs | 134Cs | 137Cs | 134Cs | 137Cs | 134Cs | 137Cs | 134Cs | 137Cs | 134Cs | ||
| Odaka | D5 | 3561(252) | 2126(151) | 2655(188) | 1019(73) | 2651(188) | 806(58) | 2499(177) | 560(40) | 2915(207) | 560(40) |
| D4 | 2349(166) | 1387(99) | 2737(194) | 1235(88) | 3151(224) | 905(65) | 1717(122) | 377(22) | 1179(84) | 377(22) | |
| D3 | 2445(173) | 1457(103) | 542(39) | 241(17) | 828(59) | 246(18) | 573(41) | 124(9) | 722(52) | 124(9) | |
| D2 | 231(16) | 141(10) | 191(14) | 83(6) | 120(9) | 35(3) | 290(21) | 61(5) | 131(10) | 61(5) | |
| D1 | 650(46) | 402(29) | 20(2) | 7(1) | 206(15) | 64(5) | 27(2) | ND a | 10(2) | ND | |
| Ohta | O5 | 18,216(1288) | 9639(682) | 7221(511) | 3349(237) | 2904(206) | 882(63) | 2357(167) | 528(38) | 2494(177) | 423(30) |
| O4 | 10,591(749) | 5602(396) | 1875(133) | 863(61) | 2372(168) | 728(52) | 1259(90) | 258(19) | 1694(120) | 283(21) | |
| O3 | 2446(173) | 1752(124) | 1615(115) | 751(54) | 1697(121) | 520(37) | 580(42) | 127(10) | 749(54) | 115(9) | |
| O2 | 1782(126) | 1284(91) | 244(18) | 111(8) | 607(44) | 189(14) | 404(29) | 90(7) | 432(31) | 66(6) | |
| O1 | 108(8) | 71(5) | 25(2) | 10(1) | 56(5) | 17(2) | 41(4) | 8(1) | 115(9) | 14(2) | |
| Niida | N5 | 9129(646) | 6730(479) | 1939(138) | 874(62) | 2353(167) | 734(52) | 1758(124) | 434(31) | 1677(119) | 276(29) |
| N4 | - | - | 956(68) | 431(31) | 1890(134) | 589(42) | 478(34) | 116(9) | 187(14) | 29(3) | |
| N3 | 1607(114) | 1170(83) | 515(37) | 228(17) | 1993(142) | 621(44) | 428(31) | 112(9) | 178(13) | 28(3) | |
| N2 | 1072(76) | 858(61) | 659(47) | 303(22) | 308(22) | 90(7) | 372(27) | 86(6) | 184(13) | 29(2) | |
| N1 | 157(11) | 123(9) | 84(7) | 35(3) | 21(2) | 7(1) | ND | ND | 11(2) | ND | |
| Mizunashi | P4 | - | - | 12,348(874) | 2219(157) | 10,820(766) | 3782(268) | 6339(449) | 1579(112) | 3979(282) | 686(49) |
| P3 | 8261(584) | 6067(429) | 6721(476) | 2921(207) | 3460(245) | 1195(85) | 2296(163) | 560(40) | 1394(99) | 224(17) | |
| P2 | 1869(132) | 1360(96) | 3406(241) | 1565(111) | 2049(146) | 680(49) | 1625(319) | 405(29) | 506(36) | 80(6) | |
| P1 | - | - | - | - | 1320(90) | 453(33) | 809(58) | 190(14) | 421(30) | 68(5) | |
| M5 | 664(47) | 410(29) | 1023(73) | 364(27) | 569(41) | 164(12) | 340(24) | 68(6) | 464(33) | 73(6) | |
| Mano | M4 | 1423(101) | 890(63) | 196(15) | 68(6) | 592(42) | 176(13) | 302(22) | 60(5) | 244(18) | 39(4) |
| M3 | 1192(84) | 734(52) | 1048(75) | 387(28) | 835(60) | 246(18) | 190(14) | 35(3) | 207(15) | 35(3) | |
| M2 | 231(16) | 142(10) | 121(9) | 41(4) | 227(17) | 66(9) | 263(19) | 52(5) | 96(7) | 16(2) | |
| M1 | 419(30) | 264(19) | 44(4) | 44(4) | 34(3) | 10(2) | - | - | 32(3) | ND | |
| River | Site | October 2012 | November 2013 | December 2014 | November 2015 | October 2016 | |||||
|---|---|---|---|---|---|---|---|---|---|---|---|
| 137Cs | 134Cs | 137Cs | 134Cs | 137Cs | 134Cs | 137Cs | 134Cs | 137Cs | 134Cs | ||
| Odaka | D5 | 104(10) | 69(9) | 83(10) | 27(8) | 61(6) | 8(3) | 80(8) | ND a | 80(4) | ND |
| D4 | 114(11) | 51(8) | 92(13) | 24(9) | 38(5) | ND | 85(8) | 7(2) | 55(3) | ND | |
| D3 | 89(9) | 48(7) | 102(14) | 29(11) | 50(6) | 11(4) | 53(6) | 8(6) | 52(3) | ND | |
| D2 | 95(9) | 39(7) | 117(15) | 27(11) | 33(5) | 8(4) | 22(5) | ND | 25(1) | ND | |
| Ohta | O5 | 446(38) | 287(28) | 265(27) | 81(21) | 203(8) | 55(7) | 116(11) | 33(8) | 119(6) | 10(1) |
| O4 | 290(27) | 205(18) | 258(28) | 85(17) | 126(12) | 30(6) | 70(7) | 25(8) | 113(6) | 13(1) | |
| O3 | 233(20) | 171(17) | 154(18) | 35(14) | 76(8) | 17(4) | 50(6) | 15(7) | 77(4) | ND | |
| O2 | 242(22) | 182(19) | 113(17) | 39(16) | 71(6) | 14(4) | 48(6) | ND | 88(4) | ND | |
| Niida | N5 | 419(38) | 316(31) | 159(16) | 72(11) | 58(6) | 15(4) | 52(6) | ND | 10(1) | ND |
| N4 | - | - | 229(22) | 95(13) | 27(4) | ND | 56(5) | ND | 9(1) | ND | |
| N3 | 110(13) | 75(8) | 58(8) | 30(7) | 29(4) | ND | 31(4) | ND | 13(1) | ND | |
| N2 | 95(9) | 38(7) | 85(10) | 47(8) | 15(3) | ND | 47(7) | 11(6) | 15(7) | ND | |
| Mizunashi | P4 | - | - | 222(21) | 78(12) | 108(10) | 68(15) | 137(9) | 36(8) | 63(3) | ND |
| P3 | 383(34) | 271(28) | 98(13) | 21(11) | 116(11) | 80(16) | 86(8) | 26(9) | 49(4) | ND | |
| P2 | 140(14) | 118(14) | 138(14) | 63(11) | 74(7) | 39(12) | 53(5) | 8(4) | 42(2) | ND | |
| P1 | - | - | - | - | 87(9) | 70(14) | 47(5) | 13(5) | 33(3) | ND | |
| Mano | M5 | 109(7) | 44(2) | 38(5) | 14(5) | 31(4) | ND | 24(3) | ND | ND | ND |
| M4 | 166(7) | 81(4) | 28(5) | 11(7) | 15(3) | ND | 10(2) | ND | 7(2) | ND | |
| M3 | 68(5) | 31(2) | 32(5) | ND | 21(3) | ND | ND | ND | 12(2) | ND | |
| M2 | 132(8) | 60(3) | 24(5) | ND | 14(3) | ND | 7(3) | ND | ND | ND | |
| River | Sampling Site | 137Cs Concentration Ratio Filtered/Unfiltered |
|---|---|---|
| Odaka | D2 | 0.57 ± 0.24 |
| Ohta | O2 | 0.80 ± 0.12 |
| Niida | N5 | 0.57 ± 0.10 |
| Mano | M5 | 0.40 ± 0.14 |
| River | Sediment | River water | ||||
|---|---|---|---|---|---|---|
| A0w (Bq∙kg−1) | λs (y−1) | Te (y) | A0w (mBq∙L−1) | λw (y−1) | Te (y) | |
| Odaka | 1990 | 0.15 ± 0.04 | 4.7 ± 1.3 | 121 | 0.19 ± 0.09 | 3.7 ± 1.7 |
| Ohta | 8020 | 0.46 ± 0.12 | 1.5 ± 0.4 | 387 | 0.34 ± 0.10 | 2.1 ± 0.6 |
| Niida | 3272 | 0.39 ± 0.13 | 1.8 ± 0.6 | 401 | 0.66 ± 0.12 | 1.0 ± 0.2 |
| Mano | 1103 | 0.33± 0.03 | 2.1 ± 0.2 | 221 | 0.78 ± 0.07 | 0.9 ± 0.1 |
© 2018 by the authors. Licensee MDPI, Basel, Switzerland. This article is an open access article distributed under the terms and conditions of the Creative Commons Attribution (CC BY) license (http://creativecommons.org/licenses/by/4.0/).
Share and Cite
Shizuma, K.; Nursal, W.I.; Sakurai, Y. Long-Term Monitoring of Radiocesium Concentration in Sediments and River Water along Five Rivers in Minami-Soma City during 2012–2016 Following the Fukushima Dai-ichi Nuclear Power Plant Accident. Appl. Sci. 2018, 8, 1319. https://doi.org/10.3390/app8081319
Shizuma K, Nursal WI, Sakurai Y. Long-Term Monitoring of Radiocesium Concentration in Sediments and River Water along Five Rivers in Minami-Soma City during 2012–2016 Following the Fukushima Dai-ichi Nuclear Power Plant Accident. Applied Sciences. 2018; 8(8):1319. https://doi.org/10.3390/app8081319
Chicago/Turabian StyleShizuma, Kiyoshi, Wim Ikbal Nursal, and Yushi Sakurai. 2018. "Long-Term Monitoring of Radiocesium Concentration in Sediments and River Water along Five Rivers in Minami-Soma City during 2012–2016 Following the Fukushima Dai-ichi Nuclear Power Plant Accident" Applied Sciences 8, no. 8: 1319. https://doi.org/10.3390/app8081319
APA StyleShizuma, K., Nursal, W. I., & Sakurai, Y. (2018). Long-Term Monitoring of Radiocesium Concentration in Sediments and River Water along Five Rivers in Minami-Soma City during 2012–2016 Following the Fukushima Dai-ichi Nuclear Power Plant Accident. Applied Sciences, 8(8), 1319. https://doi.org/10.3390/app8081319