1. Introduction
Applications of nonlinear optics have been widely regarded as powerful tools that are capable of providing quantitative spectral information in condensed matter characterization. These applications span from plasma to solid-state materials and nanostructures, as well as to interfaces and biological media [
1,
2,
3,
4,
5]. Raman effect based spontaneous and coherent scattering techniques are of special attention due to their selectivity and sensitivity down to a chemical bond level, and that in turn provides access to important physical mechanisms and fundamental interactions. However, in spontaneous Raman spectroscopy, reliable data on weak resonances is difficult to obtain. In the last decade, coherent Raman spectroscopy methods have been successfully demonstrated in optical microscopy [
6,
7,
8,
9,
10]. Spectral responses with a resolution of a few cm
−1 have been demonstrated in various applications that focused on the characterization of biological matter. It is worth noting that these approaches provide only dispersion for the imaginary part of the resonant optical nonlinearity. The overwhelming majority of studies are in the frequency domain, with a recent focus on novel solid-state materials [
11,
12,
13,
14] and molecular/biological media [
15,
16,
17,
18]. The coherent Raman based microscopy techniques were recently applied to image biological tissue and cells with sub-micron spatial resolutions capable of resolving the spatial structures of key constituents when their characteristic Raman active vibrations are targeted [
19,
20]. The spontaneous Raman microscopy has been applied with a greater focus towards the analysis of specific vibrations within cells, tissues and their spectral features. Multi-line spectra were analyzed with respect to relative changes in the intensities and spectral shifts for main phonon lines, depending on growth techniques for solid-state materials as well as scattering geometries with respect to crystal axes [
21,
22]. For biological media, efforts were focused towards the goal of correlating those with bio-molecular alterations occurring on cellular and sub-cellular levels [
23,
24]. Resolving lattice or molecular vibration damping rates
Γ (or linewidths,
∆ν = 1/
Γ) and line shapes, which are ultimately key parameters in characterizing atomic/molecular bonds, has not been of specific effort primarily due to insufficient detection sensitivity and spectral resolution. The vibration damping rate is strongly influenced by unit cell structure and respective phonon properties in crystals and inter- and intra-molecular interactions in soft media. Therefore, the ability to measure Raman line shapes and sub-structures with high precision is absolutely important from the standpoint of having access to fine inter- and intra-molecular interactions and their physical mechanisms. Spontaneous Raman spectroscopy has a typical resolution of ~3–7 cm
−1 and often requires the application of data post-processing algorithms to retrieve spectra. Thus, for current state-of-the-art spectral domain techniques, the ability to access critical inter- and intra- molecular interactions of key molecular groups within biological specimens is limited. Coherent Raman microscopy, which employs picosecond pulses to attain high peak powers, cannot provide a better spectral resolution due to the pulse bandwidths (~5–20 cm
−1). Additional measurement artifacts and sources of imprecision come from a need to mechanically tune laser wavelengths in point-by-point spectral measurements with an obvious adverse impact on precision. Thus, the desired precision in detecting Raman line shapes and bandwidths may not be achieved. Precise information on dispersion of the nonlinear optical susceptibility in Raman active media is essential in order to gain insight into the physics of intra- and inter-atomic and molecular interactions. For solid state, detailed knowledge of Raman active vibrational properties in intrinsic and doped materials, as well as in thin films, is of high value from the standpoint of identifying mechanisms that limit transport parameters which are critical for device applications. For biological media, this can become a powerful tool in detecting small spectral changes that can be translated to variations in bio-molecular composition and ultimately lead to disease diagnoses on a molecular level.
In this report, we discuss and implement a method that is applied to characterize crystal phonons and Raman active vibrations in soft matter. We show how to obtain high spectral resolution dispersion data for the resonant part of the third-order optical nonlinearity (χ(3)), for both real and imaginary parts, within experiments when the medium is probed with sub-micron spatial resolution. Time-resolved coherent anti-Stokes Raman scattering (CARS) replicas are detected with femtosecond resolution and can be traced within orders of magnitude of the signal decay. This enables resolution of fine spectral features in dispersion of the resonant third-order nonlinearity that cannot be reliably detected by Raman based spectroscopy techniques. For solid state medium, we focused our study on phonon modes in potassium titanyl phosphate crystal (KTiOPO4 or KTP) as the crystal has the most complex vibrational spectra represented by vibrations of different interatomic groups. The material has been shown in a variety of applications as an efficient solid state medium for generation of Raman shifted components within source lasers. The crystal is also a good candidate within applications developing a few femtosecond laser source based on stimulated Raman scattering. Complex phonon lines were analyzed in the KTP crystal where we focused on vibrations within titanium octahedron and Ti-O-P intergroup vibrations. For the TiO6 octahedron, we resolved a Raman doublet with a 62 cm−1 frequency difference and slightly different phonon decay times of 495 fs and 515 fs for the two closely spaced vibrations. For phonons representing Ti-O-P intergroup vibrations, we found three components with decay times within the 0.95–1.2 ps range that translate to phonon linewidths of 9.1 ± 0.4 cm−1, 7.5 ± 0.6 cm−1, and 11.2 ± 0.5 cm−1. Comparing Raman active C-C stretching vibrations in fat tissue and oil, we found close similarity between the two. Picosecond dephasing times within the 1.6–2.7 ps range has been detected. Based on the time-domain CARS data, we are able to deduce linewidths as narrow as 4.1 cm−1 in fat tissue which has not been resolved in prior works that used spontaneous scattering and frequency domain coherent Raman spectroscopy methods.
2. Materials and Methods
Third-order nonlinear polarization
is the origin of the scattered signal at shifted frequency in coherent Raman spectroscopy. Here, we will consider a case of coherent anti-Stokes Raman scattering (CARS) with three incident fields involved. The nonlinear polarization is then expressed in terms of the third-order susceptibility (
χ(3) (
ωas;
ω1, −
ω2,
ω3)) and is a nonlinear response of the medium to incident optical fields
E1,
E2,
E3:
If one chooses to represent the polarization through the molecular susceptibility tensor (
α), the nonlinear polarization expression can be written as following:
N—density of molecules,
Q—coherent amplitude of molecular or lattice vibrations,
ωas—anti-Stokes frequency. The macroscopic coherence is the statistical average of molecular displacements (
qi) with Raman frequency (
ωR) and independent phases (
φi). Upon the action of the driving pair of pulses (
E1,
E2), the displacements are forced to accept common phase (
φ1 −
φ2). The difference in frequency of the pair (
ω1 −
ω2) is tuned to match the Raman active vibration (
ωR) in order to achieve the maximum value of
Q. After the action of the two fields, the coherence decays freely in time as a result of inter- and intra-atomic/molecular interactions that lead to changes in the individual phases (pure dephasing) [
25,
26]. Third wave/pulse
E3, which can be delayed in time with respect to the driving fields, is scattered on the time-dependent coherence
Q(
t), producing a signal at the anti-Stokes frequency (
ωas).
The coherent amplitude can be represented in terms of an instantaneous response function
G(
t), which is the characteristic of the ensemble oscillating at Raman frequency (
ωR =
ω1 −
ω2), coupled to the finite width driving pulses [
26]:
Time-domain CARS signal (
Sas(td)) can be expressed as the following:
The
κ constant represents combined field coupling coefficients to the molecular/atomic system (
κ12) for
E1,
E2 fields and the
E3 field to the coherent amplitude.
The above equations for the coherent amplitude and CARS signal are Fredholm type-I integral equations and can be solved numerically or using the Fourier transform method [
27]. The spectra and autocorrelation functions of the
E1,
E2, and
E3 pulses are known and can be measured. Provided the condition that
is a real function, a Fourier transform of the response function
G(
t) can be obtained. This is true for many types of vibrational systems for which diffusional phase shifting events are minimized or non-existent. Therefore, fine features in the spectra can be effectively resolved in the vicinity of Raman active vibrations driven by fairly broadband ultrashort pulses. In the case of extremely short optical pulses, or when
G(
t) does not change much on a timescale of the pulsewidths, the integrations are not necessary to calculate the signal (
Sas(
t)). Taking into account Equations (1) and (2), a final expression for
χ(3) can be straightforwardly derived:
Thus, the experimental CARS transient signal (
Sas(
td)) can be used as a source function to obtain the imaginary and real parts of
χ(3) with the help of Equation (5). The density matrix approach [
28] will also bring the same result as the time evolution of the non-diagonal elements and is identical to the one of the coherent amplitude. Coherently driven phonons have been the subject of detailed studies in the past [
29].
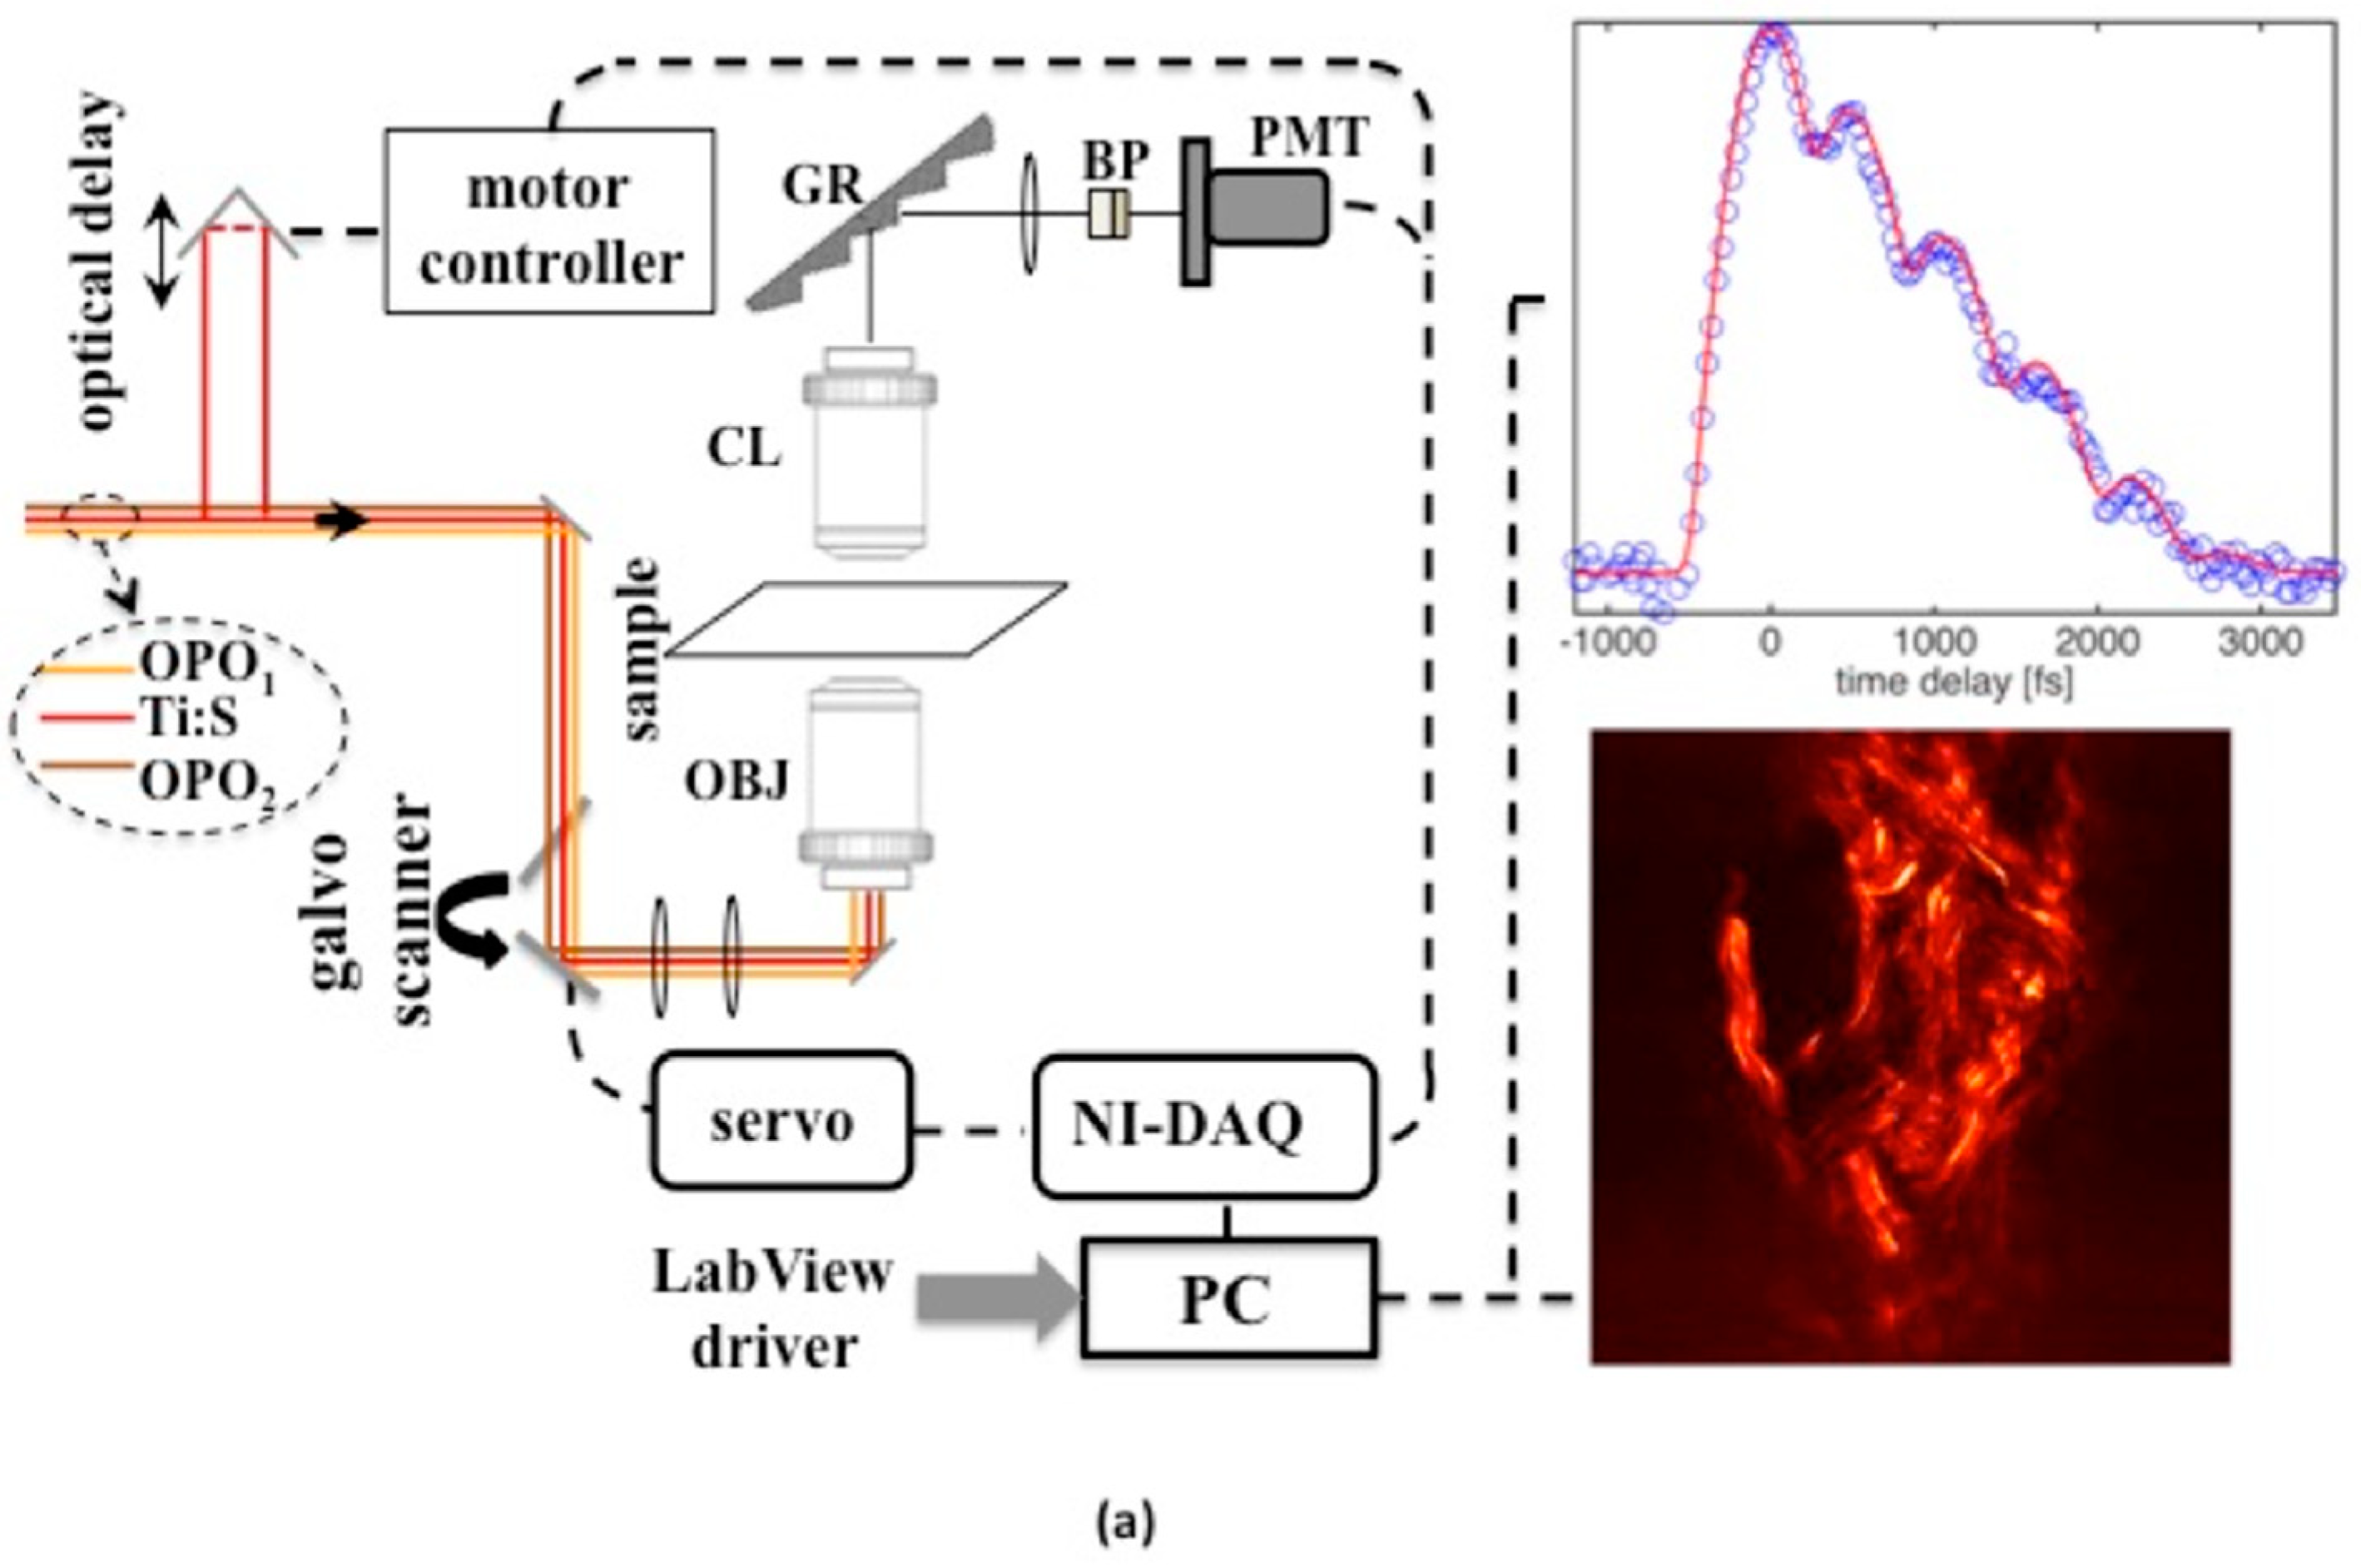
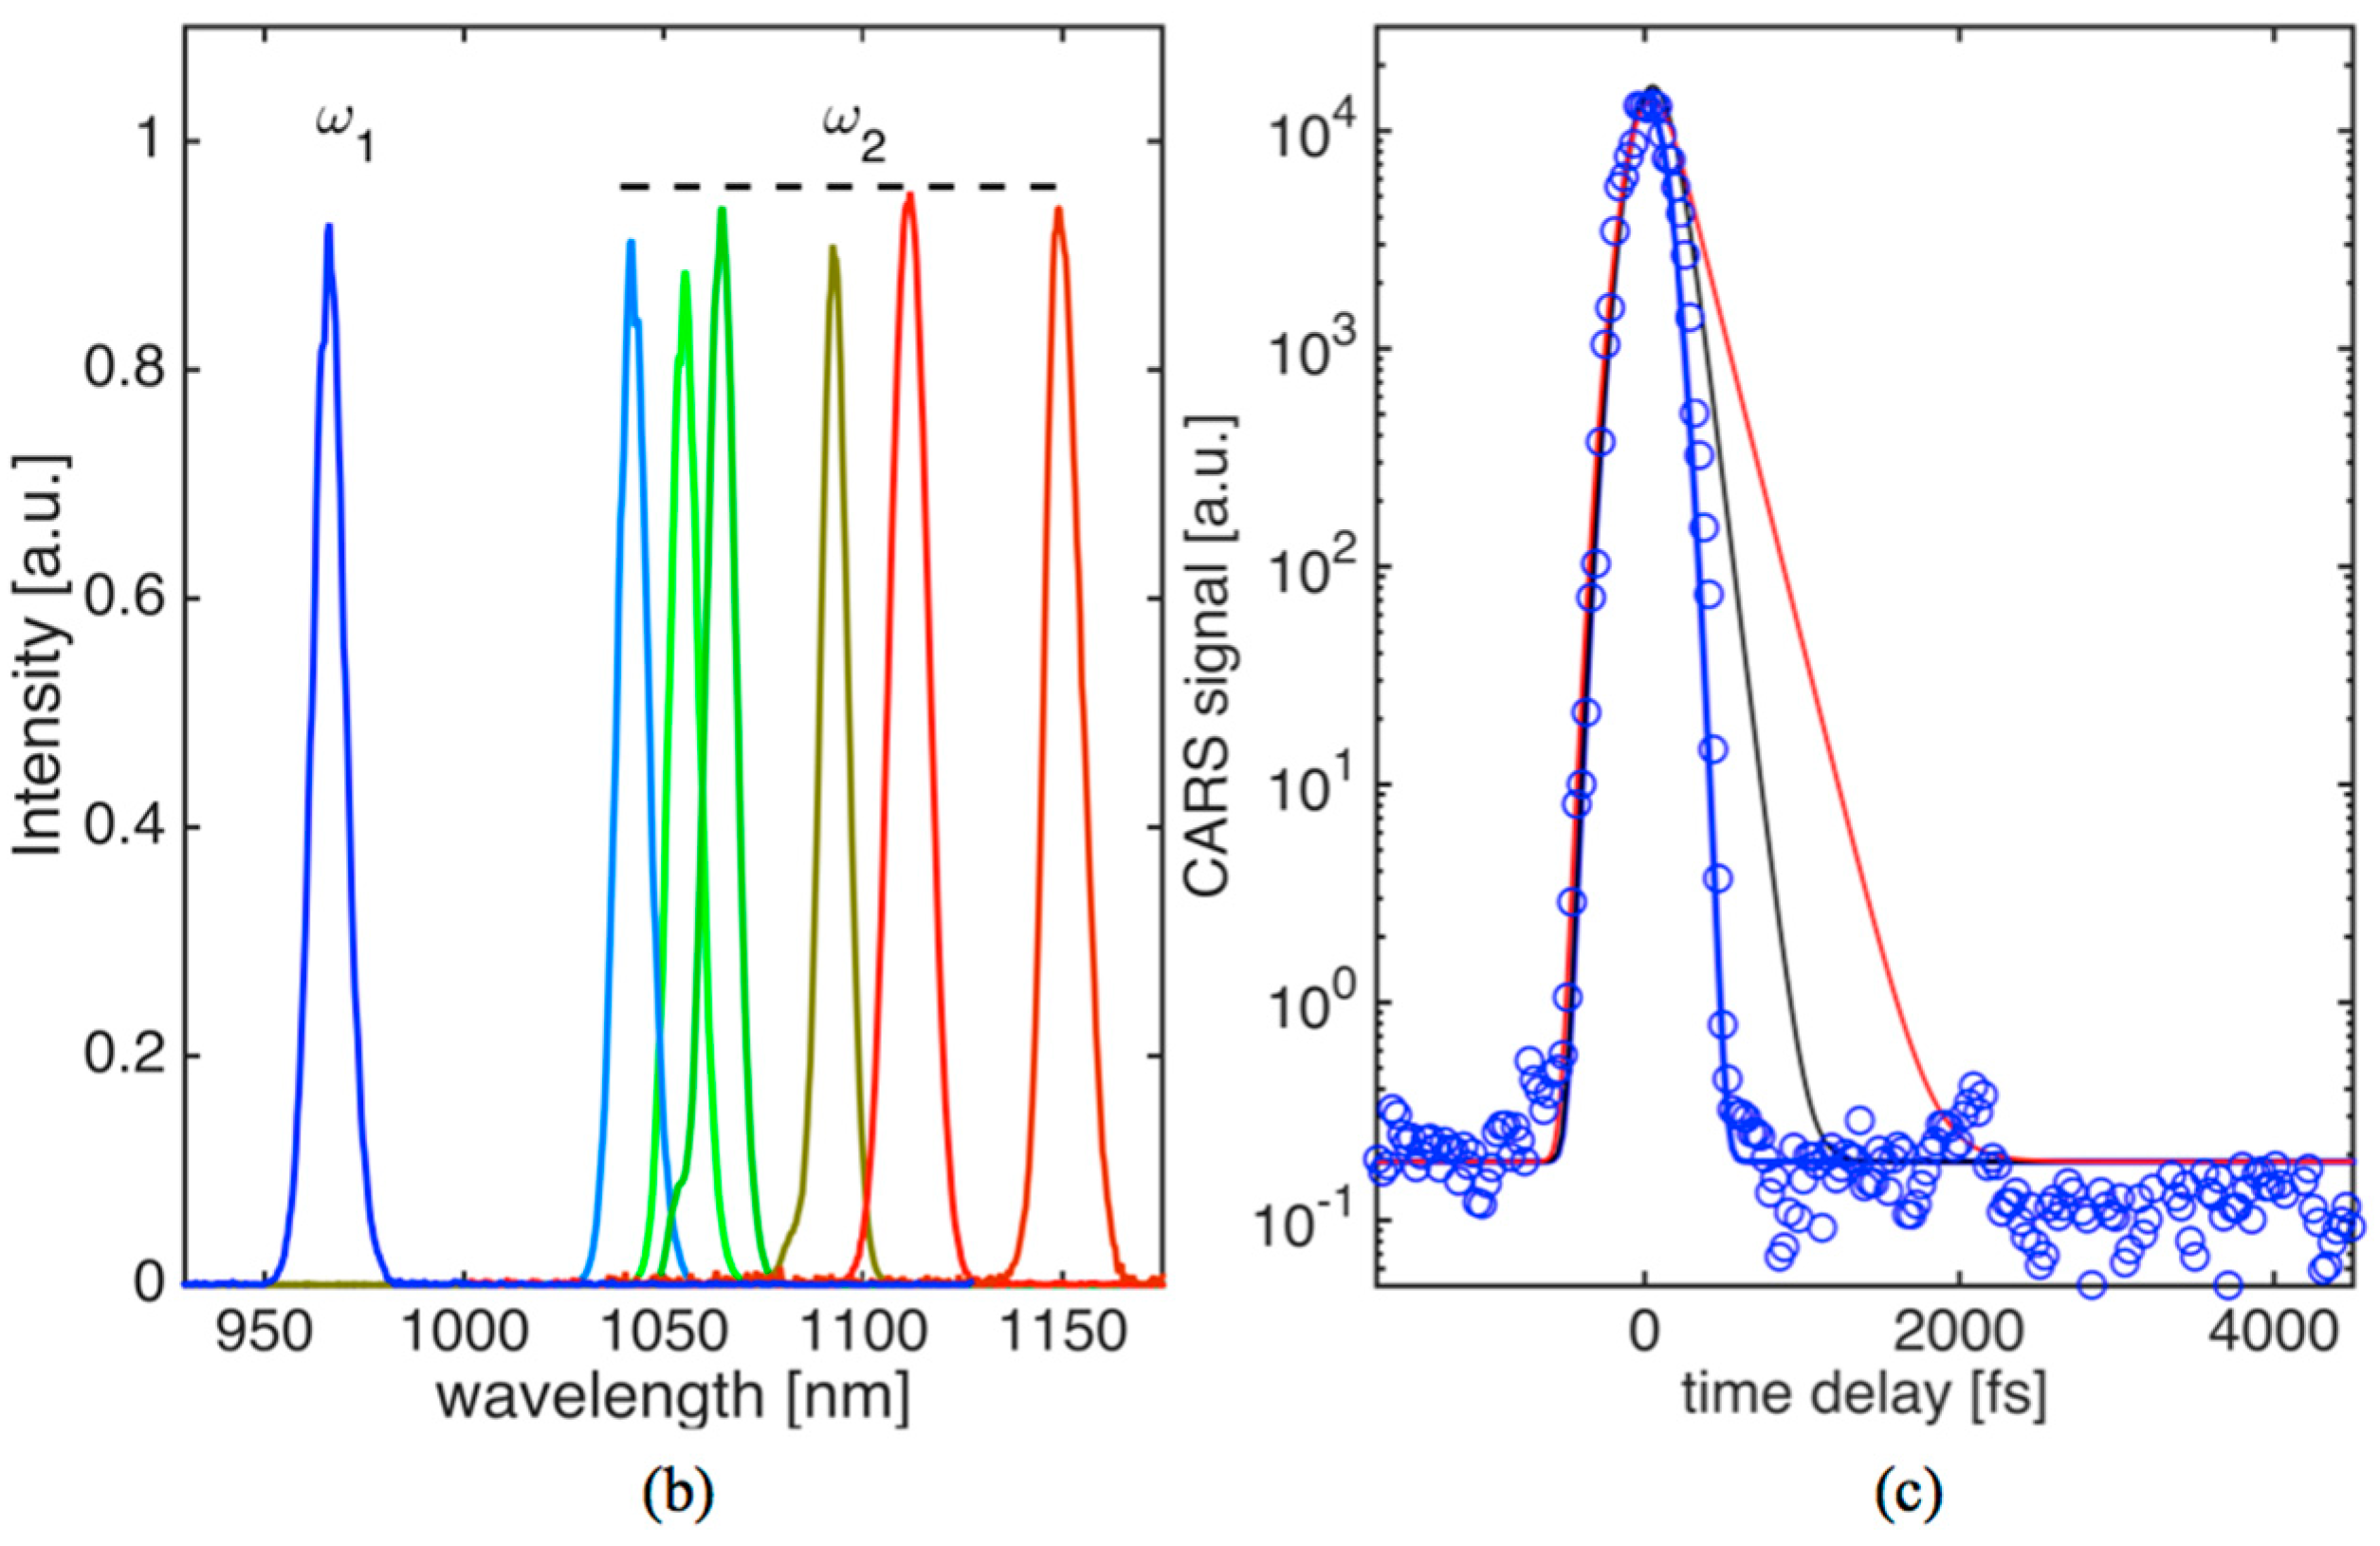
The experimental design exploits a multicolor femtosecond pulse laser set up that is used here to characterize solid state and biological media. The design also ensures imaging capability with sub-micron spatial resolution. The detection part of the experimental set up is shown in
Figure 1. As was mentioned above, three colors are needed to enable time-domain CARS. This is ensured by having time-synchronized optical parametric oscillator (OPO) pulses at two independently tunable wavelengths [
30,
31]. The OPOs are driven by the same pump source, a high-power mode-locked Ti:sapphire oscillator (Coherent Mira HP, 3.5 W, 76 MHz,
tp = 110 fs, 720–960 nm). The third color is a small fraction that is split from the Ti:sapphire oscillator output. The OPO gain material is periodically poled lithium tantalate (PPSLT) with a grating period that can be selected for a particular parametric process. Typical power outputs from the OPOs are, depending on wavelength, between 200–375 mW, their pulsewidths are 115–150 fs, and their pulse bandwidths are in the range of 95–126 cm
−1. Continuous tuning and wavelength adjustment at a fixed grating period is accomplished by using intracavity Lyott filters and by varying OPO cavity lengths. The three beams are directed to a galvo scanner and imaged onto the entrance pupil of an apochromat objective lens (OBJ) with high numerical aperture (NA = 1.2). A photomultiplier tube (PMT) with high gain and quantum efficiency was used to detect signal photons at wavelengths selected by a combination of bandpass filters and diffraction gratings. The output from the PMT was digitized by a high-speed data acquisition card (DAQ).
Software code (written in Labview) was used for synchronized control of the galvo scanner, acquisition of the signal, and for the formation and display of images in 2D. With the available full angle scan provided by galvo drivers and with the DAQ card, an area of about 180 × 180 μm2 could be scanned up to a maximum rate of 4 frames/s. Another software code was used to provide control of the optical delay line and acquire a time-domain CARS signal. Typical point signal average times for sample images and time-domain CARS data were in the range of 1–200 ms, depending on the type of measurement and desired signal-to-noise ratio.
Three-color pulse CARS images at different time-delays can be generated with a spatial resolution of 380 nm. We were able to trace transient non-resonant CARS signals, generated in the forward direction, within higher than five orders of magnitude in solid glass material while the average power of the combined beams was kept under 30 mW (~0.15 nJ/pulse per beam) at the sample. The non-resonant time-domain signal in glass (see
Figure 1c) represents instrument function showing our capability to detect decay in coherence with a characteristic dephasing time (
T2) shorter than 150 fs. This is shown by comparing the experimental signal (blue ovals) with simulated CARS transients assuming
, where
h(
t)—Heavyside function and
T2 were set to 150 fs (black curve) and 250 fs (red curve). For the measurements presented below, recorded OPO spectra are shown in
Figure 1b. OPO
1 wavelength was kept fixed at 967 nm while OPO
2 could be tuned to provide access to Raman active vibrations in KTP crystal, oil and fat tissue within ~700–1300 cm
−1.
3. Results and Discussion
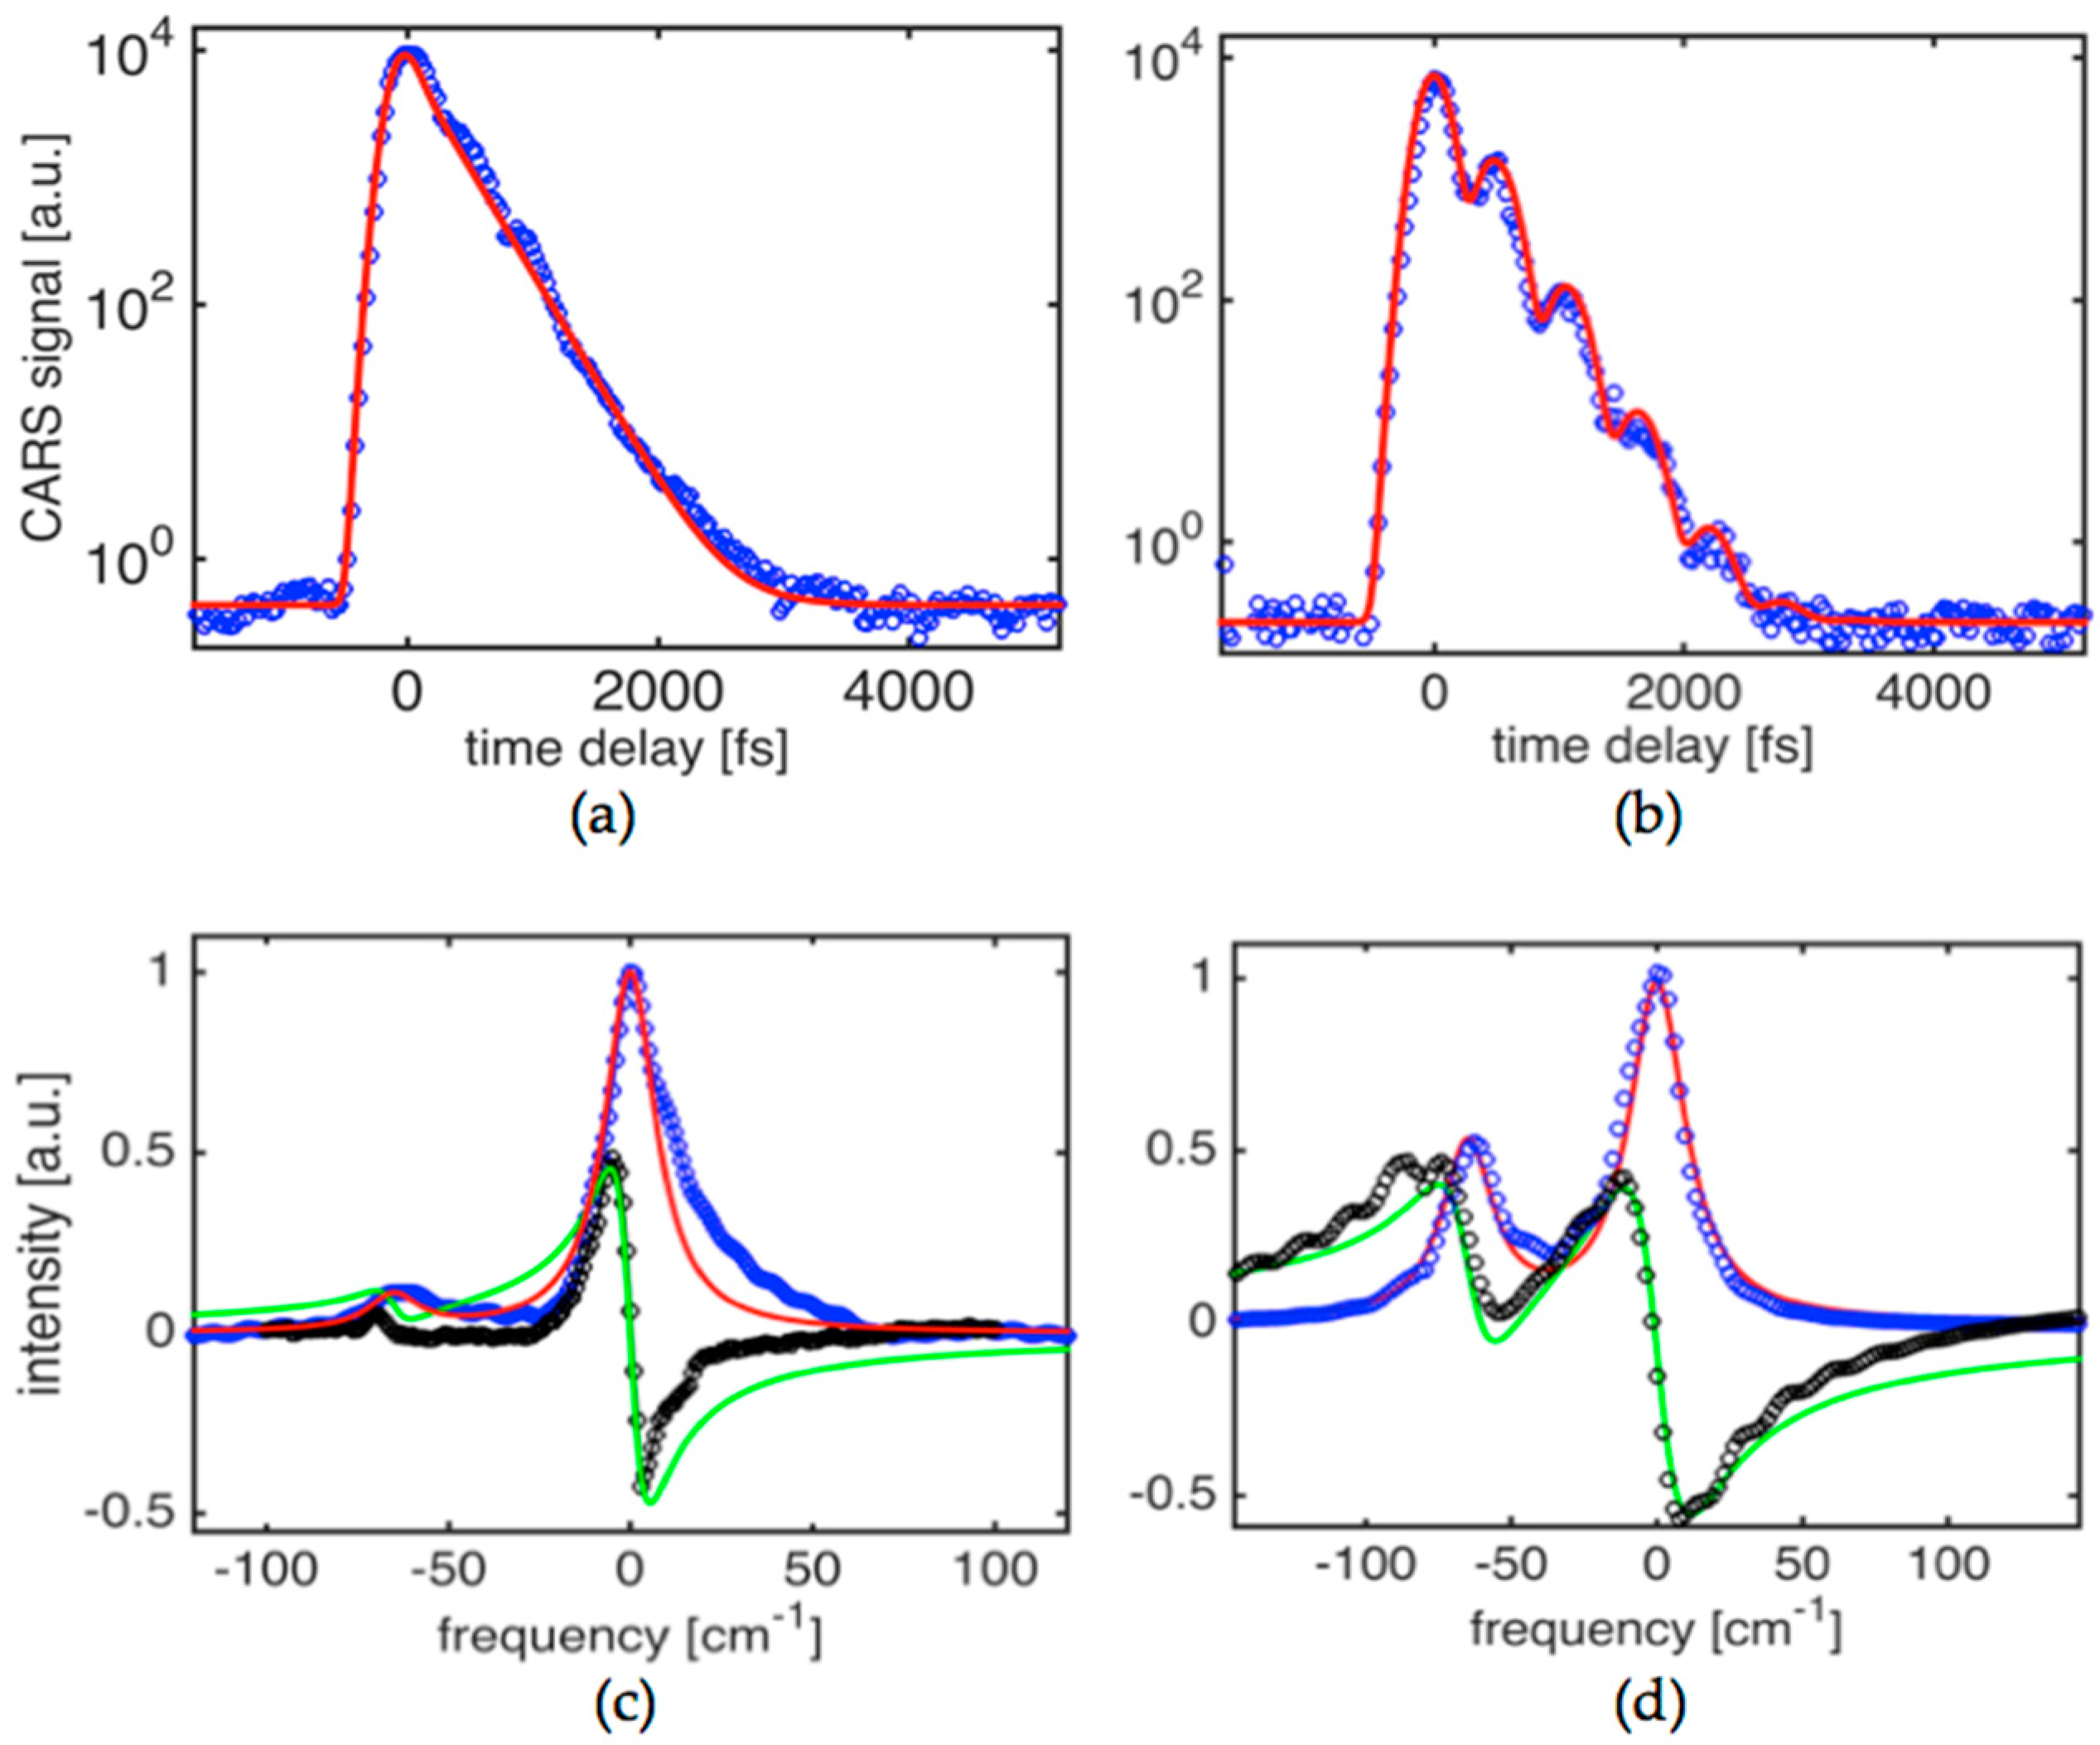
Figure 2a shows the time-domain CARS signal obtained in potassium titanyl phosphate (KTiOPO
4) crystal at a condition where one of the strongest fundamental modes has been driven by a pair of pulses at 1019 nm and 1098 nm. The crystal is flux-grown and was angle cut at
φ = 40° and θ = 0°. This ensures that the
A1 and
A2 symmetry tensor components are involved [
32] when
E1,
E2, and
E3 beam polarizations are set to parallel. The targeted mode is assigned to an asymmetric stretching mode vibration (
ν1(
A1g)) within the TiO
6 octahedron [
33]. The resonant contribution is dominant, as evidenced by an absence of a resolution limited peak at zero time delay. The experimental CARS signal can be fitted very well by a single exponential decay function for
G(
t) suggesting that, as expected for high quality crystals, the Raman line is homogenously broadened and corresponds to the loss of vibrational energy via a phonon parametric process (rather than pure dephasing) that primarily includes an overtone decay channel. The best fit yields a phonon decay time constant
T2 = 495 ± 10 fs that translates to a linewidth (
∆ν = 1/(
πc T2)) of 21.4 ± 0.5 cm
−1. In the case of 967 nm and 1041 nm combination for
E1,
E2-pulses, the time domain signal shows clear modulation corresponding to quantum beats of two components separated by ~62 cm
−1. The experimental signal shown in
Figure 2b can be fit well when the two line components (
ωR1 = 706 cm
−1 and
ωR2 = 768 cm
−1) are involved. The corresponding response function is then
. The best fit is achieved when the amplitude ratio is 9:5 and the corresponding
T21,
T22 times are 495 ± 10 fs and 515 ± 10 fs. It is obvious that in this case, due to the broad bandwidths of
E1,
E2-pulses (~85 cm
−1), the two components can be driven with nearly equal strength opposite to the result shown in
Figure 2a. In other words, the result shown in
Figure 2a corresponds to a phonon mode targeting condition where primarily only one phonon mode centered at (i.e.,
ω1 −
ω2 ~ 706 cm
−1) is driven and probed. This results in absence of the beat pattern and decay of the signal that is best fit with the single exponential decay response function presented above.
Figure 2c,d show the corresponding spectra for
χ(3), both for real and imaginary parts, obtained using the formalism described in
Section 2 that required solutions for the integral Equations (3) and (4). Solid lines are simulated spectra assuming Lorentzian lineshape and line parameters that have been mentioned above. This highlights the asymmetry seen in the spectra obtained using the experimental data. The best fit to the imaginary part is obtained assuming three components with ratios of 26:15:11, linewidths of 21 cm
−1, 24 cm
−1, 17 cm
−1 and line separations of 65 cm
−1 and 16 cm
−1, respectively.
Multiple Raman active modes can be driven by
E1,
E2 pulses at the same time, given fairly broad bandwidth pulses. When KTP phonon modes centered at ~830 cm
−1 are targeted, a complex nature of Raman active vibrations in the crystal is clearly seen in the detected CARS transients.
Figure 3a shows the time-domain CARS signal obtained for the case of coherently driven vibrations with the center wavelengths for
E1,
E2-pulses adjusted to 967 nm and 1052 nm, respectively. The signal carries a well pronounced modulation pattern that represents a coherent beat signal due to interference of at least two spectral components. This is governed by the exponential decay trend with a time constant that is clearly longer than the one observed for
ν1(
A1g) mode. This is also a substantially longer time than the pulsewidths used in the measurements and the width of the instrument function for the set up. We have therefore analyzed the obtained data for this case with the help of the result expressed by Equation (5). The non-resonant background, due to electronic nonlinearity, has a noticeable presence in the data as can be revealed by Fourier analysis of the CARS transient. The clustered phonon modes at ~830 cm
−1 that are driven by the broadband pulses have a weaker contribution, highlighting the fact that the modes have a smaller Raman scattering cross-section compared to the
ν1(
A1g) and
ν2(
Eg) modes, as well as narrower linewidths.
Multiple Raman active modes can be driven by
E1,
E2-pulses at the same time, given fairly broad bandwidth pulses. When KTP phonon modes centered at ~830 cm
−1 are targeted, a complex nature of Raman active vibrations in the crystal is clearly seen in the detected CARS transients.
Figure 3a shows the time-domain CARS signal obtained for the case of coherently driven vibrations with the center wavelengths for
E1,
E2-pulses adjusted to 967 nm and 1052 nm, respectively. The signal carries a well pronounced modulation pattern that represents a coherent beat signal due to interference of at least two spectral components. This is governed by the exponential decay trend with a time constant that is clearly longer than the one observed for
ν1(
A1g) mode. This is also a substantially longer time than the pulsewidths used in the measurements and the width of the instrument function for the set up. We have therefore analyzed the obtained data for this case with the help of the result expressed by Equation (5). The non-resonant background, due to electronic nonlinearity, has a noticeable presence in the data as can be revealed by Fourier analysis of the CARS transient. The clustered phonon modes at ~830 cm
−1 that are driven by the broadband pulses have a weaker contribution, highlighting the fact that the modes have a smaller Raman scattering cross-section compared to the
ν1(
A1g) and
ν2(
Eg) modes, as well as narrower linewidths. Raman spectra retrieved from the time-domain signal are represented by the imaginary part of
χ(3)(
ω) and shown in
Figure 3b.
Figure 3c shows the corresponding real part of
χ(3)(
ω) in the frequency domain. Three separate components can be clearly seen in the retrieved spectra. The corresponding separations between the components are 18.5 cm
−1 and 45.9 cm
−1. This is in fairly good agreement with reported spontaneous Raman scattering data that provided the range of 20.4–29.0 cm
−1 and 34.6–39.2 cm
−1 for the two [
34]. Linewidths (FWHM) for the three components are 9.1 ± 0.4 cm
−1, 7.5 ± 0.6 cm
−1, and 11.2 ± 0.5 cm
−1, respectively. This compares fairly well to ranges of 10.2–12.6 cm
−1, 9.2–10.8 cm
−1, and 14.0–16.4 cm
−1, respectively, that have been reported for the spontaneous Raman spectroscopy measurements. A component amplitude ratio of 23:4:15 can also be retrieved and represents the best fit to the imaginary part of the
χ(3) spectra. As was mentioned above, due to a slower decay, phonon linewidths are more than two times narrower when compared to the high frequency modes (
ν1(
A1g) and
ν2(
Eg)), as shown in the results presented in
Figure 2. This is explained by the fact that the
ν1,2 modes have overtone decay channels with a higher phonon density of states for resulting lower energy phonons in parametric decay processes.
Thus, lack of the efficient decay channels for the ~830 cm−1 mode leads to a significantly lower damping rate for the driven vibrations. We believe that the mode belongs to Ti-O-P intergroup vibrations opposite to the former case (i.e., ~700 cm−1), representing vibrations within the TiO6 atomic group. The presence of the triplet line for the cluster centered at 830 cm−1 can be explained by shifted frequencies for vibrations of different symmetry within the Ti-O-P intergroup.
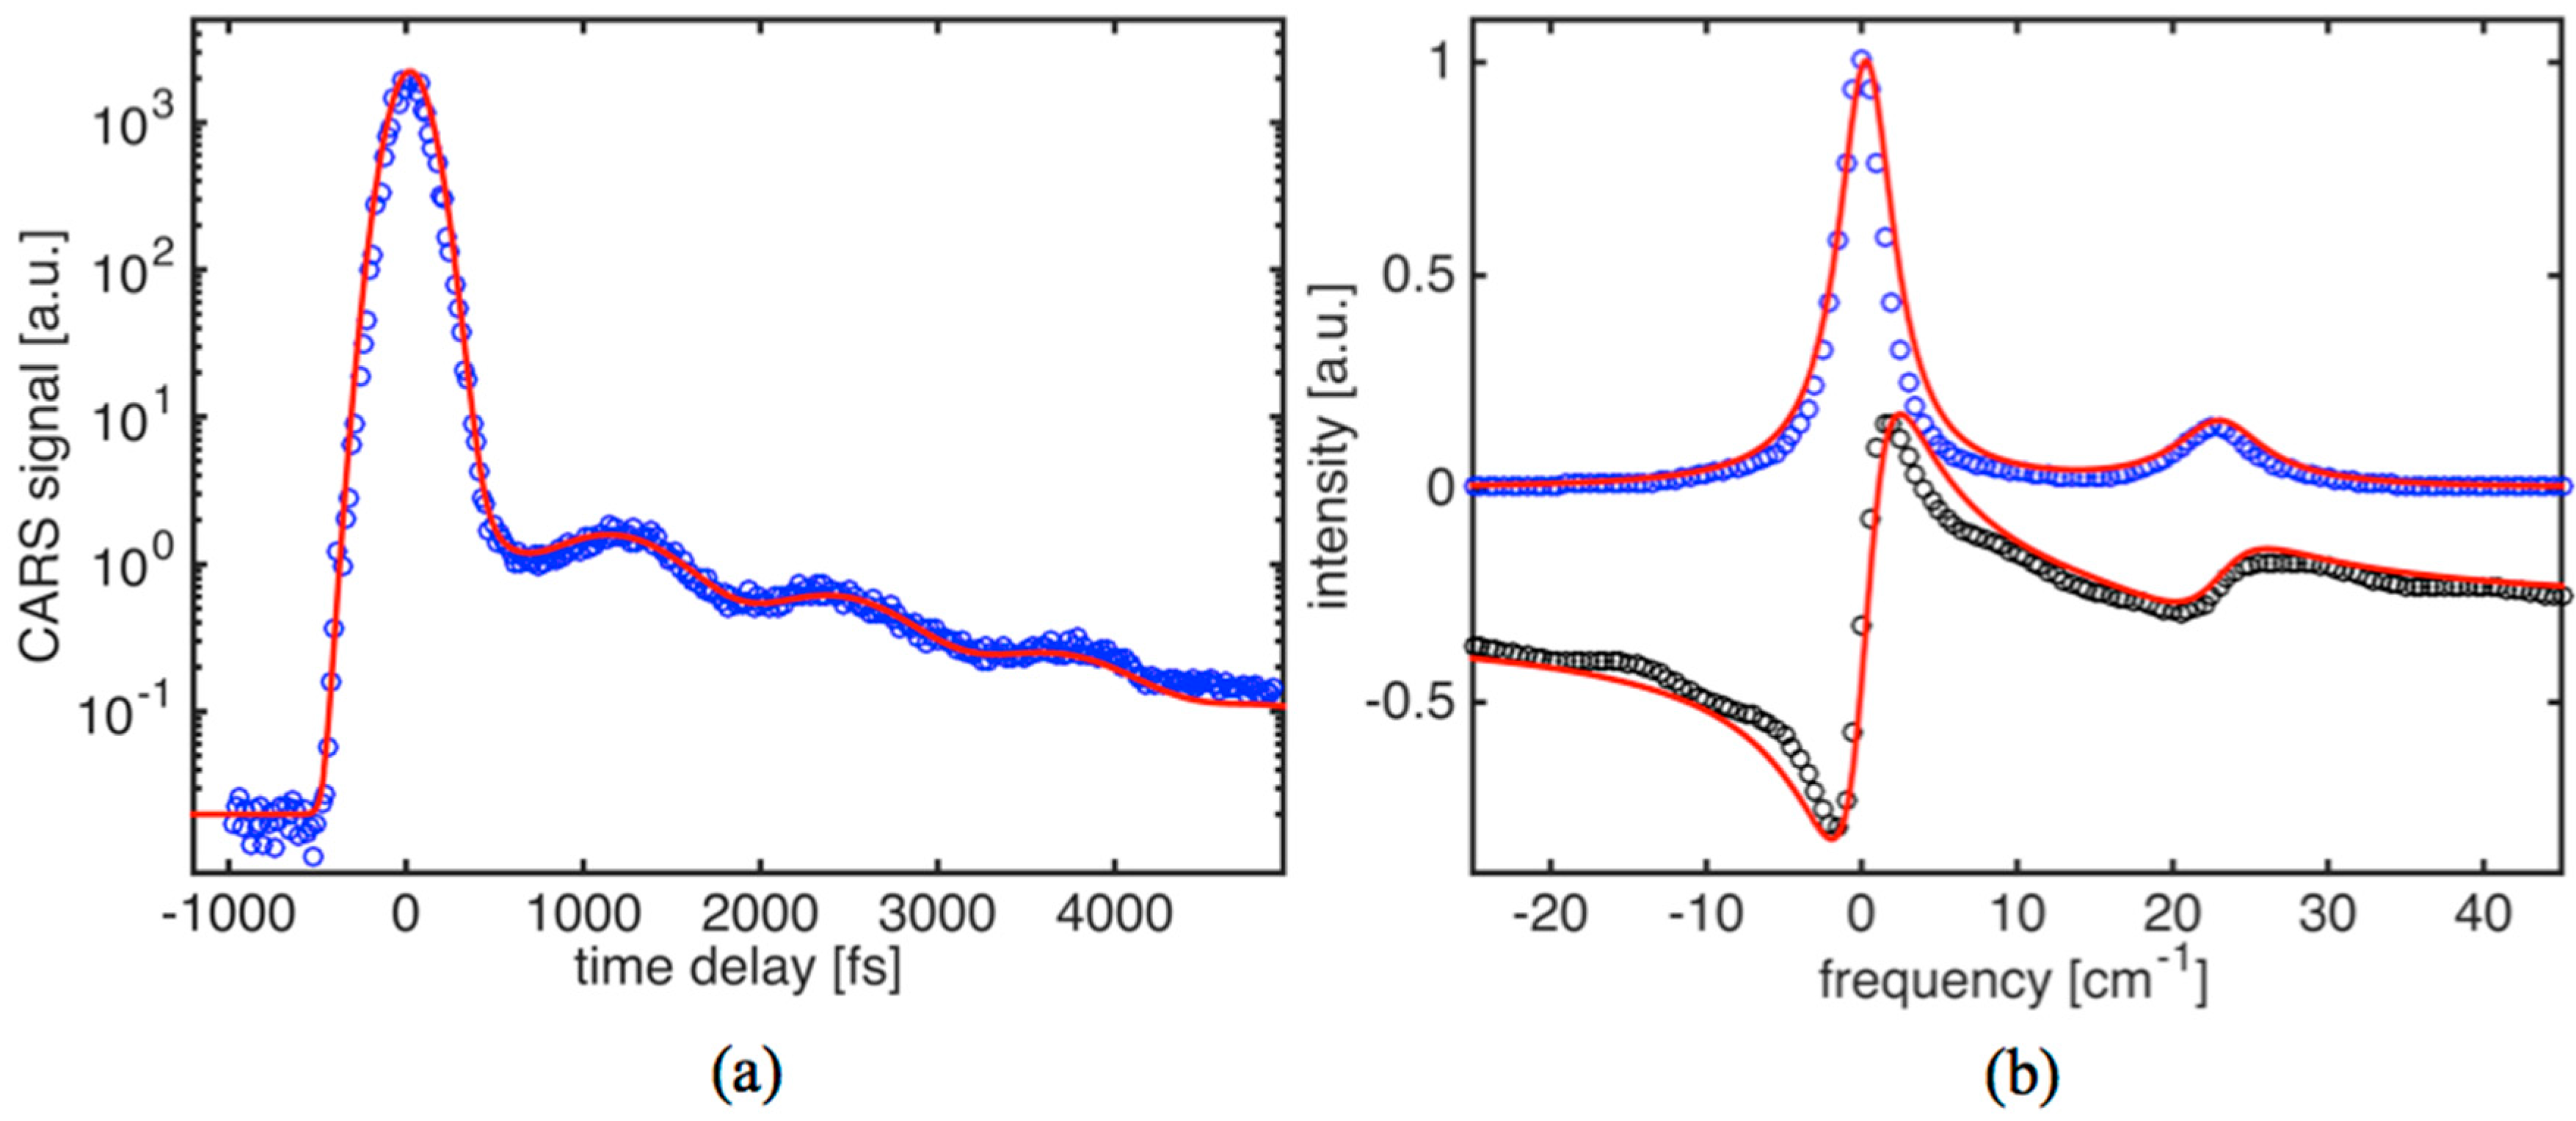
Raman studies of oil have recently attracted a strong interest in different fields of research. Unlike in crystal lattice, molecules in oil can move freely. Therefore, CARS signal decay is caused by pure dephasing due to collisions and translational motion of molecules. Collisions themselves result in random phase shifts in q
i. The contribution of the translational motion results in phase changes that are linear in time, due to the Doppler effect in between successive collisions. The dephasing rate due to collisions is uniform and does not depend on velocity distribution. The dephasing due to the Doppler effect (translational motion) is accounted for by averaged phase drift in time due to thermal velocity distribution. For a Gaussian distribution, the ensemble averaging results in a real function for
Q(
t). Namely,
where
for
ttv and
for
t >
tv [
35]. Constants α and β are molecular parameters (e.g., mean velocity, diffusion rate coefficient, etc.). Constant
tv is velocity correlation time.
Figure 4a shows the time-domain CARS signal for olive oil. The driving fields (
E1 and
E2) have been wavelength tuned to match the Raman active mode frequency of ~1072 cm
−1. Based on spontaneous Raman data, this is a relatively weak C-C stretching vibration. The CARS transient (
Figure 4a) shows a characteristic decay time of about 1.4 ps. The estimated diffusional dephasing time in oil is T
*D2/β
20 ms. Thus, the obvious conclusion is that the dephasing is entirely due to collisions. Also, the CARS transient exhibits clear modulation (beat pattern), suggesting the presence of a Raman doublet. The corresponding parameters for dephasing times of 2.8 ps and 1.9 ps provided the best fit to the data. By applying a solution provided by Equation (5) to the CARS transient, we can find that the strongest line component on
Figure 4b fits fairly well into a Lorentzian profile with linewidth
∆νL1 = 3.8 ± 0.1 cm
−1, while the second component is noticeably broader (
∆νL2 = 5.6 cm
−1).
The most recent data available in the literature for the vibrational mode shows a single peak with a ~7 cm
−1 linewidth [
36]. The discrepancy is explained by a lack of sensitivity and resolution (~5 cm
−1) to provide more precise data.
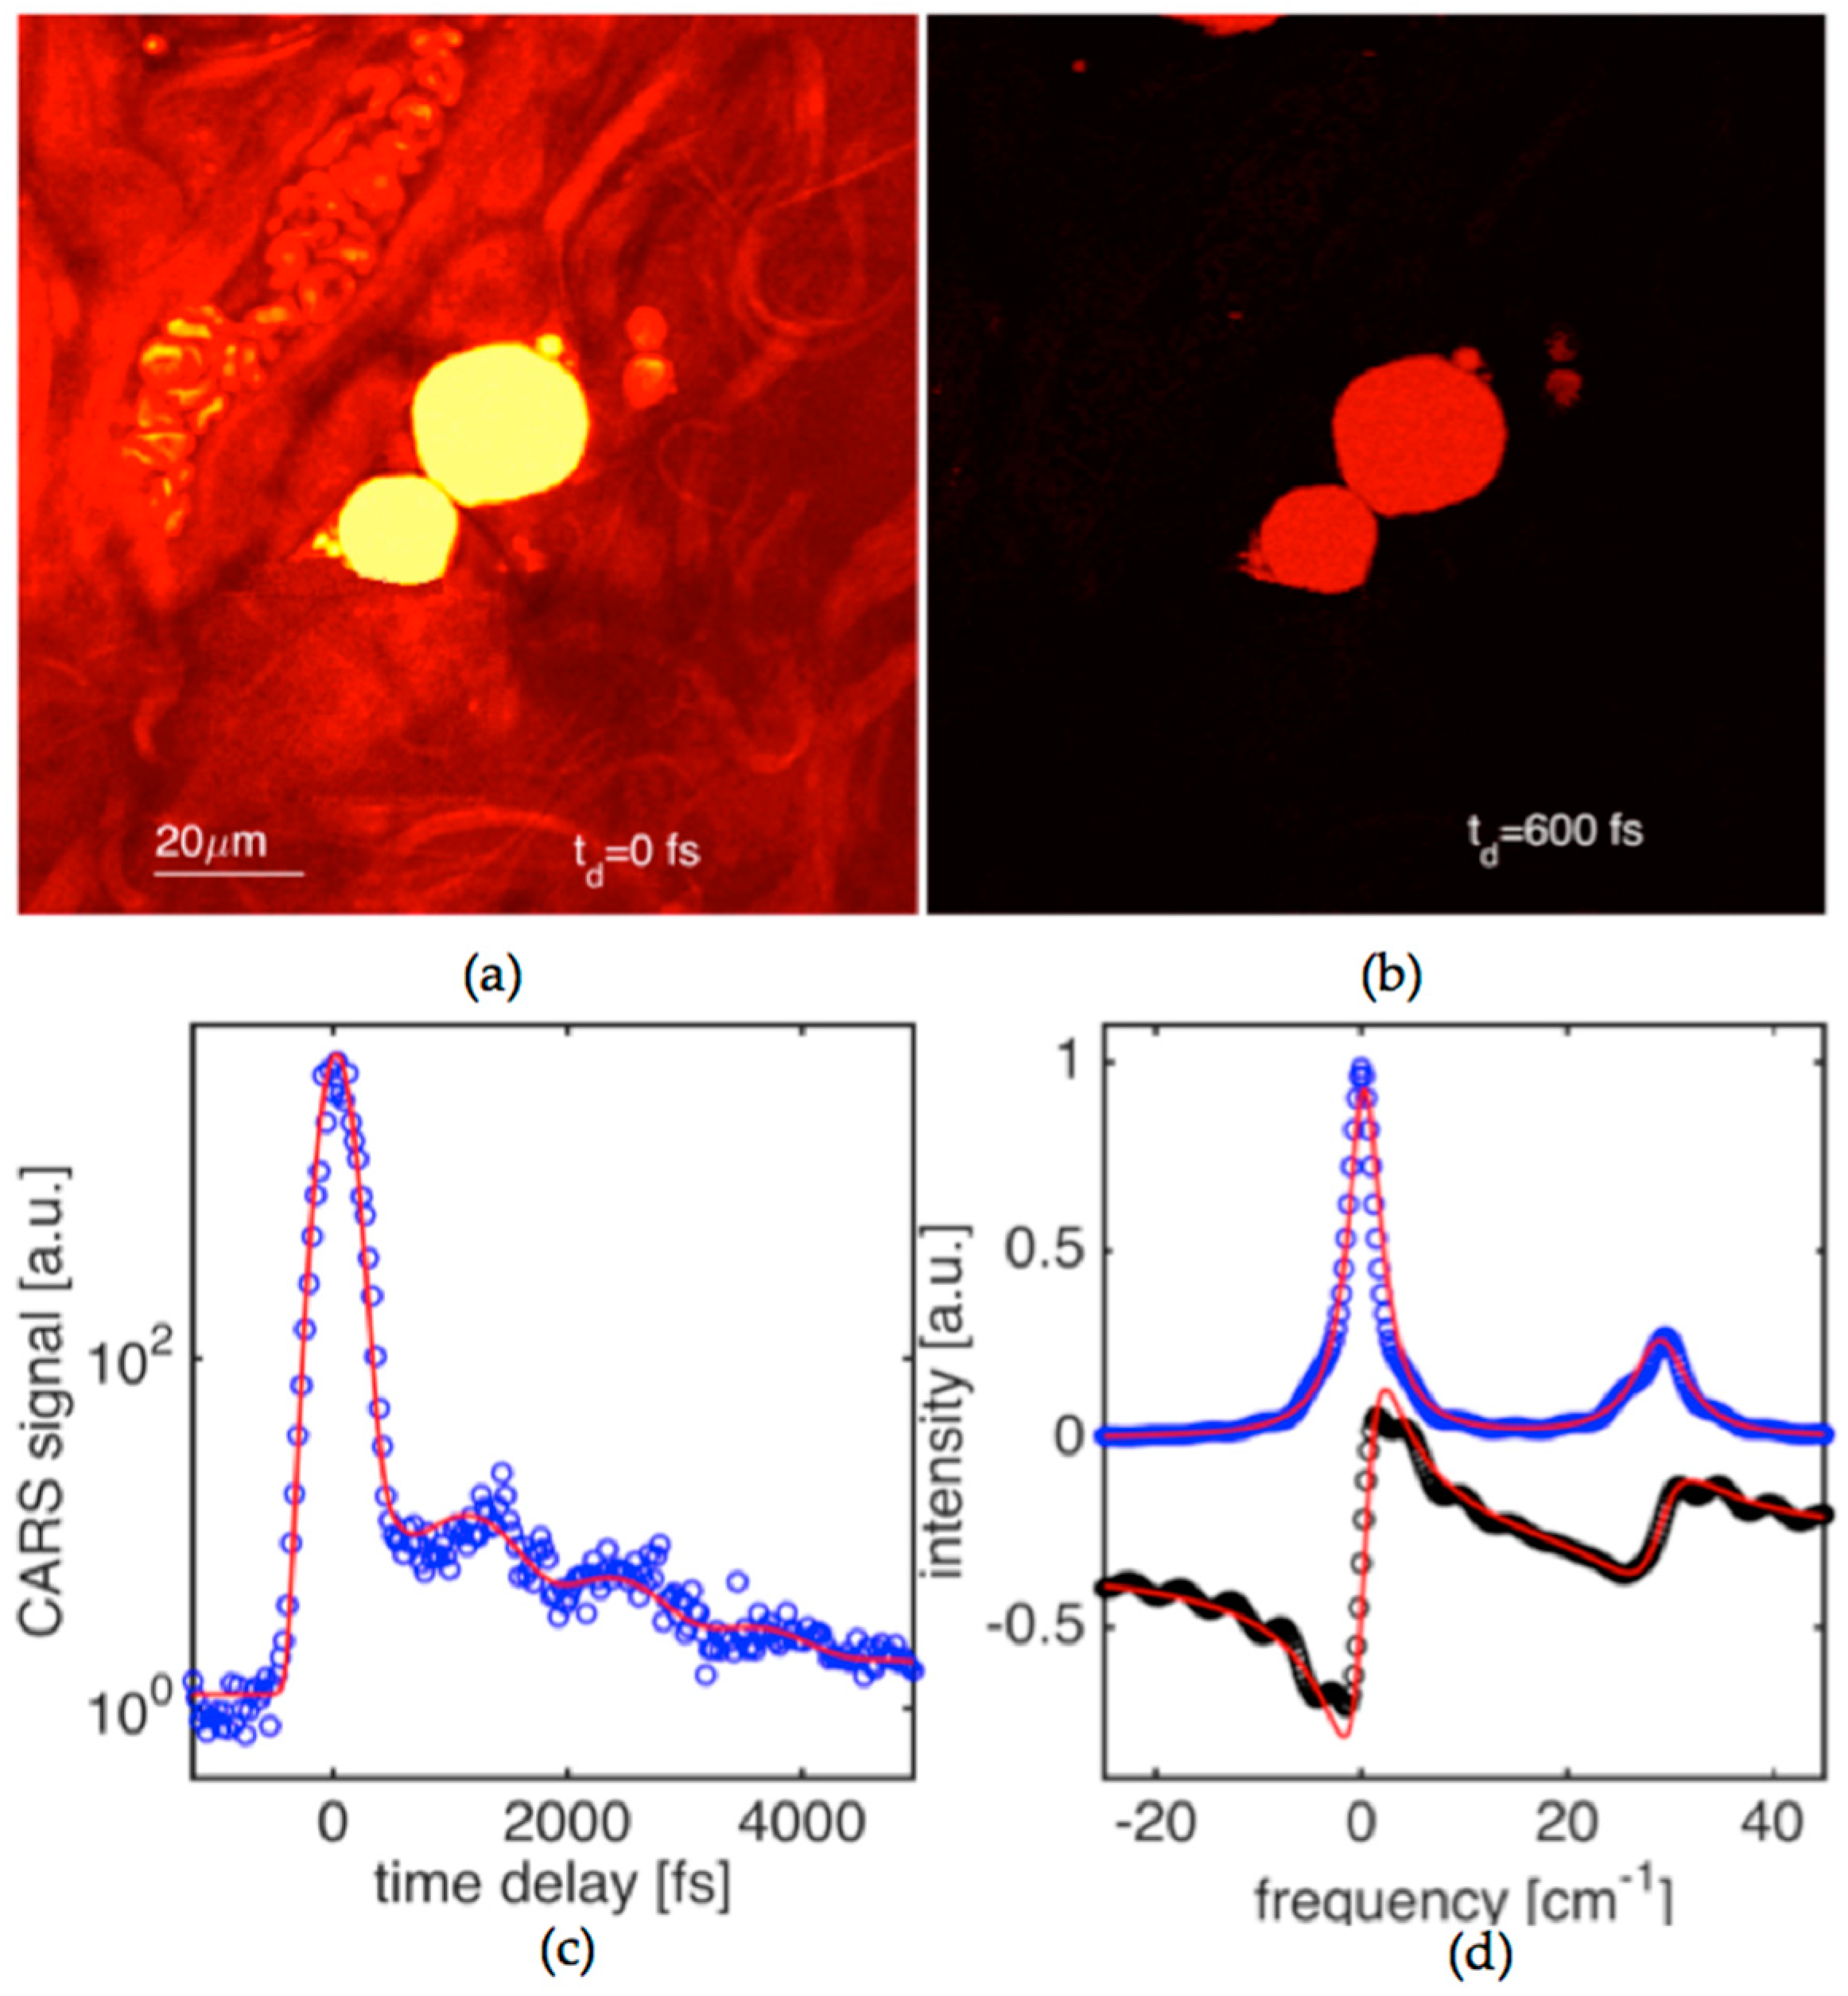
We have applied our method and experimental capabilities to enable quantitative microscopy where, as an example, we characterized biological tissue. We demonstrate imaging of tissue constituents, and then perform dephasing time measurements in targeted areas of the tissue by driving and probing in time characteristic Raman active vibrations.
Figure 5a shows a CARS image of mouse tissue (dermis area). The tissue samples were dissected from above the longisimus dorsi muscle of C57BL/6 mice. The image is taken when the delay time between driving (
E1,
E2) and probe (
E3) pulses set to zero. The driven Raman active mode was at a frequency of ~1072 cm
−1. The areas filled with dense mouse fat show very strong CARS signals. Collagen fiber bundles can be identified on the CARS image as well. The image contrast in the collagen bundle areas is significantly lower than the one for fat areas. Blood vessels can also be seen on the image with red blood cells (RBC) clearly resolved.
The CARS image shown in
Figure 5b was obtained at the same conditions, except that the probe pulse was delayed by 600 fs. The image contrast between fat and the surrounding areas is drastically improved exceeding one order of magnitude. This is due to the fact that the non-resonant background decays instantaneously in time while the coherence built for the Raman active vibration in fat is still quite appreciable.
Figure 5c shows CARS signal versus delay time at the same targeting condition for the Raman resonance in fat. The scanning area was reduced (~20 × 20 µm
2) to match a large piece of fat located at the center of the image shown in
Figure 5a. Signal fluctuations are fairly high, and the signal-to-noise ratio is only about a factor of five. This is despite the fact that data points in the CARS transient have been effectively averaged across a 4000 pixel area. The scanning was needed to obtain a reproducible time-domain signal. Single point measurement often led to data of poor quality that was the result of tissue damage. This problem will be more closely investigated in our future work. The obtained time-domain CARS signal shows a pronounced beat pattern of at least two spectral components with the corresponding dephasing times of 2.6 and 1.7 ps. The obtained transient has been analyzed by generating theoretical curves to fit the experimental data and the results are summarized in the caption. The corresponding dispersion of
χ(3), obtained with the help of Equation (5), is shown in
Figure 5c. It shows a doublet with linewidth parameters that are fairly close (within 15–20%) to the ones that were obtained in oil. The molecular composition of oils and lipids in fats are similar, and this should be reflected in Raman spectra. Our data confirms that the fat is responding primarily by its C=C double bond fatty acid vibrations that play key roles as signal messengers and lipid mediators in various biological systems.

