Article

A High-Efficiency Super-Resolution Reconstruction Method for Ultrasound Microvascular Imaging

1
Department of Electronic Engineering, Fudan University, Shanghai 200433, China
2
Key Laboratory of Medical Imaging Computing and Computer Assisted Intervention of Shanghai, Fudan University, Shanghai 200032, China
3
Institute of Functional and Molecular Medical Imaging, Fudan University, Shanghai 200030, China
*
Author to whom correspondence should be addressed.
Appl. Sci. 2018, 8(7), 1143; https://doi.org/10.3390/app8071143
Submission received: 17 June 2018 / Revised: 5 July 2018 / Accepted: 5 July 2018 / Published: 13 July 2018
(This article belongs to the Special Issue Ultrasound B-mode Imaging: Beamforming and Image Formation Techniques)

Abstract

:

Featured Application

This work makes real-time imaging of tumor microvessels more realistic.

Abstract

The emergence of super-resolution imaging makes it possible to display the microvasculatures clearly using ultrasound imaging, which is of great importance in the early diagnosis of cancer. At present, the super-resolution performance can only be achieved when the sampling signal is long enough (usually more than 10,000 frames). Thus, the imaging time resolution is not suitable for clinical use. In this paper, we proposed a novel super-resolution reconstruction method, which is proved to have a satisfactory resolution using shorter sampling signal sequences. In the microbubble localization step, the integrated form of the 2D Gaussian function is innovatively adopted for image deconvolution in our method, which enhances the accuracy of microbubble positioning. In the trajectory tracking step, for the first time the averaged shifted histogram technique is presented for the visualization, which greatly improves the precision of reconstruction. In vivo experiments on rabbits were conducted to verify the effectiveness of the proposed method. Compared to the conventional reconstruction method, our method significantly reduces the Full-Width-at-Half-Maximum (FWHM) by 50% using only 400-frame signals. Besides, there is no significant increase in the running time using the proposed method. Considering its imaging performance and used frame number, the conclusion can be drawn that the proposed method advances the application of super-resolution imaging to the clinical use with a much higher time resolution.

1. Introduction

Ultrasound has become a commonly used method of medical examination because of its fast, non-destructive and inexpensive characteristics. However, the main problem of ultrasound imaging lies in its low image quality. Compared to other modalities, such as the computed tomography (CT) and the magnetic resonance imaging (MRI), ultrasound imaging has a lower resolution. The reason is that the resolution of ultrasound imaging is limited by the emission wavelength [1]. Usually, the center frequency of the ultrasound is at the megahertz order, resulting in the wavelengths at the order of a hundred microns. With a resolution of this magnitude, it is not possible to observe the microvessels in microns, which are of great importance in the early diagnosis of cancer [2].
In 2016, M. Tanter et al. [3] proposed the epoch-making ultrasound imaging method called super-resolution ultrasound imaging. This method uses microbubbles as the resolution units and breaks through the resolution limitations of traditional ultrasound imaging. Through continuous plane wave transmissions, the complete trajectory of microbubbles can be recorded. After trajectory tracking, tiny blood vessels can be observed. This technique was tested on rat cerebral vascular and has been proved to be effective [3].
The concept of ultrasound super-resolution imaging originates from optical imaging [4,5,6], and both processes are very similar [7,8,9]. In ultrasound super-resolution imaging, the beamformed images corresponding to the plane wave transmissions are preprocessed firstly by the wall filter [10,11]. Then following are the two most important steps of the reconstruction, the microbubble localization and the trajectory tracking [7].
The sub-pixel localization of a single microbubble with an accuracy below the diffraction limit is the basis of super-resolution reconstruction methods [12]. Because a single microbubble can be treated as an incoherent point source in the beamformed image sequence, the result of fitting a point-spread-function (PSF) model to an image of a point-like emitter is an estimate of the microbubble position, its imaged size and intensity. It has been shown that the Gaussian function provides a very good approximation of the real PSF of an ultrasound scanner [13]. The advantages of Gaussian PSF models are their simplicity, robustness, and computational efficiency. However, due to the lack of adaptability, the original Gaussian PSF has a limited accuracy for positioning.
As for the trajectory tracking, the scatter plot is the simplest and most common visualization method [14], and does not always provide high-quality results. A simple binary image is created with the pixel intensity value set to one at locations corresponding to microbubble positions. All other pixel intensity values are set to zero. This method is fast but does not reflect the density of microbubbles.
Due to the above problems, the existing reconstruction methods can only get good super-resolution results when the collected signals are long enough (usually up to 10,000 frames) [15]. In this paper, we propose a novel super-resolution reconstruction method, in which brand-new microbubble localization and trajectory tracking techniques were presented for better reconstruction results with fewer sampling frames. Taking the characteristics of ultrasound images and the microbubble density into consideration, we innovatively adopted the integrated form of the 2D Gaussian function [16] and the averaged shifted histograms (ASH) [17] for the two steps respectively. The introduction of the methods helps enhance the quality of the reconstructed images significantly, and in turn improves the imaging time resolution. In order to prove the validity of the proposed method, we conducted in vivo experiments on the kidney of a rabbit.
The structure of the paper is arranged as follows: Materials and Methods section introduces the mathematical background of our proposed method. The setup of in vivo experiments is also given in this section. The corresponding results are shown in the Experimental Results section. Analysis and discussion of the resulting data are given in the Discussion section. Finally, we draw our short conclusion in the Conclusion section.

2. Materials and Methods

2.1. Super-Resolution Imaging Process

The process of super-resolution ultrasound imaging is quite like that of the single-molecule localization microscopy (SMLM) in optics [4,6], which is usually decomposed into four steps as shown in Figure 1.
In the SMLM, the first step is imaging light-activated fluorescent molecules that act as tiny, randomly distributed pinpricks of light. The use of low light intensities and the fact that the molecules’ activation is inherently random ensures that only a sparse subset is turned on at any one time. Thus, these point-like light sources are separated by more than half a wavelength, so the image of each one (a blurred spot called the PSF) does not overlap with that of its neighbors. In ultrasound super-resolution imaging, the flowing microbubbles excited by the acoustic waves are similar to those molecules excited by the fluorescence. By controlling the injection concentration and injection volume, the microbubbles can reach the appropriate concentration. In this case, the microbubbles (or its group) do not overlap in vessels. The echoes enhanced by a microbubble group can be recorded by the ultrasound plane wave imaging, which uses the low emission energy and keeps the microbubbles unbroken [18,19,20]. After comparing sequential images, the locations of the few, well-separated, flowing microbubbles would be pinpointed.
The second step is to determine the exact position of each point-like source by finding the center of the PSF. This is possible for well-separated sources, because the shape of the PSF can be devised in advance. The resolution of the final imaging result depends largely on the design of the PSF. For this step, ultrasound imaging and fluorescence imaging are the same. We call this step microbubble localization in the following sections.
The third step is to repeat the illumination and detection steps many times. A different set of separated point-like sources is detected each time, until a sufficient density of source points has been obtained. In acoustics, microbubbles vibrate under the excitation of scanning ultrasound, so we do not need an extra operation like the illumination in optics.
In the final step, by marking the positions of all these point sources on a single meta-image, a super-resolved picture can be built up. The spatial resolution in this image can exceed the diffraction limit, because it is determined by the accuracy with which the position of each source can be estimated. The accuracy of the reconstructed super resolution image is closely related to the chosen visualization method. We call this step the trajectory tracking in the following sections.
According to the above analysis, two steps of the microbubble localization and trajectory tracking are most closely related to the quality of reconstructed images. Therefore, we improve the corresponding algorithms for these steps respectively in order to get more precise super-resolution reconstruction images in this paper.

2.2. Microbubble Localization

2.2.1. PSF Models

The impulse response of an ultrasound scanner to a point-like source is described by the PSF. A common approximation of the real PSF is a symmetric two-dimensional Gaussian function given by the formula [13]:
P S F G ( x , y | θ ) = θ N 2 π θ σ 2 e x p ( ( x θ x ) 2 + ( y θ y ) 2 2 θ σ 2 ) + θ b ,  
where PSFG(x,y|θ) gives the expected microbubble count at the integer pixel position (x,y) for the parameters θ = [θx; θy; θσ; θN; θb]. The entries of the vector θ are as follows: θx and θy are the sub-pixel microbubble (group) coordinates, θσ is the imaged size of the microbubble (group), θN corresponds to the total number of the microbubbles at this position, and θb corresponds to the background noise level.
Though being simple, the original two-dimensional Gaussian function omits the prior knowledge about the imaging priori knowledge. The integrated form of a symmetric two-dimensional Gaussian function [21] is used in our method to help take into account the discrete nature of pixels presented in ultrasound images. Assuming a uniform distribution of pixels with the unit size, a single microbubble intensity profile can be expressed as:
P S F G ( x , y | θ ) = θ N E x E y + θ b ,  
where PSFIG (x,y|θ) gives the expected microbubble count at the integer pixel position (x,y) for the parameters θ = [θx; θy; θσ; θN; θb] and
  E x = 1 2 erf ( x θ x + 1 2 2 θ σ ) 1 2 erf ( x θ x 1 2 2 θ σ ) ,  
  E y = 1 2 erf ( y θ y + 1 2 2 θ σ ) 1 2 erf ( y θ y + 1 2 2 θ σ ) .  

2.2.2. Data Approximation

Given the approximate position of a microbubble (group) ( x ˜ p , y ˜ p ) and a user-specified fitting radius r > 0, we define D = {−r, …, r} × {−r, …, r} as a set of integer (x,y) coordinates, and I ˜ ( x , y ) = I ( x + x ˜ p , y + y ˜ p ) as intensity values of an l × l sub-image centered at the point ( x ˜ p , y ˜ p ) of the raw input image I, where l = 2r + 1 is the size of the subimage. The desired sub-pixel coordinates of the microbubbles are obtained as x ^ p = x ^ 0 + x ˜ p and y ^ p = y ^ 0 + y ˜ p , where x ^ 0 and y ^ 0 define the sub-pixel refinements of the coordinates obtained by the data approximation.
To approximate the data with a PSF, least-squares methods are employed to minimize the sum of (weighted) squared residuals defined by the data approximation method [22]
  Χ 2 ( θ | D ) = x , y D w ( I ˜ ( x , y ) P S F ( x , y | θ ) ) 2 .  
Here the residual value for the (x,y) data point is defined as the difference between the observed image intensity I ˜ ( x , y ) and the value approximated by the P S F ( x , y | θ ) , where θ are the PSF parameters. The residual value can be further weighted by w = 1, making all measurements equally significant, or weighted by w = 1 / I ˜ ( x , y ) , which takes into account the uncertainty in the number of detected microbubbles [23].
The search for parameters θ ^ which minimize Χ 2 ( θ | D ) , leads to an optimization problem formulated as [24]
θ ^ = arg   min θ Χ 2 ( θ | D ) ,  
which we solve by the Levenberg-Marquardt algorithm as implemented in the Apache Commons Math library [25]. The starting point for the optimization process is computed from the data as the difference between the maximum and the minimum intensity values for the microbubble intensity θN, and as the minimum intensity value for the background offset θb. Users have to choose the starting point for the approximate microbubble (group) width θσ. The sub-pixel refinement of the coordinates is obtained as x ^ 0 = θ ^ x and y ^ 0 = θ ^ y , where θ ^ = [ θ ^ x , θ ^ y , ] .
For constraining parameters of PSF models, the Levenberg-Marquardt algorithm used above searches for values of the parameters θ over an infinite interval. The optimization process can therefore converge to a solution with negative values which is impossible for variables corresponding to the image intensity or to the standard deviation of a Gaussian PSF. We therefore limit the interval of possible values by transforming the relevant parameters and using PSF   ( x ,   y | θ ˜ ) in Equation (2) instead of PSF   ( x ,   y | θ ) . The transformation for a 2D Gaussian PSF model is θ ˜ = [ θ x , θ y , θ σ 2 , θ N 2 , θ b 2 ] . The optimization process is still unconstrained but will result in positive PSF parameters. Such a transformation also improves the stability of the fit.

2.2.3. Localization Uncertainty

Localization uncertainty works as an evaluation metric measuring the accuracy of microbubble positioning. Let σ be the standard deviation of a fitted Gaussian PSF, a is the super-resolution reconstructed pixel size, N is the number of microbubbles detected for a given location, and b is the background signal level in microbubbles calculated as the standard deviation of the residuals between the raw data and our fitted PSF model [26]. The uncertainty in the lateral position of a microbubble can be approximated by the following formula [27]
  Δ x 2 = σ 2 + a 2 / 12 N + 8 π σ 4 b 2 a 2 N 2 .  
As for the integrated Gaussian function, this formula still holds. Meanwhile, the σ is reduced and the localization accuracy increased.

2.3. Trajectory Tracking

Visualization (rendering) of the processed sequence data involves the creation of a new super-resolution image based on the coordinates of the localized microbubbles. The original scatter plot method [14] is a typical all-or-none tracking method. When a microbubble appears at a certain place, it is simply recorded and reflected with the constant gray level in the reconstruction result. It cannot display the density of microbubbles and the exact shape of the blood flow vessels. Thus, it has a negative impact on the imaging resolution. We solved this problem based on the histograms.
Histograms are often used to estimate the density of data by counting the number of observations that fall into each bin [14]. In our case, a two-dimensional histogram of microbubble positions can be created with the bin size corresponding to the pixel size of the final super-resolution image. Thus, for every localized microbubble (group), the bin value (i.e., the image brightness) at the corresponding microbubble positions is incremented by one. For a random sample of size h, the classic histogram takes the value
  f ^ ( x ) = bin   count h .  
The histogram visualization optionally supports “jittering” of the microbubbles between frames. When enabled, a random number drawn from the normal distribution, with a standard deviation equal to the computed (or user-specified) localization uncertainty, is added to the coordinates of every microbubble position before creating the histogram. This step is applied several times and all generated histograms are averaged together. As the number of jitters increases, the final image approaches the result of the Gaussian rendering, whose result is often considered as the golden standard in the SMLM. It can reflect the density of microbubbles and depict an accurate vascular boundary. For a small number of jitters, the histogram visualization is much faster than the Gaussian rendering but the resulting images may appear noisy. To solve this problem, we introduced an improved visualization algorithm.
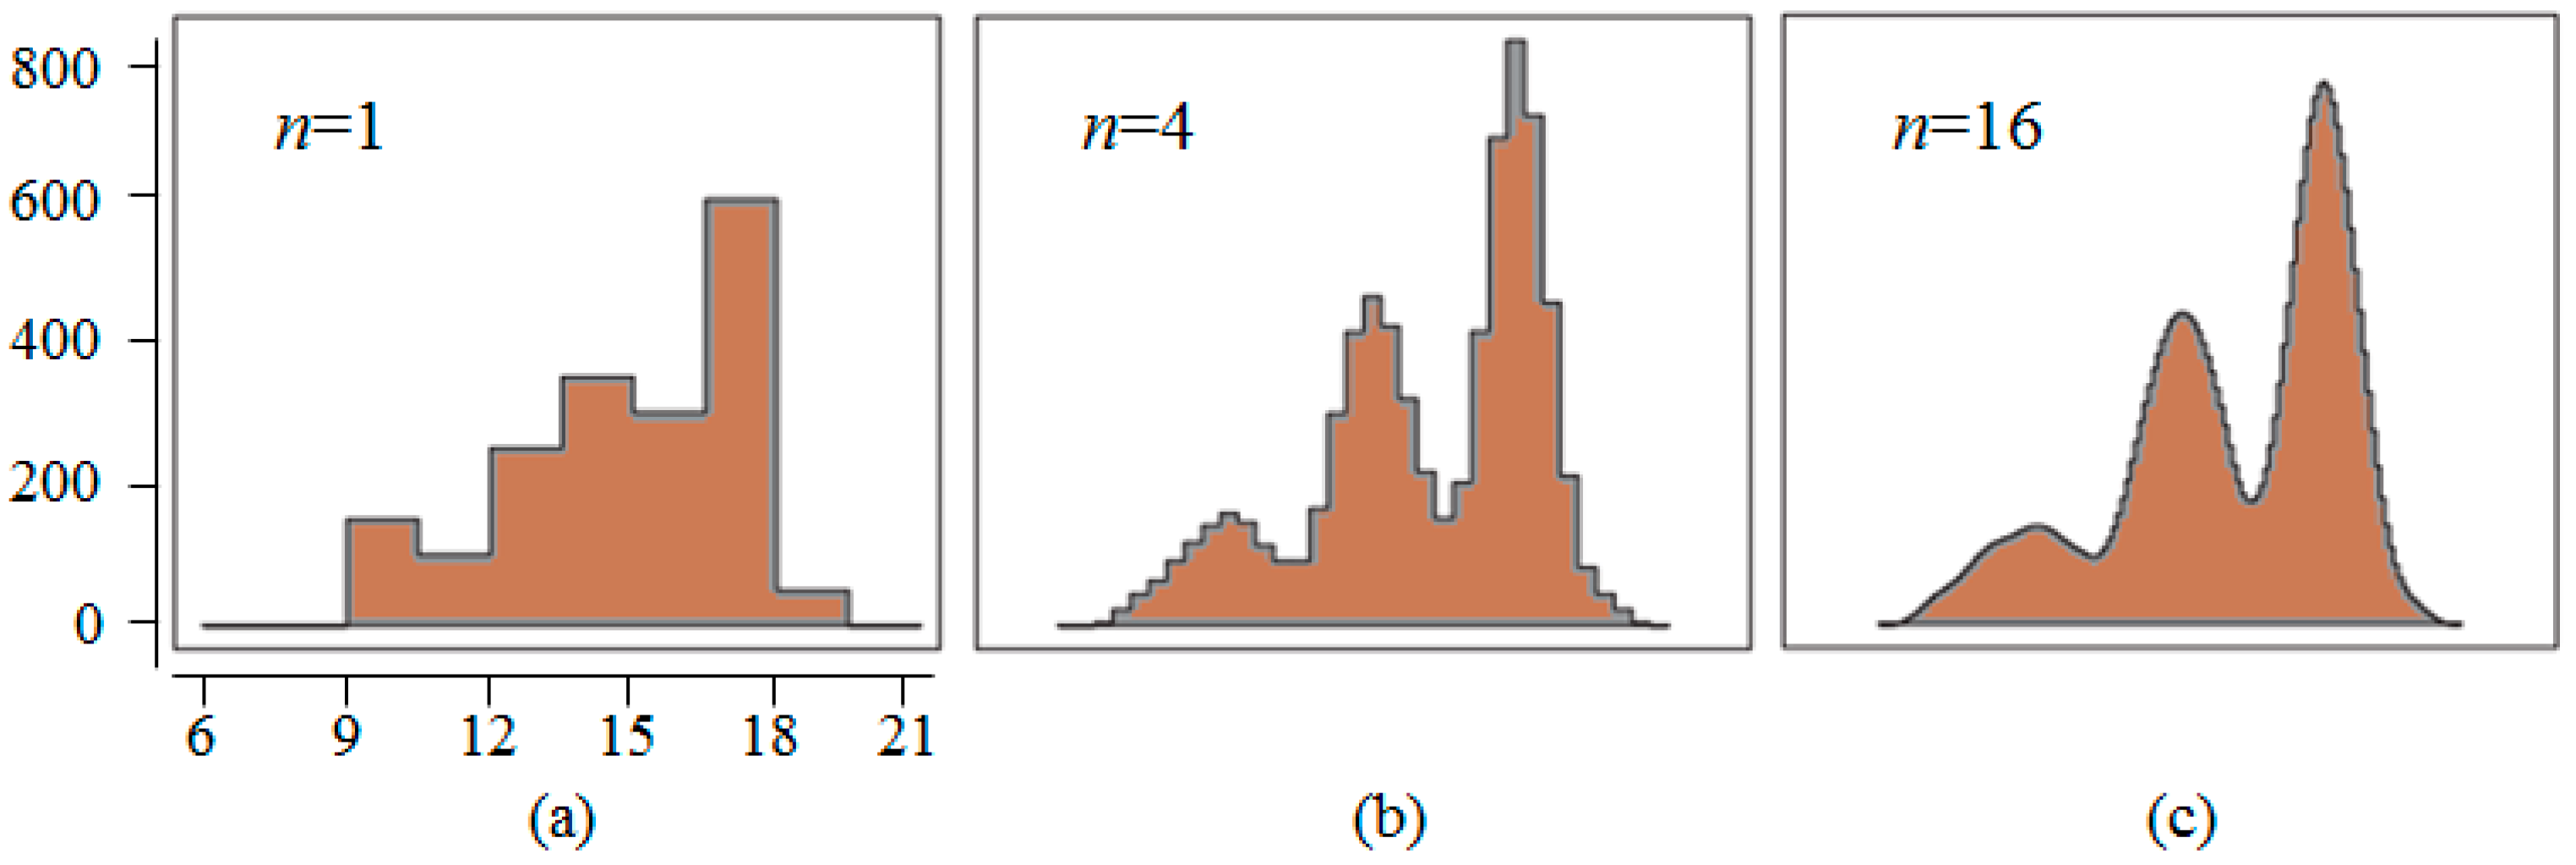
This visualization algorithm uses a density estimation approach based on ASH [16]. The averaged shifted histogram or ASH is a nonparametric probability density estimator derived from a collection of histograms [28], as shown in Figure 2. In the one-dimensional case, this method works by averaging n histograms with the same bin width w, but with the origin of each histogram shifted by w n from the previous histogram. In the multidimensional case, there are nd multidimensional histograms averaged in total, i.e., for n shifts in each of d dimensions. In our implementation, the width of the histogram bin is determined as w = na, where a is the pixel size of the super-resolution image. The number of shifts n in the lateral and axial directions can be specified independently. A simple calculation shows that the ordinary ASH is given by
  f ^ ( x ) = 1 n i = 1 n n 1 ( n | i | ) bin   count i h .  
Theoretically, the time complexity of the proposed method is O(N), where N is the number of microbubbles to visualize. This complexity level is close to the conventional scatter plot approach. However, the real speed of our visualization method is also influenced by the number of histograms to average, which makes it a bit slower than the scatter plot. From the perspective of the reconstruction performance, the proposed method based on the ASH approach provides similar results as Gaussian rendering with a constant localization uncertainty. However, the ASH approach is orders of magnitude faster than Gaussian rendering.

2.4. In Vivo Experiment Setups

2.4.1. In Vivo Ultrafast Imaging

The proposed method was evaluated using a New Zealand white rabbit model. Normal vasculature was imaged in the kidney of a healthy rabbit using the pulse inversion (PI) technique. The rabbits weighed 3.5–4.5 kg. Before the experiment, we carried out depilation on the rabbit’s abdomen. The in vivo scans were performed using the Verasonics ultrasound system (Verasonics, Kirkland, WA, USA) with channel-domain data acquisition capabilities. A 6.3 MHz, 128-element linear array transducer (L11-4v) (Verasonics, Kirkland, WA, USA) with a pitch of 0.30 mm was used and the sampling frequency was set to 36 MHz. One and a half cycle Gaussian envelope-modulated pulses with a carrier frequency of 4.5 MHz were used in order to capture the harmonic components. Entire images were acquired using plane-wave acquisitions at a frame rate of 750 Hz (pulse repetition frequency of 1500 Hz) and low mechanical index of 0.05. Short cine loop of 400 frames were acquired for the rabbit model. Sonovue (Bracco, Milan, Italy), a clinically approved commercial ultrasound contrast agent [29], was used in our experiment. The microbubbles were injected via the ear vein of the rabbit in bolus injections of 1 mL with concentration of 10 μL/Kg and flushed with an additional 1 mL of saline. All experimental protocols were under the approval of the ethics and academic committee with the number (FD-ZS2016-082).

2.4.2. Radio-Frequency (RF) Data Processing and Wall Filtering

The RF echoes were first summed in order to separate the signal nonlinear component from the linear clutter. Then the second harmonics were filtered by a finite impulse response (FIR) bandpass filter with a 4 to 11 MHz passband and then beamformed with a delay-and-sum (DAS) beamformer. A wall filter based on the eigen-decomposition [30] was then used to separate the echoes of flowing microbubbles from the weak harmonic tissue clutter and stationary microbubbles. Following References [10,30], the cut-off eigen-value was chosen as 0.2·max_eigen value. This is the lowest cut-off possible in order to include slow flowing microbubbles while removing clutter artifacts.

2.4.3. Methods for Comparison

Apart from the method in Reference [3] (Gaussian PSF deconvolution + scatter plot) and our proposed reconstruction method, a method based on super-resolution optical fluctuation imaging (SOFI) [31] is included for comparison too. This method calculates high-order moments for the microbubble localization and uses the power Doppler integral for the trajectory tracking. Generally, the SOFI method requires a short sampling sequence and short reconstruction time. In the meantime, the accuracy of its reconstruction results is not so good. In this method, the 4th order central moments of the RF signal were calculated for a single frame time-lag. In our method, a is set to 2 μm and n is set to 10. The super-resolution reconstruction algorithms are implemented in Matlab® and Image J® [32] with the Thunderstorm® plugin (version 1.3) [33] on a standard desktop PC with an Intel® Xeon® CPU E5-2637 v2 3.50 GHz with 64 GB of RAM.

2.4.4. Parameters Measurement

We use the Full-Width at Half-Maximum (FWHM), defined as the −6 dB bandwidth for the mainlobe, and Peak Sidelobe Level (PSL), defined as the peak value of the first sidelobe, to quantify the performance of different methods for imaging microvasculars. The former corresponds to the lateral resolution and the latter corresponds to the sidelobe level. To compare the efficiency of different methods, we also record their runtime in seconds.

3. Experimental Results

In this section, the results of three different super-resolution imaging schemes are shown for comparison using the same ultrafast plane wave dataset.

3.1. Preprocess

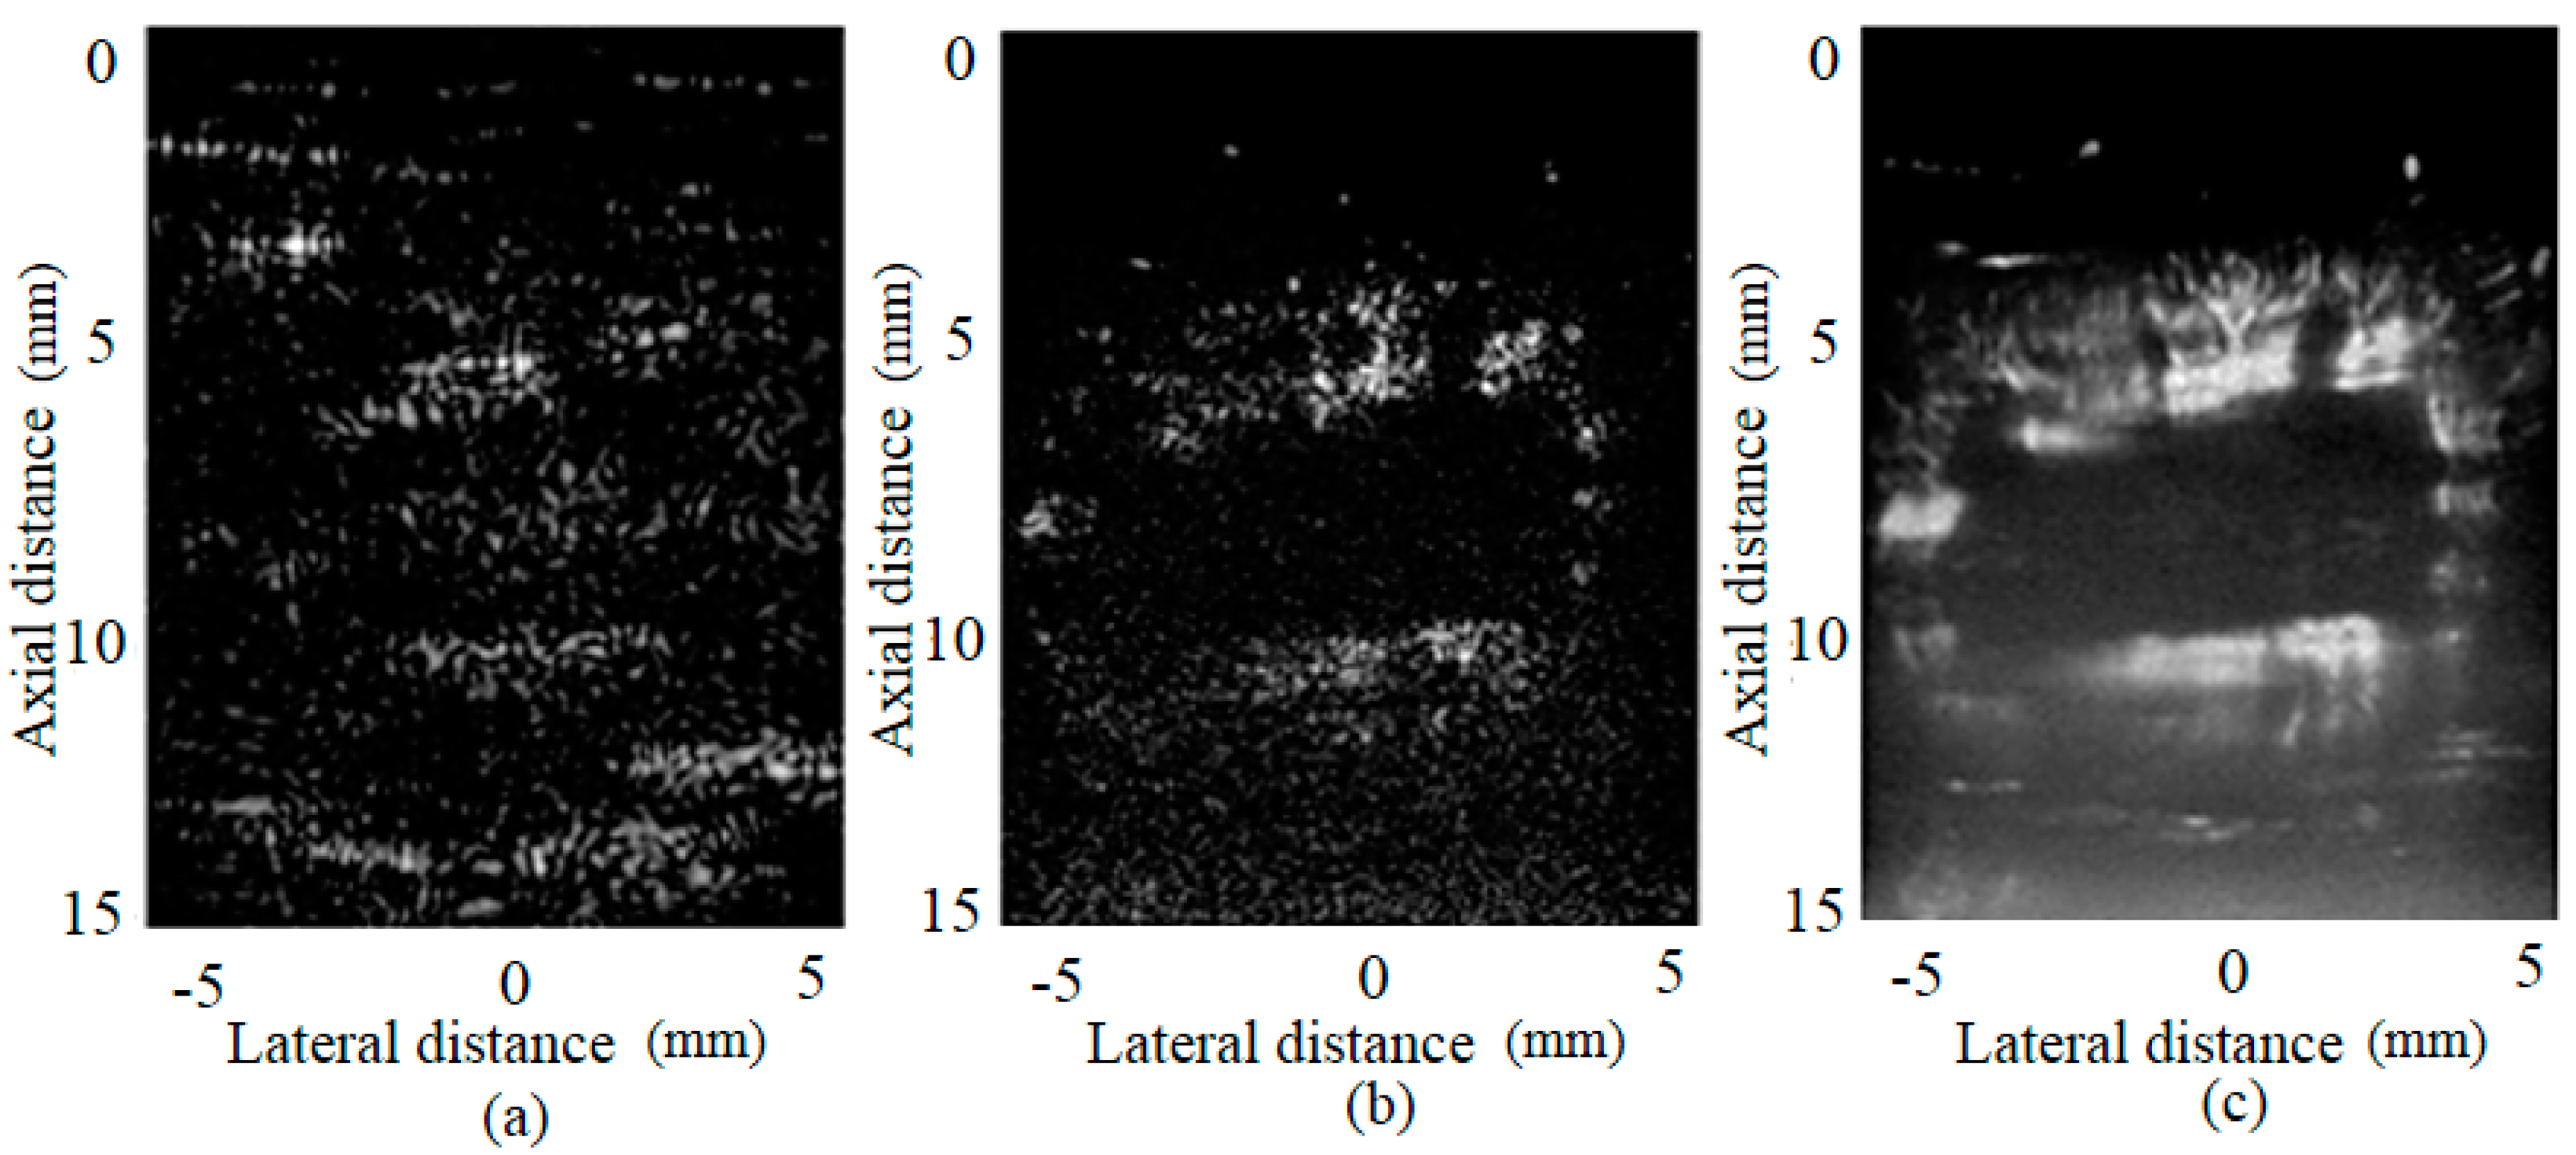
In order to demonstrate the whole process of super-resolution imaging more clearly, we show the results of each step from the start in Figure 3. Figure 3a shows the imaging result after the DAS. As seen, the echoes of the background tissues are strong, and the microbubbles cannot be observed. After the wall filtering, the signal of the contrast agents has been highlighted in Figure 3b, but the structure of the microvessels still cannot be seen at this time. After super-resolution reconstruction using the Gaussian PSF deconvolution and scatter plot is taken, the microvascular structure is finally clearly displayed, as shown in Figure 3c.

3.2. Results of Different Methods

Figure 4 shows the super-resolution imaging results of three reconstruction algorithms for the same dataset. Because only the echoes of 400 sampling frames are used in the imaging process, the resolution of the image reconstructed by Gaussian PSF deconvolution and scatter plot is limited. The high-order moment calculation and power Doppler integration method performs better in suppressing the background noise but the resolution of the reconstructed image is worse and not satisfactory. As for the vessels in the right bottom corner pointed by the blue arrows, this method fails to figure them out. The proposed method presents the finest microvascular structure and also has a certain inhibitory effect on the artefacts. For the artefacts in the left bottom corner pointed by the yellow arrows, the proposed method has the best suppressing performance. In order to observe the details of the image more clearly, we selected and enlarged a specific area of the image, and the results are shown in Figure 5. The analysis object is the vessels at the top right corner marked by the orange rectangles in Figure 4. As the results show, the proposed method is the only one that can clearly display the microvascular structure, which suggests that our method obtains the best resolution.
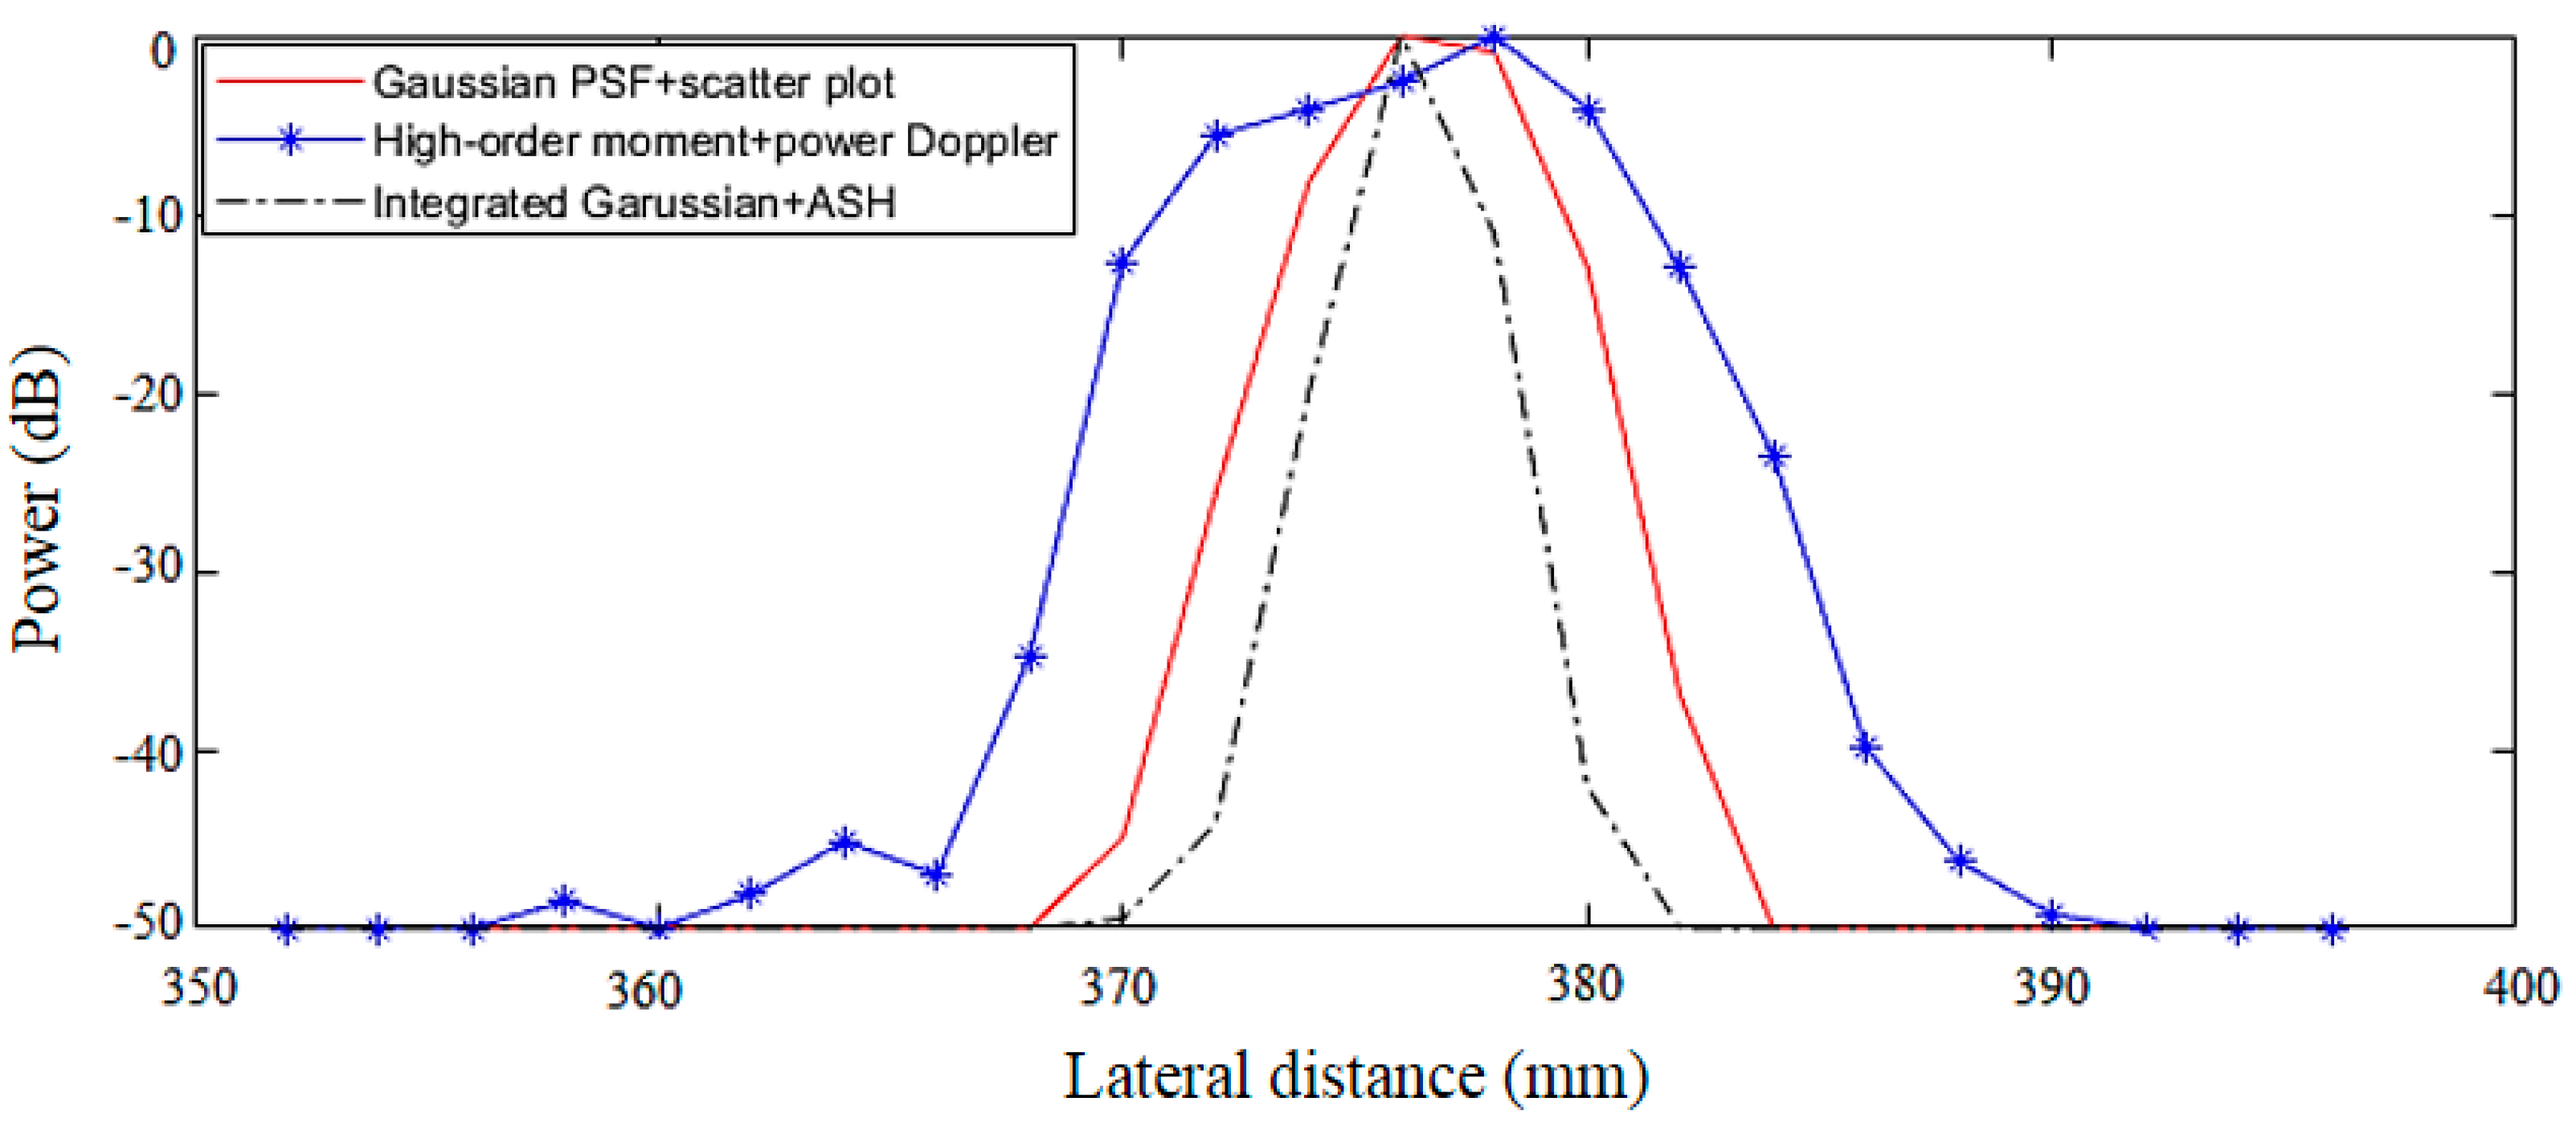
To further compare the resolution performance, Figure 6 shows the lateral variation of the point target on the right top corner in Figure 4, which is pointed by the orange arrows. As seen, our proposed method performs best in the lateral resolution while the moment calculation method performs worst.
Table 1 gives the statistical results for the resolution and running time of different methods. The result is the same as that of qualitative observation. The best FWHM and PSL indices are obtained by the proposed method. In terms of FWHM, the value of the proposed method is reduced by half in comparison to the original Gaussian PSF method. Meanwhile, the reduction of the PSL exceeds 5 dB. Though our method is not the fastest, its running time is still in the acceptable range. Considering the short sequence that was used, the improvement in the time resolution by our method is obvious.

4. Discussion

In this paper, we propose a new super-resolution construction method for ultrasound imaging. Compared to the existing methods [3,31,34,35,36], the innovations of the proposed method lie in two aspects. In the microbubble localization step, we adopt a new Gaussian PSF to measure the accurate location of the microbubbles. This kind of Gaussian PSF takes the discreteness of the ultrasonic imaging coordinates into consideration and obtains more accurate positioning result. In the trajectory tracking step, we introduce the ASH method. The ASH enjoys several advantages compared with the conventional histogram method: better visual interpretation, better approximation, and nearly the same computational efficiency. According to the comparison of the methods in Results, our method has two main advantages over the other super-resolution construction methods:
First, the proposed method acquires the best resolution. This is because our method takes into account the characteristics of ultrasonic imaging when calculating the PSF. Besides, a more accurate visualization method is adopted.
Second, our approach has better real-time performance. Basically, the frames needed for the reconstruction are decreased in our method, which in turn increases the frame rate. Besides, our algorithm still keeps a low amount of computation. Thus, our proposed method makes a step forward to the real-time super-resolution imaging.
At present, our improved method has achieved good results in displaying the rabbit kidney microvessels. In order to further verify the effectiveness of the proposed method, we need to carry out more in vivo animal experiments and clinical experiments in the future.

5. Conclusions

This paper aims to improve the original super-resolution ultrasound reconstruction imaging method, and achieve more accurate imaging results with shorter acquisition dataset. To this end, a novel super-resolution reconstruction method is put forward. The integrated form of a symmetric two-dimensional Gaussian function is introduced to locate the microbubble center after wall filtering. Then, the ASH is employed to visualize the microvessels in the reconstruction result. In vivo experimental results demonstrate that our proposed super-resolution ultrasound reconstruction method can obtain better performance in comparison with the original method in Reference [3] and other methods using a shorter dataset. Although our method shows certain potential in the existing experiments, a clinical experiment is needed in the future.

Authors Contributions

Formal Analysis & Conceptualization, W.G.; Validation, W.G., Y.T. and Y.H.; Writing-Original Draft Preparation, W.G.; Writing-Review & Editing, Y.W. and J.Y.; Supervision, Y.W. and J.Y.; Funding Acquisition, Y.W.

Funding

This work is supported by the National Natural Science Foundation of China (61771143 and 61471125).

Conflicts of Interest

The authors declare no conflict of interest.

References

  1. Cootney, R.W. Ultrasound imaging: Principles and applications in rodent research. Ilar J. 2001, 42, 233–247. [Google Scholar] [CrossRef]
  2. Jain, R.K. Normalization of tumor vasculature: An emerging concept in antiangiogenic therapy. Science 2005, 307, 58–62. [Google Scholar] [CrossRef] [PubMed]
  3. Errico, C.; Pierre, J.; Pezet, S.; Desailly, Y.; Lenkei, Z.; Couture, O.; Tanter, M. Ultrafast ultrasound localization microscopy for deep super-resolution vascular imaging. Nature 2015, 527, 499–502. [Google Scholar] [CrossRef] [PubMed]
  4. Rust, M.J.; Bates, M.; Zhuang, X. Sub-diffraction-limit imaging by stochastic optical reconstruction microscopy (STORM). Nat. Method 2006, 3, 793–796. [Google Scholar] [CrossRef] [PubMed] [Green Version]
  5. Betzig, E.; Patterson, G.H.; Sougrat, R.; Lindwasser, O.W.; Olenych, S.; Bonifacino, J.S.; Davidson, M.W.; Lippincott-Schwartz, J.; Hess, H.F. Imaging intracellular fluorescent proteins at nanometer resolution. Science 2006, 313, 1642–1645. [Google Scholar] [CrossRef] [PubMed]
  6. Hess, S.T.; Girirajan, T.P.K.; Mason, M.D. Ultra-high resolution imaging by fluorescence photoactivation localization microscopy. Biophys. J. 2006, 91, 4258–4272. [Google Scholar] [CrossRef] [PubMed]
  7. Errico, C.; Couture, O.; Tanter, M. Ultrafast ultrasound localization microscopy. J. Acoust. Soc. Am. 2017, 141, 3951. [Google Scholar] [CrossRef]
  8. Ghosh, D.; Xiong, F.; Sirsi, S.R.; Mattrey, R.; Brekken, R.; Kim, J.W.; Hoyt, K. Monitoring early tumor response to vascular targeted therapy using super-resolution ultrasound imaging. In Proceedings of the 2017 IEEE International Ultrasonics Symposium (IUS), Washington, DC, USA, 6–9 September 2017. [Google Scholar]
  9. Lin, F.; Tsuruta, J.K.; Rojas, J.D.; Dayton, P.A. Optimizing sensitivity of ultrasound contrast-enhanced super-resolution imaging by tailoring size distribution of microbubble contrast agent. Ultrasound Med. Biol. 2017, 43, 2488–2493. [Google Scholar] [CrossRef] [PubMed]
  10. Yu, A.; Lovstakken, L. Eigen-based clutter filter design for ultrasound color flow imaging: A review. IEEE Trans. Ultrason. Ferroelectr. Freq. Control 2010, 57, 1096–1111. [Google Scholar] [CrossRef] [PubMed] [Green Version]
  11. Gallippi, C.M.; Trahey, G.E. Adaptive clutter filtering via blind source separation for two-dimensional ultrasonic blood velocity measurement. Ultrasonic Imaging 2002, 24, 193–214. [Google Scholar] [CrossRef] [PubMed]
  12. Thompson, R.E.; Larson, D.R.; Webb, W.W. Precise nanometer localization analysis for individual fluorescent probes. Biophys. J. 2002, 82, 2775–2783. [Google Scholar] [CrossRef]
  13. Stallinga, S.; Rieger, B. Accuracy of the Gaussian point spread function model in 2D localization microscopy. Opt. Express 2010, 18, 24461–24476. [Google Scholar] [CrossRef] [PubMed]
  14. Baddeley, D.; Cannell, M.B.; Soeller, C. Visualization of localization microscopy data. Microsc. Microanal. 2010, 16, 64–72. [Google Scholar] [CrossRef] [PubMed]
  15. Rix, A.; Lederle, W.; Theek, B.; Lammers, T.; Moonen, C.; Schmitz, G.; Kiessling, F. Advanced ultrasound technologies for diagnosis and therapy. J. Nucl. Med. 2018, 59, 740–746. [Google Scholar] [CrossRef] [PubMed]
  16. Huang, F.; Schwartz, S.L.; Byars, J.M.; Lidke, K.A. Simultaneous multiple emitter fitting for single molecule super-resolution imaging. Biomed. Opt. Express 2011, 2, 1377–1393. [Google Scholar] [CrossRef] [PubMed]
  17. Scott, D.W. Averaged shifted histograms: Effective nonparametric density estimators in several dimensions. Ann. Stat. 1985, 13, 1024–1040. [Google Scholar] [CrossRef]
  18. Tanter, M.; Fink, M. Ultrafast imaging in biomedical ultrasound. IEEE Trans. Ultrason. Ferroelectr. Freq. Control 2014, 61, 102–119. [Google Scholar] [CrossRef] [PubMed]
  19. Tiran, E.; Deffieux, T.; Correia, M.; Maresca, D.; Osmanski, B.F.; Sieu, L.A.; Bergel, A.; Cohen, I.; Pernot, M.; Tanter, M. Multiplane wave imaging increases signal-to-noise ratio in ultrafast ultrasound imaging. Phys. Med. Biol. 2015, 60, 8549–8566. [Google Scholar] [CrossRef] [PubMed] [Green Version]
  20. Cox, B.; Beard, P. Imaging techniques: Super-resolution ultrasound. Nature 2015, 527, 451–452. [Google Scholar] [CrossRef] [PubMed]
  21. Smith, C.S.; Joseph, N.; Rieger, B.; Lidke, K.A. Fast, single-molecule localization that achieves theoretically minimum uncertainty. Nat. Method 2010, 7, 373–375. [Google Scholar] [CrossRef] [PubMed] [Green Version]
  22. Kendall, M.; Stuart, A. The Advanced Theory of Statistics, 2nd ed.; Charles Griffin: London, UK, 1946; pp. 29–48. ISBN 9780340814932. [Google Scholar]
  23. Mortensen, K.I.; Churchman, L.S.; Spudich, J.A.; Flyvbjerg, H. Optimized localization analysis for single-molecule tracking and super-resolution microscopy. Nat. Method 2010, 7, 377–381. [Google Scholar] [CrossRef] [PubMed] [Green Version]
  24. Bevington, P.R.; Robinson, D.K.; Blair, J.M.; Mallinckrodt, A.J.; McKay, S. Data reduction and error analysis for the physical sciences. Comput. Phys. 1993, 7, 415–416. [Google Scholar] [CrossRef]
  25. Math, C. The Apache Commons Mathematics Library, Version 3.2. Available online: http://commons.apache.org/math/ (accessed on 4 February 2018).
  26. Křížek, P.; Raška, I.; Hagen, G.M. Minimizing detection errors in single molecule localization microscopy. Opt. Express 2011, 19, 3226–3235. [Google Scholar] [CrossRef] [PubMed]
  27. Quan, T.; Zeng, S.; Huang, Z.L. Localization capability and limitation of electron-multiplying charge-coupled, scientific complementary metal-oxide semiconductor, and charge-coupled devices for superresolution imaging. J. Biomed. Opt. 2010, 15, 066005. [Google Scholar] [CrossRef] [PubMed] [Green Version]
  28. Scott, D.W. Multivariate Density Estimation: Theory, Practice, and Visualization, 2nd ed.; John Wiley & Sons: Hoboken, NJ, USA, 2015; pp. 242–245. ISBN 9780471697558. [Google Scholar]
  29. Schneider, M. Sonovue, a new ultrasound contrast agent. Eur. Radiol. 1999, 9, S347–S348. [Google Scholar] [CrossRef] [PubMed]
  30. Demené, C.; Deffieux, T.; Pernot, M.; Osmanski, B.F.; Biran, V.; Gennisson, J.L.; Sieu, L.; Bergel, A.; Franqui, S.; Correas, J.M.; et al. Spatiotemporal clutter filtering of ultrafast ultrasound data highly increases doppler and fultrasound sensitivity. IEEE Trans. Med. Imaging 2015, 34, 2271–2285. [Google Scholar] [CrossRef] [PubMed]
  31. Bar-Zion, A.; Tremblay-Darveau, C.; Solomon, O.; Adam, D.; Eldar, Y.C. Fast vascular ultrasound imaging with enhanced spatial resolution and background rejection. IEEE Trans. Med. Imaging 2017, 36, 169–180. [Google Scholar] [CrossRef] [PubMed]
  32. Schneider, C.A.; Rasband, W.S.; Eliceiri, K.W. NIH Image to ImageJ: 25 Years of image analysis. Nat. Method 2012, 9, 671–675. [Google Scholar] [CrossRef]
  33. Ovesný, M.; Křížek, P.; Borkovec, J.; Švindrych, Z.; Hagen, G.M. ThunderSTORM: A comprehensive ImageJ plug-in for PALM and STORM data analysis and super-resolution imaging. Bioinformatics 2014, 30, 2389–2390. [Google Scholar] [CrossRef] [PubMed]
  34. Viessmann, O.M.; Eckersley, R.J.; Christensenjeffries, K.; Tang, M.X.; Dunsby, C. Acoustic super-resolution with ultrasound and microbubbles. Phys. Med. Biol. 2013, 58, 6447–6458. [Google Scholar] [CrossRef] [PubMed]
  35. Ackermann, D.; Schmitz, G. Detection and tracking of multiple microbubbles in ultrasound B-mode images. IEEE Trans. Ultrason. Ferroelectr. Freq. Control 2015, 63, 72–82. [Google Scholar] [CrossRef] [PubMed]
  36. Christensenjeffries, K.; Browning, R.; Tang, M.X.; Dunsby, C.; Eckersley, R.J. In vivo acoustic super-resolution and super-resolved velocity mapping using microbubbles. IEEE Trans. Med. Imaging 2014, 34, 433–440. [Google Scholar] [CrossRef]
Figure 1. Super-resolution imaging process: Step 1. Scanning and comparing, Step 2. Microbubble localization, Step 3. Repeating 1 & 2 for each frame, Step 4. Trajectory tracking.
Applsci 08 01143 g001
Figure 2. A simple example of the ASH method for the step count in one day: (a) a histogram, (b) an ASH estimate of 4 shifted histograms, and (c) an ASH estimate of 16 shifted histograms.
Applsci 08 01143 g002
Figure 3. The imaging results of rabbit kidney using: (a) DAS, (b) DAS + wall filter, and (c) DAS + wall filter + Gaussian PSF deconvolution + scatter plot respectively. All images are shown with a dynamic range of 50 dB.
Applsci 08 01143 g003
Figure 4. The super-resolution construction imaging results of rabbit kidney using: (a) Gaussian PSF deconvolution + scatter plot, (b) High-order moment calculation + power Doppler integration, and (c) Integral form of Gaussian PSF deconvolution + ASH respectively. All images are shown with a dynamic range of 50 dB. The orange, yellow and blue arrows point to the point target, artefact and the vascular details respectively. The orange box marks the area we choose to enlarge.
Applsci 08 01143 g004
Figure 5. Locally magnified (10 times) microvascular images of rabbit kidney using: (a) Gaussian PSF deconvolution + scatter plot, (b) High-order moment calculation + power Doppler integration, and (c) Integral form of Gaussian PSF deconvolution + ASH respectively. All images are shown with a dynamic range of 50 dB.
Applsci 08 01143 g005
Figure 6. The lateral variation of different reconstruction methods for the point target at the right top corner.
Applsci 08 01143 g006
Table 1. Full-Width at Half-Maximum (FWHM), Peak Side Lobe (PSL) and the run time of different reconstruction methods.
MethodFWHM (μm)PSL (dB)Run Time (s)
Gaussian PSF deconvolution + scatter plot7.72−37.2214.20
High-order moment + power Doppler integration13.44−26.469.27
Integral form of Gaussian PSF deconvolution + ASH3.88−42.3517.11