Abstract
Ultrafiltration and diafiltration were proposed for the production of cloudy apple-cranberry juice of reduced sugar content. Ceramic membrane of 15 kDa MWCO was used in a cross-flow configuration, the retentate was treated as a final product. The juice before and after membrane treatments were characterized for total soluble solids content, glucose and fructose content, density, acidity, total phenolic content, antiradical activity, color parameters and FTIR spectra. The transmission of sugars after ultrafiltration was 24% and after diafiltration it reached 36%, with the simultaneous rejection of colloids, high molecular weight compounds and fine particles. The percentage of the reference intake of sugars connected with the consumption of 250 mL portion of obtained products was reduced from 27.0 to 20.7 and 15.7%, after ultrafiltration and diafiltration, respectively.
1. Introduction
Fruit juices are an important part of the diet of both adults and children, as well as people with special dietary needs. They are a source of valuable vitamins, antioxidants and minerals [1]. However, they also contain a significant amount of energy and sugars (in apple juice on average 45 kcal, and 9.6 g in 100 g, respectively), similar to sweetened beverages [2]. When comparing the average energy and sugars content in one portion of apple juice (250 mL) to the reference intake presented in Regulation of the European Parliament and of the Council [3], which are 2000 kcal and 90 g, respectively, it is evident that while the energy intake connected with this consumption is relatively low (5.6% of the reference intake), sugars intake is much higher, and reaches even more than 20% of the reference intake.
Nowadays, consumers becoming more and more aware of the impact of diet on physical fitness and health, reluctantly reach for fruit juices despite their obvious taste and nutritional values. While consumption of whole apples can improve vascular function, decrease systolic BP and reduce cholesterol levels, clear apple juice has been associated with adverse effects, most likely due to its high fructose and low fibre content [4,5]. According to Gill and Sattar [2] the accepted guidelines recommending the consumption of 5 portions of fruit and vegetables per day should not include fruit juices. It has been shown that although consuming a significant amount of whole fruit results in a reduced or neutral risk of diabetes, drinking large amounts of fruit juices may lead to an increased risk of type 2 diabetes [2,6]. One glass of fruit juice contains much more sugar than one piece of fruit. Moreover, many nutrients, such as fiber, pectin, proteins and free amino acids, are found in juices in much smaller quantities or not at all [7]. A study presented by Bolton et al. [8], which compared whole oranges (2.5% fiber) to orange juice (fiber free) and whole grapes (1.3% fiber) to grape juice (fiber free) confirmed that whole fruit provided more satiety than juice, and the return of appetite was delayed. With oranges, and previously reported with apples, there was a significantly smaller insulin response to fruit than to juice and less postabsorptive fall in plasma glucose. According to Muraki et al. [6] relatively high glycemic load values of fruit juices along with reduced levels of beneficial nutrients through juicing processes (for example, the glycemic load values per serving are 6.2 for raw oranges and 13.4 for orange juice, and fibre levels per serving are 3.1 g and 0.5 g, respectively), may explain the positive associations between fruit juice consumption and risk of type 2 diabetes. According to former World Health Organisation (WHO) guidelines, a glass of juice could be treated as one of five portions of fruit and vegetables recommended for consumption during the day, but current official guidelines do not include juices in the list [9,10].
Among fruit juices, cloudy versions have gained an increased market value, due to their sensory and nutritional qualities [11]. They contain valuable ingredients, which are normally rejected during clear juice processing (especially clarification) [5]. That is why special attention should be paid to the possibilities to increase cloudy juice consumption (instead of clear juices), and methods which could be used for the reduction of sugar content in these juices. In the current study, we propose a novel sustainable approach for the production of low-sugar cloudy apple-cranberry juice, in which it is possible to utilize the retentate coming from cloudy juice ultrafiltration (UF) or diafiltration (DF). Such an approach to obtain a low sugar juice fraction was firstly proposed and patented by Black and Bray [12]. Sugar separation processes involve ultrafiltration, nanofiltration and optionally reverse osmosis. However, so far it has not been verified by laboratory investigations focusing on the selectivity of the membrane process and determination of physicochemical properties of low-sugar product obtained by such membrane treatment.
The application of membrane technologies for the production of low-sugar juices fits well with sustainable food processing (SFP), an integral part of the sustainable food supply chain and sustainable development based on the use of low energy, low-impact processing schemes to produce food with excellent quality and nutritional value close to (or better than) that of a fresh product [13]. Membrane technology can be classified as a sustainable food production technique, as it is environmentally friendly due to low energy consumption [11,14]. Moreover, thanks to mild conditions, the membrane treatment does not deteriorate a product’s quality as much as traditional thermal processing. Apart from the improvement of healthy food quality and nutritional value, SFP additionally focuses on the simultaneous exploitation of food processing wastes, which is also connected with the proposed technology. The proposed juice membrane treatment, when implemented into industry, would give the benefit of reduced waste during juice processing. According to Rabetafika et al. [15], in the case of fruit processing, the production of apple juice generates a huge volume of waste considering the annual processed tonnage of up to 12 million tons. At present, membrane processing of juices on an industrial scale is carried out in order to replace the stages of filtration, decanting and partially evaporation during the production of concentrated and clear juices, and the subject of producer’s interest is the ultrafiltration permeate (clear juice) [16,17]. During such processing at the UF stage, a significant amount of by-product is generated (UF retentate), although it contains the compounds of high nutritive potential: dietary fiber, pectins, polyphenols, and oligosaccharides [11,15,18]. Van der Sluis et al. [19] presented that the levels of flavonoids and chlorogenic acid in apple juice were reduced to between 50% (chlorogenic acid) and 3% (catechins) compared to fruit. In the proposed technology, the approach is opposite—UF/DF retentate (optionally subjected to further treatment), containing potentially valuable components (e.g., pectins) and lower sugar content than the feed juice, is the subject of interest. At the same time, the stream of generated permeate can be also treated as a clear juice, or can be utilized for the production of traditional fruit beverages.
Apple juice is one of most popular fruit juices, while cranberries are increasingly popular, mainly due to high phytochemicals content and positive implications for health [20,21]. Thus, the aim of work was to investigate (1) the performance of ultrafiltration and diafiltration of apple-cranberry cloudy juice; (2) the selectivity of both membrane techniques; (3) the physicochemical properties of obtained products (retantates); (4) the values of sugars reference intake connected with the consumption of obtained products (retantates).
2. Materials and Methods
2.1. Materials
Apple-cranberry cloudy juice (ACJ) was derived from a local producer Sadvit (Poland) directly after cold pressing and mild pasteurization (80 °C). Reagents for total phenolic content and DPPH radical scavenging activity determination were supplied by Sigma-Aldrich (St. Louis, MO, USA).
2.2. Ultrafiltration and Diafiltration
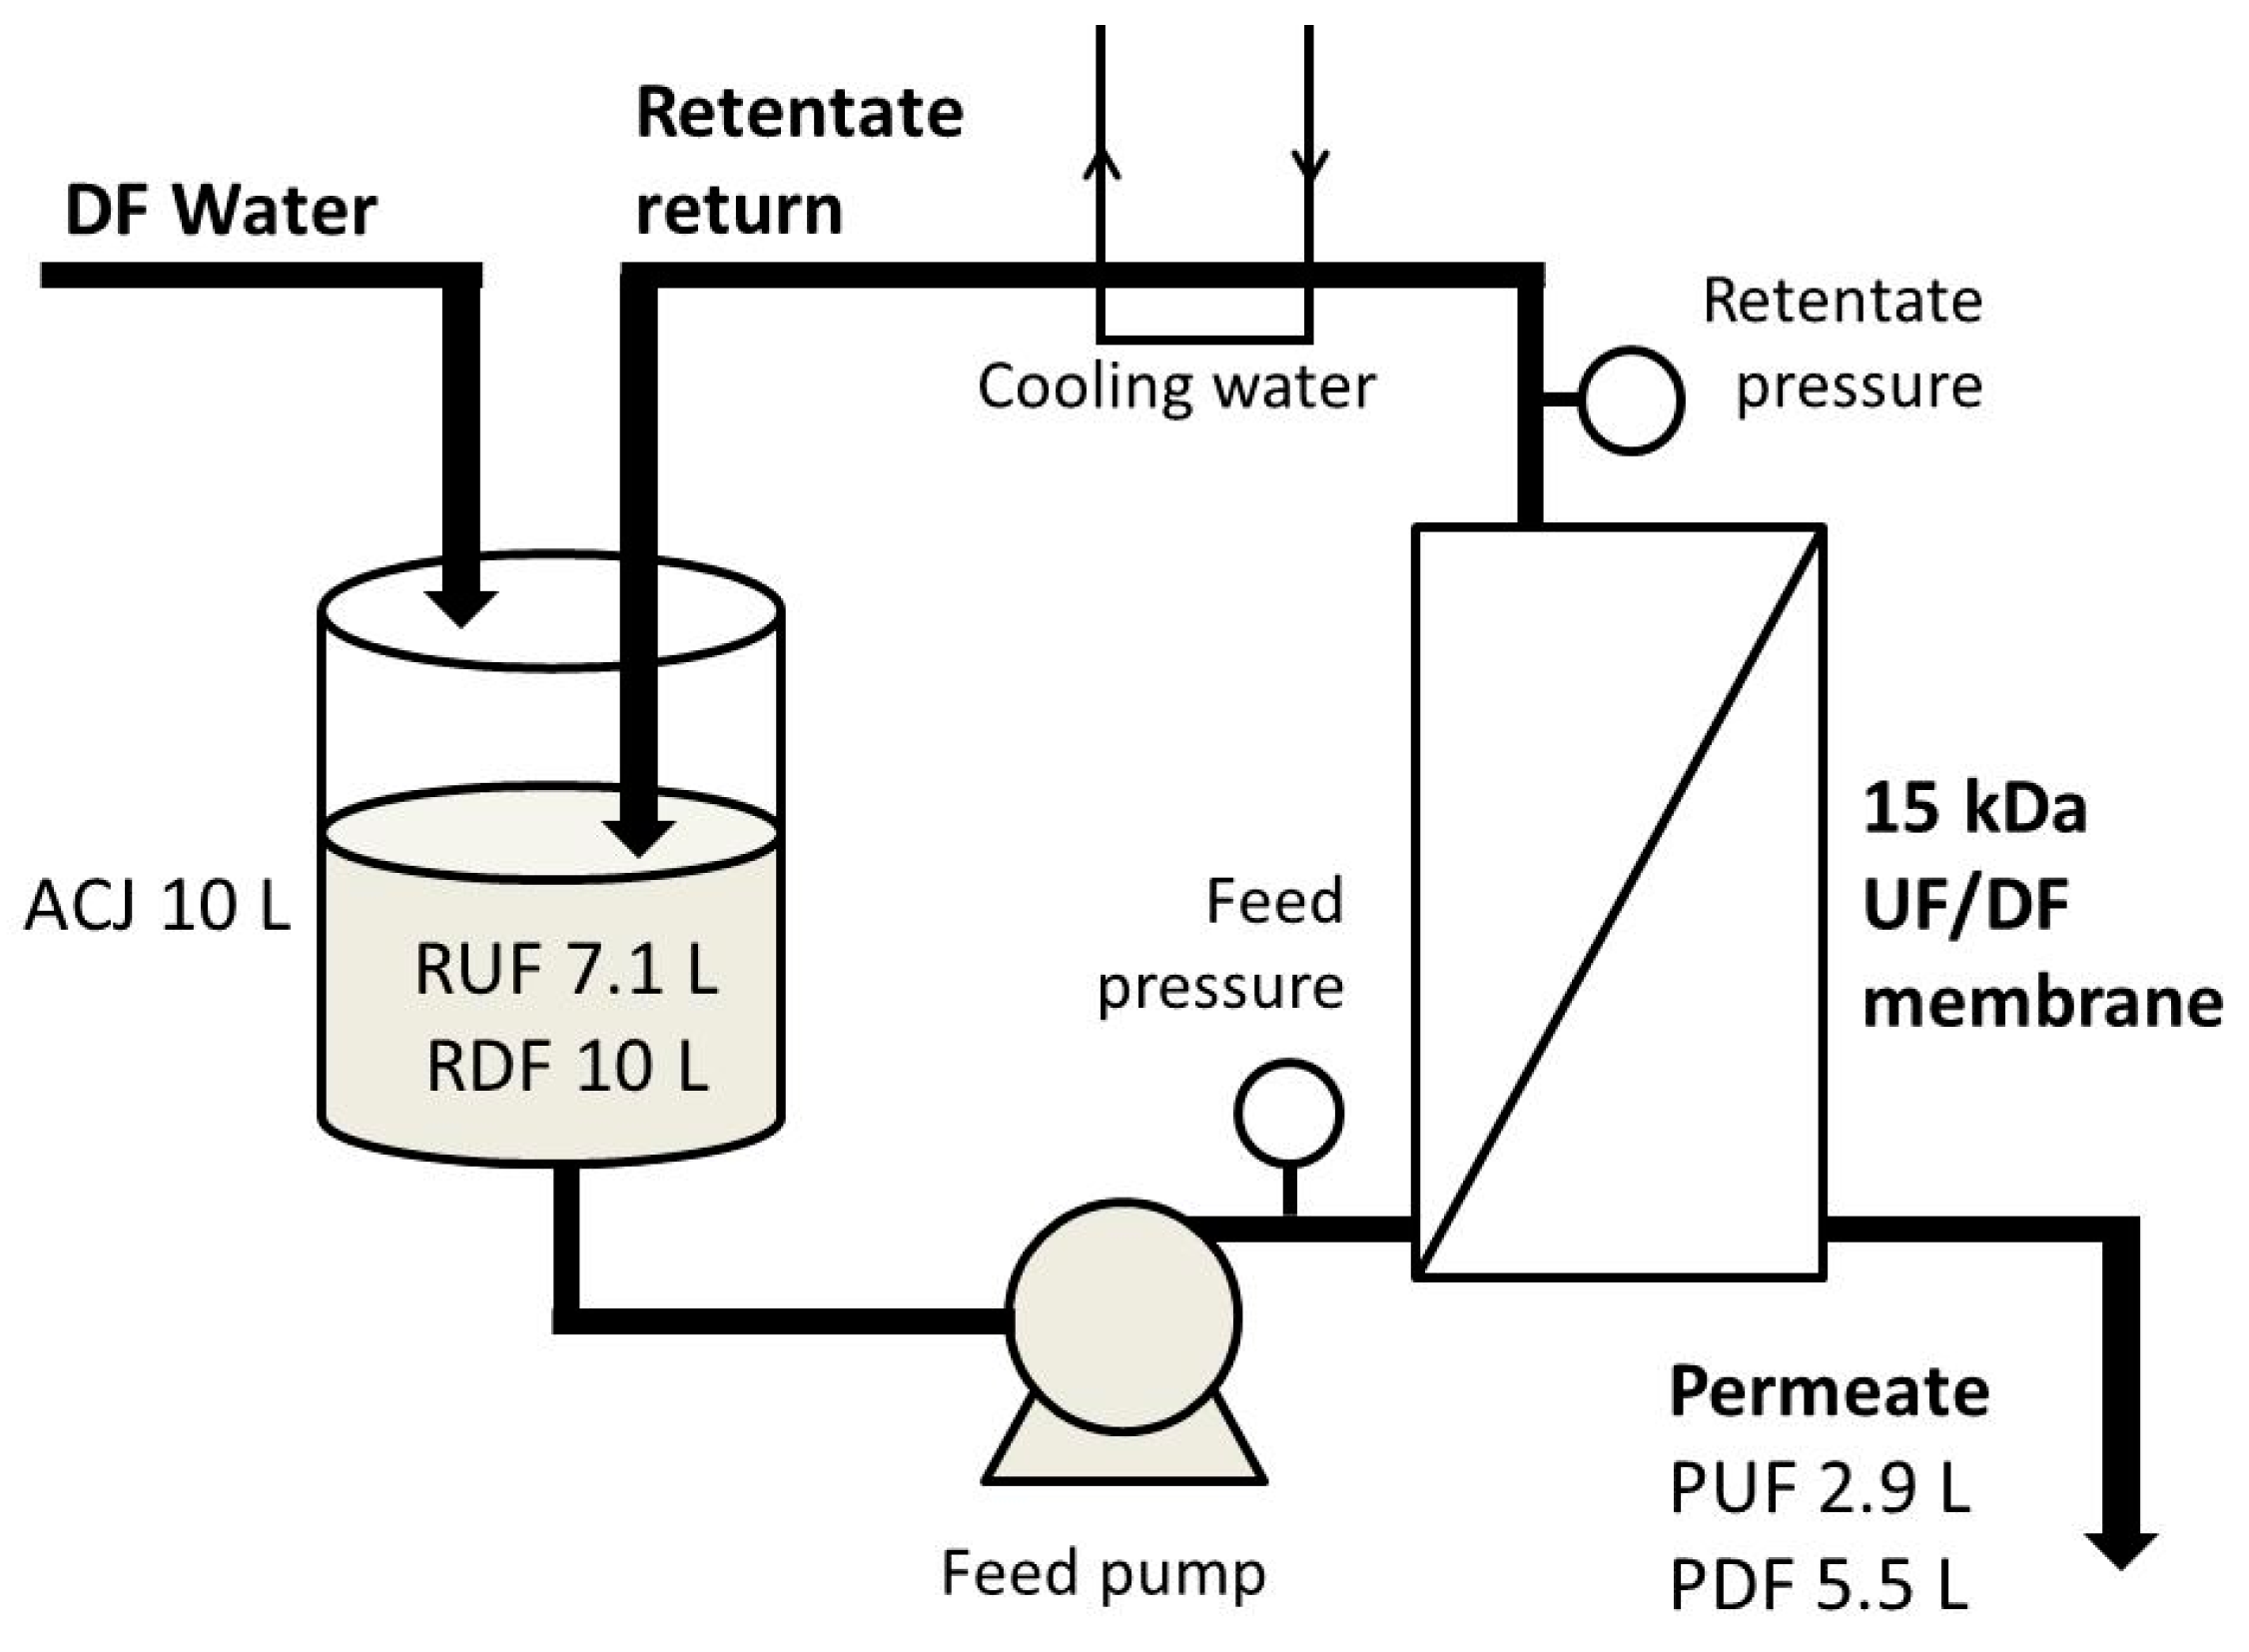
A pilot-scale cross-flow laboratory ultrafiltration unit (OBR, Poland), equipped with a ceramic tubular membrane (15 kDa MWCO, 0.35 m2) from TAMI Industries (France) was used for ultrafiltration (UF) and diafiltration (DF) processes. The main reservoir was filled with the juice (10 L), then the pump was started. Immediately, the initial permeate (P) flux J was measured, and later was expressed as flow rate normalized by the membrane area (m3·s−2·m−2). Next, after the collection of subsequent 250 mL P portions, the following activities were done every time: J measurement, P and retentate (R) sampling for total soluble solids determination, and, during DF—the addition of 250 mL of water to the main reservoir. UF was processed until the complete decline of J (it was observed after 145 min), while DF for 240 min. Obtained P and R were weighed, and samples were taken again for further analysis (R was treated as low-sugar product). Transmembrane pressure during both processes was 0.35 MPa. Schematic diagram of the installation is presented in Figure 1.
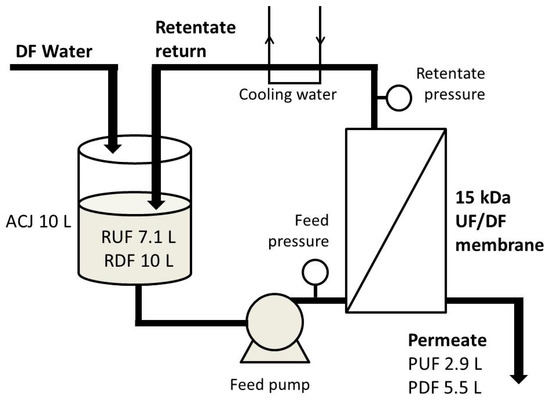
Figure 1.
Schematic diagram of the installation used for ultrafiltration (UF) and diafiltration (DF) of cloudy apple-cranberry juice.
2.3. Analytical Methods
Juice, permeate and retentate after UF and DF were subjected for physicochemical determinations, as described below.
Total soluble solids content (TSS) was determined by a PAL-3 digital refractometer (ATAGO, Tokyo, Japan). Color parameters L (lightness), a* (redness/greenness) and b* (yellowness/blueness) were measured by a CR-5 colorimeter (Konica Minolta, Tokyo, Japan) in CIE L a*b* system. Total color difference ΔE of P and R compared to ACJ was calculated:
Density (D) measurement was carried out using a portable Densito 30 PX device (Mettler Toledo, Tokyo, Japan), while pH determination was done using CP-505 pH-meter (Elmetron, Zabrze, Poland), both with automatic temperature compensation. Total sugars, glucose and fructose content were determined by high performance liquid chromatography HPLC with refractive detection (1200 series, Agilent Technologies, Santa Clara, CA, USA). Non-sugar soluble solids content (NSS) was calculated as a difference between TSS and TS.
Total phenolic content (TPC) was determined by colorimetric assay, with the Folin–Ciocalteu reagent in an alkali environment (Na2CO3 solution, 20% w/v) according to the method of Slinkard and Singleton [22]. Extract (70% aqueous acetone), Folin–Ciocalteu reagent and Na2CO3 were mixed and incubated for 20 min at room temperature. The absorbance was determined using UV-mini 1240 spectrophotometer (Shimadzu, Tokyo, Japan) at 700 nm. The results were presented as gallic acid (GA) equivalents/100 g, based on standard curve.
Antiradical activity against 2,2-diphenyl-1-picrylhydrazyl (DPPH) radical was evaluated according to the modified method of Song et al. [23]. Extract (70% aqueous acetone) was diluted with methanol and mixed with DPPH• solution. After 30 min of incubation at room temperature the absorbance was measured at 562 nm (UV-mini 1240 spectrophotometer, Shimadzu, Japan). The antioxidant activity was calculated by reference to a control sample.
Titratable acidity (TA) was determined by titration with 0.1 M NaOH solution, and calculated as mass of mallic acid (MA)/100 g.
Measurements of the ATR-FTIR background corrected spectra (25 scans for each sample) were carried out with the use of a HATR Ge trough (45° cut, yielding 10 internal reflections element) crystal plate at 20 °C, and were recorded with a 670-IR spectrometer (Agilent, Santa Clara, CA, USA). Samples were freeze-dried before the measurement, to avoid the influence of water. The Ge crystal was cleaned with ultra-pure organic solvents (Sigma-Aldrich). The instrument was continuously purged with argon for 40 min before and during measurements. Absorption spectra at a resolution of one data point per 1 cm−1 were obtained in the region between 3750 and 700 cm−1. Scans were Fourier-transformed and averaged with Grams/AI 8.0 software (Thermo Fisher Scientific, Waltham, MA, USA).
2.4. Calculation of Membrane Performance
Membrane selectivity regarding certain species (TSS, Glu, Fru, TS, TA, NSS and TPC) was expressed as recovery R (%) factor:
where mR and mACJ are the mass of each compound in R and ACJ, respectively [24].
2.5. Statistical Methods
The statistical differences were verified through one-way analysis of variance (ANOVA) followed by Tukey’s honestly significant difference test with a = 0.05. In order to determine and visualize the differences between feed juice, permeate and retentate after UF/DF processes, and the relationships between observations and variables, principal component analysis (PCA) was applied. PCA is a multivariate statistical method which allows a large number of sample data sets to be described in terms of a much smaller number of principal components. The first principal component (PC1) describes the gross average features of the data sets, while the second (PC2) and subsequent principal components introduce further specific features of decreasing significance [25]. A matrix of 5 × 12 (5 samples and 12 variables) was analyzed after the standardization of the input data was carried out to convert all the data to the same unit and to avoid a scale effect.
Hierarchical cluster analysis (HCA) was also used to visualize the differences between feed juice, permeate and retentate after UF/DF processes, as well as as a chemometric methods for the visualization of the differences between FTIR spectra of 5 investigated samples. The construction of dendrogram was performed using Ward’s linkage algorithm [26]. For calculating the spectral distance, the Euclidian distance was used.
Analysis were done in STATISTICA v.13 software (Dell Inc., Round Rock, TX, USA).
3. Results
3.1. Ultrafiltration and Diafiltration Processing
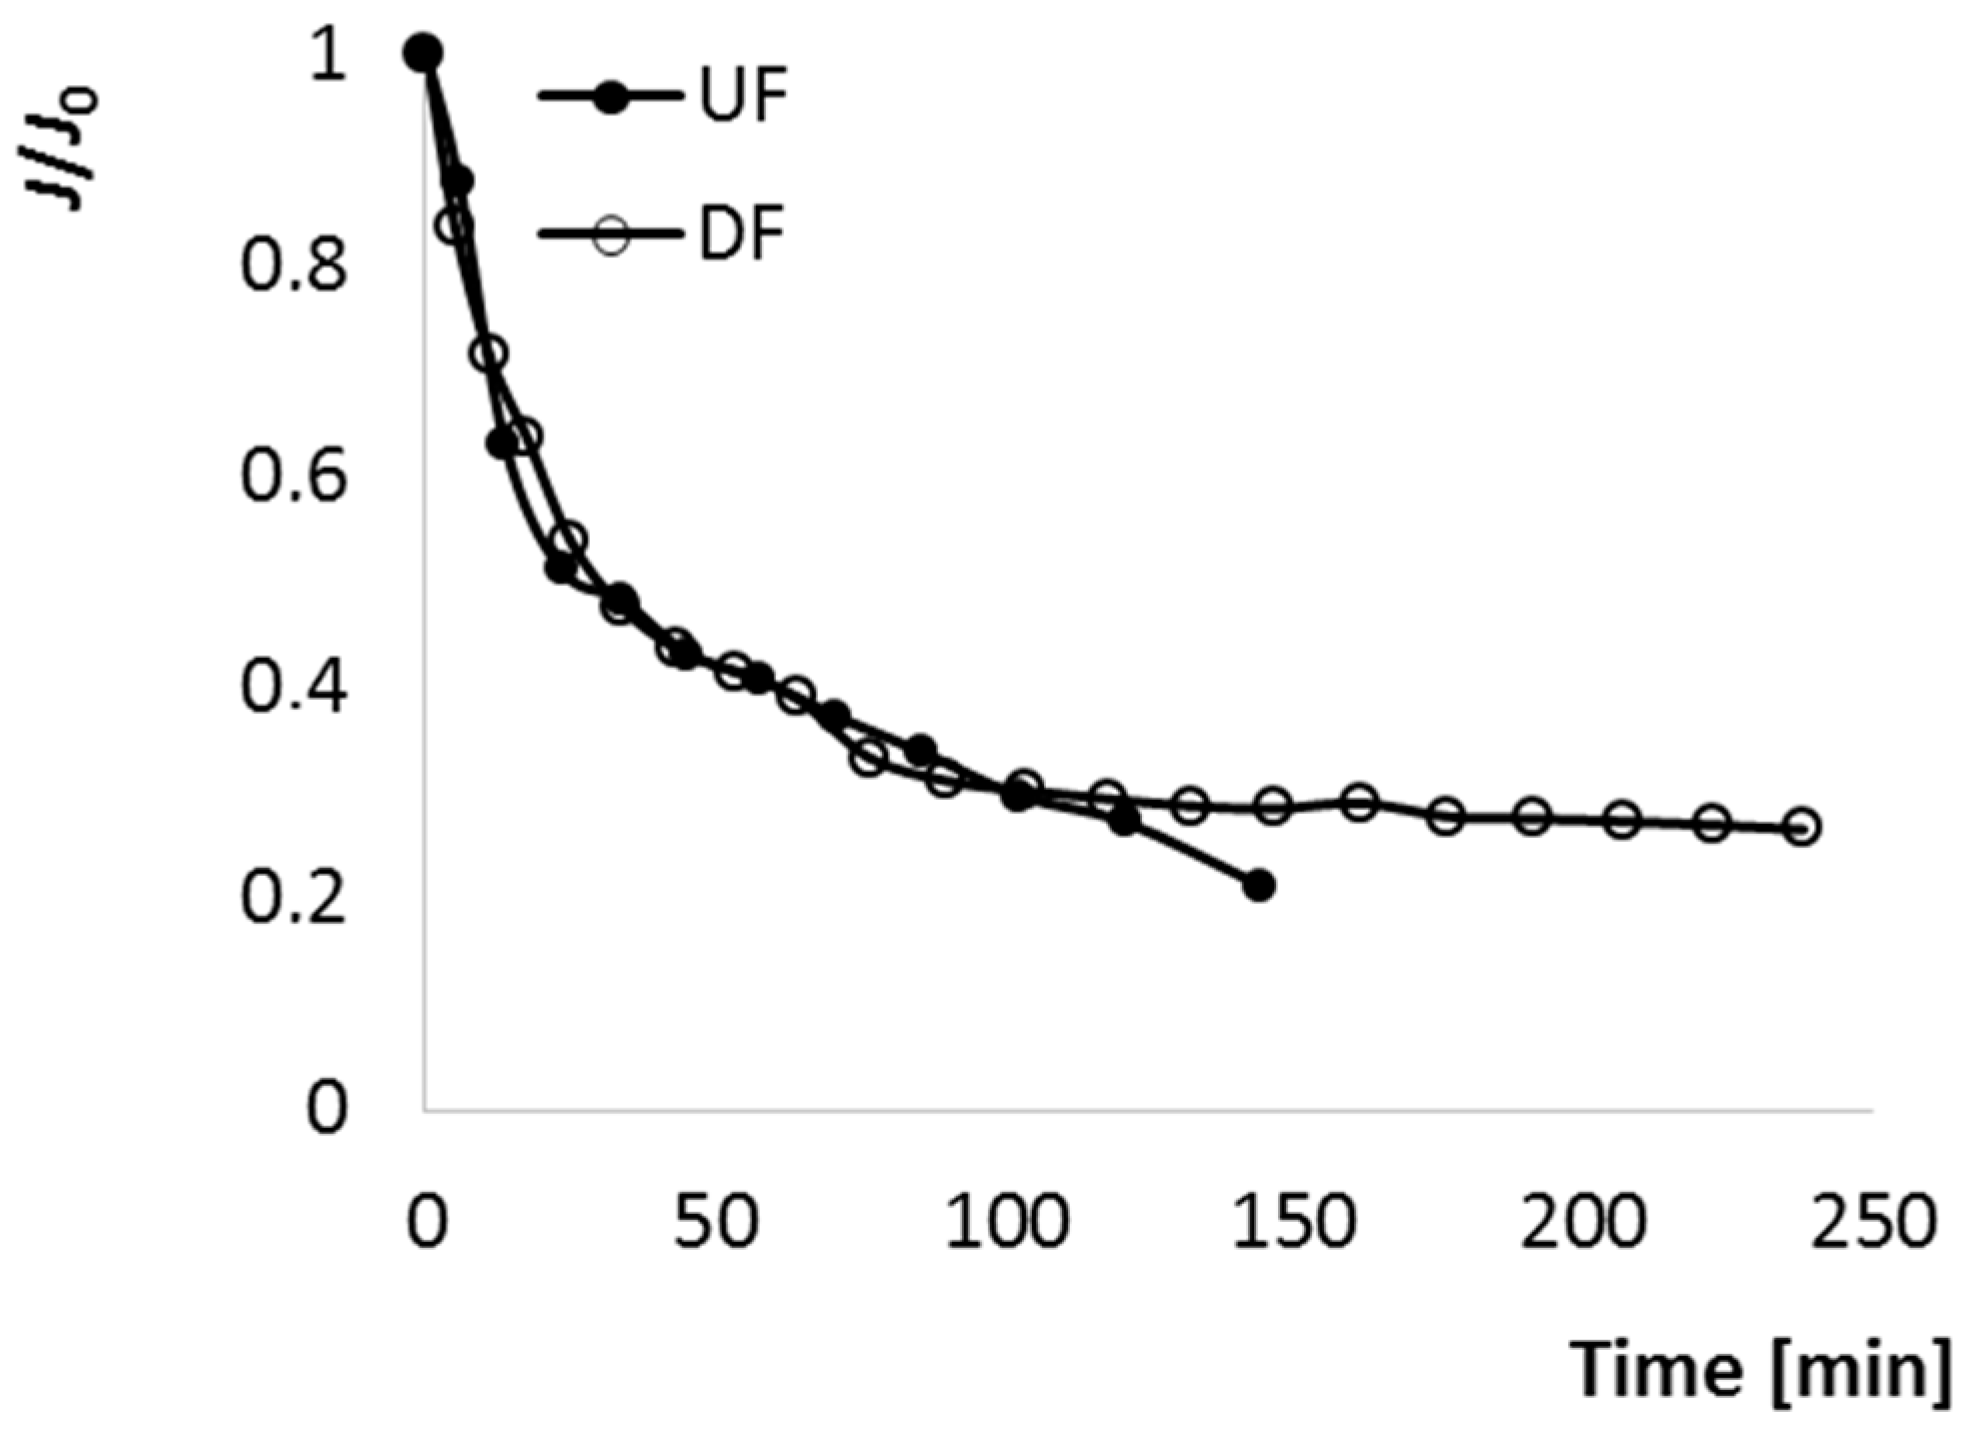
The changes of relative normalized P flux during both processes is presented in Figure 2. J/J0-time curves were divided in three sections. At the beginning, until 23 min, a rapid initial P flux decline was observed. According to Bruijn et al. [27], during the initial stage of UF, solutes with a size range much smaller than that of the membrane pores pass through these pores, where may be adsorbed and deposited due to various forces, leading to the formation of a colloidal film on the internal pore surface, and as a consequence, the reduction of pore size. Moreover, the sharp decrease at the beginning of UF can be attributed with the presence of pectin, adsorption of colloidal species and the build-up of a concentration polarization layer [16,28]. Next, from 23 to 120 min, relatively smoother and slower decline of P flux took place. It resulted from the accumulation of solutes and colloids on the external membrane surface. In these two ranges the performance of UF and DF, described by the changes of J/J0, was surprisingly almost the same. Only after 120 min was there a difference between UF and DF—during DF J/J0 was quasi-stable until 250 min, while during UF the P flow stopped at 140 min due to fouling caused by pore blocking and cake build-up. According to Yazdanshenas [29], a modified filtration step, namely diafiltration, in which make up water is added to the retentate, is carried out to maintain P flux. Wei et al. [24] observed that J declined immediately after starting the UF process (for phenolic compounds separation from apple juice), but due to the diluting of R by adding pure water it could be recovered. However, in the case of apple-cranberry cloudy juice, water addition did not affect the changes in P flux until 120 min of the DF process, the dynamic of J/J0 changes was the same as during UF. The DF approach was successful later in the process, after 120 min further decline of P flux was prevented as a result of water addition. Thus, by this method it would be possible, during a prolonged process, to completely separate sugars, salts and acids from juice containing pectin and other macromolecules.
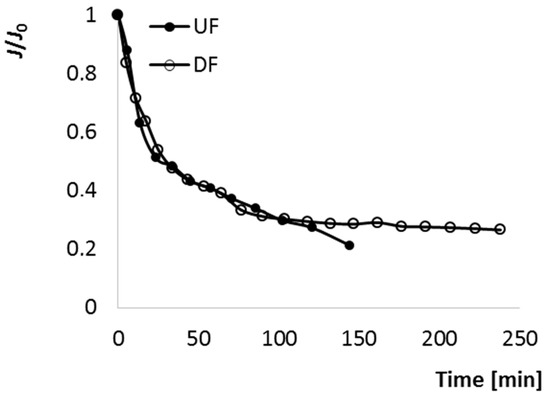
Figure 2.
The changes of J/J0 during ultrafiltration (UF) and diafiltration (DF) of cloudy apple-cranberry juice.
3.2. Characterization of Permeates and Retentates
3.2.1. Physicochemical Properties
Physicochemical properties of apple-cranberry cloudy juice before and after membrane processing by UF and DF are summarized in Table 1. As TSS, Glu, Fru, TS determined in ACJ were significantly higher (p < 0.05) than in the rest of the samples (including UF and DF retentate considered as final products—low sugar juices), it could be stated that the main goal of the work, which was the reduction of sugars content in cloudy juice, was achieved. TS of cloudy juice was reduced from 9.8 ± 0.2 to 7.5 ± 0.2 and 5.7 ± 0.2%, after UF and DF, respectively. There was also a significant difference in every parameter, except pH, between RUF and RDF, so the type of the processing (UF or DF) affected the properties of the product. It resulted mainly from the dilution by DF water during diafiltration, but also from the selective transport of juice components though the membrane (details about the selectivity—see Section 3.3) and “washout” effect. The same effects occurred in the work on grape and apple juice ultrafiltration presented by Carrín [30], pH value did not change significantly after membrane processing. TPC and color parameters were also affected by membrane processing, but the difference between values in ACJ and RUF were statistically not significant (p > 0.05). The amounts of scavenged DPPH differed significantly for tested samples. The most effective radical scavenger was non-treated sample ACJ. RUF had also high radical-scavenging capacity, but significantly lower (p < 0.05) than ACJ (the reduction by 13% compared with initial value). In both cases of the membrane process, permeates were significantly less effective radical scavengers than retentates. Moreover, RUF had significantly higher activity than RDF. It suggests that active compounds showing strong antioxidant capacity were selectively transmitted by the membrane, which was also confirmed by higher TPC in retentates. For processed juice, color is an important quality indicator [31]. The effect of membrane processing on cloudy juice color parameters and resulting ∆E value is evident due to the clarification process taking place during UF and DF. Thus, ∆E was at an extremely high level for permeates: PUF and PDF (the difference between these two samples was statistically not significant). Color parameters of RUF were not significantly different (p > 0.05) than before UF, but the retentate after DF (RDF) had significantly (p < 0.05) different color parameters than ACJ. Also, ∆E was higher than for RUF, what could be caused by the addition of water during DF.

Table 1.
Total soluble solids (TSS), glucose (Glu), fructose (Fru), total sugars (TS), non-sugar soluble solids (NSS), density (D), pH, total acidity (TA), total polyphenols (TPC), DPPH antioxidant activity (DPPH) of apple-cranberry cloudy juice before (ACJ) and after membrane treatment: permeate after UF (PUF), retentate after UF (RUF), permeate after DF (PDF), retentate after DF (RDF).
Above described results suggest that RUF sample was the most attractive from the point of view of reduced sugars content, but not reduced TPC, not changed color parameters, and radical-scavenging capacity reduced only by 13%.
The presence of polyphenols in apple juice is considered one of the factors affecting products instability (changes in aroma and color). It has been shown that among the main negative changes, which take place in raw fruit materials during processing, there are oxidative polyphenol conversions and polymerization of products of oxidative reaction [32]. Polyphenols are susceptible to dehydrogenation by polyphenol oxidases in the presence of oxygen to form unstable quinones. These compounds are responsible in further reactions (e.g., interactions with proteins and polymerization) for development of dark-colored pigments [33]. During conventional apple juice processing, including UF clarification, polyphenols are removed to obtain clear juice with an adequate level of stability [34]. However, polyphenols are also described as key components of apples having a cardioprotective effect, antioxidant ability, ability to prevent oxidation of high-density lipids, remove low-density lipids and fight against ulcer and cancer [5,24]. In addition, there is also emerging evidence that coingestion of polyphenols with other whole food components, such as fibre, can improve their bioavailability and bioefficacy [5].
In recent years, the interest of consumers and producers for bioactive compounds, especially phenolic compounds from natural sources, has increased remarkably [35]. Therefore, in the current approach of production of value-added cloudy apple-cranberry juice, the presence of polyphenols in the final product has to be considered as favorable. As was presented above, the difference in TPC between ACJ and RUF was statistically not significant, while in RDF the concentration of TPC was significantly lower than in ACJ. According to Onsekizoglu et al. [36] UF of apple juice with the use of 10 kDa membrane retained 28% of TPC, which explained the improvement of color after UF (final product in this traditional approach is permeate). The authors also implied that most of the phenolics in apple juice existed as conjugated forms or they were associated with other compounds to form larger molecular weight compounds, and then were rejected by the membrane of 10 kDa (the discussion about the recovery in the current work—see Section 3.3).
To prevent storage instability caused by polyphenols oxidative processes, the addition of antioxidants can be suggested. Nowadays consumers are increasingly demanding natural products, clean label solutions, and to avoid the use of any “artificial” substances, the application of natural antioxidants can be recommended [37]. As cranberry juice (Vaccinium macrocarpon Ait) was successfully used as a browning inhibitor for fresh-cut pear salad [38], the preparation of mixed types of juice (containing cranberry juice) can give the advantage of both increased nutritional value, as well as the potentially increased storage stability (to be verified in further investigation). The other currently tested option of clean label possibility is the addition of kiwifruit puree, which was verified to improve the quality characteristics and minimize the degradation during storage of cloudy apple juice [31].
3.2.2. FTIR
In this study, FTIR-ATR was also used to compare samples based on their spectral differences in the 3750–700 cm−1 spectral region. This method provided an alternative, cost-effective technique for the analysis of food samples (including honey and fruit juice), especially when coupled with chemometrics [39,40], which makes it possible to discriminate between samples of various composition and concentration [41].
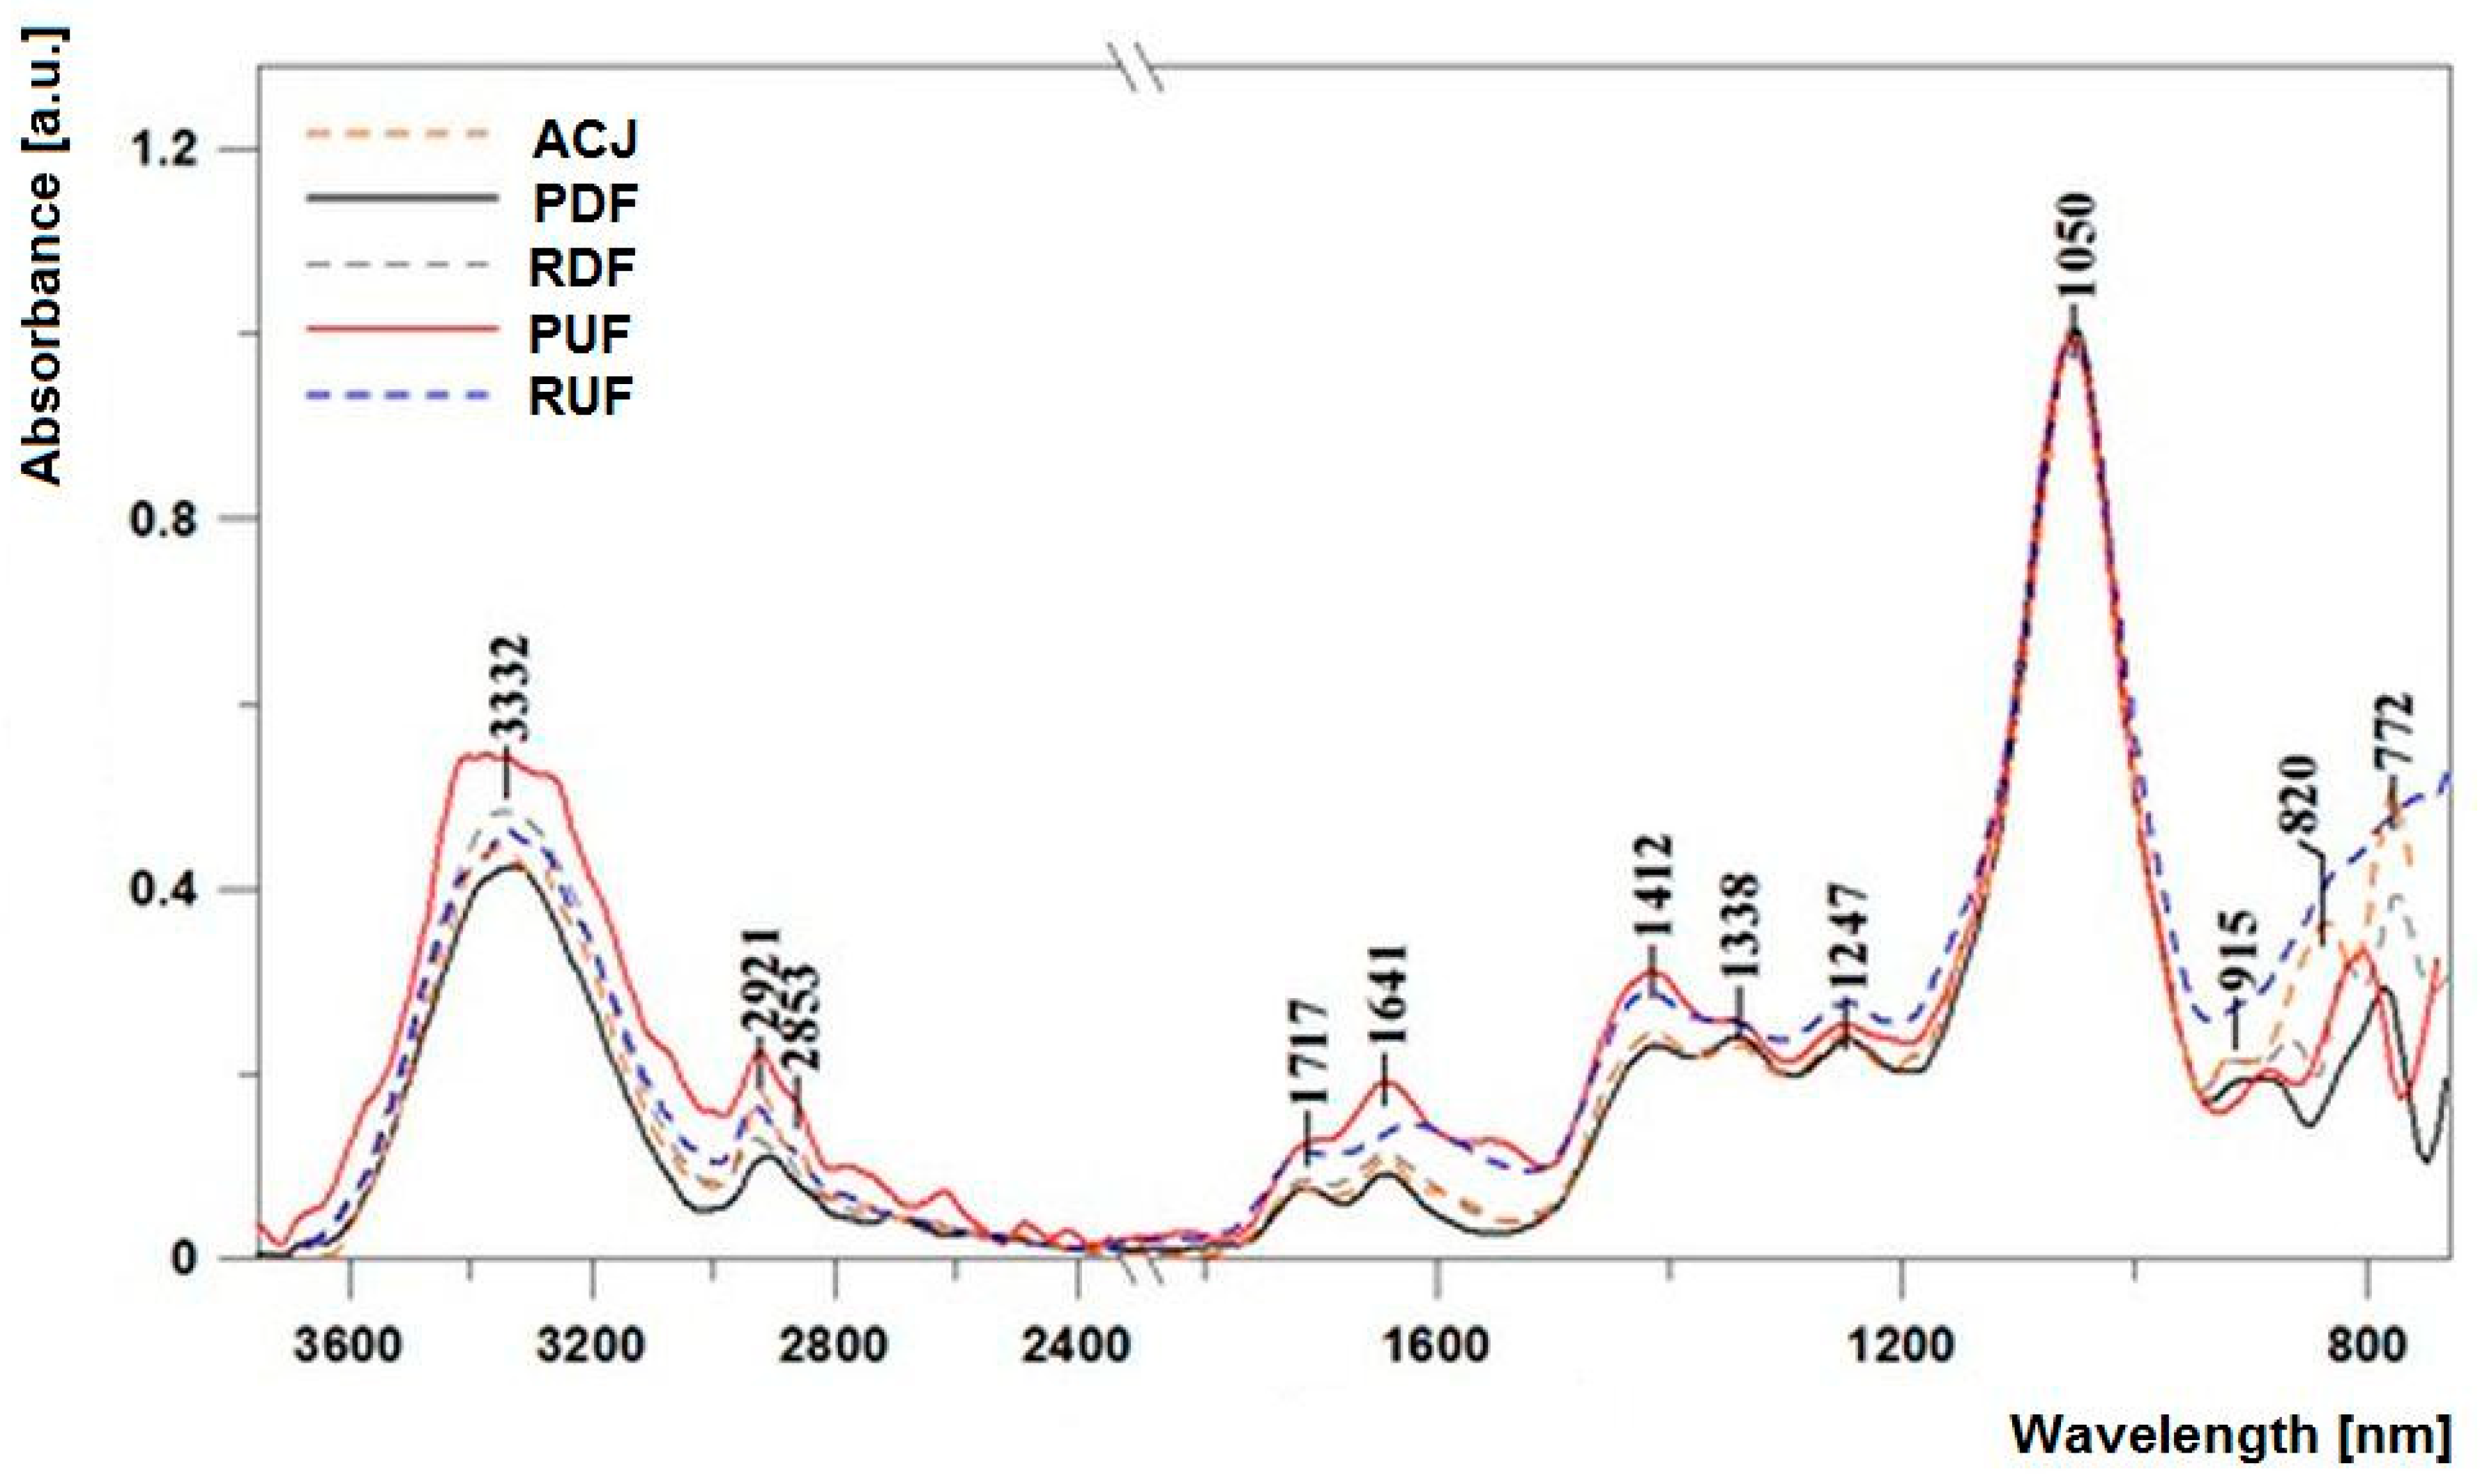
In order to facilitate band characterisation as well as comparison between samples, Figure 3 presents the ATR-FTIR spectra with an indication of the relevant band maxima. In Table 2, the exact position of bands juxtaposed with specific oscillations associated with respective functional groups are presented. Additionally, all the measured spectra were normalised at the wave number of 1050 cm−1 to facilitate interpretation of the results as well as to emphasise the differences between the same.
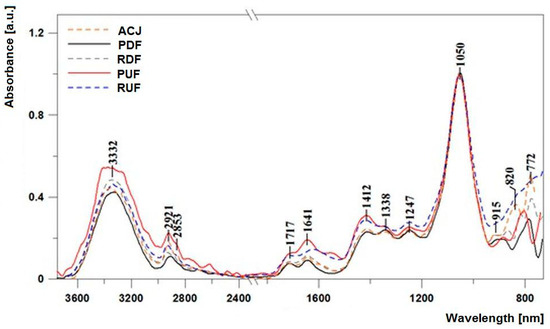
Figure 3.
Infrared spectra of the analysed juice samples: ACJ, PDF, RDF, PUF, and RUF in the spectral range from 700 to 3750 cm−1.

Table 2.
The location of the maxima of absorption bands FTIR with arrangement of appropriate vibration in terms of spectral 3750–700 cm−1.
All the measured spectra revealed, within the analysed range, relatively strong oscillations, which to a large extent made their analysis feasible and allowed respective oscillations to be associated with specific functional groups, which in turn corresponded to changes in particular substances. Respectively, the bands with maxima at approx. 1250 cm−1 correspond to stretching oscillations of the C–O group in carboxylic acids. Bands with maxima at approx. 1338 cm−1 correspond to the oscillations of deformation δ (–OH) groups in the C–OH group [41]. Deformation C–H oscillations also correspond to bands with maxima at approx. 915 cm−1, which can also originate from acids. The aforementioned bands reveal only slight differences after application of UF and DF factors, naturally with the exclusion of the RUF sample for which the level of oscillation of the band with the maximum at 915 cm−1 was significantly higher. In the case of bands with the maxim at approx. 1338 and 1247 cm−1 respectively, a significantly higher level of oscillation was observed in samples subjected to the UF process, which evidenced the higher level of the aforementioned factors in those samples. A characteristic area corresponding to the stretching oscillations of –OH groups is the broad band with the maximum at approx. 3330–3350 cm−1 [42]. The bands evidence the presence of small amounts of water molecules in the samples, but above all can originate from group carbohydrates and organic acids.
Another characteristic area present in all the analysed samples contains bands corresponding to symmetrical and asymmetrical oscillations of –CH2 and –CH3 groups in the region of 2850 to 2950 cm−1. The lowest intensity of these bands was observed in the DF samples. It should be emphasised that the reason for the significant broadening of the band corresponding to the stretching oscillation of the OH group stems from the strength of the hydrogen bonds present in dimers of carboxylic acids [41]. Carboxylic acids are characterised by a somewhat irregular character of absorption in the 3300–2500 cm−1 area, with the broad O–H band overlapping with the C–H stretching oscillation bands. Oscillations of the –OH group belonging to various acidic fractions also correspond to deformation oscillations of the group in the region with the maximum at approx. 1640 cm−1 [43,44]. A region of very intensive bands within the range from 1060 to 930 cm−1 can be associated with the C–O stretching oscillations in the C–OH group or C–C stretching in the carbohydrate structure. In turn, bands with the maxima at approx. 918 cm−1 are the bands of the C–H deformation oscillations (as mentioned above). Another interesting region is very characteristic in terms of the assessment and characteristics of samples such as various types of juice; bands in the range from 890 to 760 cm−1 (in our case with the maxima at approx. 820, 772 cm−1 and others indicated in Table 2) correspond to the characteristic oscillations of the anomeric region of carbohydrates or deformation C–H. Moreover, the relatively intensive bands with maxima at approx. 770 cm−1 are bands associated with the oscillations of the anomeric region of carbohydrates or deformation C–H (δ (C–H)). The region is characterised by considerable differences between particular samples, which evidences a significant change in terms of bond conformation in various sugar fractions (glycoside bond). Significant discrepancies between UF and DF samples were also observed in terms of bands with the maxima at approx. 1412 cm−1. Oscillations in the aforementioned spectral band are characteristic of O–CH and C–C–H deformation oscillations in the carbohydrate structure, or deformation oscillations originating from the –OH group in the C–OH grouping. According to Anguebes et al. [45], they may also be related to the presence of organic acids, carotenes, and polyphenols. Changes in this region clearly evidence smaller amounts of particular sugar fractions in the samples subjected to the DF process.
However, particularly significant discrepancies between all the samples were observed in the area from 1750 to 1550 cm−1, which corresponds to the oscillations of the carbonyl C=O group of fructose and aldehyde CH=O of glucose [41,43,46]. In particular, the decrease in the intensity of those bands was observed in samples subjected to the DF process (PDF and RDF) when compared to both UF samples. One should also emphasise the near complete disappearance in DF samples in the aforementioned area of the band with the maximum at approx. 1580 cm−1 which, alongside the aforementioned bands, may also correspond to the stretching oscillation of the N–H group in the band of free amino acids. Oscillation with the maximum at approx. 1640 cm−1 corresponds to the stretching vibration of C–H bonds that constitute the chemical skeleton of sugars.
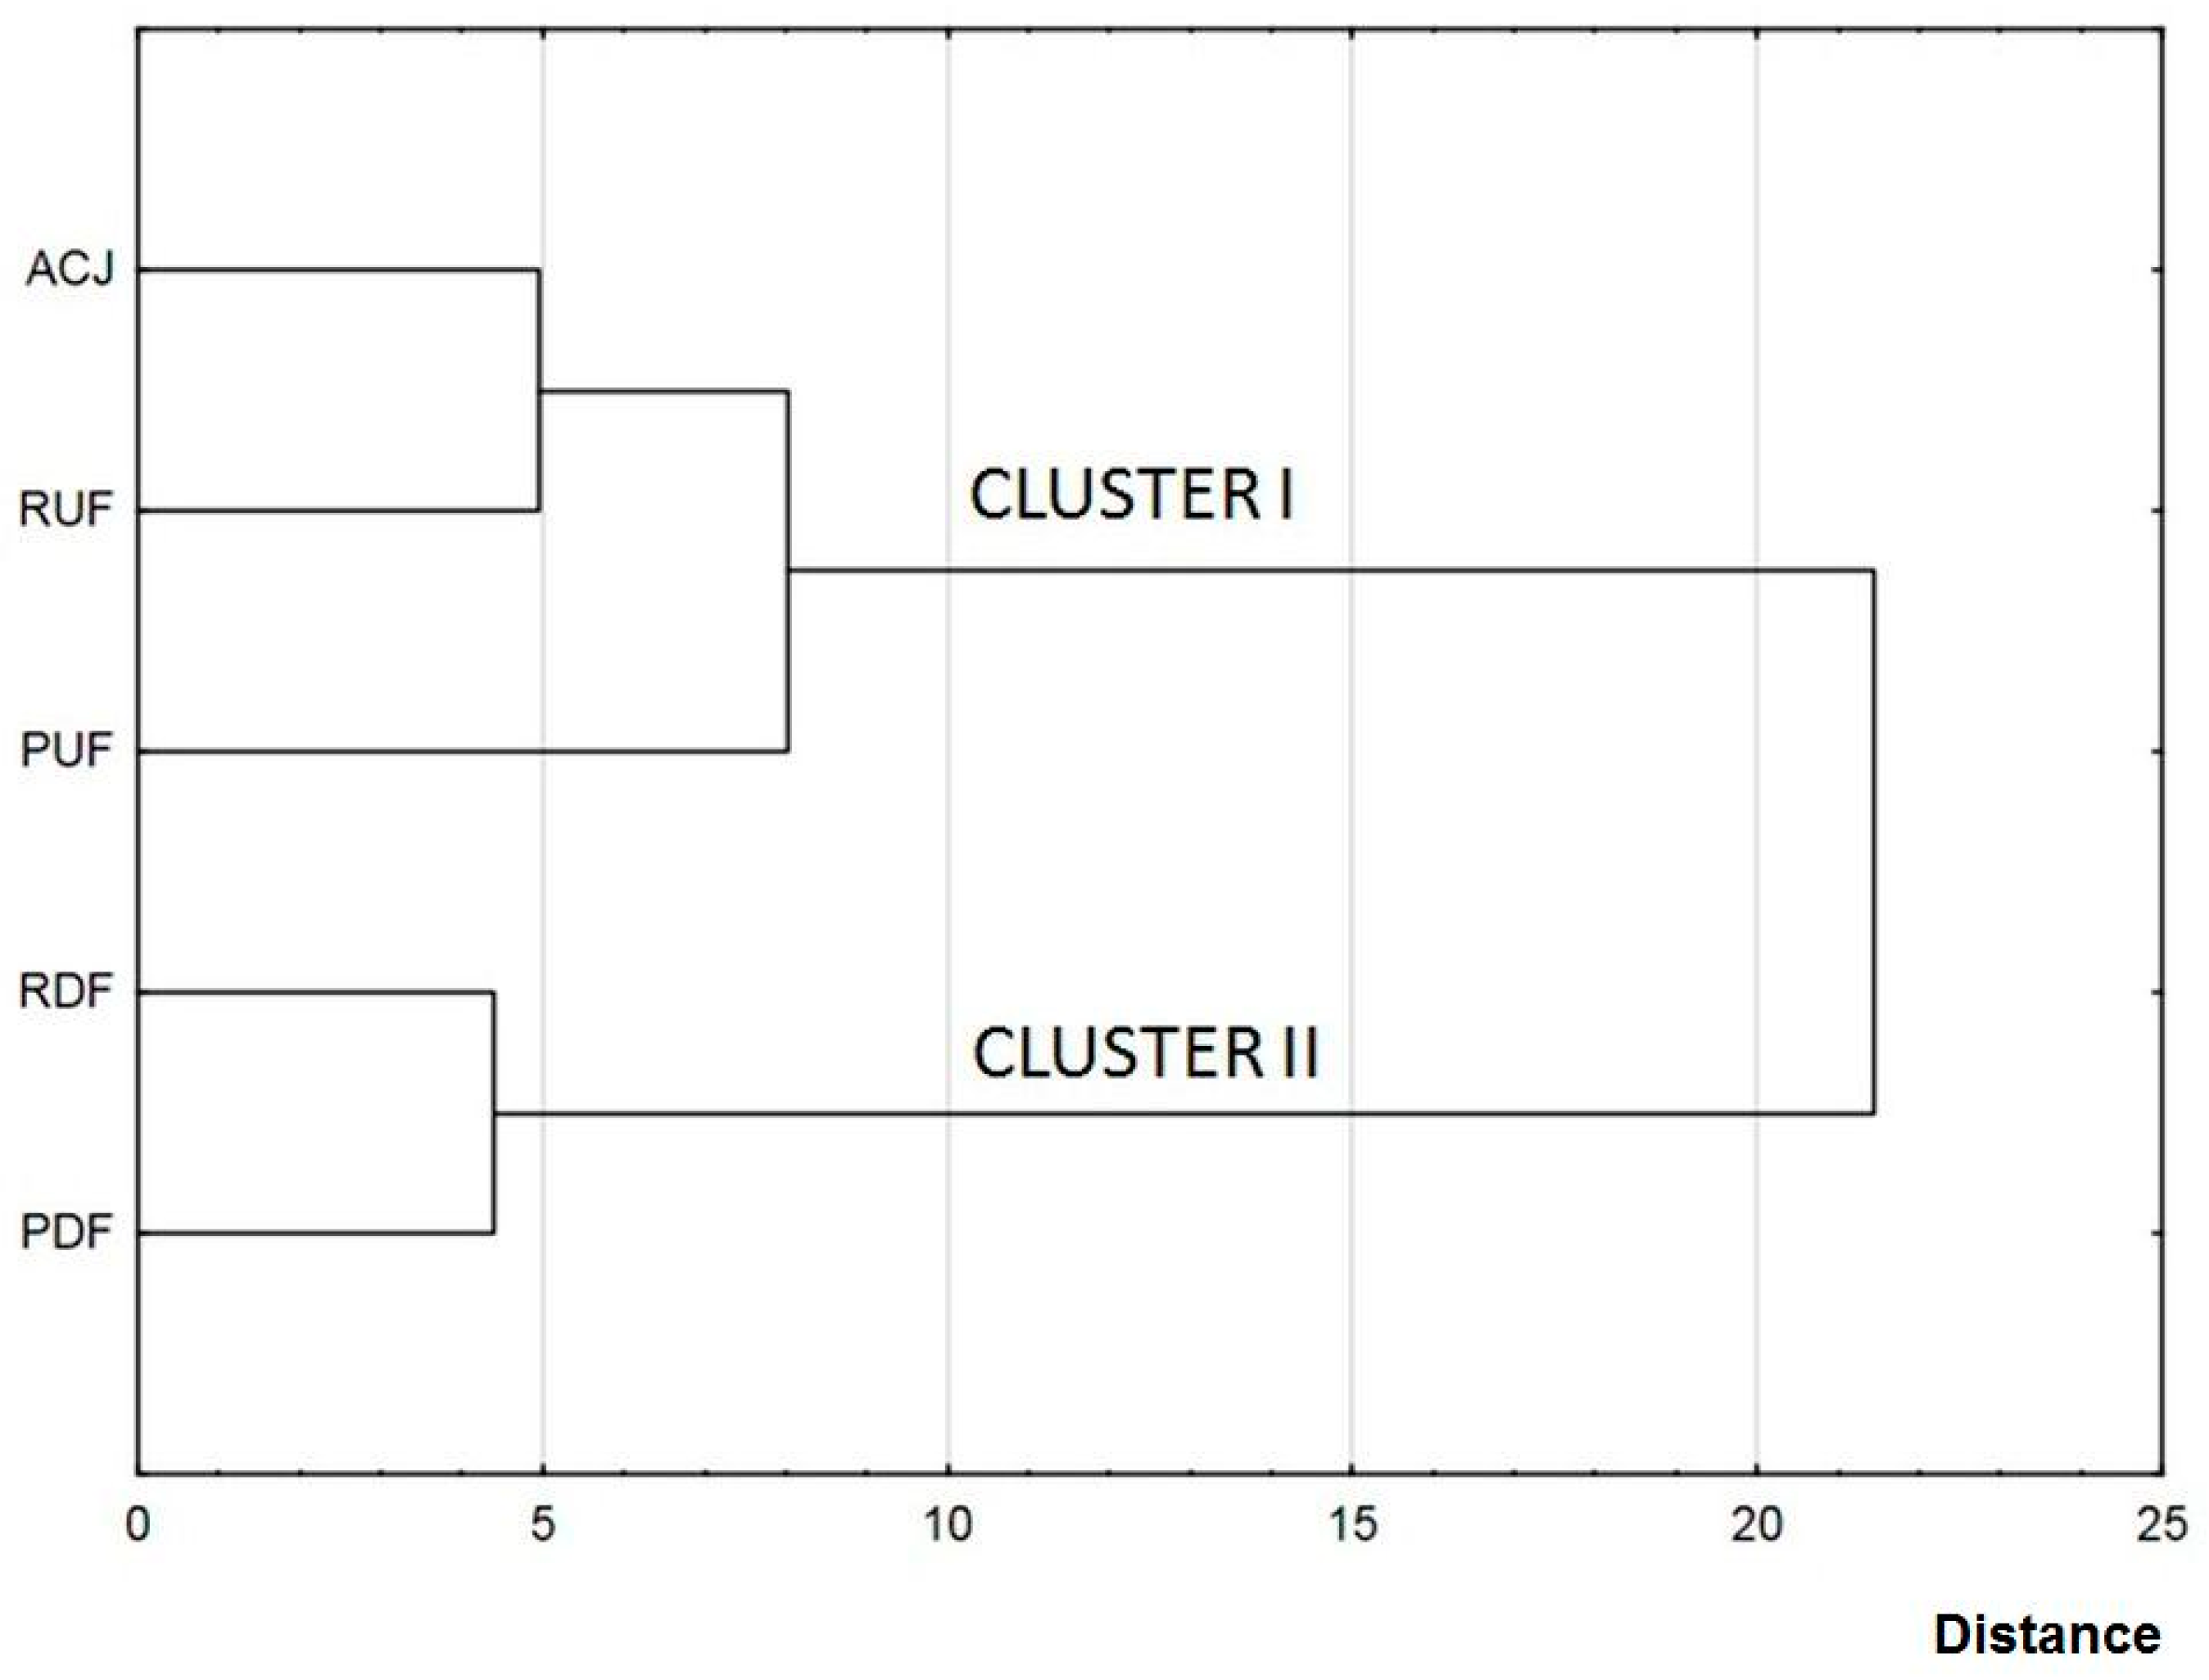
Hierarchical cluster analysis was applied to display differences between FTIR spectras for particular samples. Figure 4 shows a dendrogram chart in which the formation of the individual clusters can be seen: cluster I containing a non-treated sample and samples after UF, and cluster II containing samples after DF. This division confirms significant influence of membrane treatment on juice composition. Additionally, in cluster I, containing a non-treated sample and UF samples, RUF sample was more similar to ACJ than PUF.
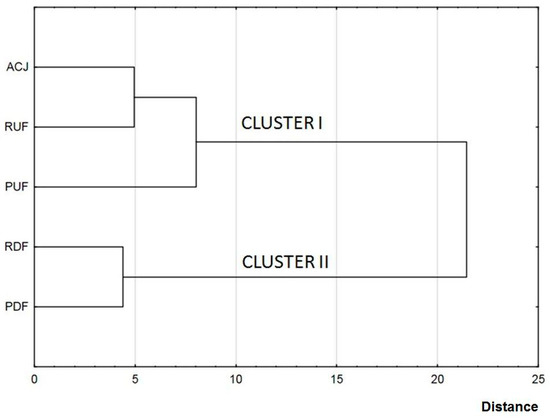
Figure 4.
Discrimination of apple-cranberry cloudy juice samples before and after membrane processing based on hierarchical cluster analysis (HCA) of FTIR spectra (B).
3.3. Selectivity of Ultrafiltration and Diafiltration
Both the determination of particular physicochemical properties, and the analysis of FTIR spectra, does not give the full overview about the progress of the membrane processing and the characteristics of the obtained products. Additionally, for these purposes, the selectivity of UF and DF was described, based on recovery factor R (Table 3).

Table 3.
Recovery factor R (%) of total soluble solids (TSS), glucose (Glu), fructose (Fru), total sugars (TS), total acids (TA), total polyphenols (TPC), and non-sugar soluble solids (NSS) in retentate after apple-cranberry cloudy juice ultrafiltration (UF) and diafiltration (DF).
R of individual compounds (TSS, TS, Glu, Fru, TPC, TA) after UF was at the same level (0.76–0.77), while for NSS it was lower (0.72). This means that the applied membrane was selective for juice compounds, sugars (TS, Glu, Fru) were transmitted together with acids (TA) and polyphenols (TPC), while the transmission of other non-sugar soluble compounds to the permeate was higher. However, the obtained juice contained insoluble phase, fibre and high molecular weight solids (including pectins) of potential health-promoting properties, coming from ACJ. According to Riedl et al. [47] unclarified apple juice contains soluble pectin with a molecular weight distribution centered around 100 kDa. Other authors [15] used UF to separate apple pectin on the basis that 68% of the pectin have a molecular weights over 300 kDa whereas a minority has a molecular weight below 5 kDa. Thus, 15 kDa membrane used in the current work should reject the majority of pectin present in ACJ. Conidi et al. [35] presented lower rejection (17.7–26.6%) of TPC after UF of orange juice, but membranes of higher MWCO were used (50 and 100 kDa MWCO)
It has to be emphasized, that although in general UF membranes are not a barrier for glucose and fructose (the size of pores is bigger than the size of molecules), during the process not every molecule of sugars had a possibility to contact the membrane, due to the fact that the process was performed in a dynamic mode (the flow of feed/retentate was perpendicular to the membrane).
After DF, the recovery factor R of TSS, TS, Glu, Fru, TPC and TA was lower than after UF (0.58–0.64), which resulted from longer processing and the “washout” effect due to water addition. Moreover, some differentiation of values for individual components could be observed. The recovery of polyphenols (TPC) was lower than of TSS, acids (TA) and sugars (TS). According to a previously published work [24], UF can be applied for the separation of polyphenols from sugars present in apple juice. Under optimum operating UF conditions (1 kDa MWCO, TMP 4 bar, temperature 30 °C, feed flow rate 1–1.8 L/min, pH 3 and 10 °Brix), 70% of polyphenols were transmitted to the permeate, while only approx. 20% of the sugar was present in that stream. Thus, it was a similar effect as observed during DF in the current work, of higher transmission of polyphenols than sugars. This effect is not favorable from the point of view of the aim of the current work. As was discussed above, polyphenols with their natural antioxidant ability, if possible, should be retained in the proposed products, provided that the addition of some antioxidants will prevent them the from the oxidative and post oxidative transformations. On the contrary to UF, after DF the recovery of NSS was higher than of other compounds.
In the patent published by Black and Bray [12], dealing with membrane hybrid processing of fruit juices to obtain low-sugar juice, the subsequent nanofiltration (NF) step after UF is proposed, in which acids (including ascorbic acid), minerals, and other water-soluble components transmitted to permeate during UF, can be separated from sugars. As was presented by Cassano et al. [48], Condi et al. [49], and Conidi et al. [50], phenolic compounds can be separated from sugars by the adequate NF membrane, rejecting phenolic compounds and transmitting sugars. Then, NF retentate could be included in the final product for these compounds retrieval. The most appriopiate NF membrane for this purpose should have 400–450 Da MWCO. In the results presented by Conidi et al. [50] the rejection of 450 Da membrane towards flavonoids was in the range 91–99%, while for sugars it was 48%, indicating the best performance in terms of separation between sugars and flavonoids (among membranes of 450, 750 and 1000 Da MWCO). According to Conidi et al. [49] high rejection of NF membranes (200, 400, 1000 Da MWCO) towards anthocyanins results from a positive charge in their structure and electrostatic interaction with the membrane structure.
3.4. A Glass of Juice
The aim of the work was to propose the reverse approach for membrane processing of juice, in which the retentate coming from UF/DF is treated as a final product of reduced sugars content. To prove the validity of this approach, the calculations were done to present the amount of sugars, and non-sugars soluble solids, in one glass (250 mL) of obtained products (UF and DF retentates). The amount of sugars in one portion of juice decreased after UF and after DF even more (Table 4). The percentage of sugars reference intake, connected with the consumption of 250 mL of juice, was decreased from 27.0 to 20.7 after UF, and 15.7% after DF.

Table 4.
Total sugars (TS) and non-sugar soluble solids (NSS) content in a glass (250 mL) of cloudy apple-cranberry juice (ACJ), retentate after ultrafiltration (RUF), and retentate after diafiltration (RDF), together with the percentage of sugars reference intake (%RI) and the ratio of TS to NSS.
In the case of non-sugar soluble solids content, it was increased after UF, but decreased after DF. However, the simultaneous reduction of sugars content resulted in both cases in the favorable increase of the ratio of sugars to non-sugars soluble solids content. In addition, considering that retantates contained the full amount of dietary fibre and other macromolecules present in juice, characterized by health promoting properties, the obtained products could in fact be described as functional, value-added products.
Moreover, the suggested method could help to reduce the amount of waste coming from fruit processing, with simultaneous exploitation of valuable ingredients, perfectly fitting into the strategy of sustainable food processing and sustainable development.
3.5. PCA and HCA Analysis
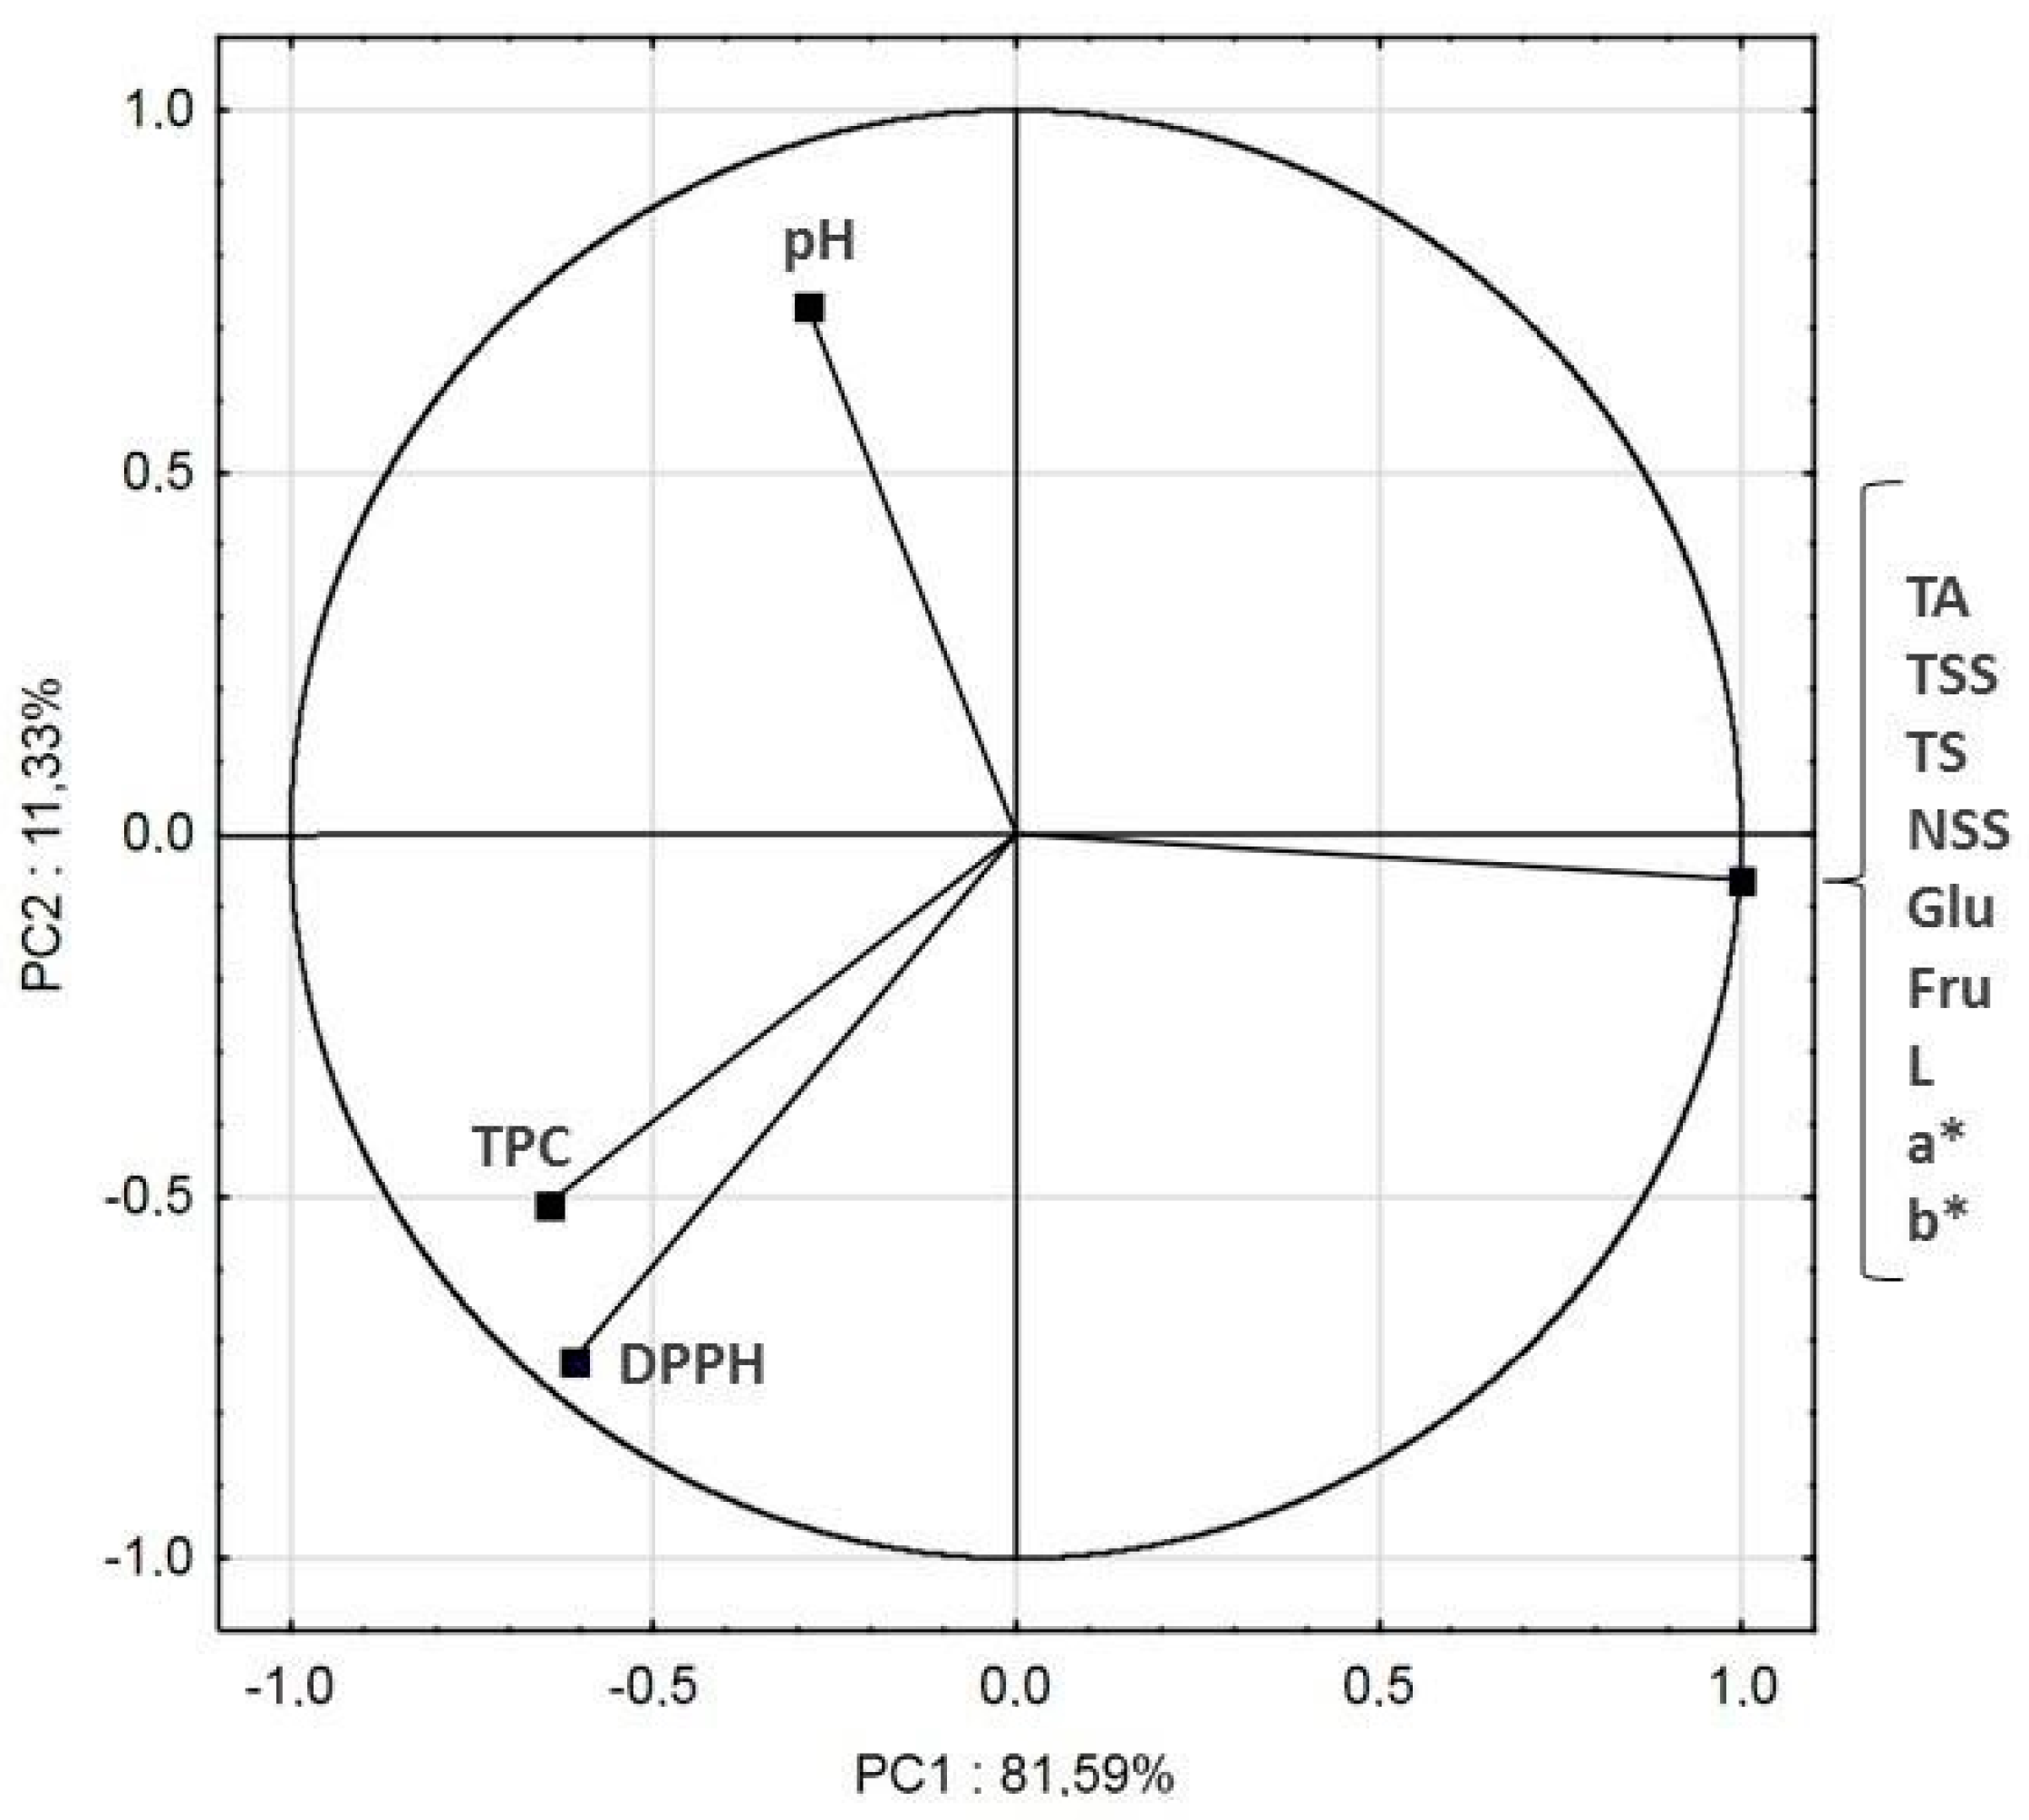
The original data set of samples was a 5 × 12 matrix. PCA analysis reduced the original 12 variables to 2 principal components. 81.59% of variance was described by the first principal component PC1, while 11.33% by the second component PC2. The two-dimensional plot with PC1 and PC2 as the axes is shown in Figure 5. Namely, a high magnitude (near to +1 or −1) for factor loading means that the variable is highly correlated with that factor, but >0.5 can be enough for importance [51]. The positive part of the first principal component reflected TA, TSS, TS, NSS, Glu, Fru and color parameters. The negative part of the first principal component reflected mostly TPC and DPPH. The second principal component described mostly pH. TA, TSS, TS, NSS, Glu, Fru and color parameters were closely correlated to each other (they were located in the same point). TPC was strongly correlated with DPPH, which was caused by the antioxidant ability of polyphenols.
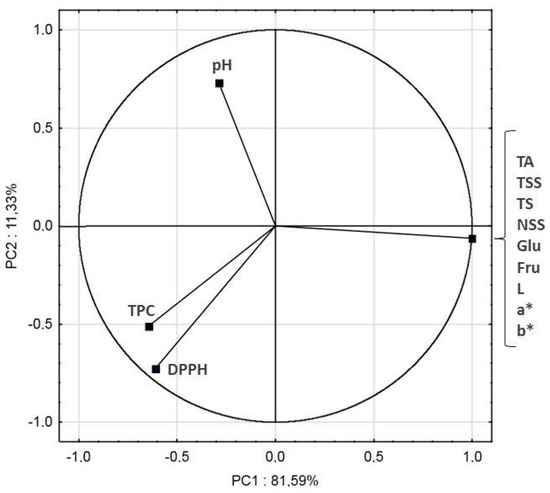
Figure 5.
Principle component analysis of cloudy apple-cranberry juice processed by ultrafiltration and diafiltration, the response of 12 determined parameters.
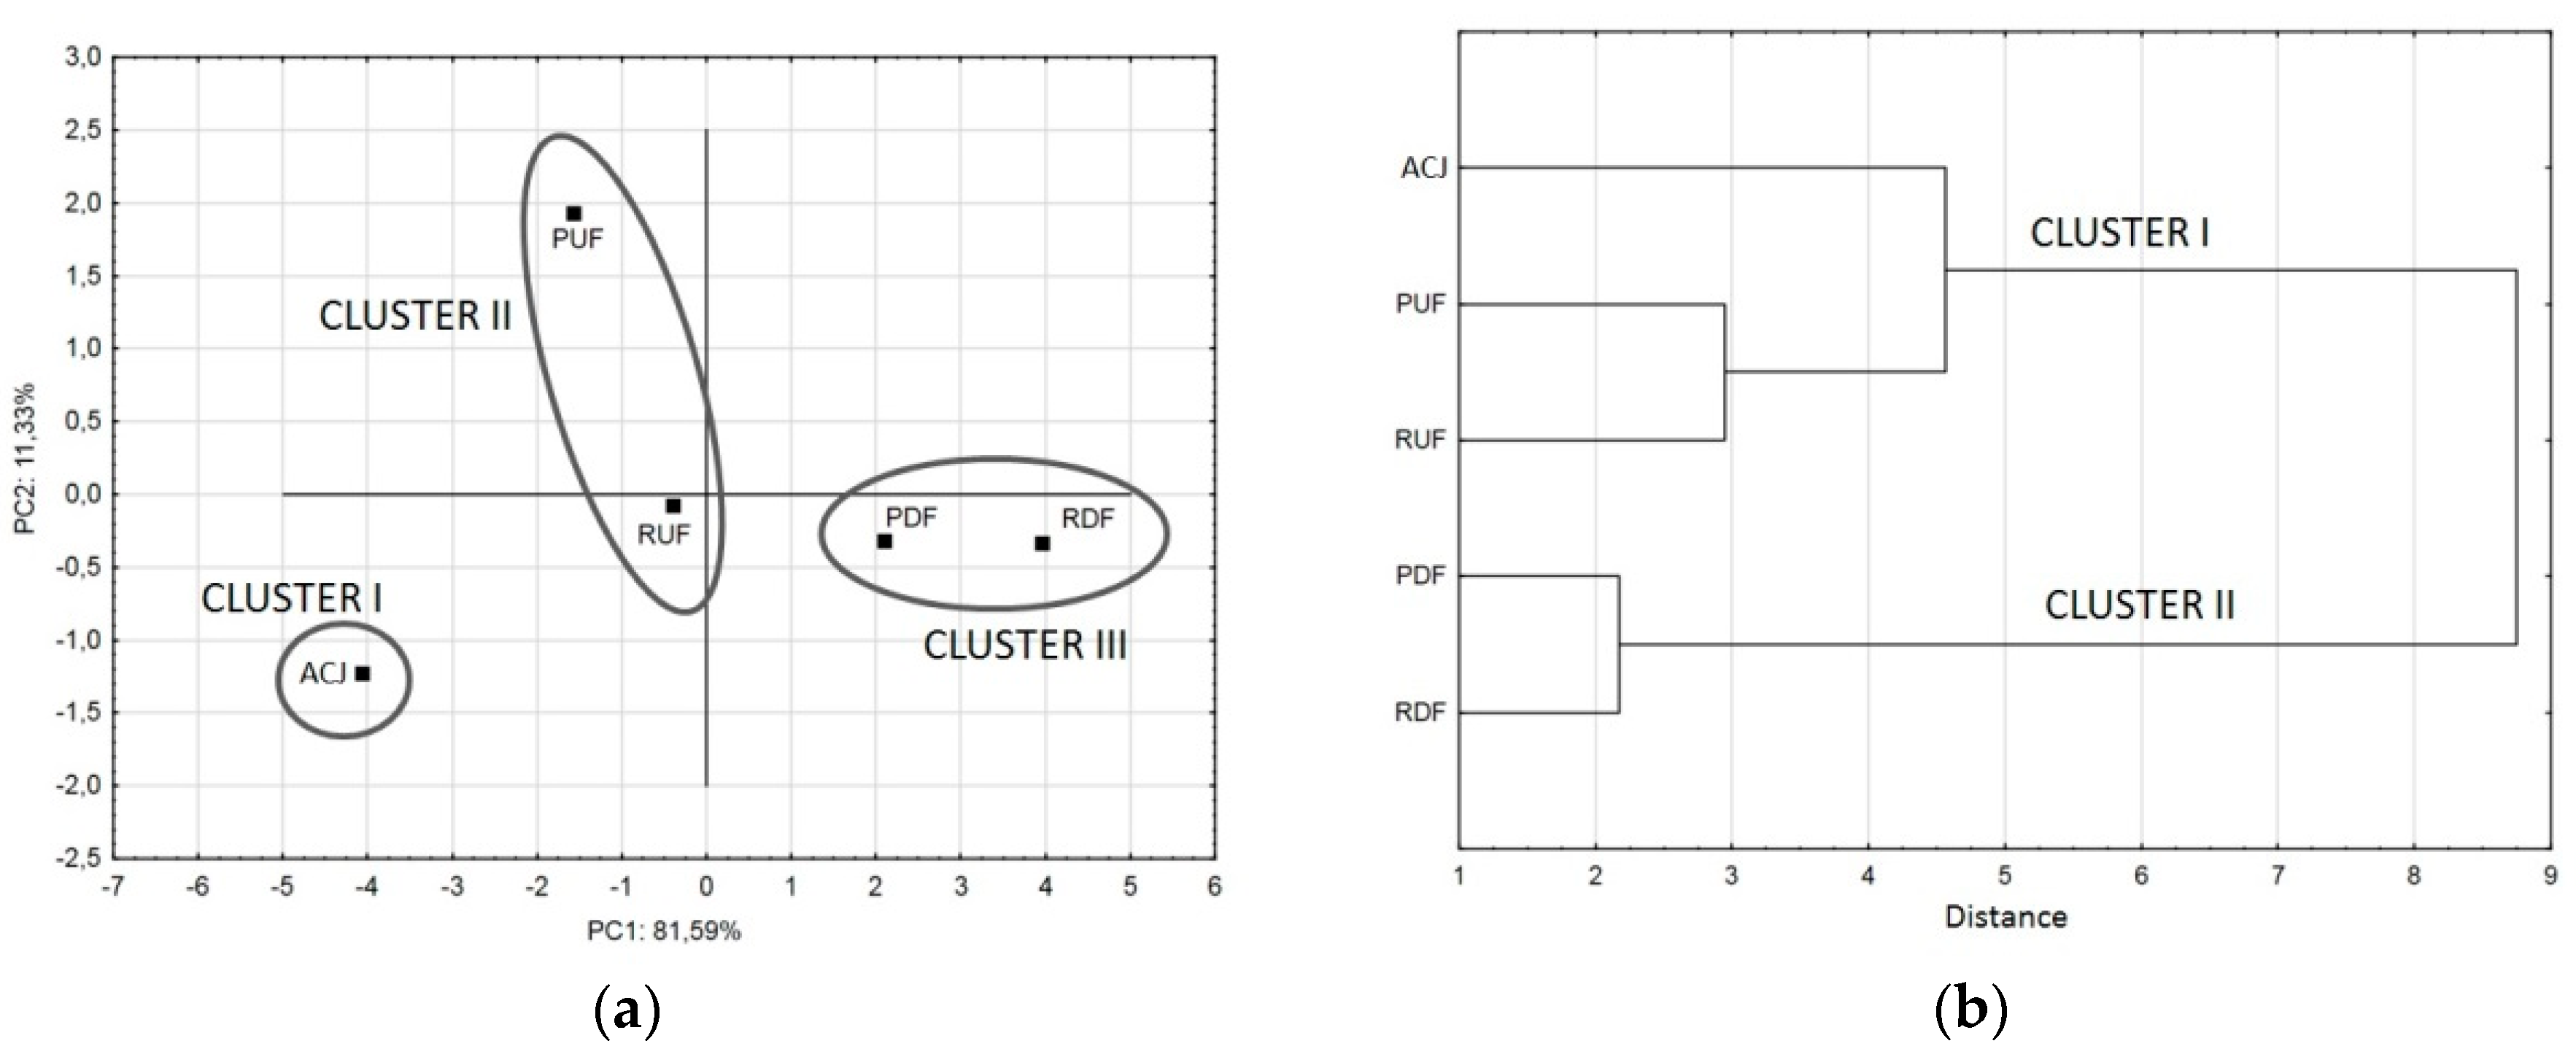
A score plot of the first two principal components (Figure 6a) is most commonly used to display the cluster outcomes of given data sets where samples having similar scores are positioned closely together. This technique facilitates classification and individualization of samples in an objective and reproducible manner, the more closely together particular samples cluster in the scores plot, the more similar they are [52]. Sample ACJ formed an individual cluster I, while PUF and RUF were in cluster II, located more closely to ACJ than samples after DF. PDF and RDF (cluster III) were ‘similar’, located in the in the diagonally opposite quadrant from PUF. The only sample located in the same quadrant as ACJ was RUF, so it can be concluded that it was the most similar sample to untreated juice. The RUF sample was also the most similar to ACJ in the hierarchical cluster analysis of FTIR spectra.
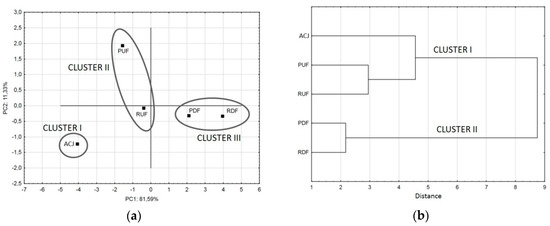
Figure 6.
Principal component score plot of the effect of the first two discriminant functions in the classification of different samples considered (a), and dendrogram obtained by hierarchical cluster analysis (b).
Clusters formation can be also presented as a dendrogram chart (Figure 6b). The horizontal axis of the dendrogram represents the distance or dissimilarity between clusters, while the vertical axis represents the objects and clusters. Each joining (fusion) of two clusters is represented on the graph by the splitting of a horizontal line into two horizontal lines. The horizontal position of the split, shown by the short vertical bar, gives the distance (dissimilarity) between the two clusters. Based on the positions of lines, if the final number of clusters was to be 2, the sample ACJ, PUF and RUF would form the first cluster (I), and PDF with RDF samples the second cluster (II). If there were to be 3 clusters, the ACJ sample would split from the first cluster and form an individual cluster, PUF and RUF would form the second, while PDF with RDF forming the third cluster. The horizontal distance for each cluster is different, showing different similarity of samples inside the clusters: samples after DF were more similar to each other (distance 2.15) than samples after UF (distance 3), while the similarity of ACJ sample to UF samples was the weakest (distance 4.6)
Cluster analysis confirmed the information about the significant influence of applied membrane technologies on juice properties, and also about the differences between UF and DF.
4. Conclusions
Cloudy apple-cranberry juice was ultrafiltrated and diafiltrated in order to obtain the functional value-added product of reduced sugar content. Contrary to the traditional membrane processing during clear juice production, retentates from UF and DF were treated as final products. Thanks to the applied membrane processes, the percentage of sugars reference intake, connected with the consumption of 250 mL of juice, was decreased from 27.0 to 20.7% (ultrafiltration), and 15.7% (diafiltration). Due to selective properties of the membrane, retentate/juice after ultrafiltration had significantly lower sugar content than feed juice, while the content of phenolic compounds was not significantly changed. On the contrary, after diafiltration phenolics content was reduced. Thus, ultrafiltration was more favorable method for the reduction of sugars content, because of polyphenols “washout” during diafiltration. Although there are several diverse effects of phenolics on juice storage stability, the presence of these compounds in the proposed products has to be considered as favorable, and increasing nutritional value of reduced sugar juice. The storage stability of such obtained products should be carefully investigated in the next steps of the research. As was suggested, one of possible methods to prevent juice from storage instability could be the addition of clean label ingredients, including cranberry juice or kiwi puree.
Author Contributions
K.S. conceived and designed the experiments, and wrote the manuscript. Experimental activities on laboratory scale with ultrafiltration and diafiltration processes were carried out by K.S. and P.K. A.J. and A.K.-D. were involved in the analytical characterization of permeate and retentate samples, as well as in statistical analysis performance. A.M. performed FTIR measurements, its analysis and description. All Authors contributed to the interpretation and discussion of experimental results.
Funding
This research received no external funding.
Conflicts of Interest
The authors declare no conflict of interest.
References
- Basu, A.; Betts, N.M.; Ortiz, J.; Simmons, B.; Wu, M.; Lyons, T.J. Low-energy cranberry juice decreases lipid oxidation and increases plasma antioxidant capacity in women with metabolic syndrome. Nutr. Res. 2011, 31, 190–196. [Google Scholar] [CrossRef] [PubMed]
- Gill, J.M.R.; Sattar, N. Fruit juice: Just another sugary drink? Lancet Diabetes Endocrinol. 2014, 2, 444–446. [Google Scholar] [CrossRef]
- Regulation (EU) No 1169/2011 of the European Parliament and of the Council of 25 October 2011 on the Provision of Food Information to Consumers. Available online: https://eur-lex.europa.eu/legal-content/EN/ALL/?uri=CELEX%3A32011R1169 (accessed on 30 March 2018).
- Juarez-Enriquez, E.; Salmerón, I.; Gutierrez-Mendez, N.; Ortega-Rivas, E. Ultraviolet irradiation effect on apple juice bioactive compounds during shelf storage. Foods 2016, 5, 10. [Google Scholar] [CrossRef] [PubMed]
- Bondonno, N.P.; Bondonno, C.P.; Ward, N.C.; Hodgson, J.M.; Croft, K.D. The cardiovascular health benefits of apples: Whole fruit vs. isolated compounds. Trends Food Sci. Technol. 2017, 69, 243–256. [Google Scholar] [CrossRef]
- Muraki, I.; Imamura, F.; Manson, J.E.; Hu, F.B.; Willett, W.C. Fruit consumption and risk of type 2 diabetes: Results from three prospective longitudinal cohort studies. BMJ 2013, 347, f6935. [Google Scholar] [CrossRef] [PubMed]
- Teleszko, M.; Nowicka, P.; Wojdyło, A. Chemical, enzymatic and physical characteristic of cloudy apple juices. Agric. Food Sci. 2016, 25, 34–43. [Google Scholar]
- Bolton, R.P.; Heaton, K.W.; Burroughs, L.F. The role of dietary fiber in satiety, glucose, and insulin: Studies with fruit and fruit juice. Am. J. Clin. Nutr. 1981, 34, 211–217. [Google Scholar] [CrossRef] [PubMed]
- WHO. Healthy Diet. Fact Sheet N°394; WHO: Geneva, Switzerland, 2015. [Google Scholar]
- WHO. Sugars Intake for Adults and Children; WHO/NMH/NHD/15.2; WHO: Geneva, Switzerland, 2015. [Google Scholar]
- Echavarria, A.P.; Torras, C.; Pagan, J.; Ibarz, A. Fruit juice processing and membrane technology application. Food Eng. Rev. 2011, 3, 136–140. [Google Scholar] [CrossRef]
- Black, H.F.; Bray, R.G., Jr. Sugar Separation Form Juices and Product Thereof. U.S. Patent US5403604A, 4 April 1995. [Google Scholar]
- Lazarides, H.N. Food processing technology in a sustainable food supply chain. Procedia Food Sci. 2011, 1, 1918–1923. [Google Scholar] [CrossRef]
- Kumar, P.; Sharma, N.; Ranjan, R.; Kumar, S.; Bhat, Z.F.; Jeong, D.K. Perspective of membrane technology in dairy industry: A review. Asian-Aust. J. Anim. Sci. 2013, 26, 1347–1358. [Google Scholar] [CrossRef] [PubMed]
- Rabetafika, H.N.; Bchir, B.; Blecker, C.; Richel, A. Fractionation of apple by-products as source of new ingredients: Current situation and perspectives. Trends Food Sci. Technol. 2014, 40, 99–114. [Google Scholar] [CrossRef]
- He, Y.; Ji, Z.; Li, S. Effective clarification of apple juice using membrane filtration without enzyme and pasteurization pretreatment. Sep. Purif. Technol. 2002, 57, 366–373. [Google Scholar] [CrossRef]
- Alvarez, S.; Riera, F.A.; Alvarez, R.; Coca, J.; Cuperus, F.P.; Bouwer, S.T.; Boswinkel, G.; Gemert, R.W.; Veldsink, J.W.; Giorno, L.; et al. A new integrated membrane process for producing clarified apple juice and apple juice aroma concentrate. J. Food Eng. 2000, 46, 109–125. [Google Scholar] [CrossRef]
- Van der Goot, A.J.; Pelgrom, P.J.M.; Berghout, J.A.M.; Geerts, M.E.J.; Jankowiak, L.; Hardt, N.A.; Boom, R.M. Concepts for further sustainable production of foods. J. Food Eng. 2016, 168, 42–51. [Google Scholar] [CrossRef]
- Van der Sluis, A.A.; Dekker, M.; Skrede, G.; Jongen, W.M.F. Activity and concentration of polyphenolic antioxidants in apple juice. 1. Effect of existing production methods. J. Agric. Food Chem. 2002, 50, 7211–7219. [Google Scholar] [CrossRef] [PubMed]
- Wilson, T. Cranberry juice effects on health. In Beverages in Nutrition and Health. Nutrition and Health; Wilson, T., Temple, N.J., Eds.; Humana Press: Totowa, NJ, USA, 2004. [Google Scholar]
- McKay, D.L.; Chen, C.Y.; Zampariello, C.A.; Blumberg, J.B. Flavonoids and phenolic acids from cranberry juice are bioavailable and bioactive in healthy older adults. Food Chem. 2015, 168, 233–240. [Google Scholar] [CrossRef] [PubMed]
- Slinkard, K.; Singleton, V.L. Total phenol analysis: Automation and comparison with manual methods. Am. J. Enol. Vitic. 1977, 28, 49–55. [Google Scholar]
- Song, T.T.; Hendrich, S.; Murphy, P.A. Estrogenic activity of glycitein, a soy isoflavone. J. Agric. Food Chem. 1999, 47, 1607–1610. [Google Scholar] [CrossRef] [PubMed]
- Wei, D.S.; Hossain, M.; Saleh, Z.S. Separation of polyphenolics and sugar by ultrafiltration: Effects of operating conditions on fouling and diafiltration. Int. J. Biol. Biomol. Agric. Food Biotechnol. Eng. 2007, 1, 115–122. [Google Scholar]
- Jolliffe, I.T.; Cadima, J. Principal component analysis: a review and recent developments. Philos. Trans. R. Soc. A 2016, 374, 20150202. [Google Scholar] [CrossRef] [PubMed]
- Ward, J.H. Hierarchical grouping to optimize an objective function. J. Am. Stat. Assoc. 1963, 58, 236–244. [Google Scholar] [CrossRef]
- Bruijn, J.; Borquez, R. Analysis of the fouling mechanisms during cross-flow ultrafiltration of apple juice. LWT Food Sci. Technol. 2006, 39, 861–871. [Google Scholar] [CrossRef]
- Bruijn, J.; Venegas, A.; Borquez, R. Influence of crossflow ultrafiltration on membrane fouling and apple juice quality. Desalination 2002, 148, 131–136. [Google Scholar] [CrossRef]
- Yazdanshenas, M.; Tabatabaeenezhad, A.R.; Roostaazad, R.; Khoshfetrat, A.B. Full scale analysis of apple juice ultrafiltration and optimization of diafiltration. Sep. Purif. Technol. 2005, 47, 52–57. [Google Scholar] [CrossRef]
- Carrin, M.E.; Buglione, M.B.; Lozano, J.E. Removal of dark compounds from fruit juices by membrane separation. In Proceedings of the European Congress of Chemical Engineering, Copenhagen, Danmark, 16–20 September 2007. [Google Scholar]
- Yi, J.; Kebede, B.; Kristiani, K.; Buvé, C.; Van Loey, A.; Grauwet, T.; Hendrickx, M. The potential of kiwifruit puree as a clean label ingredient to stabilize high pressure pasteurized cloudy apple juice during storage. Food Chem. 2018, 255, 197–208. [Google Scholar] [CrossRef] [PubMed]
- Bocharova, O.; Bocharova, M. The dual role of phenolic compounds in oxidative changes in fruit products. Int. Food Res. J. 2017, 24, 1261–1269. [Google Scholar]
- Jha, S.N.; Gunasekaran, S. Authentications of sweetness of mango juice using Fourier transform infrared-attenuated total reflection spectroscopy. J. Food Eng. 2010, 101, 337–342. [Google Scholar] [CrossRef]
- Krasnova. Application of Different Anti-Browning Agents in Order to Preserve the Quality of Apple Slices; FAO: Rome, Italy, 2017. [Google Scholar]
- Mangas, J.J.; Suárez, B.; Picinelli, A.; Moreno, J.; Blanco, D. Differentiation by phenolic profile of apple juices prepared according to two membrane techniques. J. Agric. Food Chem. 1997, 45, 4777–4784. [Google Scholar] [CrossRef]
- Conidi, C.; Destani, F.; Cassano, A. Performance of hollow fiber ultrafiltration membranes in the clarification of blood orange juice beverages. Beverages 2015, 1, 341–353. [Google Scholar] [CrossRef]
- Onsekizoglu, P.; Bahceci, K.S.; Acar, M.J. Clarification and the concentration of apple juice using membrane processes: A comparative quality assessment. J. Membr. Sci. 2010, 352, 160–165. [Google Scholar] [CrossRef]
- Massini, L.; Rico, D.; Martín-Diana, A.B.; Barry-Ryan, C. Quality markers of functional tomato juice with added apple phenolic antioxidants. Beverages 2016, 2, 4. [Google Scholar] [CrossRef]
- Krasnova, I.; Aboltins, A.; Seglina, D.; Karklina, D.; Suraka, V. Changes of vitamin C and polyphenols during the storage time in minimally processed pear salads with various anti-browning additions. In The 6th International CIGR Technical Symposium, Toward a Sustainable Food Chain-Food Process, Bioprocessing & Food Quality Management; Nantes: Oniris, France, 2011; pp. 118–121. [Google Scholar]
- Leopold, L.F.; Leopold, N.; Diehl, H.A.; Socaciu, C. Quantification of carbohydrates in fruit juices using FTIR spectroscopy and multivariate analysis. Spectroscopy 2011, 26, 93–104. [Google Scholar] [CrossRef]
- Vardin, H.; Tay, A.; Ozen, B.; Mauer, L. Authentication of pomegranate juice concentrate using FTIR spectroscopy and chemometrics. Food Chem. 2008, 108, 742–748. [Google Scholar] [CrossRef] [PubMed]
- Kulkarni, A.P.; Aradhya, S.M.; Divakar, S. Isolation and identification of a radical scavenging antioxidant–punicalagin from pith and carpellary membrane of pomegranate fruit. Food Chem. 2004, 87, 551–557. [Google Scholar] [CrossRef]
- Kluczyk, D.; Matwijczuk, A.; Górecki, A.; Karpińska, M.M.; Szymanek, M.; Niewiadomy, A.; Gagoś, M. Molecular Organization of Dipalmitoylphosphatidylcholine Bilayers Containing Bioactive Compounds 4-(5-heptyl-1,3,4-thiadiazol-2-yl) benzene-1,3-diol and 4-(5-methyl-1,3,4-thiadiazol-2-yl) benzene-1,3-diols. J. Phys. Chem. B 2016, 120, 12047–12063. [Google Scholar] [CrossRef] [PubMed]
- Mauer, L.J.; Chernyshova, A.A.; Hiatt, A.; Deering, A.; Davis, R. Melamine detection in infant formula powder using near-and mid-infrared spectroscopy. J. Agric. Food Chem. 2009, 57, 3974–3980. [Google Scholar] [CrossRef] [PubMed]
- Anguebes, F.; Pat, L.; Ali, B.; Guerrero, A.; Córdova, A.V.; Abatal, M.; Garduza, J. Application of multivariable analysis and FTIR-ATR spectroscopy to the prediction of properties in campeche honey. J. Anal. Methods Chem. 2016, 1, 1–14. [Google Scholar] [CrossRef] [PubMed]
- Saha, N.K.; Balakrishnan, M.; Ulbricht, M. Sugarcane juice ultrafiltration: FTIR and SEM analysis of polysaccharide fouling. J. Membr. Sci. 2007, 306, 287–297. [Google Scholar] [CrossRef]
- Riedl, K.; Girard, B.; Lencki, R.W. Influence of membrane structure on fouling layer morphology during apple juice clarification. J. Membr. Sci. 1998, 139, 155–166. [Google Scholar] [CrossRef]
- Cassano, A.; Conidi, C.; Ruby-Figueroa, R.; Castro-Muñoz, R. Nanofiltration and tight ultrafiltration membranes for the recovery of polyphenols from agro-food by-products. Int. J. Mol. Sci. 2018, 19, 351. [Google Scholar] [CrossRef] [PubMed]
- Conidi, C.; Cassano, A.; Drioli, E. Recovery of phenolic compounds from orange press liquor by nanofiltration. Food Bioprod. Proc. 2012, 90, 867–874. [Google Scholar] [CrossRef]
- Conidi, C.; Cassano, A.; Drioli, E. A membrane based study for the recovery of polyphenols from bergamot juice. J. Membr. Sci. 2011, 375, 182–190. [Google Scholar] [CrossRef]
- Bower, J.A. Statistical Methods for Food Science: Introductory Procedures for the Food Practitioner; Wiley-Blackwell, John Wiley & Sons Ltd.: Chichester, UK, 2009. [Google Scholar]
- Senior, S.; Hamed, E.; Masoud, M.; Shehata, E. Characterisation and dating of blue ballpoint pen inks using principal component analysis of UV-Vis absorption spectra, IR spectroscopy and HPTLC. J. Forensic Sci. 2012, 57, 1087–1093. [Google Scholar] [CrossRef] [PubMed]
© 2018 by the authors. Licensee MDPI, Basel, Switzerland. This article is an open access article distributed under the terms and conditions of the Creative Commons Attribution (CC BY) license (http://creativecommons.org/licenses/by/4.0/).

