1. Introduction
As one of the most popular materials, the concrete block is widely used in the world for its low cost and high bearing capacity. With blocks serving as formwork for grout concrete during construction, masonry structures have the advantages of reducing construction cost and improving construction efficiency. Additionally, reinforced masonry shear walls (RMSWs) exhibit better seismic performance compared to traditional unreinforced masonry structures due to the existence of horizontal and vertical reinforcement, which results in RMSWs being widely applied in mid-rise and high-rise buildings [
1].
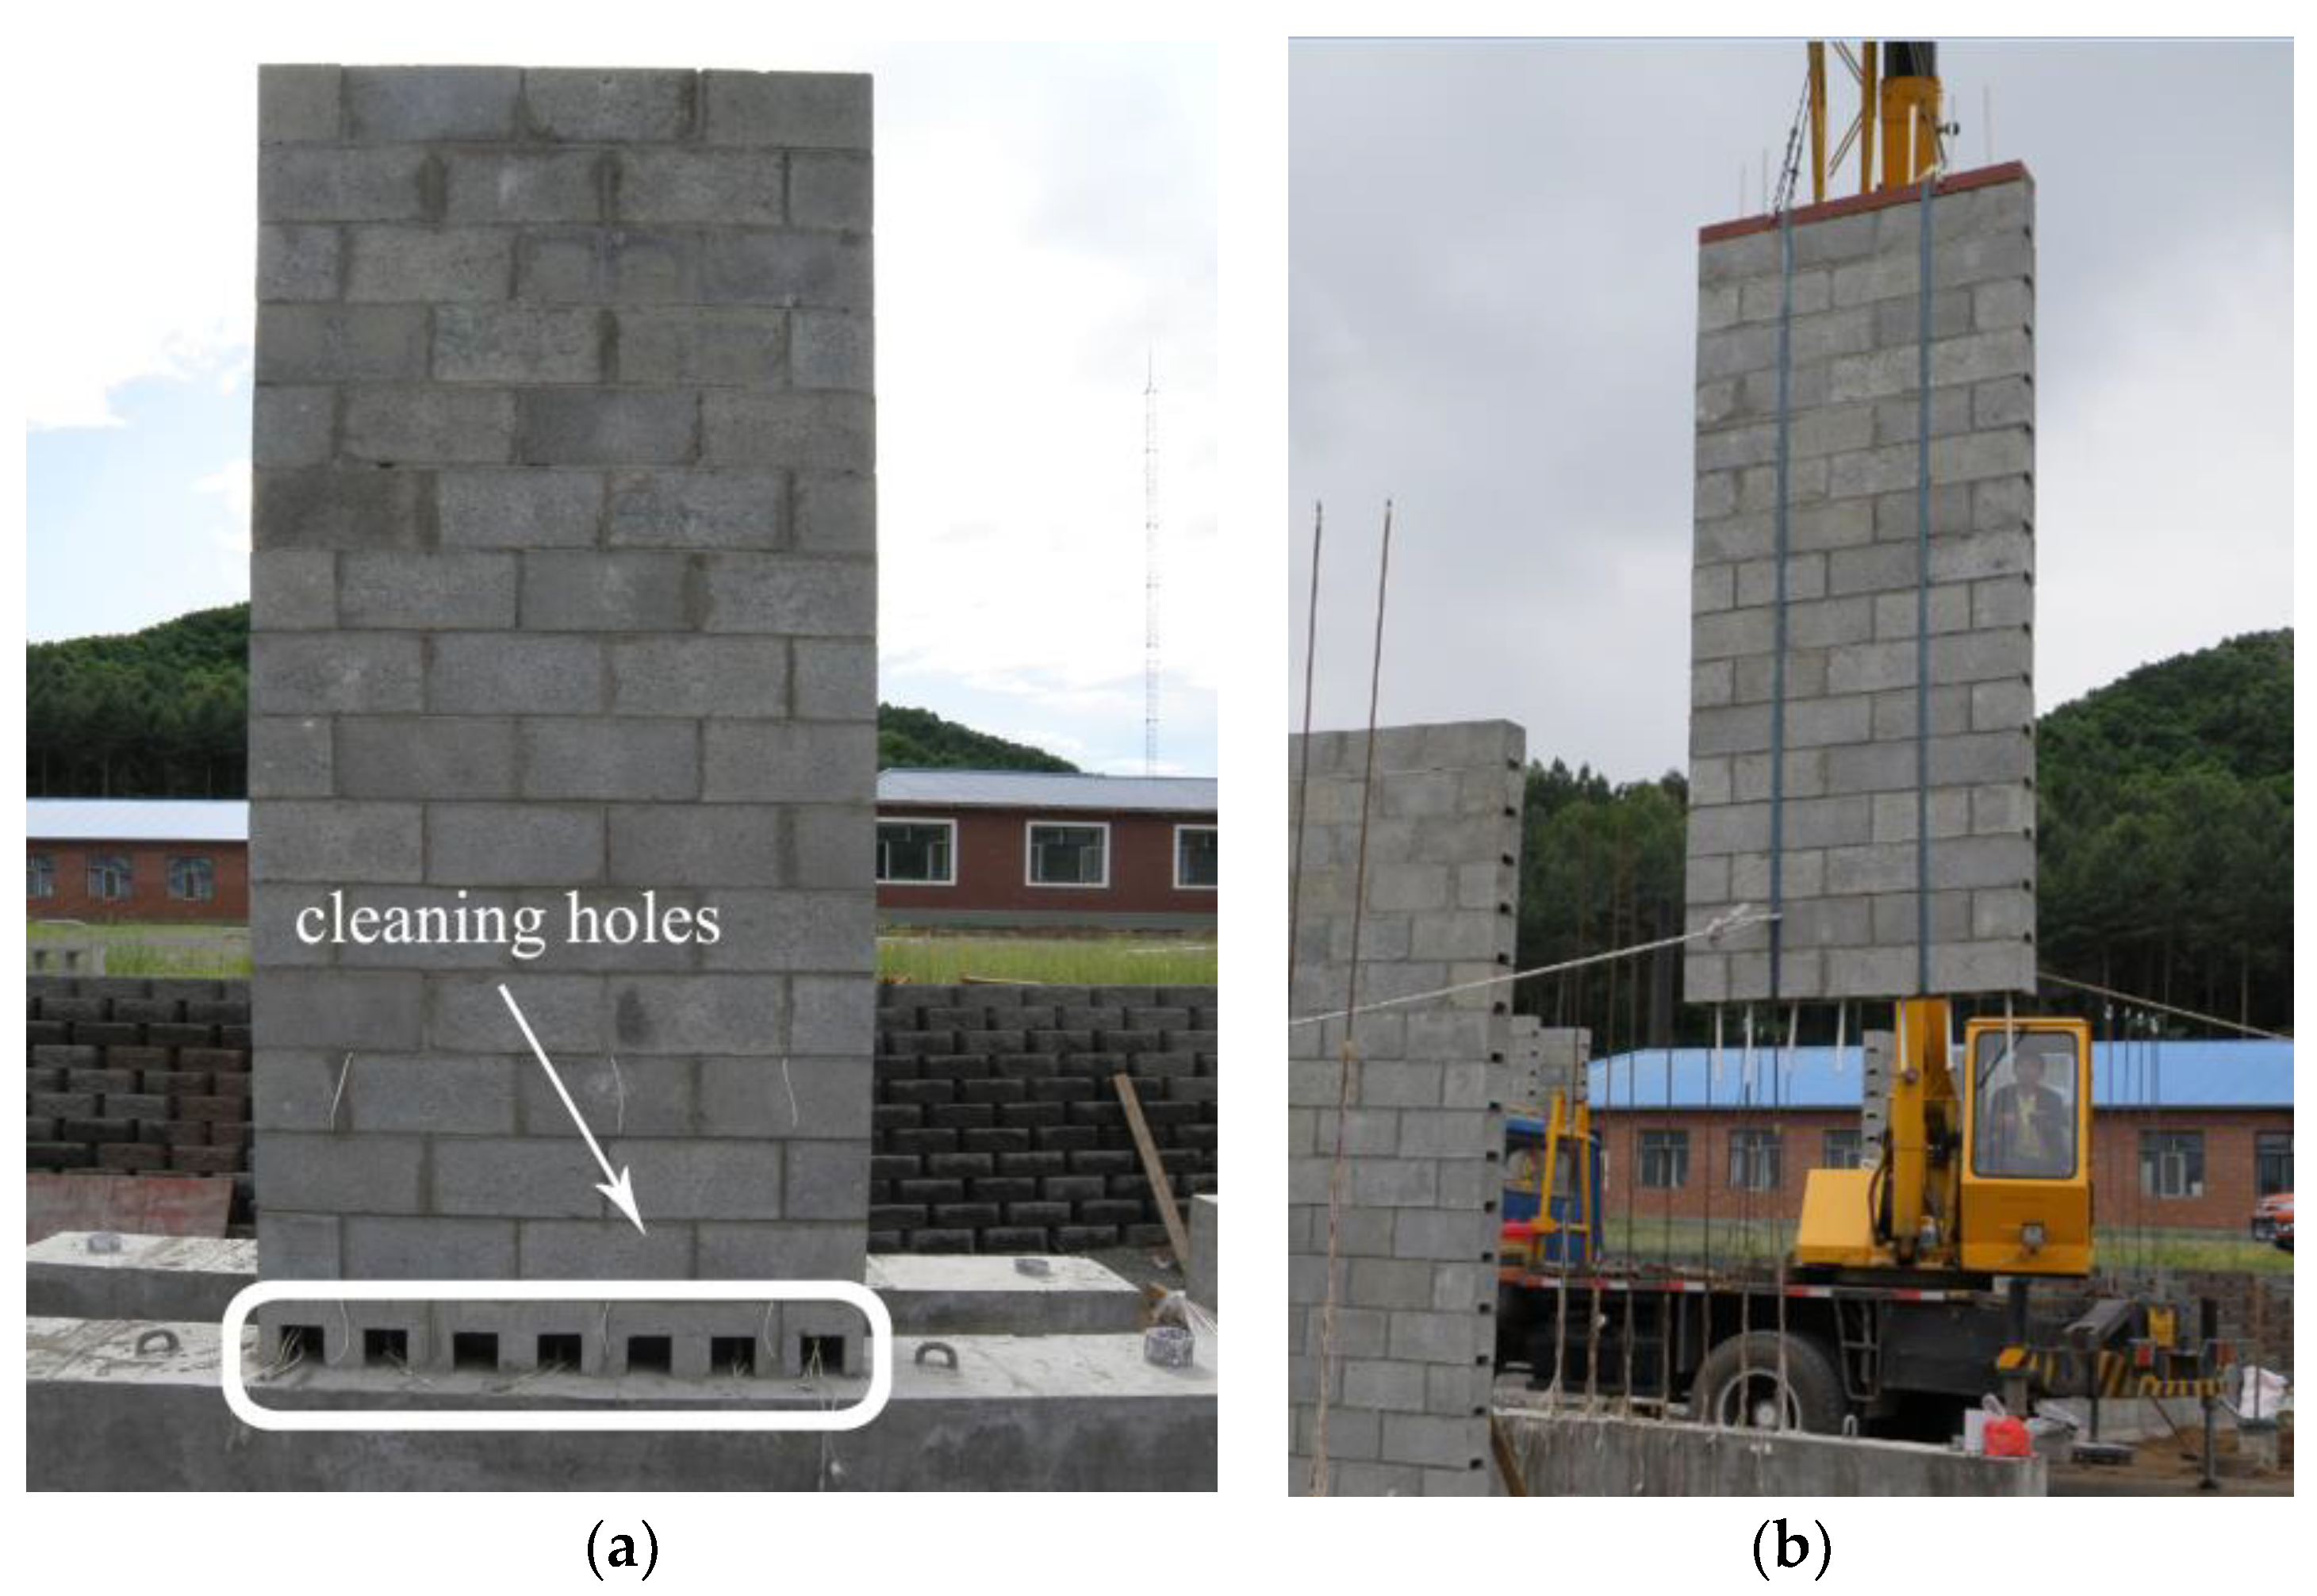
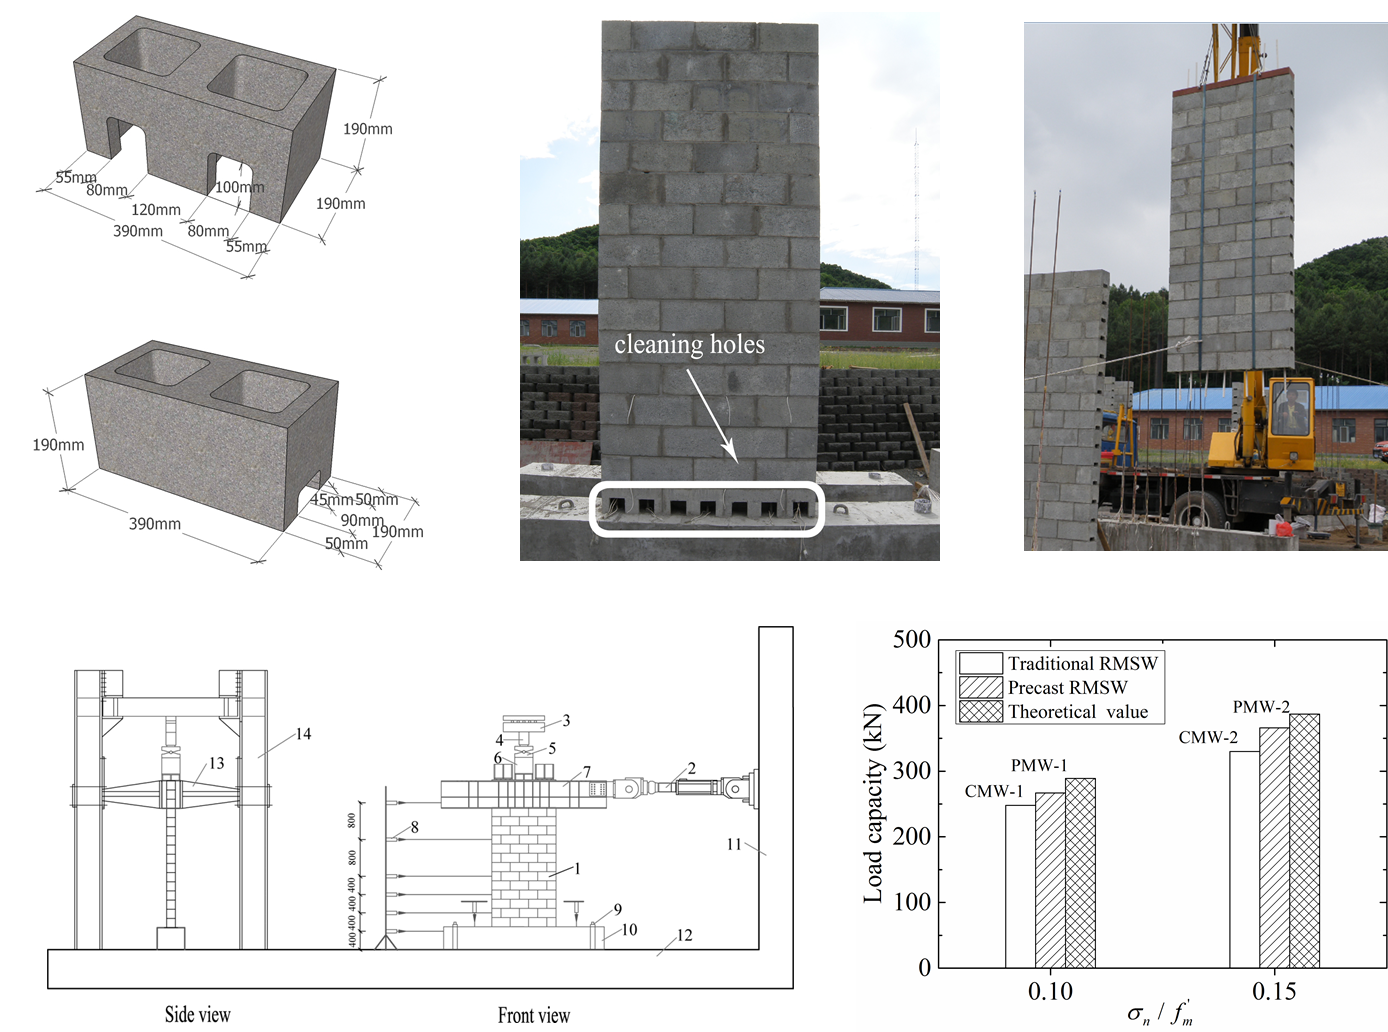
Despite these advantages, it should be noted that traditional RMSWs still have some shortcomings. With respect to traditional construction technology, blocks in the bottom layer of RMSWs must have cleaning holes (see
Figure 1a) for the cleaning of redundant mortar occurring during construction and the following vertical reinforcement connection, which not only causes additional construction procedures and inconvenience of fabrication but also results in reduced integrity and weakened structural performance of masonry structures. In addition, lap splices are commonly applied for the connection of vertical rebars in traditional RMSWs of limited construction space at the cleaning holes. The concentration of lap splices at the bottom layer is not encouraged in structural specifications [
2,
3]. An innovative application of the precast technique in reinforced masonry shear walls can help to solve these problems. The construction of the newly-developed precast RMSW starts first with the fabrication of hollow masonry shear walls in the factory. Second, the hollow walls are fastened and transported to the construction site. Lastly, the fastened hollow wall is lifted up and laid down on the floor. Meanwhile the aligned vertical steel bars fixed on the floor pass through the block cores, as shown in
Figure 1b. After that, the hollow masonry walls are fully grouted with special concrete. In the above construction procedure, original cleaning-hole blocks can be eliminated since the precast technology enables workers to clean redundant mortar and connect vertical steel bars more easily, which leads to the improvement of construction efficiency and structural integrity.
In the literature, lots of theoretical, experimental, and numerical investigations have been conducted to evaluate the seismic performance of the traditional RMSW and the parameters that influence the inelastic behavior of the RMSW, which include the axial compressive stress, the horizontal and vertical reinforcement, and the aspect ratio [
4,
5,
6,
7,
8,
9]. The flexural and shear failure are the two typical failure modes of RMSW under earthquake conditions [
10]. The shear failure is characterized by diagonal cracking. It is generally agreed that this type of failure should be avoided for its relatively brittle behavior [
11,
12,
13]. By contrast, flexural failure, which is characterized by compression crushing of the corner and the tensile yielding of vertical steel bars, is the favored failure mode. Research has shown that the RMSW failed in the flexure exhibited good inelastic deformation and energy dissipation capacity [
14,
15,
16]. However, few studies have been conducted on precast reinforced masonry shear walls. It could be expected that the seismic performance of precast RMSWs is comparable to traditional RMSWs. The precast RMSWs have the potential of being applied in buildings in seismic areas.
Therefore, in this study, a research program was conducted to investigate the seismic performance of newly-developed precast reinforced masonry shear walls. Two traditional and two precast RMSWs were designed and failure-tested under lateral cyclic loading. The failure mode, hysteretic curves, stiffness degradation, displacement ductility, and energy dissipation capability of the test walls were evaluated. This paper aims to promote theoretical research on the seismic performance of the precast RMSW.
2. Experimental Program
In the experiment, two traditional and two precast full-scale fully grouted rectangular RMSWs with different axial compression ratios were tested under the combined action of constant axial load and in-plane lateral reversed cyclic load. The following sections provide details of specimen design, the mechanical properties of building materials, test setup, instrumentation, and loading procedure.
2.1. Specimen Design and Construction
The specimen design considered the laboratory conditions and the possibility to achieve flexure dominated behavior. Based on the Chinese Code GB 50003-2011 [
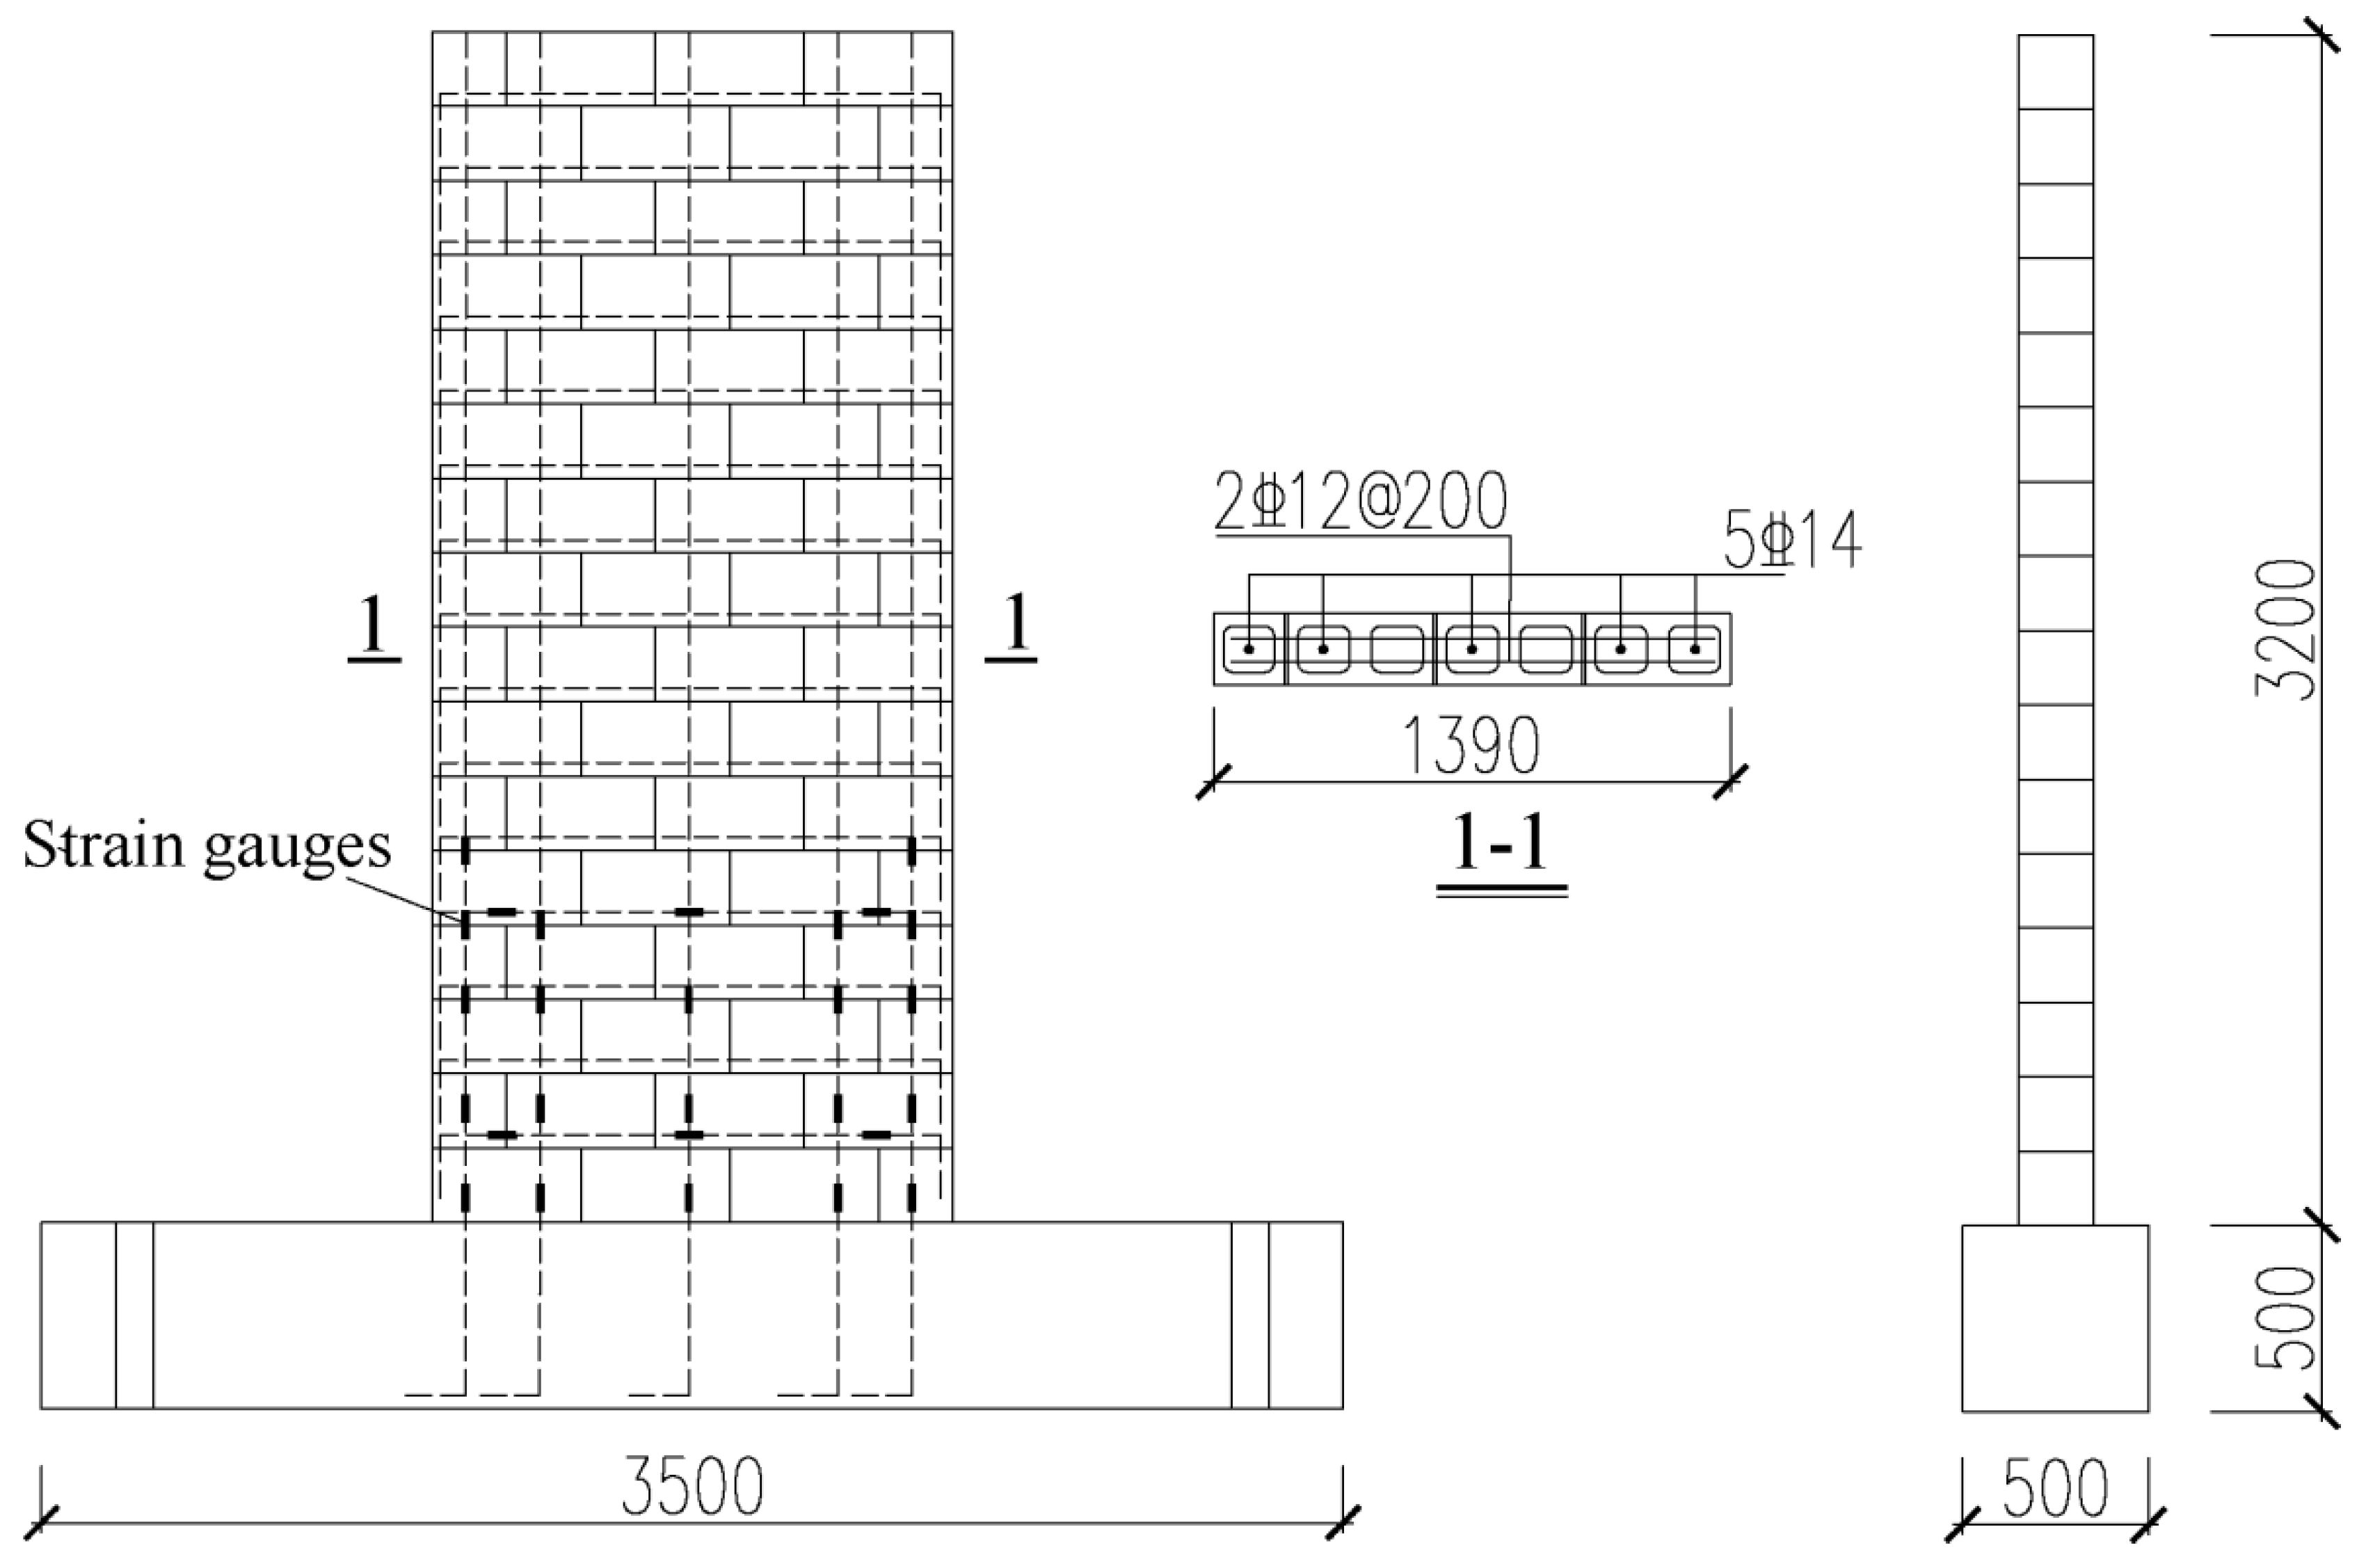
3], the test walls were designed and the ratio between the theoretical shear strength and theoretical flexural strength was approximately 1.8. Therefore, for all the specimens, ductile flexure controlled the strength of the wall and the brittle shear failure mode was prevented. Consequently, all four walls had a high aspect ratio and the same configuration, which was 1390 mm × 3200 mm × 190 mm (length × height × thickness). It should be noted that the two courses at the top of each specimen were used for load transfer only. Therefore, the effective wall height was 2800 mm and the corresponding aspect ratio was 2 for all specimens. The test walls were denoted as CMW-1, CMW-2, PMW-1, and PMW-2, respectively. CMW denoted the masonry walls constructed in traditional technology and PMW denoted the precast masonry walls. The number behind CMW and PMW indicated the axial compression ratio of each specimen. Details of the specimens are shown in
Table 1 and
Figure 2. The reinforcement of all the traditional and precast walls was identical except that the vertical rebar of the precast walls extended to the full height of the wall while lap joints were used for the vertical steel connections at the bottom region of the traditional RMSWs through cleaning holes. The vertical reinforcement was with five steel bars of diameter 14 mm which were placed at each of the two side cells and the middle cell of the specimen, as shown in
Figure 3a. The horizontal reinforcement was with two steel bars of diameter 12 mm and a spacing of 200 mm, as shown in
Figure 3b. The reinforcement of the specimens was selected according to the Chinese Code GB 50003-2011 [
3] to ensure the designed flexural failure of the specimens. The horizontal and vertical reinforcement ratios of all walls were 0.60% and 0.29%, which satisfies the minimum ratios of the reinforcement in RMSWs.
Two criteria for determining the foundation beam size and material are to assure sufficient strength to avoid cracking of the beam during testing and to provide sufficient anchorage length for vertical reinforcement of the specimen.
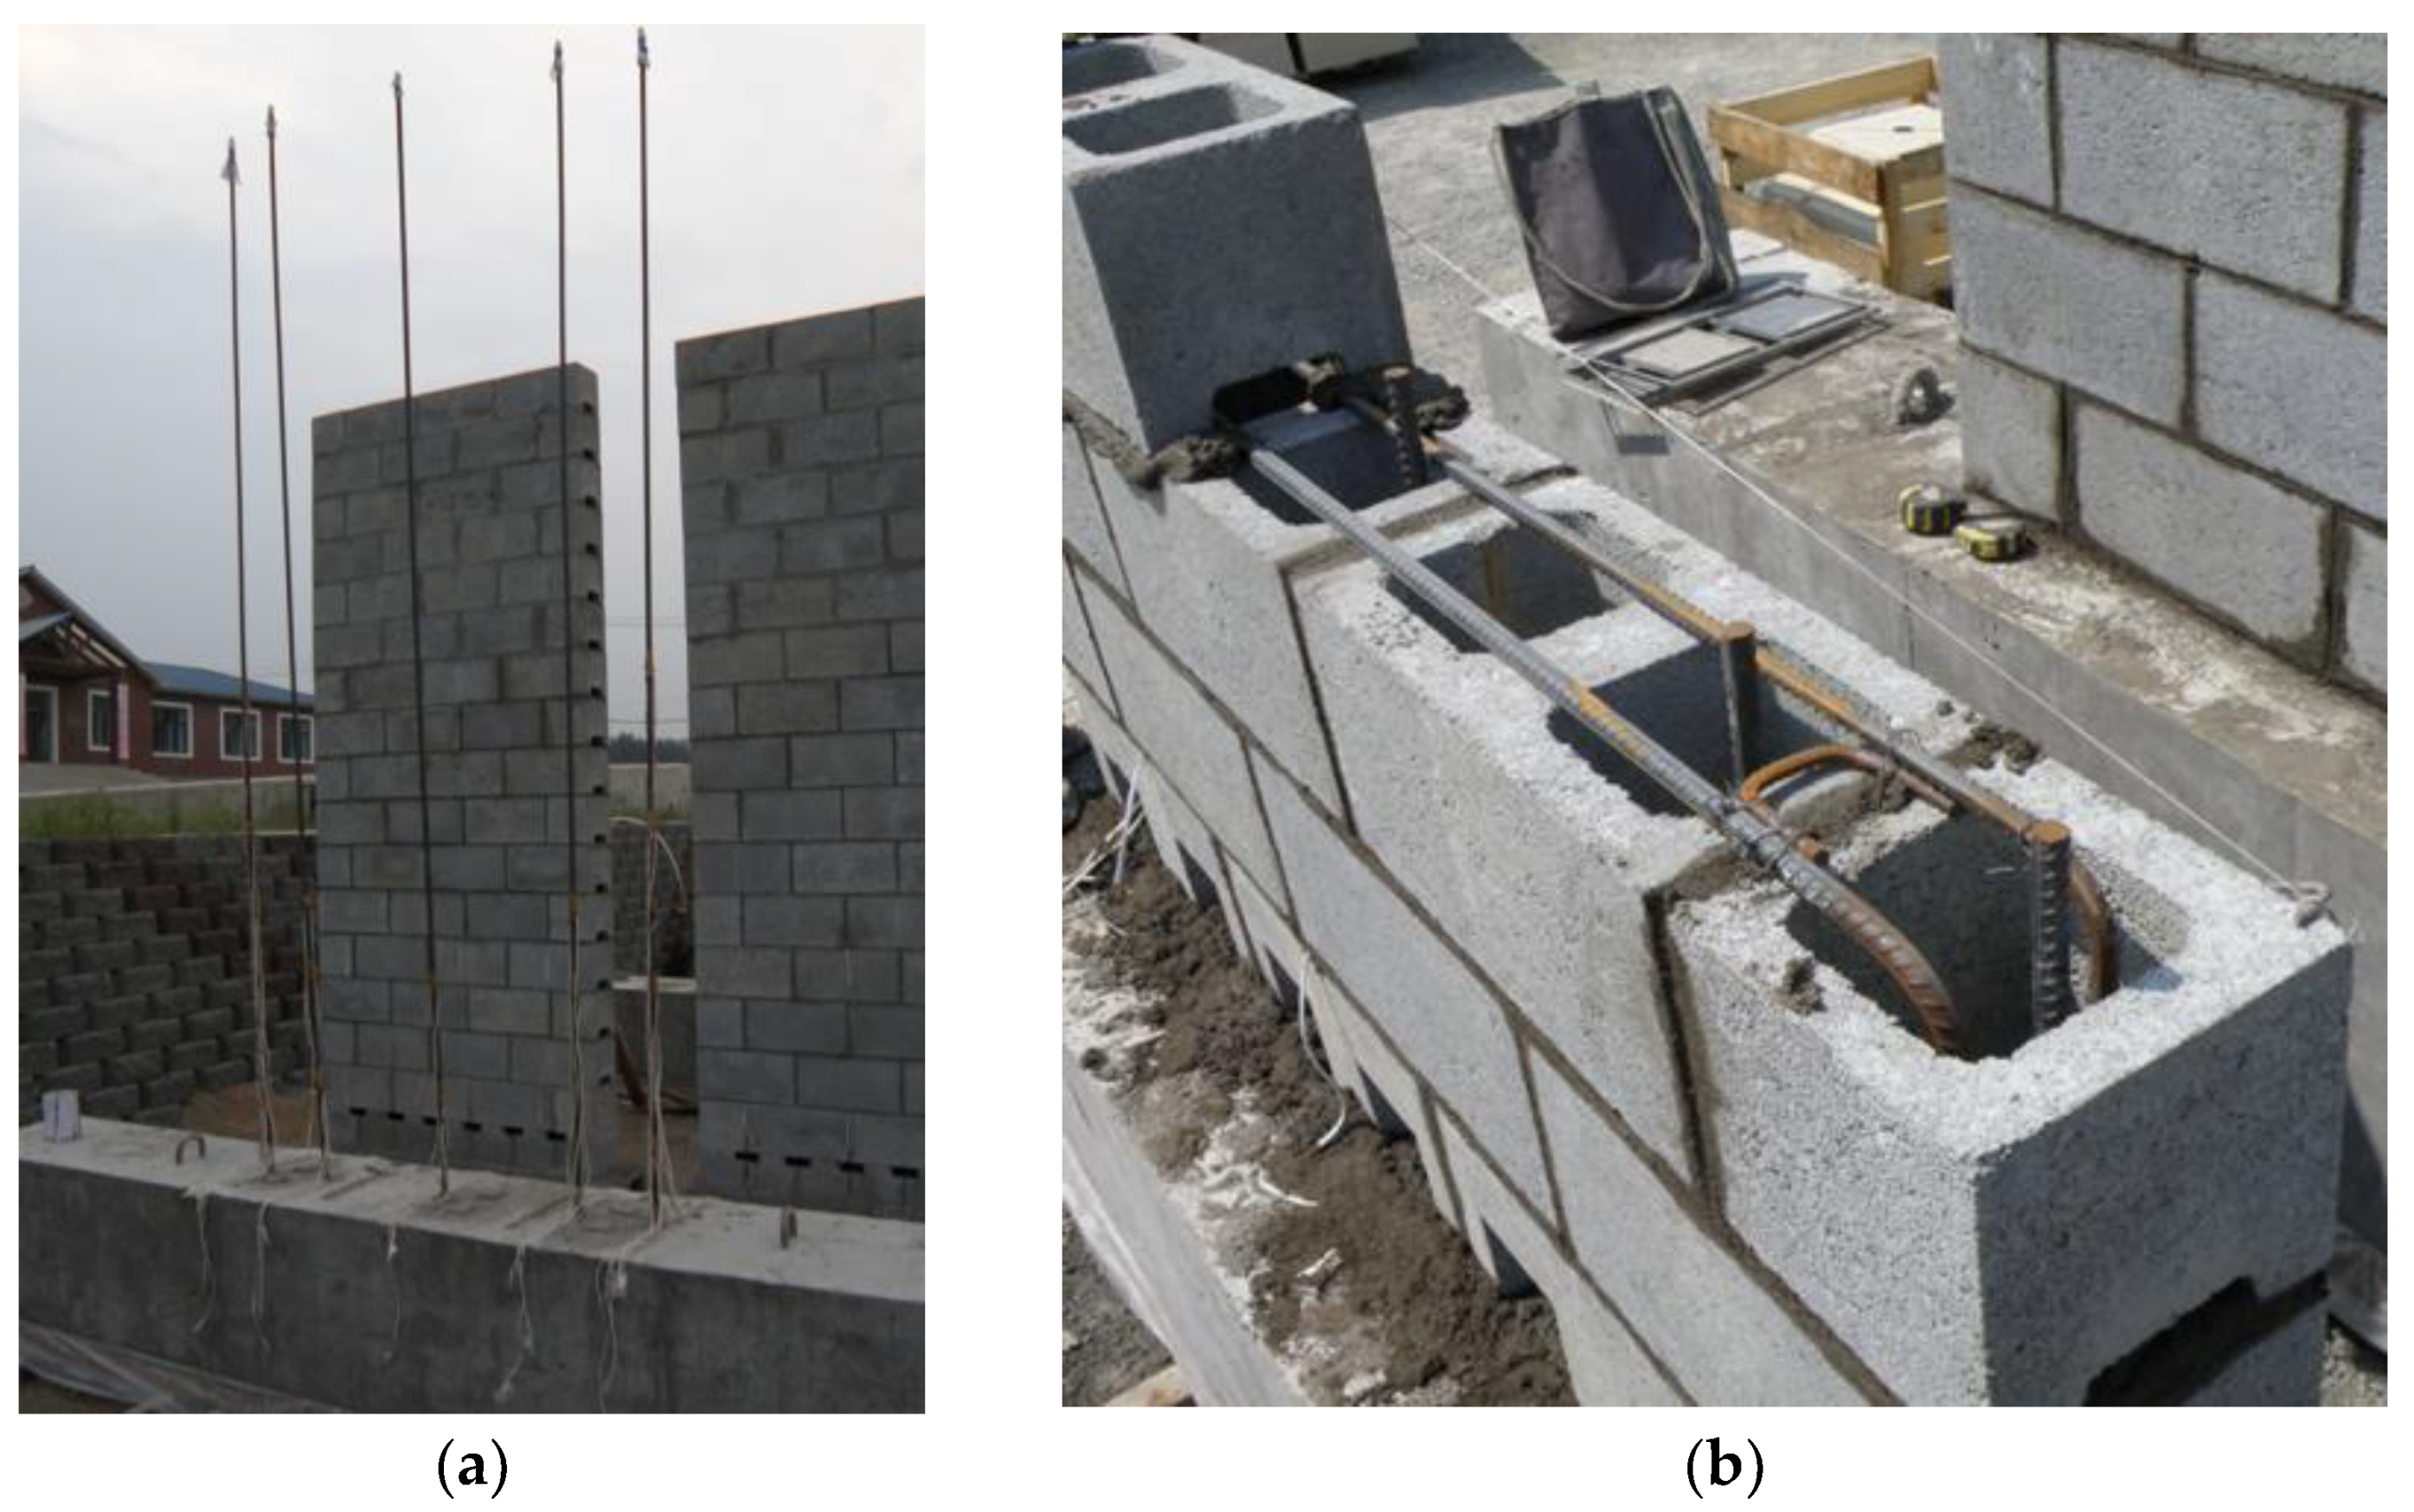
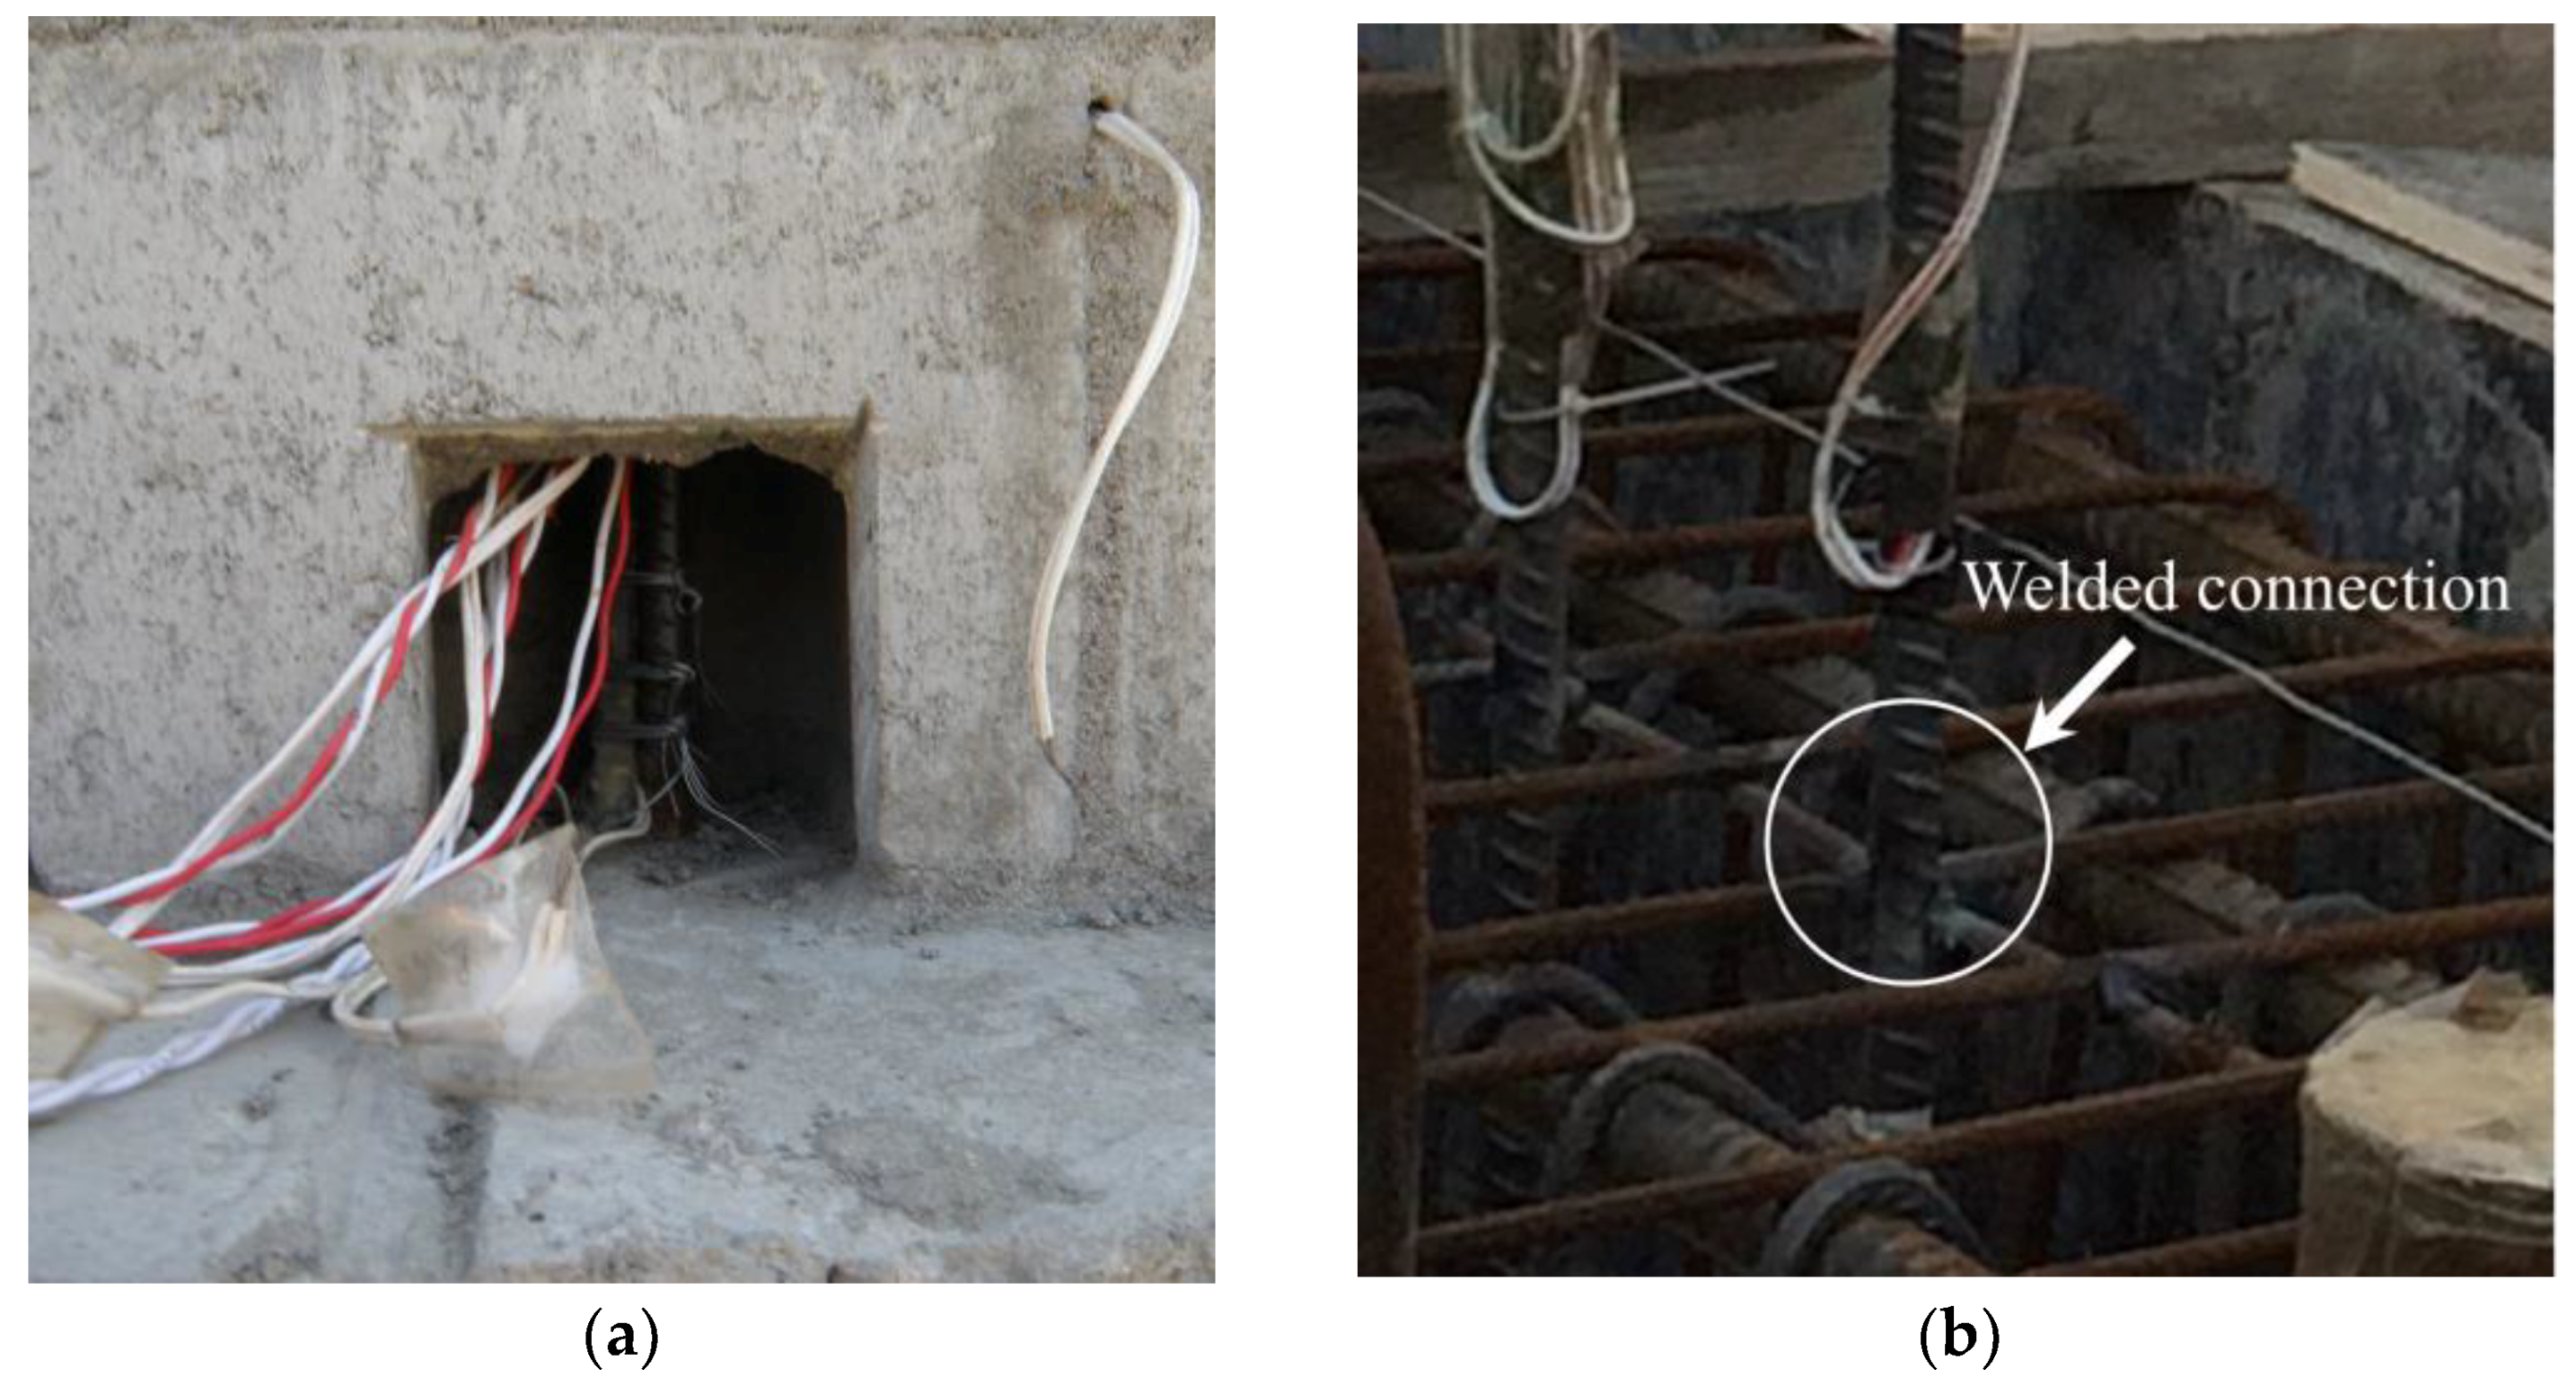
A series of standard two-cell hollow concrete masonry blocks, which are widely used in China, was selected for the construction. The traditional walls were fabricated using both the cleaning-hole blocks and the normal blocks on the foundation beams by two experienced masons under supervision. The redundant mortar was cleared through the cleaning holes at the bottom layer during the fabrication of the hollow masonry wall. Then the vertical steel bars were placed through the cell from the top of the wall to the bottom region and were fixed with the vertical bars extended above the foundation beam by lap joints (see
Figure 4a) through the cleaning holes.
Furthermore, the precast hollow masonry walls were constructed only using the normal full and half blocks by the same masons at special foundations. Considering three days as the hardening time of mortar, the hollow walls were fastened, lifted by a crane, and placed on the foundation beam with prepositioned mortar. The hollow walls were passed through by aligned vertical steel bars, which were fixed on the beam by a welded connection (see
Figure 4b) and extended above the footing to the full height of the wall. After that, all traditional and precast walls were fully grouted with the same concrete with an initial slump of 200 mm and were cured under the appropriate environmental conditions.
2.2. Material Properties
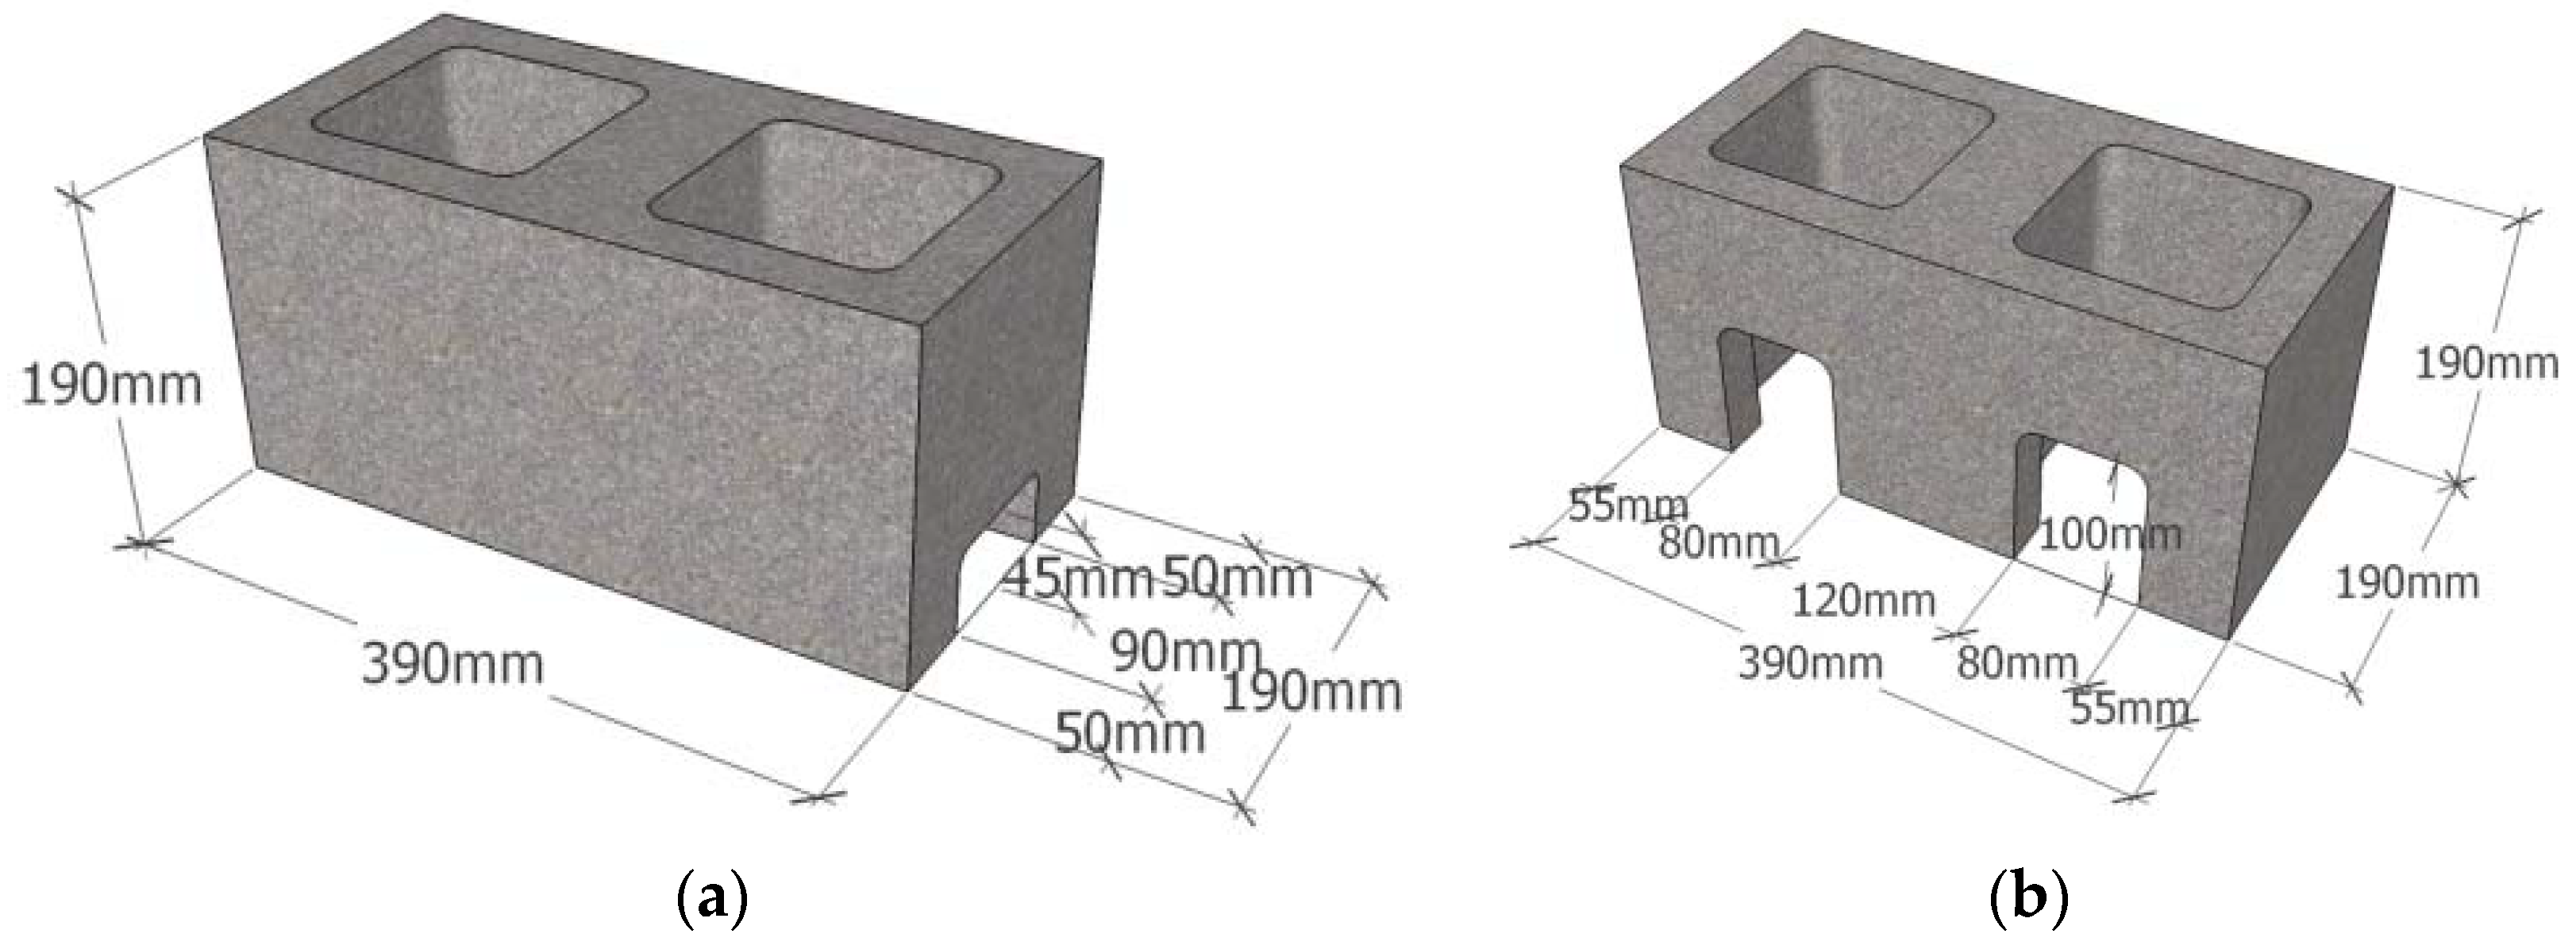
The dimensions of the full and half blocks used in this study were 390 mm × 190 mm × 190 mm and 190 mm × 190 mm × 190 mm, respectively. The details of the normal blocks and cleaning-hole blocks are shown in
Figure 5. The cell ratio of the full units is about 47%. Five full hollow blocks were tested according to Chinese Code GB/T 4111-2013 [
17], and the average compressive strength, based on the gross area of block, was 22.8 MPa.
The mix proportion of the mortar by weight was 1.0:0.6:3.2:2.5 × 10
−4 for cement, water, sand, and chemical additive. Six mortar cubes with side length of 70.7 mm were tested according to the Chinese Code JGJ/T 70-2009 [
18], and the average compressive strength was 21.5 MPa.
The mix proportion of the grouted concrete by weight was 1.0:0.5:2.1:2.5 for cement, water, sand, and coarse aggregate. Based on GB/T 50107-2010 [
19], tests of six concrete cubes with side length of 100 mm were conducted on a press machine with a capacity of 200 kN. The grout concrete had an average compressive strength of 32.2 MPa.
Compressive tests of grouted masonry were conducted according to the Chinese Code GB/T 50129-2011 [
20]. Six 5-block high prisms were tested on a press machine with a capacity of 500 kN, and the compressive strength of the grouted masonry prisms was, on average, 23.1 MPa.
Tensile tests were carried out to analyze the rebar of the specimens. Three samples of each rebar were tested according to Chinese Code GB/T 228-2010 [
21] and the average yield strengths for the horizontal and vertical rebars were 393 MPa and 405 MPa, respectively.
2.3. Test Setup, Instrumentation, and Loading Procedure
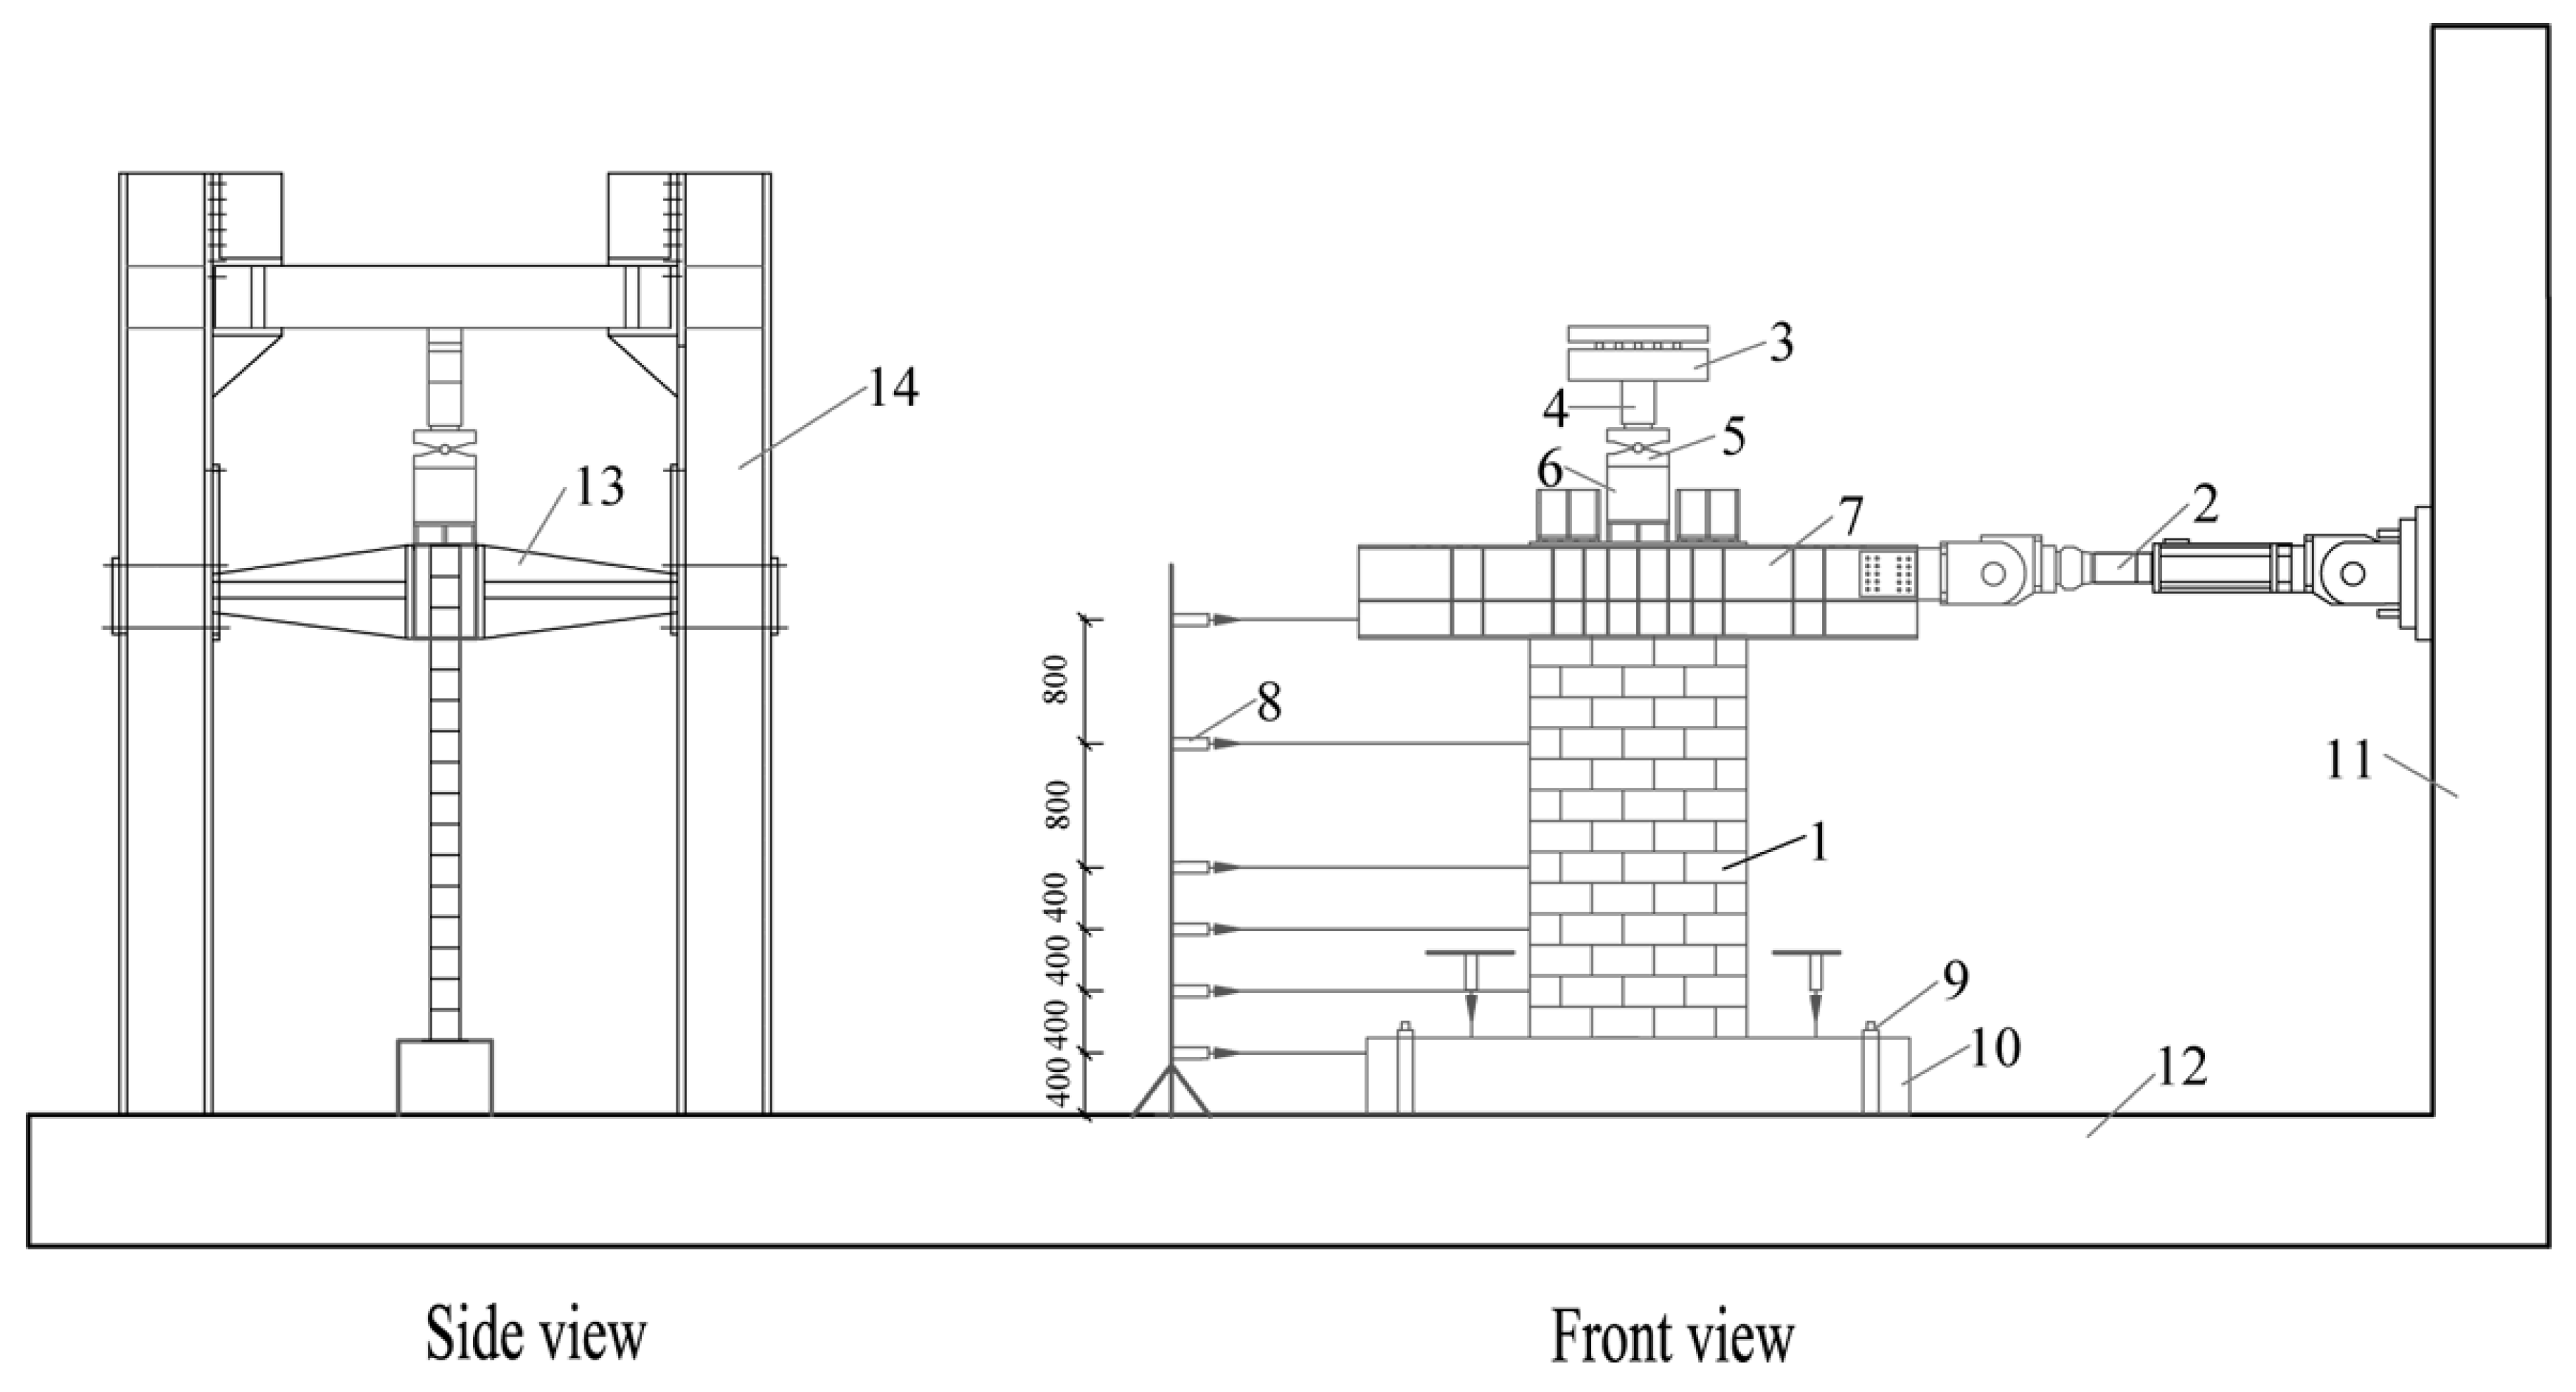
Figure 6 shows the setup of the quasi-static test. The lateral cyclic loading was exerted by a 1000-kN-capacity MTS hydraulic actuator. A 2000-kN-capacity jack was applied to exert the vertical load on the specimen and a pressure sensor was used to monitor the exporting axial force. A set of steel rollers was used to reduce the friction in the cyclic test and a spherical joint support was utilized to eliminate the extra bending moment produced by axial pressure due to the specimen’s lateral movement. A reusable steel beam was placed at the top of each specimen to transfer the axial and horizontal load to the specimen and prevent local compression failure. The bottom reinforced concrete beam simulated a rigid foundation and was anchored to the laboratory floor to avoid the uplift and slippage of the base. Since the specimen had a high aspect ratio of 2, two parallel lateral bracings were used to avoid the out-of-plane movement and keep the wall stabilized.
The lateral deflection, base slippage, and uplift of the specimens during the test were monitored by a set of eight displacement meters, which is shown in
Figure 6.
Figure 2 illustrates the wall internal instrumentation. The strain gauges were attached to the horizontal and vertical rebars to monitor their contribution to the seismic performance of the specimen and to ensure the yield range of the vertical rebar.
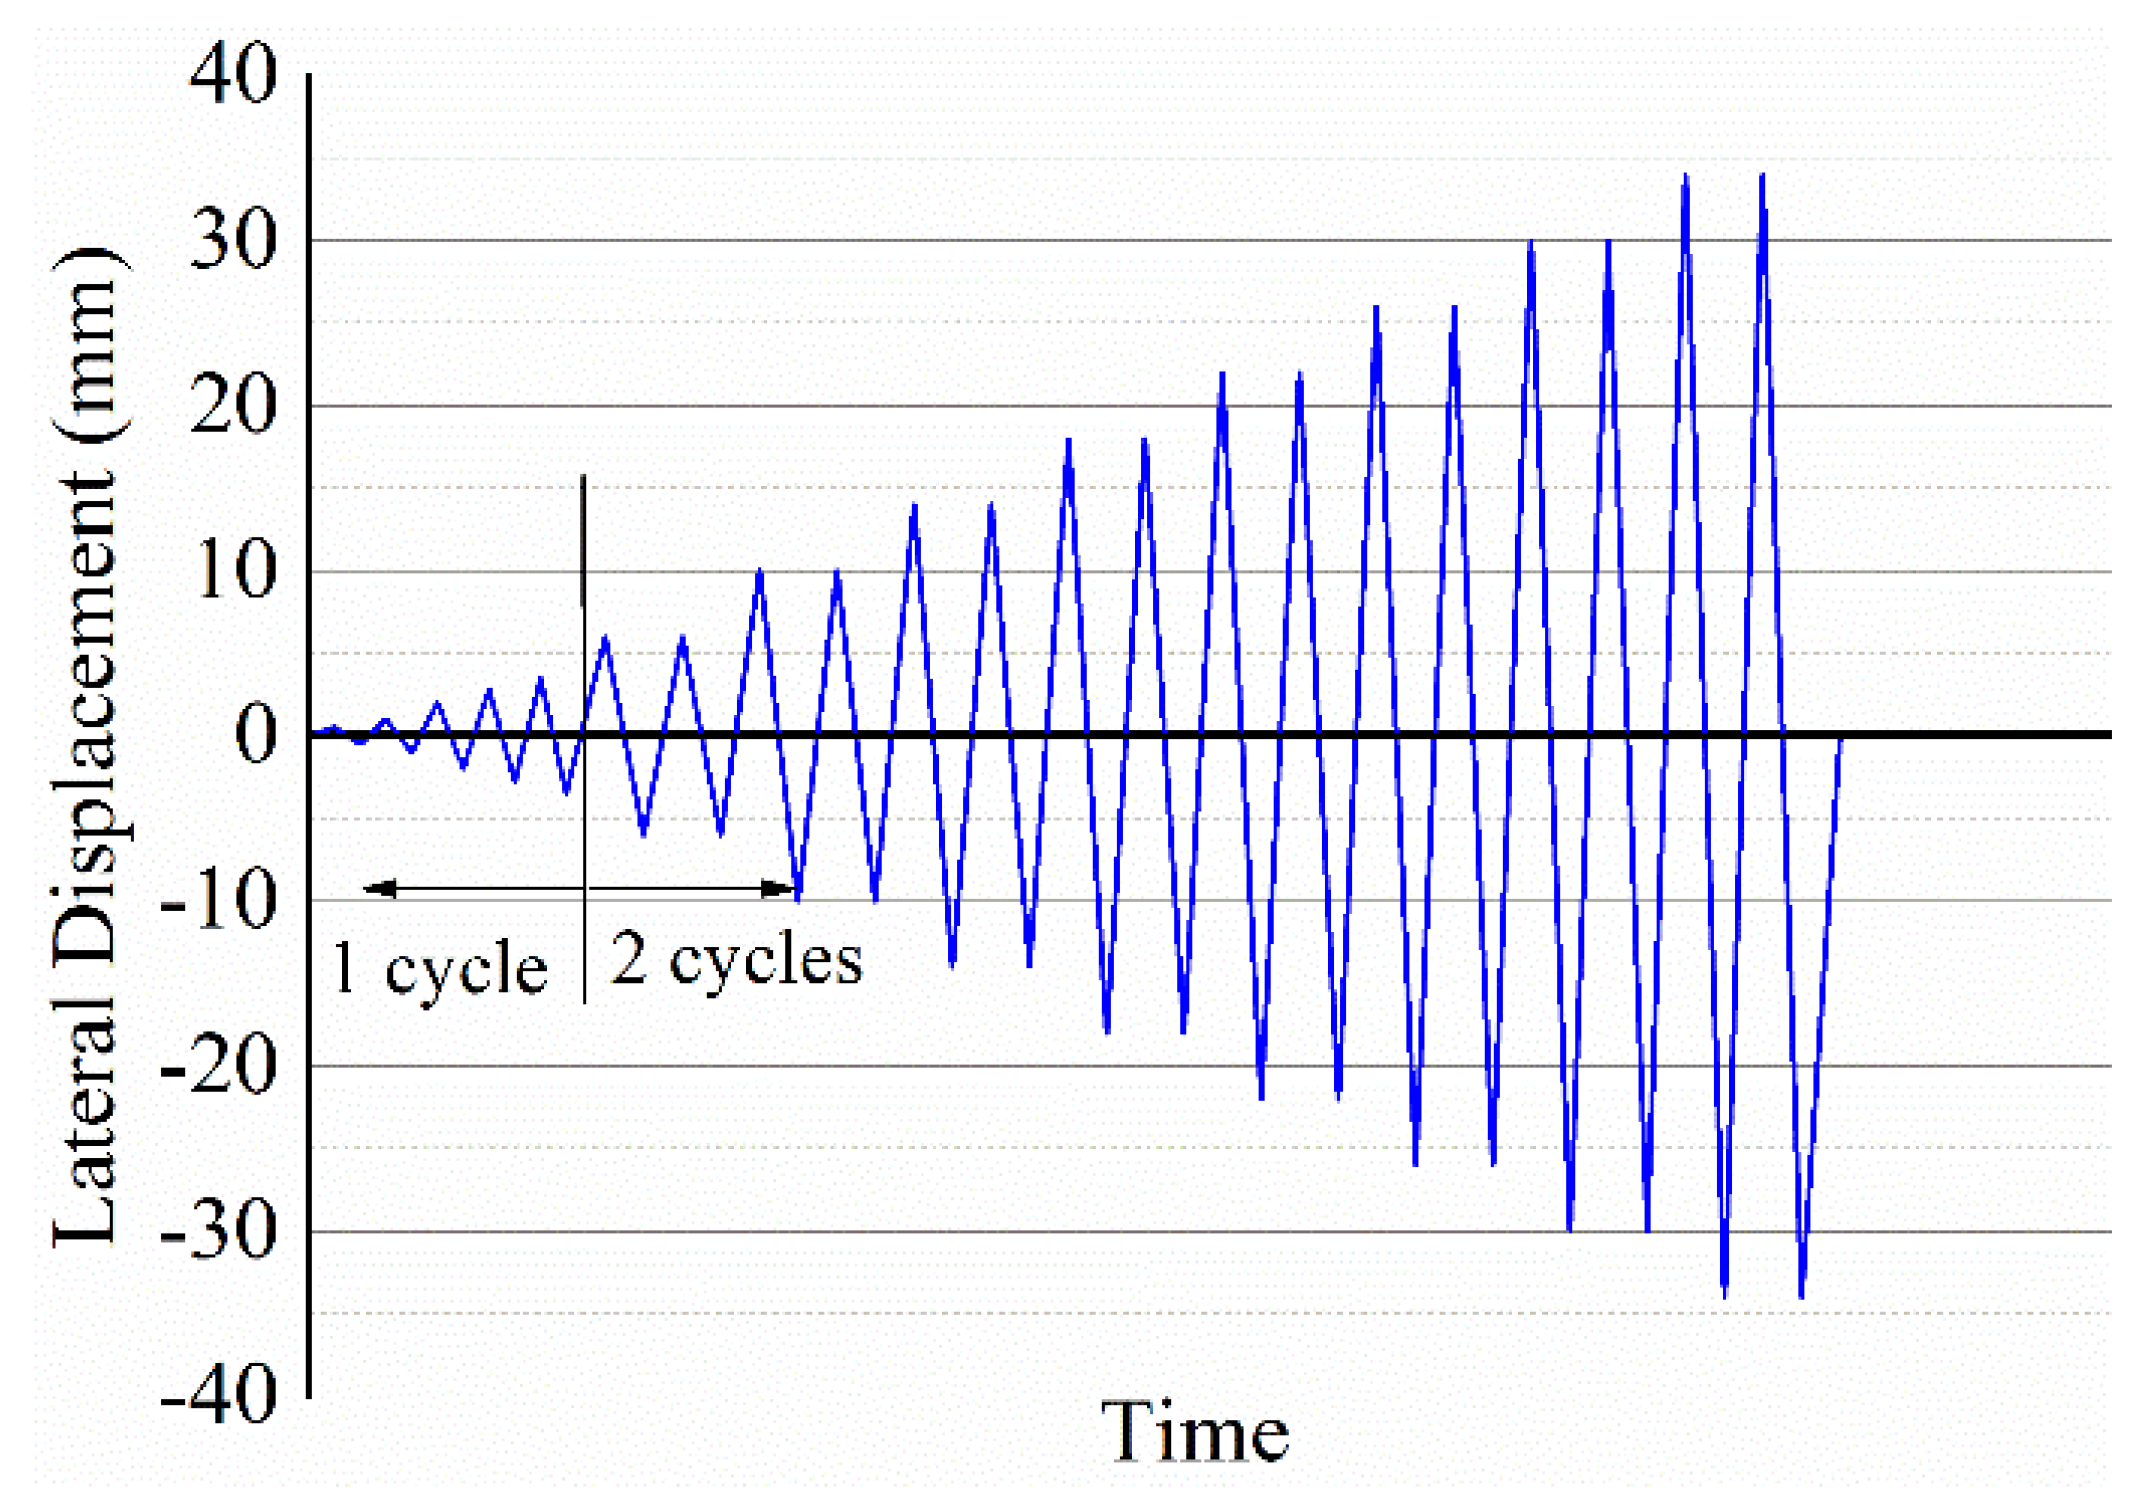
All traditional and precast shear wall specimens were subjected to similar loading histories. The quasi-static tests were carried out under a mixed force and displacement-control loading scheme. First, the target vertical load was exerted to the full amount and a horizontal load, which corresponded to approximately 20% of the predicted cracking load, was applied to the specimen to examine the test setup and the instruments. Second, the specimen was unloaded and reloaded up to the designed axial load. Lateral loading displacements were imposed on the specimens according to the following loading scheme, as shown in
Figure 7.
3. Experimental Results
3.1. Failure Mode
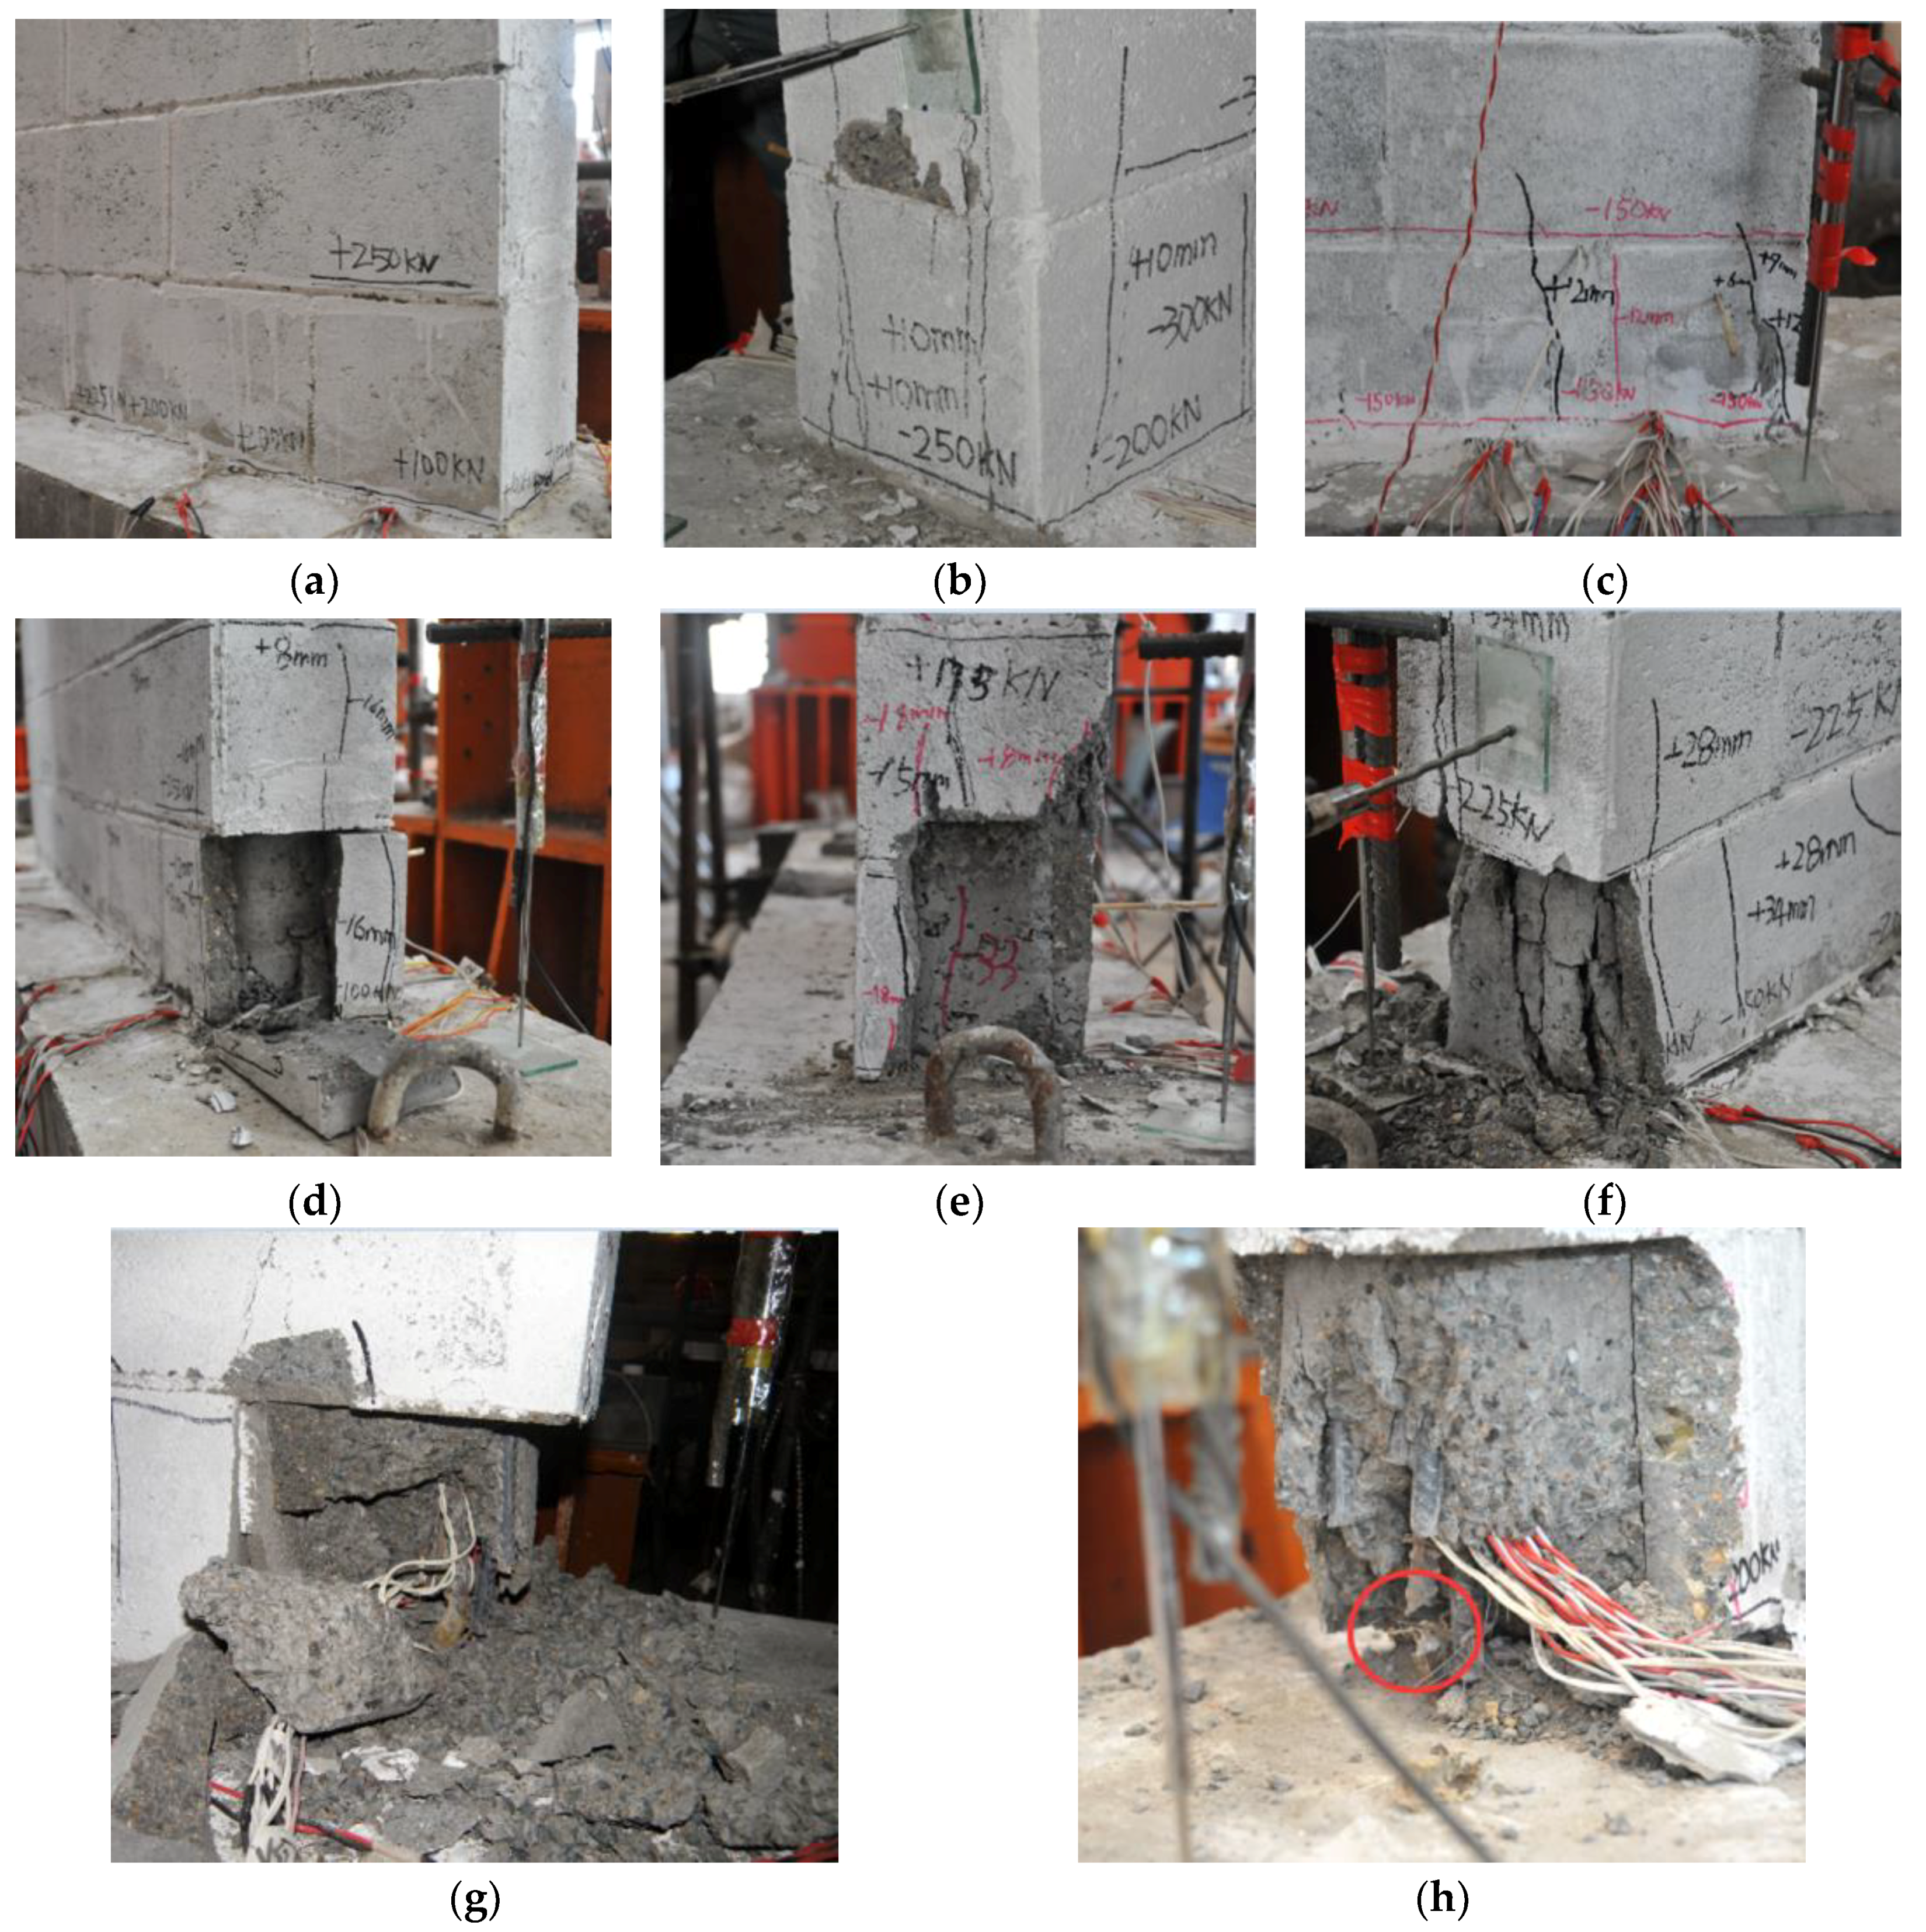
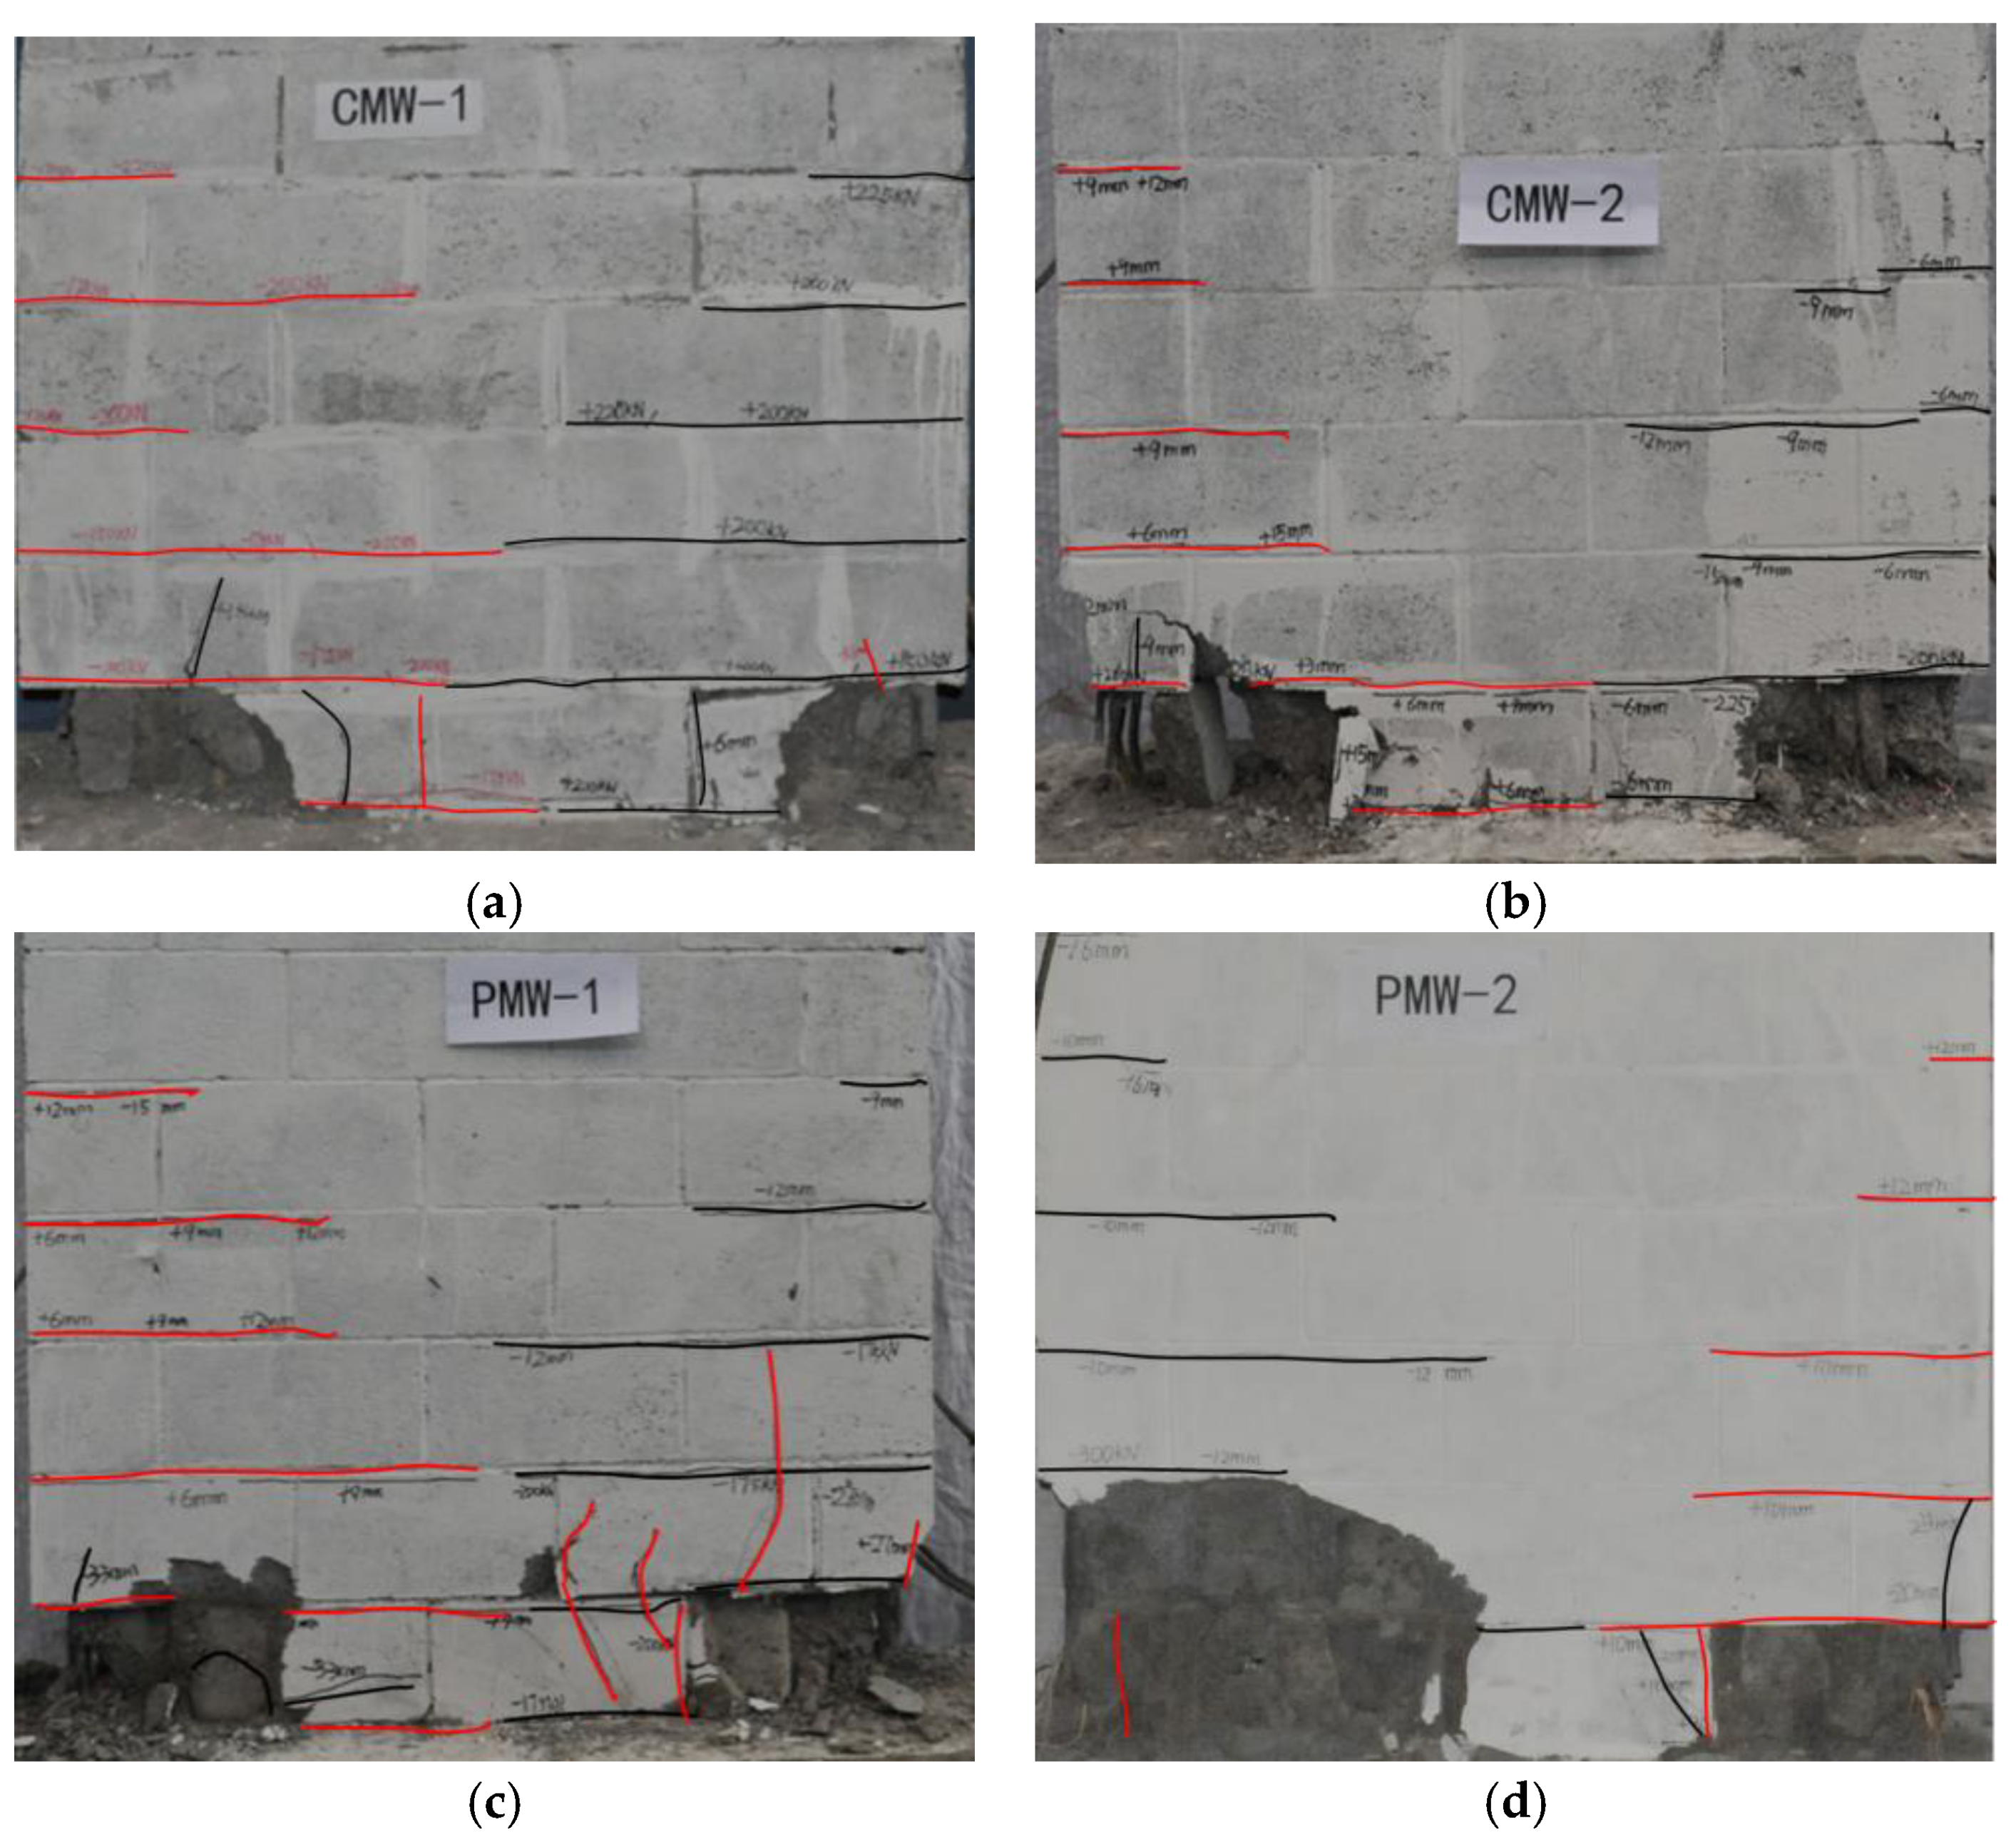
Figure 8 illustrates the cracking patterns of the specimens under cyclic loading. In general, both traditional and precast masonry test walls exhibited a similar typical flexural failure mode even though some differences existed in the damage progression.
During the test, horizontal cracks initially appeared in bed joints at the base of the walls (see
Figure 9a). This damage was due to the tensile bond strength of the block-mortar interfaces being surpassed. As loading continued, the length and width of horizontal cracks tended to increase, which led to the translation of the neutral axis, the reduction of the compression zone depth, and increasing compressive stress [
22]. Furthermore, strains of the vertical rebar developed significantly, which manifested its effective role in bearing the tensile stresses due to flexure.
With the increase of the imposed lateral displacement, vertical splitting cracks formed in blocks at the corner (see
Figure 9b). It should be noted that some vertical cracks initiated along the cleaning hole of the first layer blocks in traditional RMSW (see
Figure 9c). Then the vertical splitting cracks developed quickly and crushed for successive imposed lateral displacement, which resulted in significant damage at the wall toes. The strain gauges showed that the vertical rebar at the sides of the specimen yielded. At this stage, the test walls reached their peak loads. The load capacities of both traditional and precast test walls were governed by the tensile yielding of the vertical rebar and the compressive crushing of the corner. At the post-peak stage, after face shell crushing and spalling (see
Figure 9d), the outermost grout column began to split (see
Figure 9e) and crumble due to increasing compression stress (see
Figure 9f) which coincided with buckling and even rupture of the vertical rebar in the tensile region of the test wall (see
Figure 9g,h).
3.2. Hysteretic Curve
Figure 10 illustrates the load–displacement relationships of each specimen and
Table 2 summarizes the average values of the experimental results including the cracking load (
Fcr) and the corresponding displacement (
Dcr), the peak load (
Fp), and the corresponding displacement (
Dp), as well as the theoretical flexural capacity of the test walls.
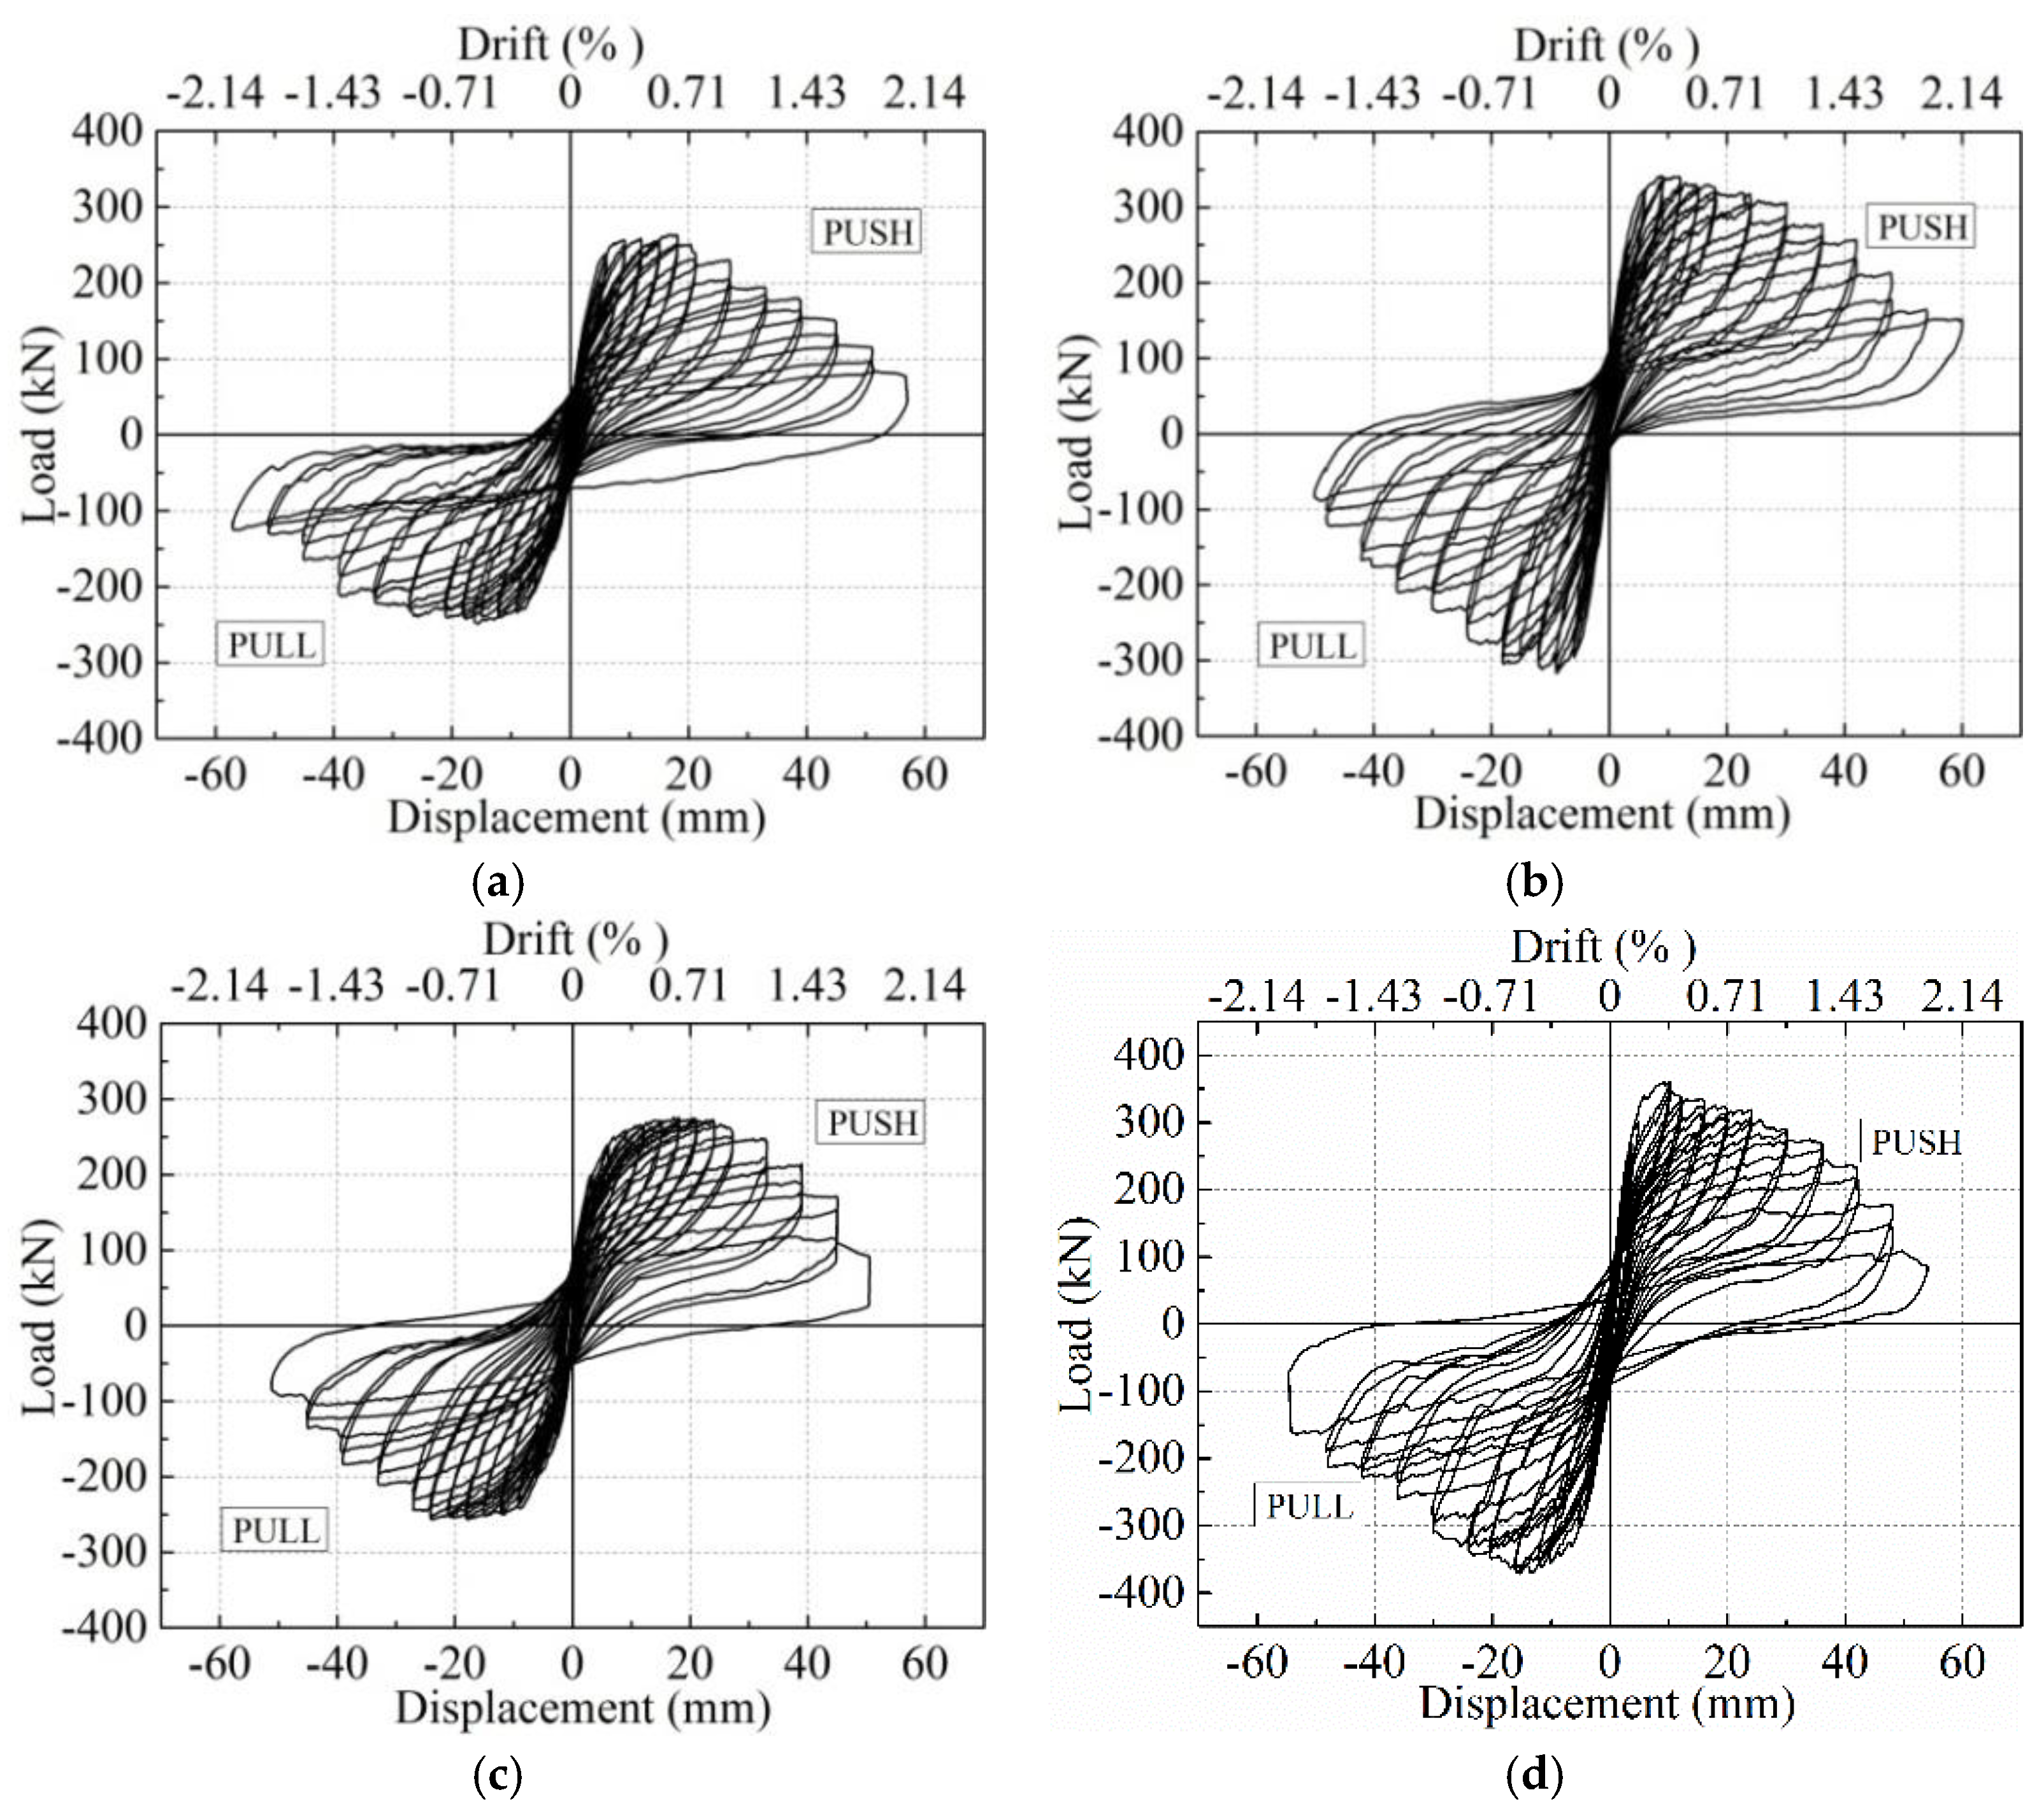
Figure 10 shows that both traditional and precast test walls exhibited similar hysteretic behavior under lateral cyclic loading tests. All test walls behaved in a linear-elastic manner at the early stage of the loading process. As the imposed lateral load increased, inelastic deformation of the specimens occurred and the horizontal cracks initiated in the bed joints. As can be seen in
Table 2, precast test walls showed a relatively higher cracking load than traditional walls and axial compression also delayed the appearance of horizontal flexural cracks. With the development of inelastic deformation, the outmost vertical rebar in the test walls yielded and the lateral resistance increased to the peak load. At this stage, the area of the hysteresis loops increased significantly, which led to higher levels of energy dissipation. As observed, the second cycle of loading exhibited less resisting force of the shear wall, which indicated the stiffness degradation of the specimen for accumulated damage [
23].
Table 3 shows that CMW-1 and PMW-1 with an axial compression of
reached peak load at about 0.6% drift while CMW-2 and PMW-2 with an axial compression of
reached their peak load at a smaller displacement of about 0.4% drift. A detailed discussion on the lateral load capacity of test walls is given in
Section 4.1.
At the post-peak stage, both precast and traditional test walls exhibited ductile flexural failure. Nonetheless,
Figure 10 shows that CMW-2 and PWM-2 with an axial compression of
experienced slightly more distinct strength degradation from the peak point, which proved that axial compression had a detrimental effect on the ductile behavior of the specimens. In addition, the curves of both traditional and precast RMSWs showed obvious pinching behavior and the phenomenon concurs with the report of Ramírez [
24]. Furthermore, abrupt step-like decline of lateral load was observed in the hysteretic curves of test walls due to steel rupture and seriously compressive toe crushing under high loading displacements.
4. Evaluation of Seismic Performance
4.1. Lateral Load Capacity
In seismic design, shear walls should have adequate lateral load capacity to resist the horizontal seismic action. The general wall behavior of each specimen is shown in
Table 2 of
Section 3.2. Based on the plane section assumption, the predicted load capacity
Fp,t is calculated according to the Chinese Code GB 50003-2011 [
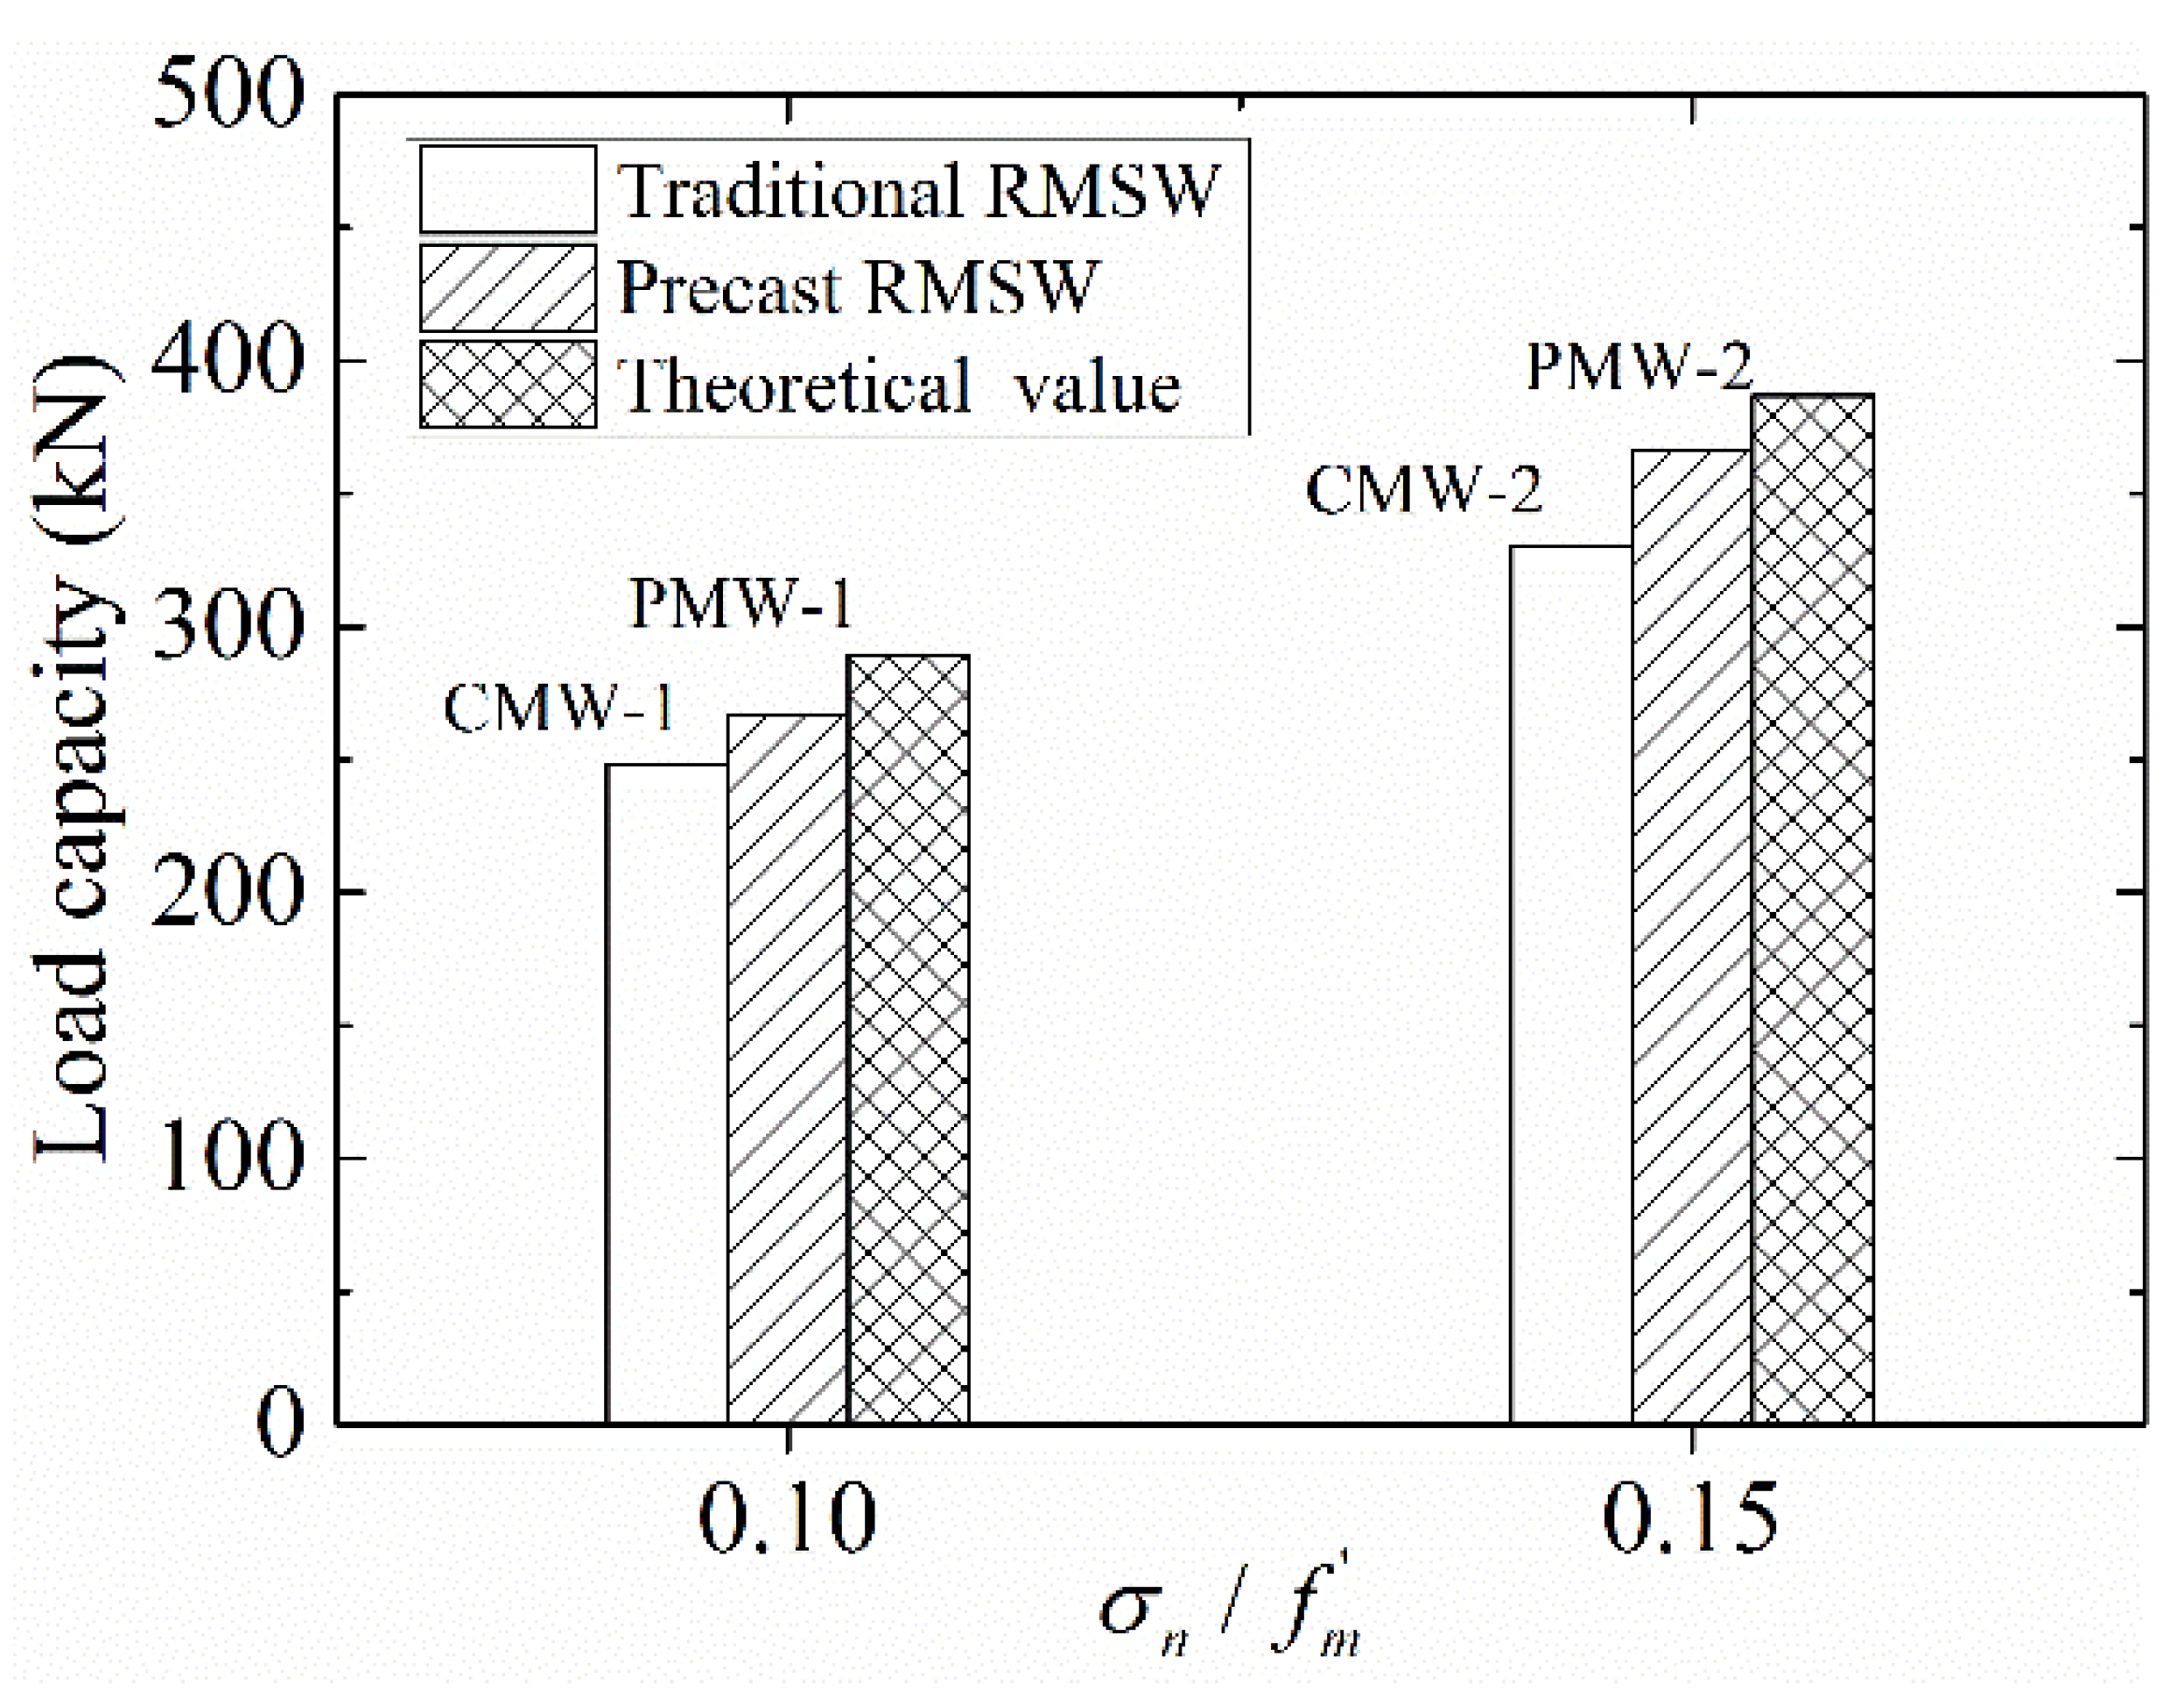
3]. The experimental and theoretical load capacity versus the axial compression ratio of each specimen are presented in
Figure 11.
As seen in
Figure 11, precast RMSWs have relatively better bearing capacity than traditional RMSWs with the same reinforcement and axial compression. More specifically, the lateral load of PMW-1 (
) and PMW-2 (
) exhibit an 8% and 11% increase when compared to the peak loads of CMW-1 and CMW-2, respectively. The test results showed that the flexural capacity of precast walls increased approximately 10% on average, when compared to traditional RMSWs under the same axial compression. Therefore, it could be reasonably inferred that the cancellation of the cleaning-hole unit at the bottom layer in the precast masonry wall increased the local compressive strength of the wall toe, which eventually increased the flexural capacity of the RMSWs.
In addition, with the increasing axial stress, the peak load of both traditional and precast walls exhibited a similar major increase of about 35%, which proves that axial compression has a remarkable influence on the load capacity of the shear wall.
It should be noted that when compared with the experimental results, the theoretical capacity for traditional and precast test walls was overestimated on average by 14% and 7%, respectively. This could be explained by the fact that the reversed cyclic loading caused accumulated damage to the specimen, especially under high axial compression [
25].
4.2. Displacement Ductility
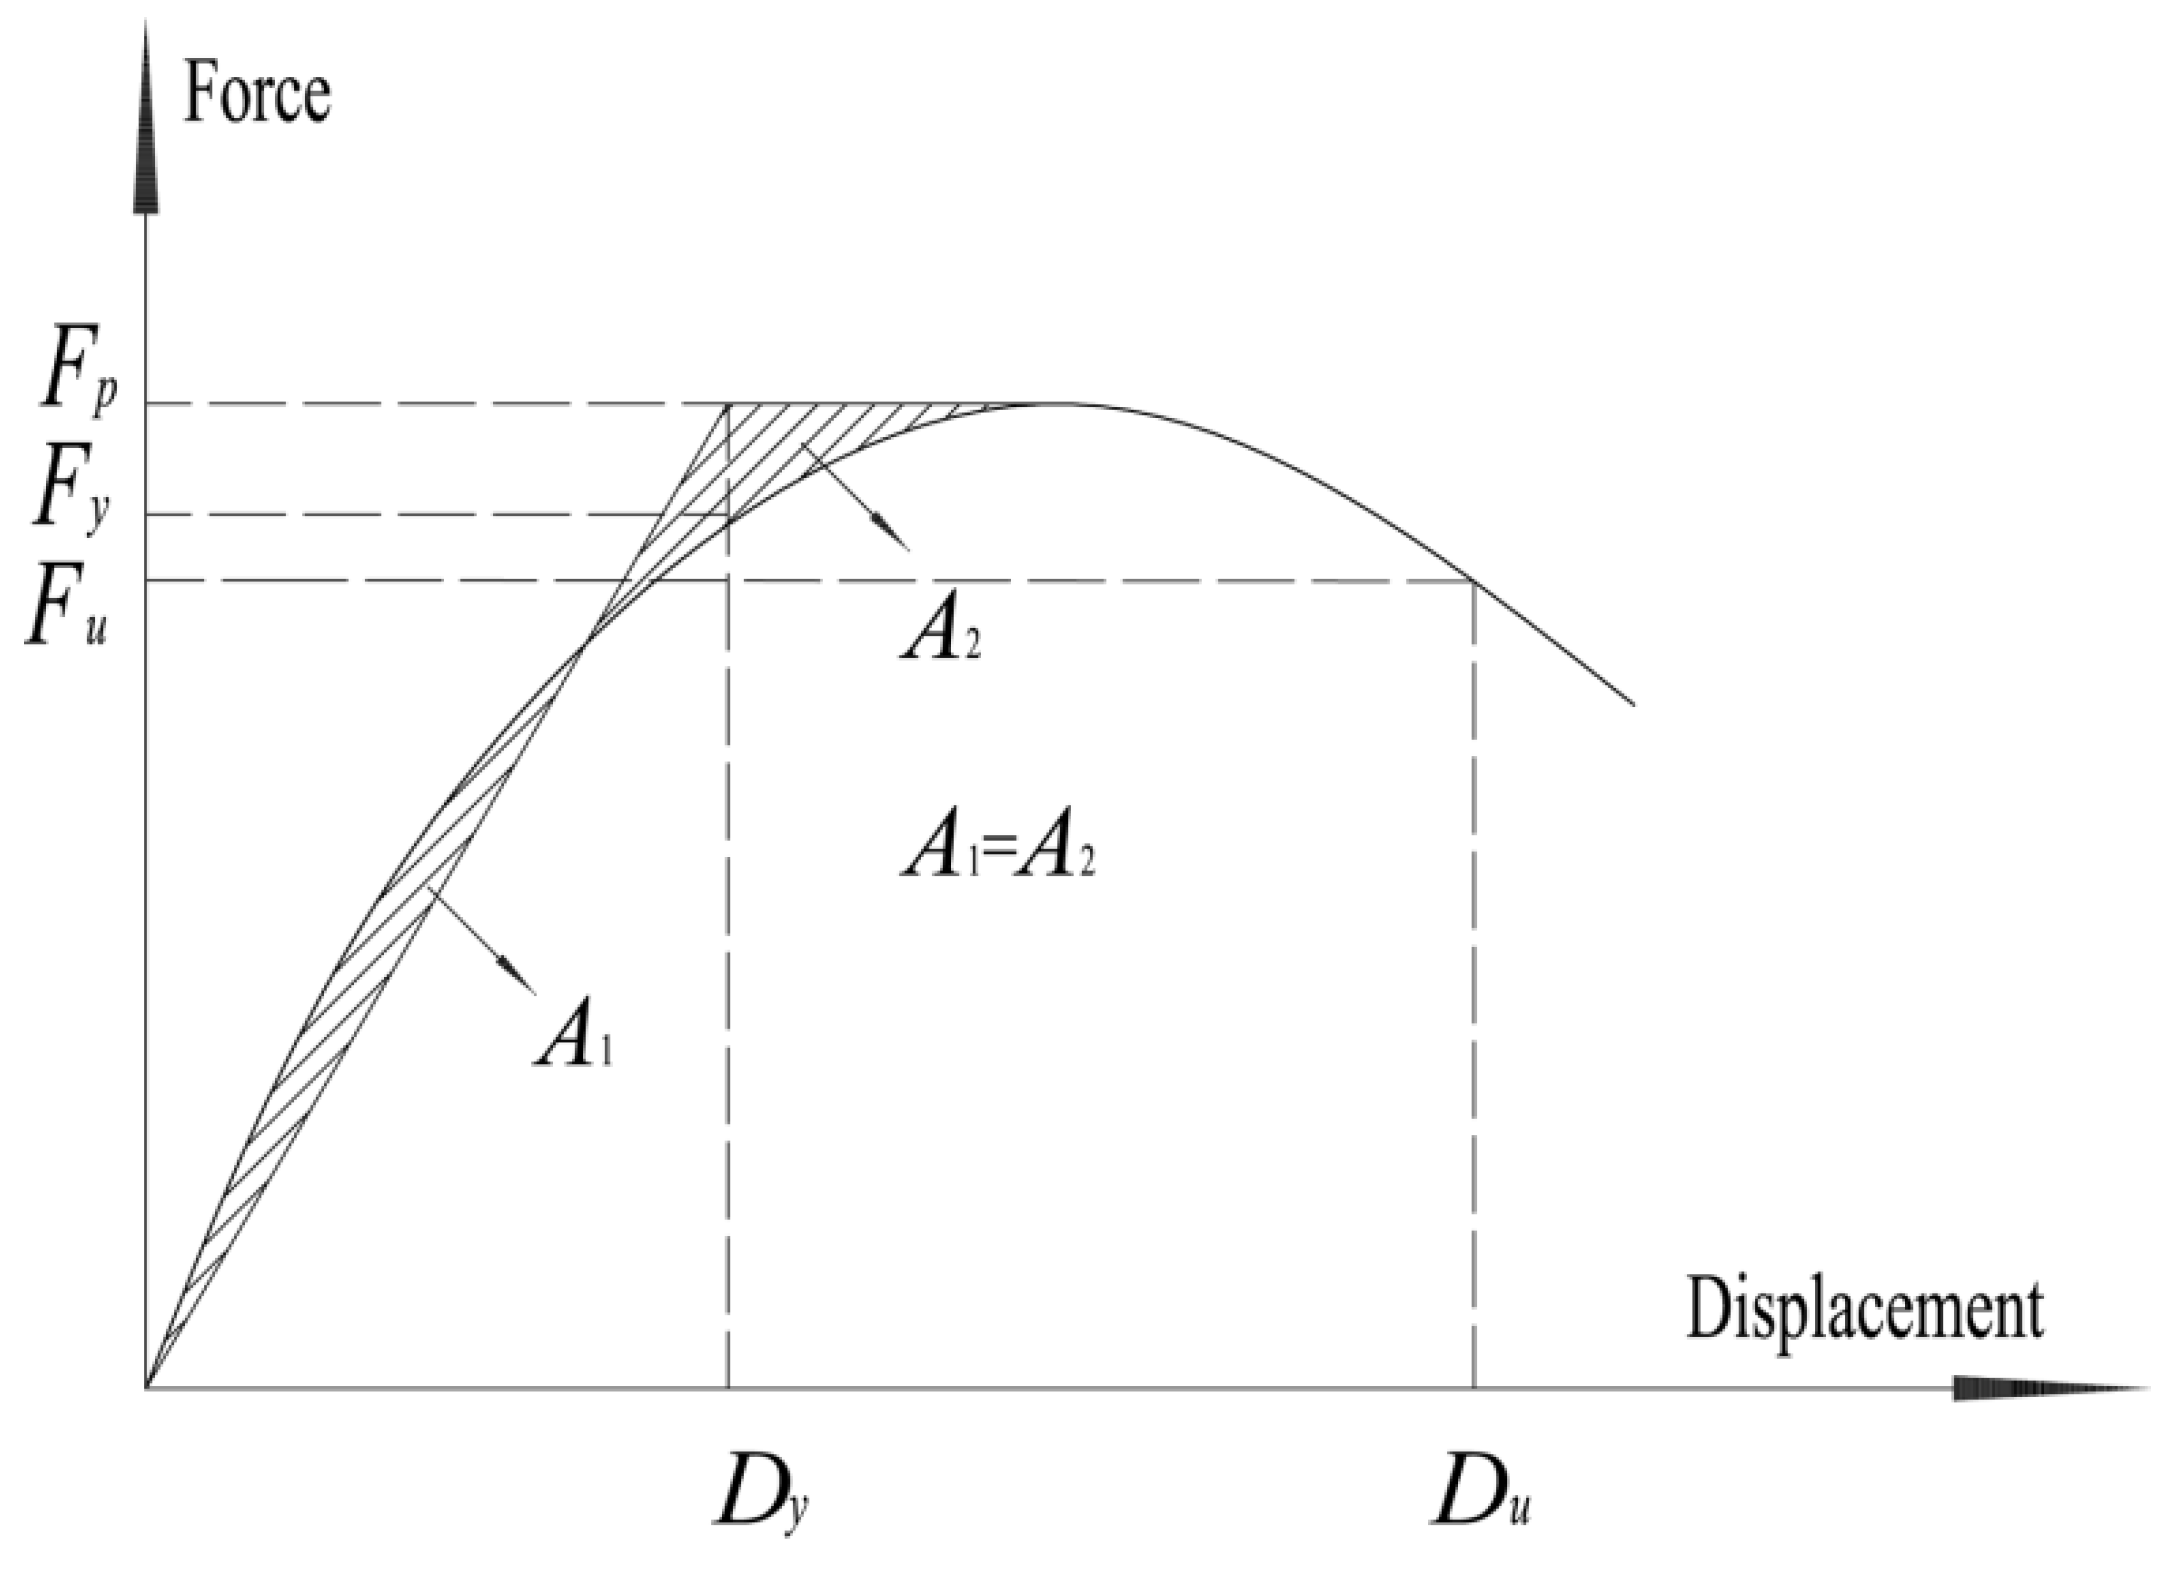
Structures should exhibit not only good load capacity but also proper deformation capacity to avoid brittle failure under an earthquake. Displacement ductility is a measurement of the ability of the shear wall to deform in the elasto-plastic stage without significant degradation of strength. The appropriate definition of the shear wall’s ductility has been discussed in the literature [
23,
24,
25,
26]. In this study, ductility is defined as the ratio between the top displacement corresponding to 0.85
Fp in the post-peak stage and the yield displacement of the specimen. The yielding point of the test wall was determined according to the equal energy method [
27], as shown in
Figure 12. Accordingly, the ductility is calculated by the equation below.
where
Du is the displacement corresponding to the post-peak load equal to 0.85
Fp,
Dy is the yield displacement of the specimen. Each specimen’s
Du, Dy, and μ are summarized in
Table 3.
As seen in
Table 3, all the specimens exhibited relatively high ductility for flexural failure featured by toe crushing and flexural yielding of vertical steel. Each specimen had its own post-yielding deformation characteristics due to different combinations of construction technology and axial compression. CMW-1 had a comparable ductility value to PMW-1 with the same compression ratio of 0.10 while CMW-2 had a higher ductility value (5.0) than that of PMW-2 with a compression ratio of 0.15. With the increase of the axial load, the ductility of traditional RMSW and precast RMSW had decreases of 7% and 12%, respectively. The results proved that the axial load has a detrimental effect on the displacement ductility of shear walls, which is more obvious for precast RMSW. In addition,
Table 3 also shows that, on average, the post-peak lateral load of both traditional and precast RMSW decreased to 0.85
Fp at approximately 1.1% drift.
4.3. Stiffness Degradation
Stiffness is an important coefficient to evaluate the seismic behavior of the shear walls. Under reversed cyclic loading, both traditional and precast RMSWs behaved non-linearly after yielding and experienced accumulated damage in the test, which was indicated by the degradation of stiffness. In this paper, secant stiffness was used to investigate the specimen’s stiffness degradation in cyclic loading. The secant stiffness (
) of the specimen at each loading cycle can be defined by the equation below.
where
and
are the maximum loads of the first
ith cycle in the push and pull loading direction, respectively;
and
are the displacements corresponding to
and
, respectively. Then the calculated secant stiffness,
, was normalized with respect to the corresponding initial stiffness,
, which was defined as the stiffness of the specimen working at the elastic stage.
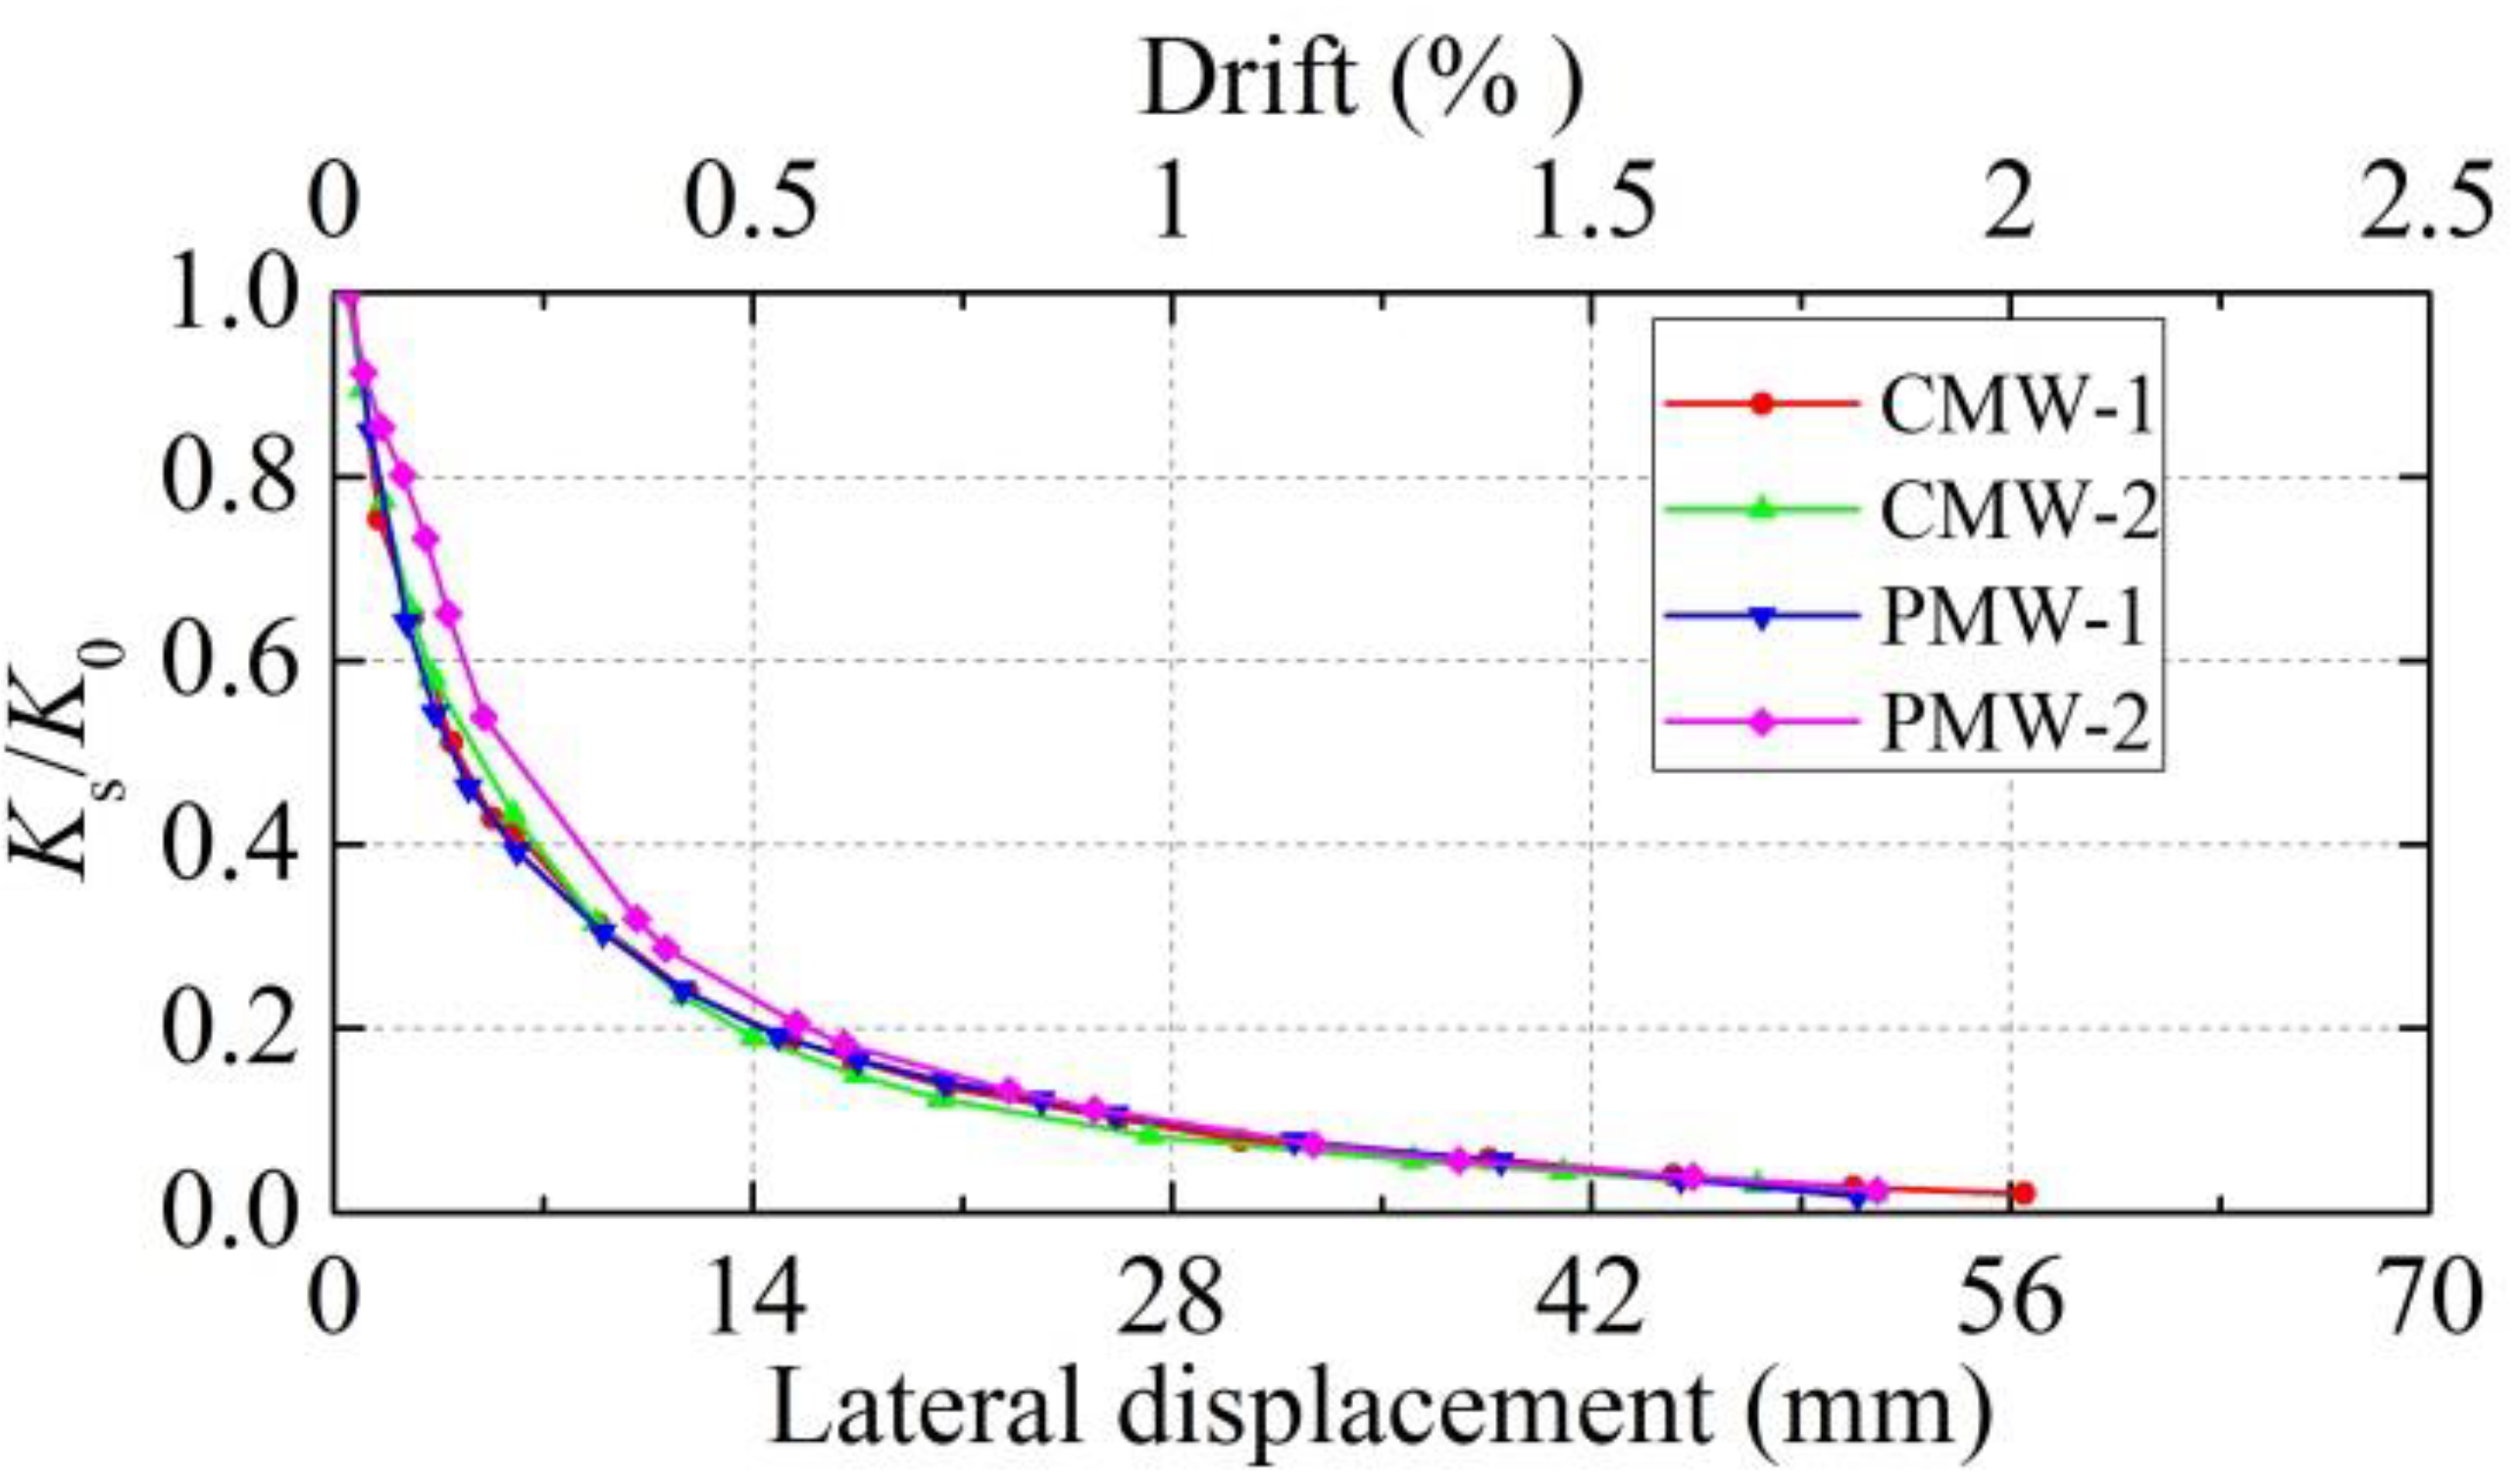
Figure 13 shows the variation of normalized stiffness
with respect to the lateral displacement and drift of each specimen. As observed from the figure, the normalized wall stiffness of both traditional and precast test walls declined with a similar power law as displacement increased. A similar observation of traditional RMSWs was reported by Shedid [
28]. The normalized secant stiffness of test walls decreased rapidly from the initial loading up to about 14 mm (0.5% drift) and then degradation occurred gradually until the termination of the test. The relevant results indicate that the wall stiffness degraded to 50% of the initial stiffness at about 0.2% drift. At 0.5% drift, the test wall exhibits about 21% of the initial stiffness.
4.4. Energy Dissipation
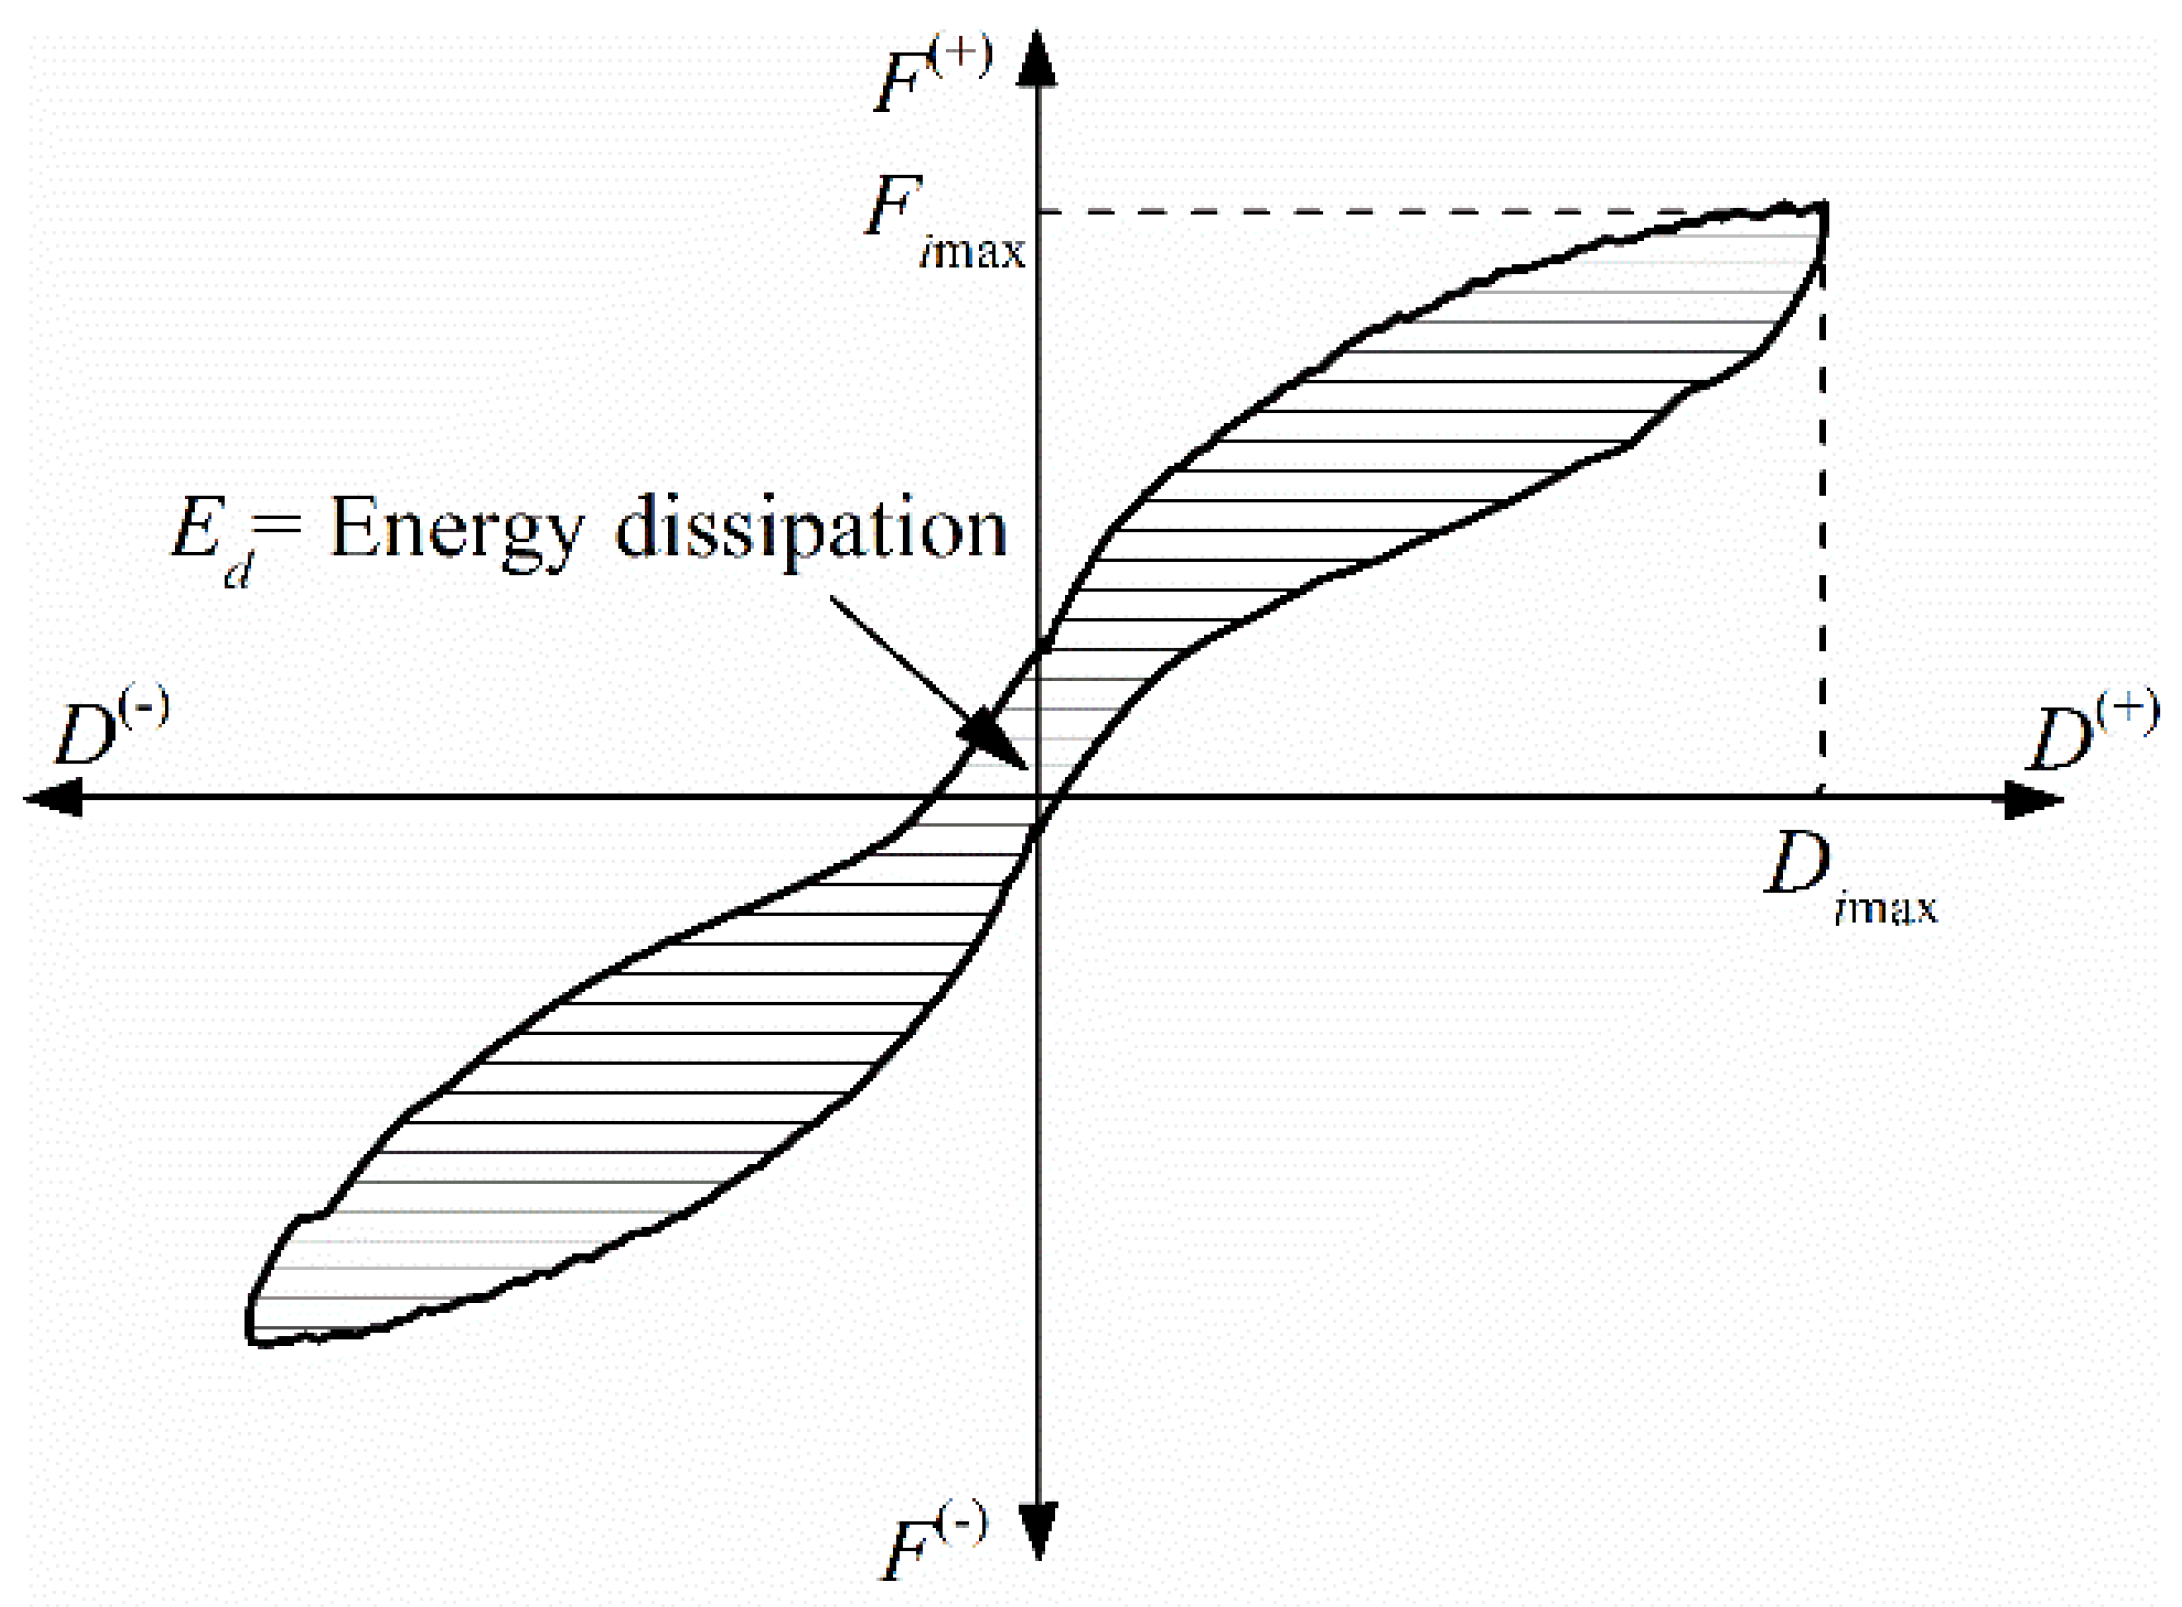
During an earthquake, when a structure comes into the elastic-plastic phase, the seismic energy is mainly dissipated by the hysteretic behavior of the components (beams, columns, and walls) of the structure. Therefore, the energy dissipation through hysteretic damping,
Ed, is commonly used to evaluate the seismic performance of the shear wall. In this paper, the energy dissipation of the specimens is calculated by the area of the hysteresis loop (the horizontally hatched area) of each first loading cycle in the test, which is shown in
Figure 14.
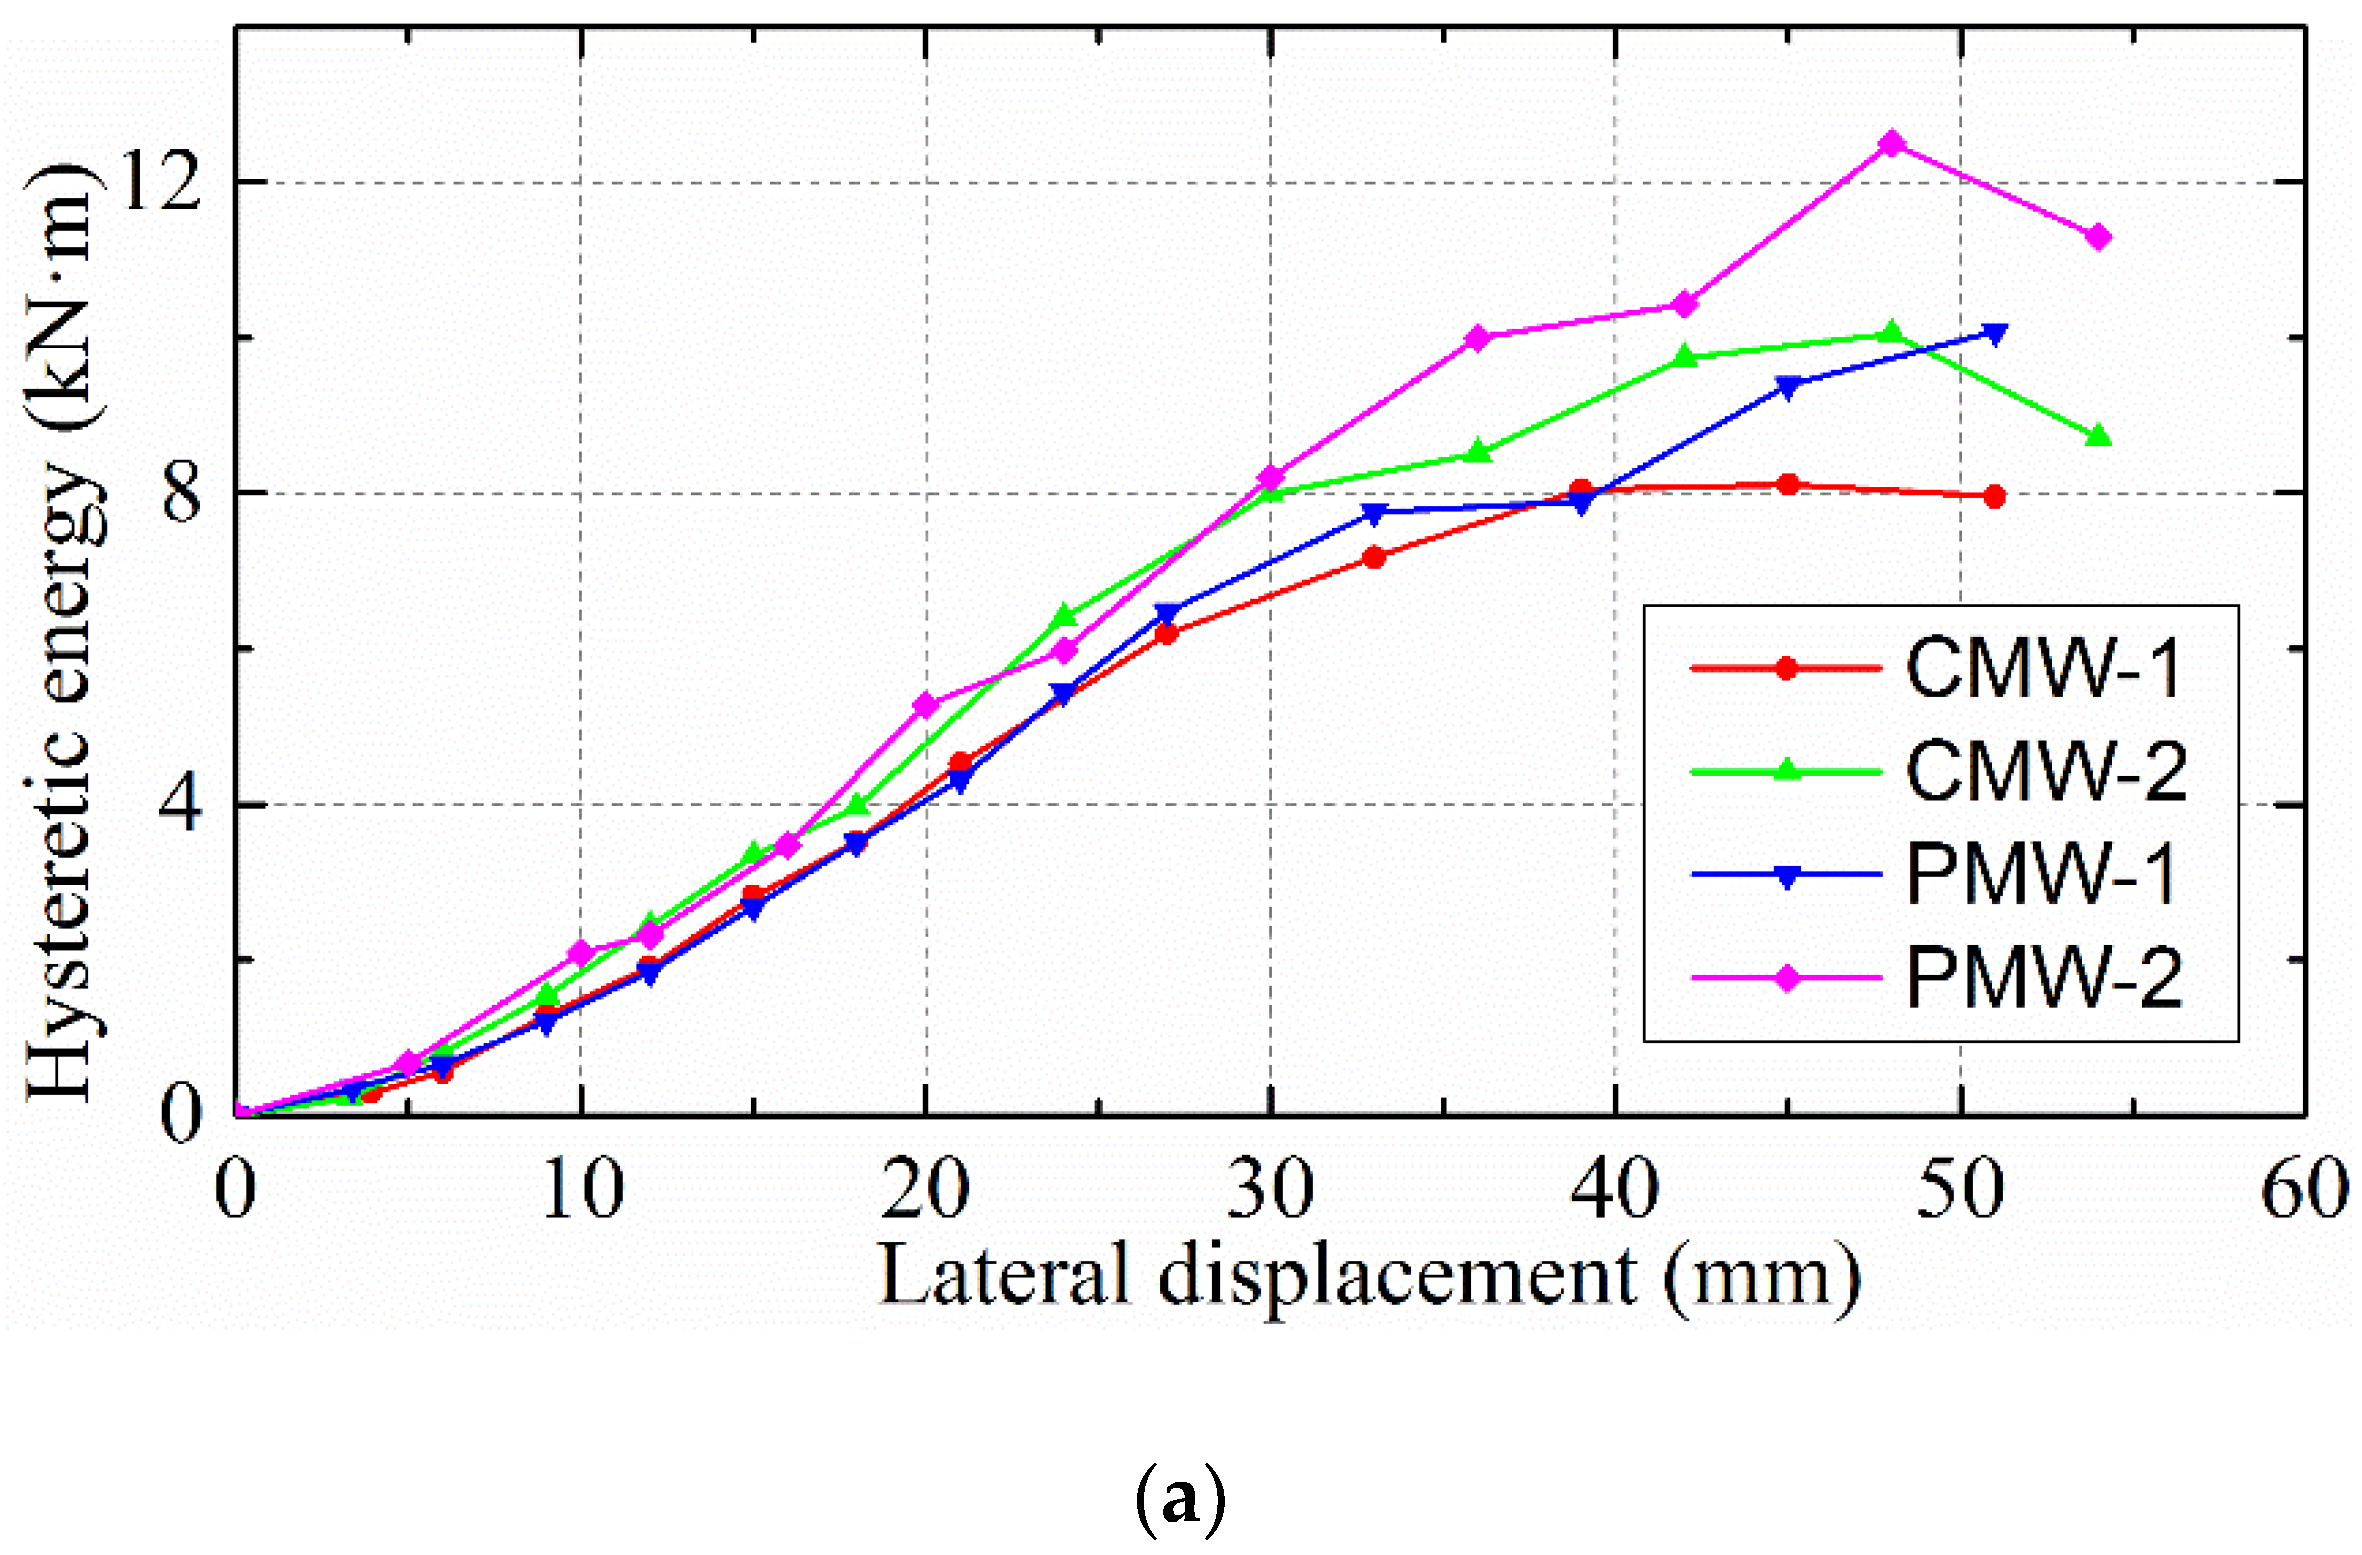
The energy dissipation of the test wall in one loading cycle is shown in
Figure 15a where the hysteretic energy in the last cycles of the test was omitted because the hysteresis loops were either unstable or incomplete due to serious damage of the specimens. The figure shows that the energy dissipation of both traditional and precast RMSWs improved with the increasing loading displacement. At low displacement levels, precast shear walls exhibited nearly the same low energy dissipation as traditional shear walls. As the loading continued, the dissipated energy of both traditional and precast shear walls increased significantly due to yielding of the vertical rebar at the sides and the inelastic deformation of the shear wall. The figure shows that precast RMSWs have an energy dissipation capacity similar to that of traditional RMSWs.
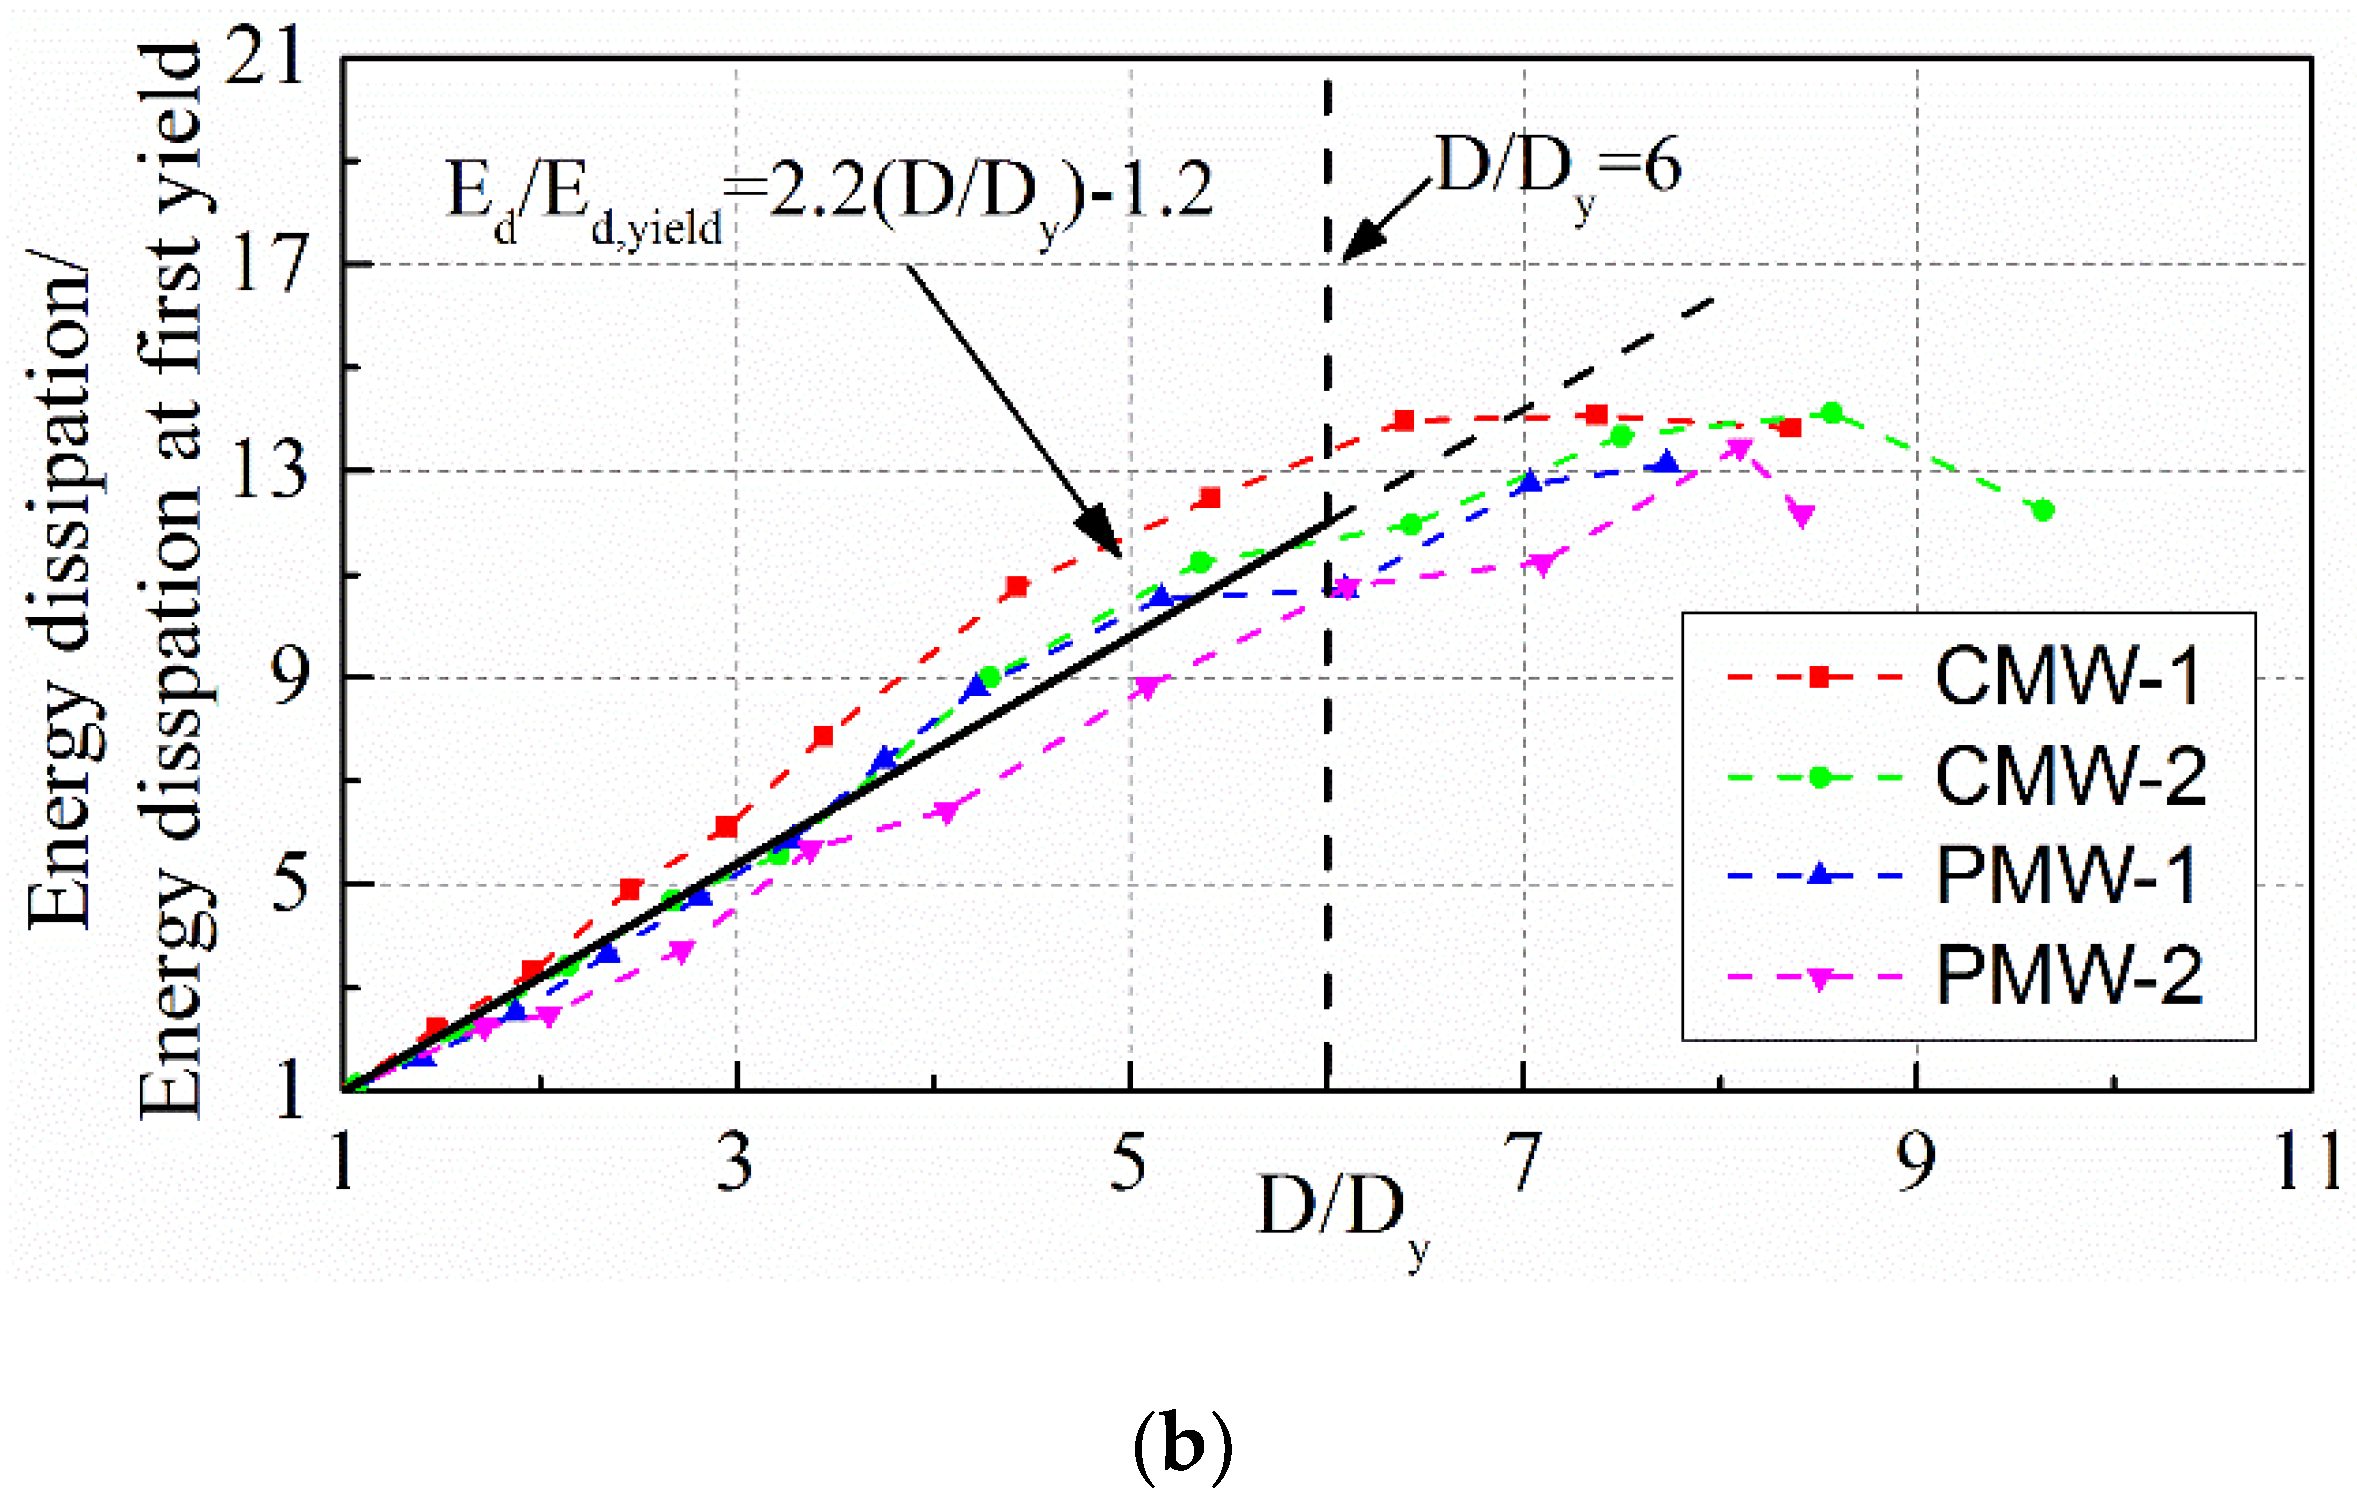
Normalized energy dissipation of each specimen, which is defined as the ratio between the hysteresis energy of the test wall at a certain displacement and the hysteresis energy at the yield displacement, is plotted versus the ratio of the post-yield displacement
D to the yield displacement
Dy in
Figure 15b. The figure shows that, although the construction method and axial compressive stress were different for the specimens, a nearly linear increase of the normalized energy dissipation was observed with the increase of
D/Dy until the displacement of the specimens was more than six times the yield displacement. A similar finding in traditional RMSWs has also been reported by Shedid and Zhao [
28,
29]. The hysteretic energy at the displacement of 3
Dy, was on average about five times the energy dissipation at yield of the test walls.
5. Conclusions
This paper presents an innovative application of precast technology in the construction of reinforced masonry shear walls, by which the special cleaning-hole blocks can be eliminated in the masonry structures. Quasi-static tests were conducted to evaluate the seismic performance of the newly-developed precast RMSWs. The inelastic behavior of each specimen was investigated based on the cracking patterns, hysteretic curves, lateral load capacity, ductility, stiffness degradation, and energy dissipation capacity. From the experimental results and analysis, the following conclusions can be made.
- (1)
Precast RMSWs have better load capacity than traditional RMSWs due to the elimination of the cleaning-hole blocks at the bottom layer, which leads to improved integrity and compressive strength of the masonry.
- (2)
Precast RMSWs that failed in the flexural mode had a favorable deformation capacity and an acceptable average displacement ductility value of 4.9 corresponding to 15% strength degradation, which was slightly smaller than the 5.2 for traditional RMSWs.
- (3)
The normalized stiffness of traditional and precast test walls degraded with a similar power law as the displacement increased. The wall stiffness decreased at a rapid rate at early elasto-plastic stage, but at large displacement, the stiffness declined gradually.
- (4)
The traditional and precast RMSWs exhibited a great energy dissipation capacity in flexural failure mode. The hysteresis energy of RMSWs increased significantly with the increasing displacement, and the relationship between the normalized energy dissipation at yield and the ratio of the post-yield displacement to the yield displacement was almost linear for each specimen up to six times the yield displacement.
- (5)
Axial load significantly affects the flexural performance of both traditional and precast RMSWs. Higher values of the axial compression ratio lead to the increase of lateral load capacity. However, more brittle behavior associated with a reduction of displacement ductility occurs with increasing axial load.
In summary, this paper experimentally studied the seismic performance of precast RBMWs failing in flexure, proving that the precast RMSWs have comparable seismic performance compared to traditional walls, and have the potential to be used in seismic regions. Further research will be concentrated on the potential comprehensive advantage of the precast RMSWs in practical application.
Author Contributions
Formal analysis, W.X. and X.Y.; Methodology, F.W.; Writing—original draft, W.X.; Writing—review and editing, F.W.
Funding
This research received no external funding.
Acknowledgments
The present work was financially supported by the National Key R&D Plan-China (Grant No. 2016YFC0701502-3).
Conflicts of Interest
The authors declare no conflict of interest.
References
- El-Dakhakhni, W.W.; Ahmed, A. Seismic response of reinforced-concrete masonry shear-wall components and systems: State of the art. J. Struct. Eng. 2017, 143, 03117001. [Google Scholar] [CrossRef]
- ACI Committee 318. Building Code Requirements for Structural Concrete; ACI 318-14; American Concrete Institute: Farmington Hills, MI, USA, 2014. [Google Scholar]
- MOHURD. Code for Design of Masonry Structures; GB 50003-2011; Architecture & Industry Press of China: Beijing, China, 2012. [Google Scholar]
- Voon, K.C.; Ingham, J.M. Design expression for the in-plane shear strength of reinforced concrete masonry. J. Struct. Eng. 2007, 133, 706–713. [Google Scholar] [CrossRef]
- Siam, A.; El-Dakhakhni, W.; Li, Z. Seismic risk assessment of reinforced masonry structural wall systems using multivariate data analysis. Eng. Struct. 2017, 144, 58–72. [Google Scholar] [CrossRef]
- Seif ElDin, H.M.; Galal, K. Effect of reinforcement anchorage end detail and spacing on seismic performance of masonry shear walls. Eng. Struct. 2018, 157, 268–279. [Google Scholar] [CrossRef]
- Zhou, Q.; Zhu, F.; Yang, X.; Wang, F.; Chi, B.; Zhang, Z. Shear capacity estimation of fully grouted reinforced concrete masonry walls using neural network and adaptive neuro-fuzzy inference system models. Constr. Build. Mater. 2017, 153, 937–947. [Google Scholar] [CrossRef]
- Zhai, X.M.; Stewart, M.G. Structural reliability analysis of reinforced grouted concrete block masonry walls in compression. Eng. Struct. 2010, 32, 106–114. [Google Scholar] [CrossRef]
- Shedid, M.T.; El-Dakhakhni, W.W.; Drysdale, R.G. Seismic performance parameters for reinforced concrete-block shear wall construction. J. Perform. Constr. Facil. 2010, 24, 4–18. [Google Scholar] [CrossRef]
- Shing, P.B.; Schuller, M.; Houskere, V.S.; Carter, E. Flexural and shear response of reinforced masonry walls. Struct. J. 1990, 87, 646–656. [Google Scholar]
- Shing, P.B.; Schuller, M.; Hoskere, V.S. In-plane resistance of reinforced masonry shear walls. J. Struct. Eng. 1990, 116, 619–640. [Google Scholar] [CrossRef]
- ElDin, H.M.S.; Galal, K. In-plane performance of fully grouted reinforced masonry shear walls. J. Struct. Eng. 2017, 143. [Google Scholar] [CrossRef]
- Voon, K.C.; Ingham, J.M. Experimental in-plane shear strength investigation of reinforced concrete masonry walls. J. Struct. Eng. 2006, 3, 400–408. [Google Scholar] [CrossRef]
- Shedid, M.T.; El-Dakhakhni, W.W.; Drysdale, R.G. Characteristics of Rectangular, Flanged, and End-Confined Reinforced Concrete Masonry Shear Walls for Seismic Design. J. Struct. Eng. 2010, 136, 1471–1482. [Google Scholar] [CrossRef]
- Ibrahim, S.K.; Suter, G.T. Ductility of concrete masonry shear walls subjected to cyclic loading. In Proceedings of the Eighth North American Masonry Conference, Austin, TX, USA, 6–9 June 1999. [Google Scholar]
- Shedid, M.T.; El-Dakhakhni, W.W. Plastic hinge model and displacement-based seismic design parameter quantifications for reinforced concrete block structural walls. J. Struct. Eng. 2014, 140, 04013090. [Google Scholar] [CrossRef]
- MOHURD. Test Methods for Concrete Block and Brick; GB/T 4111-2013; Architecture & Industry Press of China: Beijing, China, 2013. [Google Scholar]
- MOHURD. Standard Test Method for Performance of Building Mortar; JGJ/T 70-2009; Architecture & Industry Press of China: Beijing, China, 2010. [Google Scholar]
- MOHURD. Standard for Evaluation of Concrete Compressive Strength; GB/T 50107-2010; Architecture & Industry Press of China: Beijing, China, 2010. [Google Scholar]
- MOHURD. Standard for Test Method of Basic Mechanics Properties of Masonry; GB/T 50129-2011; Architecture & Industry Press of China: Beijing, China, 2011. [Google Scholar]
- MOHURD. Guide for the Implementation of Metallic Materials at Room Temperature Tensile Test Method; GB/T 228-2010; Architecture & Industry Press of China: Beijing, China, 2010. [Google Scholar]
- Haach, V.G.; Vasconcelos, G.A.; LourençO, P.B. Experimental Analysis of Reinforced Concrete Block Masonry Walls Subjected to In-Plane Cyclic Loading. J. Struct. Eng. 2010, 136, 452–462. [Google Scholar] [CrossRef]
- Shedid, M.T.; Drysdale, R.G.; El-Dakhakhni, W.W. Behavior of fully grouted reinforced concrete masonry shear walls failing in flexure: Experimental results. J. Struct. Eng. 2008, 134, 1754–1767. [Google Scholar] [CrossRef]
- Ramírez, P.; Sandoval, C.; Almazán, J.L. Experimental study on in-plane cyclic response of partially grouted reinforced concrete masonry shear walls. Eng. Struct. 2016, 126, 598–617. [Google Scholar] [CrossRef]
- Mohamad, A.A.E.; Chen, Z. Experimental Studies on the Behavior of a Newly-Developed Type of Self-Insulating Concrete Masonry Shear Wall under in-Plane Cyclic Loading. Appl. Sci. 2017, 7, 463. [Google Scholar] [CrossRef]
- El-Dakhakhni, W.W.; Banting, B.R.; Miller, S.C. Seismic performance parameter quantification of shear-critical reinforced concrete masonry squat walls. J. Struct. Eng. 2013, 139, 957–973. [Google Scholar] [CrossRef]
- Ma, G.; Huang, L.; Yan, L. Experimental performance of reinforced double H-block masonry shear walls under cyclic loading. Mater. Struct. 2017, 50, 70. [Google Scholar] [CrossRef]
- Shedid, M.T.; El-Dakhakhni, W.W.; Drysdale, R.G. Behavior of fully grouted reinforced concrete masonry shear walls failing in flexure: Analysis. Eng. Struct. 2009, 31, 2032–2044. [Google Scholar] [CrossRef]
- Zhao, Y.; Wang, F.L. Experimental studies on behavior of fully grouted reinforced-concrete masonry shear walls. Earthq. Eng. Eng. Vib. 2015, 14, 743–757. [Google Scholar] [CrossRef]
Figure 1.
Reinforcement masonry shear wall: (a) Traditional reinforced masonry shear wall (RMSW) with cleaning-hole blocks; (b) Precast RMSW.
Figure 1.
Reinforcement masonry shear wall: (a) Traditional reinforced masonry shear wall (RMSW) with cleaning-hole blocks; (b) Precast RMSW.
Figure 2.
Details of the test walls (mm).
Figure 2.
Details of the test walls (mm).
Figure 3.
Reinforcement of the test walls: (a) vertical reinforcement; (b) horizontal reinforcement.
Figure 3.
Reinforcement of the test walls: (a) vertical reinforcement; (b) horizontal reinforcement.
Figure 4.
Connection of the vertical reinforcement: (a) lap splice of the vertical steel bar in a traditional wall; (b) welded connection of the vertical steel bar in a precast wall.
Figure 4.
Connection of the vertical reinforcement: (a) lap splice of the vertical steel bar in a traditional wall; (b) welded connection of the vertical steel bar in a precast wall.
Figure 5.
Geometrical dimensions of the concrete blocks: (a) normal block; (b) cleaning-hole block.
Figure 5.
Geometrical dimensions of the concrete blocks: (a) normal block; (b) cleaning-hole block.
Figure 6.
Setup of the cyclic loading test: 1 wall; 2 hydraulic actuator; 3 roller bearing; 4 pressure sensor; 5 spherical joint; 6 hydraulic jack; 7 steel loading beam; 8 displacement sensor; 9 anchoring bolt; 10 wall foundation beam; 11 reaction wall; 12 reaction slab; 13 lateral bracing; and 14 steel reaction frame.
Figure 7.
Imposed displacement history.
Figure 7.
Imposed displacement history.
Figure 8.
Cracking patterns of the test walls: (a) CMW-1; (b) CMW-2; (c) PMW-1; (d) PMW-2.
Figure 8.
Cracking patterns of the test walls: (a) CMW-1; (b) CMW-2; (c) PMW-1; (d) PMW-2.
Figure 9.
Typical damage progression of the specimens: (a) Horizontal cracking of the bed joints; (b) vertical cracking of the blocks; (c) vertical cracking along the cleaning holes; (d) spalling of the end web; (e) splitting of the grout column; (f) crumbling of the grout column; (g) buckling of the vertical rebar; and (h) rupture of the vertical rebar.
Figure 10.
Hysteretic curves of test walls: (a) CMW-1; (b) CMW-2; (c) PMW-1; (d) PMW-2.
Figure 10.
Hysteretic curves of test walls: (a) CMW-1; (b) CMW-2; (c) PMW-1; (d) PMW-2.
Figure 11.
Experimental and theoretical wall capacity.
Figure 11.
Experimental and theoretical wall capacity.
Figure 12.
Determination of the yielding point.
Figure 12.
Determination of the yielding point.
Figure 13.
Evolution of normalized stiffness degradation.
Figure 13.
Evolution of normalized stiffness degradation.
Figure 14.
Energy dissipation of the specimen.
Figure 14.
Energy dissipation of the specimen.
Figure 15.
Energy dissipation of the specimens: (a) Energy dissipation; (b) normalized energy dissipation.
Figure 15.
Energy dissipation of the specimens: (a) Energy dissipation; (b) normalized energy dissipation.
Table 1.
Summary of test wall details.
Table 1.
Summary of test wall details.
| Wall | Reinforcement | Axial Compression Ratio | Construction Technology |
|---|
| Vertical | | Horizontal | |
|---|
| CMW-1 | 5Φ14 | 0.29 | 2Φ12@200 mm | 0.60 | 0.10 | Traditional Method |
| CMW-2 | 5Φ14 | 0.29 | 2Φ12@200 mm | 0.60 | 0.15 | Traditional Method |
| PMW-1 | 5Φ14 | 0.29 | 2Φ12@200 mm | 0.60 | 0.10 | Precast |
| PMW-2 | 5Φ14 | 0.29 | 2Φ12@200 mm | 0.60 | 0.15 | Precast |
Table 2.
Summary of test results.
Table 2.
Summary of test results.
| Wall | First Crack | Peak | Fp,t (kN) | Fcr/Fp | Fp/Fp,t |
|---|
| Fcr (kN) | Dcr (mm) | Fp (kN) | Dp (mm) | % Drift |
|---|
| CMW-1 | 125 | 2.1 | 248 | 16.3 | 0.6 | 289 | 0.50 | 0.86 |
| CMW-2 | 175 | 2.0 | 330 | 8.8 | 0.3 | 387 | 0.53 | 0.85 |
| PMW-1 | 150 | 2.4 | 267 | 17.5 | 0.6 | 289 | 0.56 | 0.92 |
| PMW-2 | 250 | 3.0 | 366 | 12.7 | 0.5 | 387 | 0.68 | 0.95 |
Table 3.
Summary of calculated displacement and ductility of test walls.
Table 3.
Summary of calculated displacement and ductility of test walls.
| Specimen | Dy (mm) | Du (mm) | % Drift | μ |
|---|
| CMW-1 | 6.1 | 33.2 | 1.2 | 5.4 |
| CMW-2 | 5.6 | 27.8 | 1.0 | 5.0 |
| PMW-1 | 6.4 | 33.0 | 1.2 | 5.2 |
| PMW-2 | 5.9 | 26.6 | 1.0 | 4.6 |
© 2018 by the authors. Licensee MDPI, Basel, Switzerland. This article is an open access article distributed under the terms and conditions of the Creative Commons Attribution (CC BY) license (http://creativecommons.org/licenses/by/4.0/).


