Article

Study of the Effect of Pyrolysis Temperature on the Cd2+ Adsorption Characteristics of Biochar

1
The Beijing Key Laboratory of New Technology in Agricultural Application, Department of Agricultural Resource and Environment, Beijing University of Agriculture, Beinong Road 7, Huilongguan, Changping District, Beijing 102206, China
2
Institute of Environment and Sustainable Development in Agriculture, Chinese Academy of Agricultural Scieces, No.12 Zhongguancun South St., Haidian District, Beijing 100081, China
*
Author to whom correspondence should be addressed.
Appl. Sci. 2018, 8(7), 1019; https://doi.org/10.3390/app8071019
Submission received: 26 May 2018 / Revised: 15 June 2018 / Accepted: 16 June 2018 / Published: 22 June 2018
(This article belongs to the Special Issue Sustainable Environmental Remediation)

Abstract

:

Featured Application

The results showed that there were differences in Cr2+ removal of biochar under different pyrolysis temperatures and initial pH conditions. Therefore, it is very important to choose suitable material sources, preparation temperature and pH for the application of biochar in remediation of heavy metal polluted soil.

Abstract

Rice husk and cotton straw were used to produce biochar under 300, 400, 500, 600, and 700 °C pyrolysis conditions, and the physicochemical properties of the obtained biochar samples were characterised. The effects of various adsorbent amounts, initial pH, and adsorption time on the Cd2+ adsorption performance were studied. The results showed that, at increasing pyrolysis temperatures, the biochar yield decreased, the ash content increased, the pH transitioned from acidic/neutral to basic/strongly basic, the biochar aromaticity gradually increased, and the biochar structure became more stable. In contrast, the hydrophilicity and polarity decreased, the specific surface area increased, and the number of oxygen-containing functional groups decreased. All these factors resulted in differences in the Cd2+ adsorption by the biochar samples. With increasing adsorbent content, the rate of Cd2+ adsorbed on the biochar gradually increased. The adsorption performance was optimal when the initial solution pH of the rice-husk and cotton-straw biochar samples was 5 and 6, respectively. The shortest time to achieve equilibrium was 30 min for rice-husk biochar, and 20 min for cotton-straw biochar. The Cd2+ adsorption data for both types of biochar were very well fitted with a pseudo-second-order kinetic model. Ion exchange and cation–π interactions may be the main factors influencing the Cd2+ adsorption by biochar. At the same time, the large specific surface area of biochar also plays a role in the Cd2+ adsorption.

With the current rapid economic development, larger and larger heavy-metal amounts are being discharged into the environment, resulting in frequent heavy-metal pollution events. Therefore, the treatment of such heavy-metal pollution is very urgent. Heavy metals are relatively stable, and are not easily transformed in the natural environment. Ultimately, heavy metals enter the human body through the food chain, threatening human health [1]. According to the nationwide survey of soil contamination announced in April 2014, cadmium pollution exceeded the standard rate of 7.0% in monitoring sites, exceeding the standard limits of all investigated inorganic pollutants [2]. The long-term consumption of drinking water or agricultural crops containing cadmium exceeding the standard limits will result in toxicity to the respiratory tract, liver, and kidneys. Cadmium poisoning particularly results in osteoporosis, osteomalacia, pain, etc. [3]. Therefore, the removal of heavy metals from the environment is a current research hotspot. At present, methods for the removal of heavy-metal ions mainly include redox coprecipitation, ion exchange and membrane separation, reverse osmosis and adsorption, etc. Among these methods, adsorption is an energy-saving, highly efficient, and environmentally friendly approach [4], and is, therefore, widely used for the removal of heavy metals. The heavy-metal removal efficiency is determined by the adsorbent used. Current adsorbents include activated carbon, graphene, carbon nanotubes, etc., owing to their porous structure and unique surface characteristics, which are all advantageous for the removal of heavy metals. However, these materials are not cheap, and their large-scale use results in high costs [5]. In addition, nanomaterials may potentially be toxic to the environment and human body [6]. Therefore, finding an economical, environmentally friendly material with good adsorbent properties is a key focus of current research in this area [7].
Biochar is a carbon-enriched solid product obtained from the pyrolysis of biomass in the absence of air or under insufficient oxygen supply. Biochar has a nanoscale porous structure and interconnected pores that heavy-metal ions can easily enter. The surface of biochar contains functional groups rich in N, S, P, etc., which are able to form stable complexes with heavy-metal ions. At the same time, biochar is extremely stable in the environment, not easily mineralised or decomposed by microorganisms, and has a long retention time. More importantly, waste straw, litter, weed, animal manure, and even sludge can be used as raw materials for the production of biochar, thus being an important example of agricultural recycling [8]. However, the heavy-metal removal efficiency of biochar varies due to differences in the starting material, preparation temperature, environmental conditions (such as pH), modification of the biochar’s surface, and the amount of adsorbent used [9].
We selected starting materials that are common biomasses easily obtainable in large amounts, i.e., rice husk and cotton straw. Pyrolysis temperatures of 300, 400, 500, 600, and 700 °C were used to prepare biochar, and to study its adsorption characteristics towards Cd2+ ions and other influencing factors. Various characterisation methods were used to examine the surface characteristics and adsorption mechanisms of various biochar samples in order to provide a theoretical basis for biochar remediation of Cd2+ pollution, and the comprehensive utilisation of biomass.

1. Materials and Methods

1.1. Preparation of Biochar

Rice husk and cotton straw were obtained from rural villages in the suburbs of Huainan City in Anhui Province, and Sanhe City in Hebei Province, respectively. The rice husk and cotton straw were washed with deionised water. The cotton straws were cut into 2-cm segments, and dried at 70 °C for 24 h. The raw materials were placed in a ceramic crucible for weighing. The crucible was then heated in a muffle furnace (Nabertherm LT40, heating rate: 15 °C/min; ventilatory rate: 2 mL N2/min) at 300, 400, 500, 600, or 700 °C for 3 h, and then removed after cooling to room temperature. The crucible was then weighed to calculate the biochar yield at various pyrolysis temperatures.
Biochar yield (%) = (m1/m0) × 100%,
where m0 (g) was the weight of dry rice husk or cotton straw before entering the muffle furnace, and m1 (g) was the biochar weight of rice husk or cotton straw after charring.
The biochar samples obtained from rice husk (RH) and cotton straw (CS) at the various pyrolysis temperatures were labelled as RH300, RH400, RH500, RH600, and RH700, and CS300, CS400, CS500, CS600, and CS700, respectively. These biochar samples were then sealed and stored for further use. The ash content was calculated by placing a fixed amount of biochar in a ceramic crucible, charring at 800 °C in a muffle furnace, and recording the weight once a constant value was obtained.
Ash content (%) = (M1/M0) × 100%,
where M0 (g) was the biochar weight of dry rice husk or cotton straw before entering the muffle furnace, and M1 (g) was the biochar weight of rice husk or cotton straw after charring.

1.2. Biochar Characterisation

1.2.1. pH

The biochar pH was measured with a pH meter (Mettler Toledo FE20 Plus) using “GB-T12496.7-1999 pH measurements for wood-based activated carbon” as a reference. Two grams of biochar were placed into a beaker, before adding 50 mL of ultrapure water and putting a glass evaporating dish over the beaker, and heating to boiling temperature for 5 min. Following that, the original 5mL of filtrate was filtrated and discarded, and the remaining filtrate was cooled to room temperature for determining the pH value. The experiment was repeated three times.

1.2.2. Element Analysis

Forty milligrams of biochar was dried at 105 °C for 24 h, and cooled to room temperature. The dried biochar was compacted in tin box paper, and placed on the automatic sampler. With high-purity nitrogen as the carrier gas, the element content analysis was carried out using an Elementar Vario II elemental analyser (Elementar Analysensysteme, the Main-Kinzig district, Germany).

1.2.3. Surface Morphology Analysis

Surface morphology analysis was carried out using scanning electron microscopy (SEM; S250MK3, British Cambridge Co., Ltd., Cambridge, England). After drying the biochar, a small amount of samples were fixed on the sample table with a conductive double-sided adhesive, and sprayed gold. The surface parts of the samples were randomly selected to observe surface morphology by adjusting the multiples of SEM. The whole area of the biochar was scanned and photographed for analysis and preservation.

1.2.4. Specific Surface Area and Pore Grade

The specific surface area and pore size distribution were determined using the “ISO9277-1995 determination of the specific surface area of solids by gas adsorption, using the Brunauer–Emmett–Teller (BET) method” [10], for which a surface area analyser (ASAP 2020, Micromeritics Inc., Norcross, GA, USA) was used for specific surface area determination. The adsorption curves of nitrogen gas were obtained to calculate the specific surface area, and to determine the pore grade.

1.2.5. Surface Functional Groups

The surface functional groups were analysed via Fourier-transform infrared (FTIR) [11] spectroscopy (SQH1-AIM-8800, Beijing Zhongxi Yuanda Technology Co., Ltd., Beijing, China). Firstly, the biochar was rinsed in a beaker using 1 mol/L HCl, and then filtered. This step was repeated until the removal of ash and non-water-soluble substances of the samples was maximised. Secondly, after drying at 70 °C for 6 h, 1 mg of the biochar was mixed with 300 mg of KBr powder in agate mortar, fully lapping to uniform, and then pressed in the press machine (150 kPa, 5 min). Finally, the surface functional groups were determined via FTIR with a wave range of 400–4000 cm−1 and a resolution ratio of 8 cm−1.

1.3. Adsorption Experiments

For the biochar Cd2+ adsorption experiments, a fixed amount of biochar was accurately weighed and placed in a 50-mL centrifuge tube. Cd2+ (25 mL of a 100 mg/L solution in the form of Cd (NO3)2) was added, and 1 M HCl or NaOH was used to adjust the pH. The centrifuge tubes were capped and then shaken (200 r/min) at 25 ± 1 °C in the dark for a fixed period of time. Next, the tubes were centrifuged for 15 min at 4000 rpm. The supernatant was collected and passed through a 0.45-μm Nylon filtration membrane. Inductively coupled plasma optical emission spectrometry (ICP-OES) was used to determine the Cd2+ concentration in the supernatant. The experiments were carried out in triplicate, and blank controls were also used.
The influencing factors included (1) the effect of the adsorbent loading (various amounts of biochar (25, 50, 100, 150, or 200 mg) were added at pH 5.0); (2) the Cd2+ adsorption kinetics experiments (50 mg of biochar, pH 5.0, and shaking times of 1/6, 1/3, 0.5, 1, 2, 3, 6, 12, 18, and 24 h); and (3) the effect of pH on the Cd2+ removal (50 mg of biochar was weighed, and the pH was adjusted to the desired values (pH values of 4, 5, 6, 7, and 8) with 1 M HNO3 or 1 M NaOH solution). The solutions were agitated on a shaker for 24 h.
The Cd2+ removal level and the adsorbed amount were calculated as follows:
Cd2+ removal (%) = (ρ0ρe)/ρ0 × 100,
Q = V(ρ0ρe)/m.
In Equations (1) and (2), ρ0 and ρe are the Cd2+ concentration (mg·L−1) before and after adsorption, Q is the amount of Cd2+ adsorbed (mg·g−1), V is the volume of the solution (L), and m is the amount of biochar added (g).
Kinetics equations were obtained from Reference [12]. The pseudo-first-order kinetics Equation (3) and the pseudo-second-order kinetics Equation (4) were employed to describe the kinetics of Cd2+ adsorption by biochar, and are shown below.
ln (qeqt) = lnqek1t, i.e., qt = qe (1 − ek1x),
t/qt = (1/k2qe2) + (t/qe),
where qe is the amount of heavy metal adsorbed at equilibrium (mg·g−1), qt is the amount of heavy metal adsorbed by biochar at time t (mg·g−1), t is the reaction time (min), k1 is the reaction rate constant (min−1) of pseudo first-order kinetics, and k2 is the reaction rate constant (g·mg−1·min−1) of pseudo second-order kinetics.

1.4. Data Processing

Microsoft Excel 2010 and Origin 8.5 were used for data and model calculation and processing.

2. Results and Discussion

2.1. Biochar Yield and Ash Content at Various Pyrolysis Temperatures

Table 1 summarises the yield and ash content of the rice-husk and cotton-straw biochar samples obtained at various pyrolysis temperatures. It can be seen that the yield of both materials decreased with increasing pyrolysis temperature, while the ash content increased. This shows that higher temperatures improved the degree of pyrolysis, as the volatile components gradually escaped from the raw material, and the level of residual components decreased. As a result, the biochar yield decreased while the ash content increased [13]. The yields of both materials showed slight differences. At 300–700 °C, the biochar yield from rice husk was 37.52–23.32%, while the biochar yield from cotton straw was 51.64–19.92%. In contrast, the ash content of the rice-husk biochar was 64.19–76.20%, far higher than that for the cotton-straw biochar (5.54–12.15%). During pyrolysis, the biochar yield was mainly affected by the removal of volatile substances, while the variations in ash content were mainly due to differences in the mineral content and proportion of carbon compounds [14]. Therefore, the content of volatile substances did not differ greatly between both materials, although large differences existed in the type and content of minerals. It is widely known that, in addition to K, P, Ca, Fe, etc., rice husk also contains large amounts of Si that are not lost during the pyrolysis process. In raw materials, the silicon content can be as high as 10%, and even higher in rice husk [15]. This is the direct cause of the high ash content in the biochar samples prepared from rice husk.

2.2. Physiochemical Properties of Biochar

2.2.1. Biochar pH and Elemental Composition

Table 2 shows the biochar pH and elemental composition of both materials obtained at various pyrolysis temperatures. Between 300 °C and 700 °C, the pH of the rice-husk biochar increased from acidic (pH = 5.31) to strongly basic (pH = 9.42), which was consistent with previous studies (pH = 5.37–9.82) [16], while the pH of the cotton-straw biochar increased from neutral (pH = 6.61) to strongly basic (pH = 10.42). A previous study found that the pH of biochar typically ranges from 4 to 12 [17], and the results of the present study fell within that range. A possible reason behind the pH increase with temperature is that the hemicellulose, cellulose, lignin, and other components of the raw materials undergo dehydration, dehydroxylation, and other chemical reactions to produce acidic substances. At low temperatures, the amount of acidic substances that volatilises is relatively low, and thus, the remaining content in the biochar residues is relatively high. As the temperature increases, the volatilisation of highly acidic substances increases, and the pH correspondingly increases [18]. The relative content of acidic or basic substances in a sample is reflected in its pH value. The pyrolysis temperature range at which significant changes in the content of acidic and basic substances were observed was 300–500 °C.
With regards to the elemental content in biochar produced at various pyrolysis temperatures, the highest content corresponded to carbon, followed by oxygen, hydrogen, and nitrogen, while the sulphur content was almost negligible. This was consistent with the results of many previous studies [19,20]. With increasing pyrolysis temperature, the carbon content gradually decreased in the rice-husk biochar, but continuously increased in the cotton-straw biochar. The H/C ratio was indicative of the aromaticity of biochar: the smaller the H/C value, the stronger the aromaticity, and the stronger the biochar structure. The O/C and (O + N)/C ratios indicated the hydrophilicity and polarity of biochar. Higher O/C and (O + N)/C values mean stronger hydrophilicity and polarity [21]. From Table 2, it can be seen that, at higher pyrolysis temperatures, the H/C ratio of the two materials decreased, as well as the O/C and (O + N)/C ratios. Therefore, at higher temperatures, the aromaticity of the biochar obtained from these two materials increased, and its structure became more stable. On the other hand, the hydrophilicity and polarity decreased. The changes between 300 °C and 600 °C were relatively larger. The C/N ratio is an indicator of the speed of microbial degradation of organic matter. The higher the C/N value, the more difficult microbial degradation is, i.e., the stronger the anti-degradation properties of the material [22]. This value reached the maximum for both rice-husk and cotton-straw biochar samples at 600 °C.

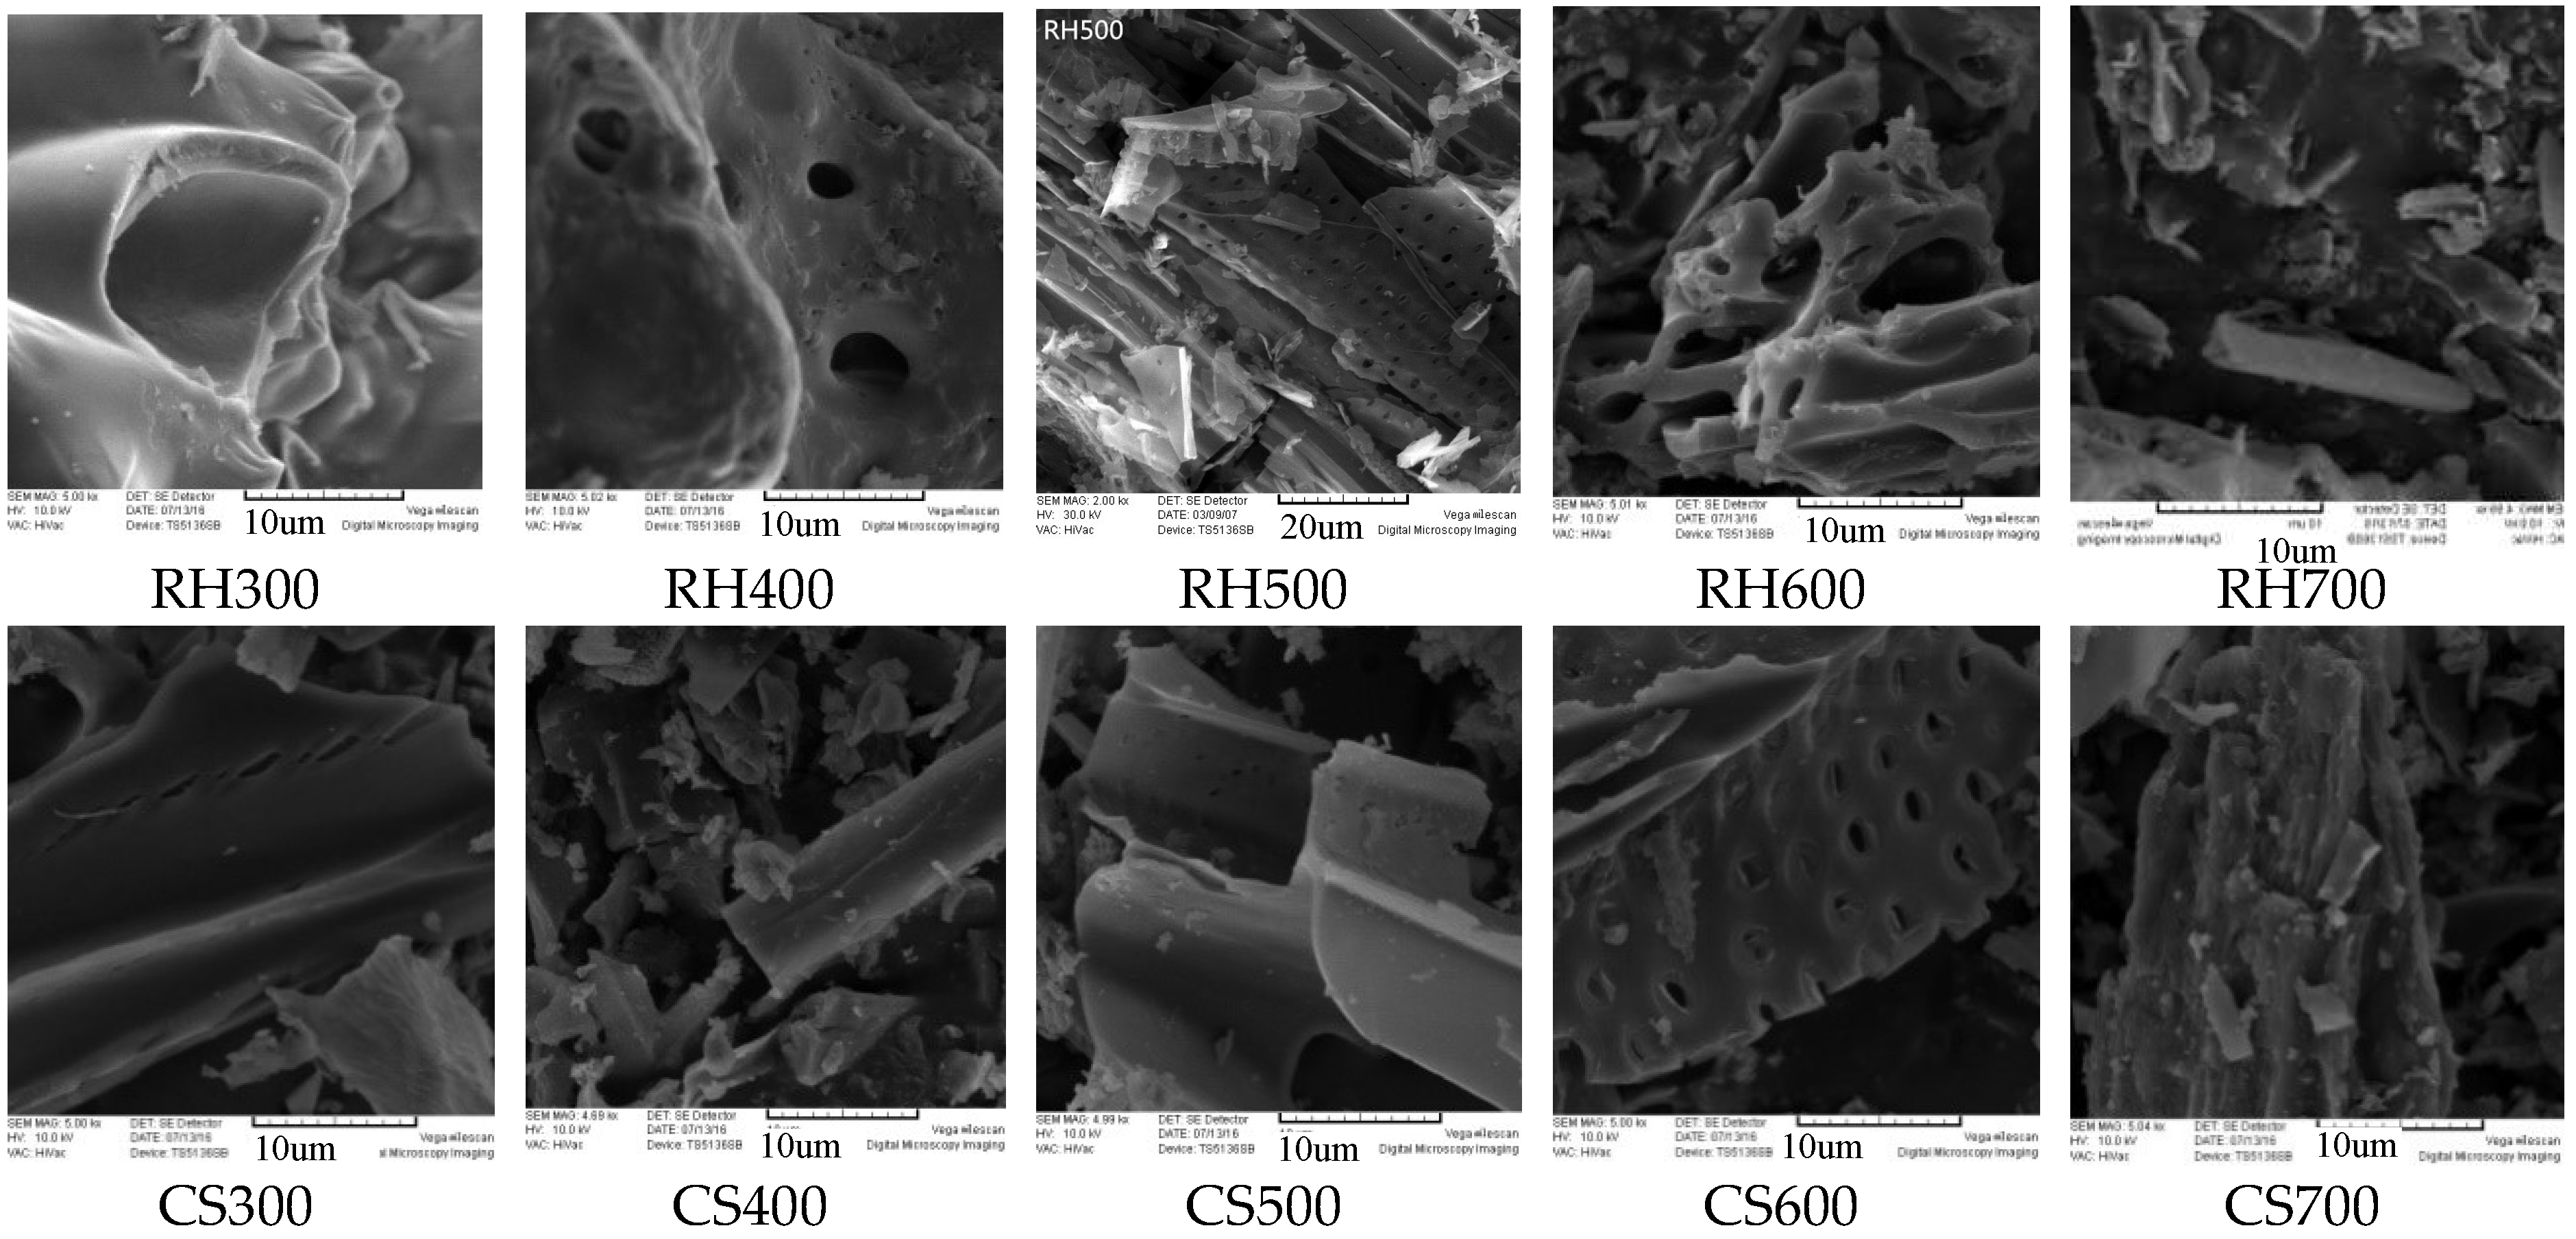
2.2.2. Electron Microscopy Analysis of Biochar

With a scanning electron microscope, we can observe the real, high-resolution, three-dimensional (3D) surface of biochar [23]. From Figure 1, we can see that the number of surface pores gradually increased with pyrolysis temperature, and a mesh structure appeared before transforming into a bar-like structure. Finally, the structure collapsed and fragmented. The temperature at which large amounts of micropores appeared in the rice-husk biochar was 400–500 °C. At 600 °C, the bar-like structure was evident, and the structure finally fragmented at 700 °C. Micropore development was not that evident on the surface of the cotton-straw biochar at 300–500 °C. A large number of micropores appeared instead at 600 °C, followed by severe fragmentation at 700 °C. A gas-adsorption method was used to measure the specific surface area (Brunauer–Emmett–Teller (BET) surface area) and the pore size of the various biochar samples (Table 3). The results show that the BET area for rice-husk biochar increased the most at 400–500 °C, with a value of 191.30 m2·g−1, while that of cotton-straw biochar exhibited the greatest increase at 500–600 °C, with values reaching 200 m2·g−1. The mean pore size also slightly increased with temperature. The difference between the maximum and minimum pore size was 0.123 nm for rice husk, and 0.579 nm for cotton straw. The micropore volume of rice-husk biochar gradually increased with pyrolysis temperature. On the other hand, the micropore volume did not show large changes at 300–600 °C for cotton-straw biochar, although it increased three-fold at 700 °C. Such increases in the number of micropores and the specific surface area with increasing pyrolysis temperature [24] were already described in previous studies; however, there are large differences in the exact values. This may be directly associated with the material source, pyrolysis temperature, and pyrolysis duration [25].

2.2.3. Infrared Spectra of Biochar

FTIR spectroscopy offers great advantages for the determination of functional groups and structural changes in materials [26]. Figure 2 shows the results of the FTIR analysis (wavenumber range of 4000–450 cm−1) of the biochar samples obtained from both materials at various pyrolysis temperatures. According to IR data tables [27] and previous studies [28,29], the bands at 3300–3500 cm−1 correspond to the vibration of hydroxyl groups, with that at 3468 cm−1 mainly due to the vibration of phenolic hydroxyl groups. The bands at 2918–2850 cm−1 correspond to the symmetrical or asymmetrical stretching vibration of the –CH3 and –CH2 groups of aliphatic or naphthenic hydrocarbons, and the bands at 1730–1600 cm−1 correspond to the stretching vibration of carboxyl C=O groups or C=C and C=O groups in aromatic rings. The bands at 1300–1000 cm−1 are attributed to the stretching vibration of C–O moieties often present in phenols or hydroxyl groups. However, some researchers believe that this band corresponds to the vibration of the C–O–C pyran ring skeleton. The bands at 797 and 466 cm−1 correspond to the vibration absorption of Si–O–Si. From Figure 2, we can see the bands for hydroxyl and phenolic hydroxyl groups (–OH), –CH3 and –CH2 groups of aliphatic or naphthenic hydrocarbons, carboxyl C=O groups, and the C=C and C=O groups of aromatic rings in the biochar samples from rice husk and cotton straw. However, the Si–O–Si vibration absorption band present in the rice-husk biochar was not present in the cotton-straw samples. In the rice-husk biochar, the intensity of the –OH, –CH3, –CH2, C=C, and C=O absorption bands decreased with increasing pyrolysis temperature. This indicates that the presence of these groups in the samples gradually decreased. The changes in the absorption-band intensity for the C–O and Si–O–Si groups were not significant. In the cotton-straw biochar, the absorption-band intensity of the –OH, –CH3, –CH2, C=C, and C=O groups firstly increased before decreasing. It can be concluded that these fingerprint regions were relatively complex.

2.3. Cd2+ Adsorption with Biochar

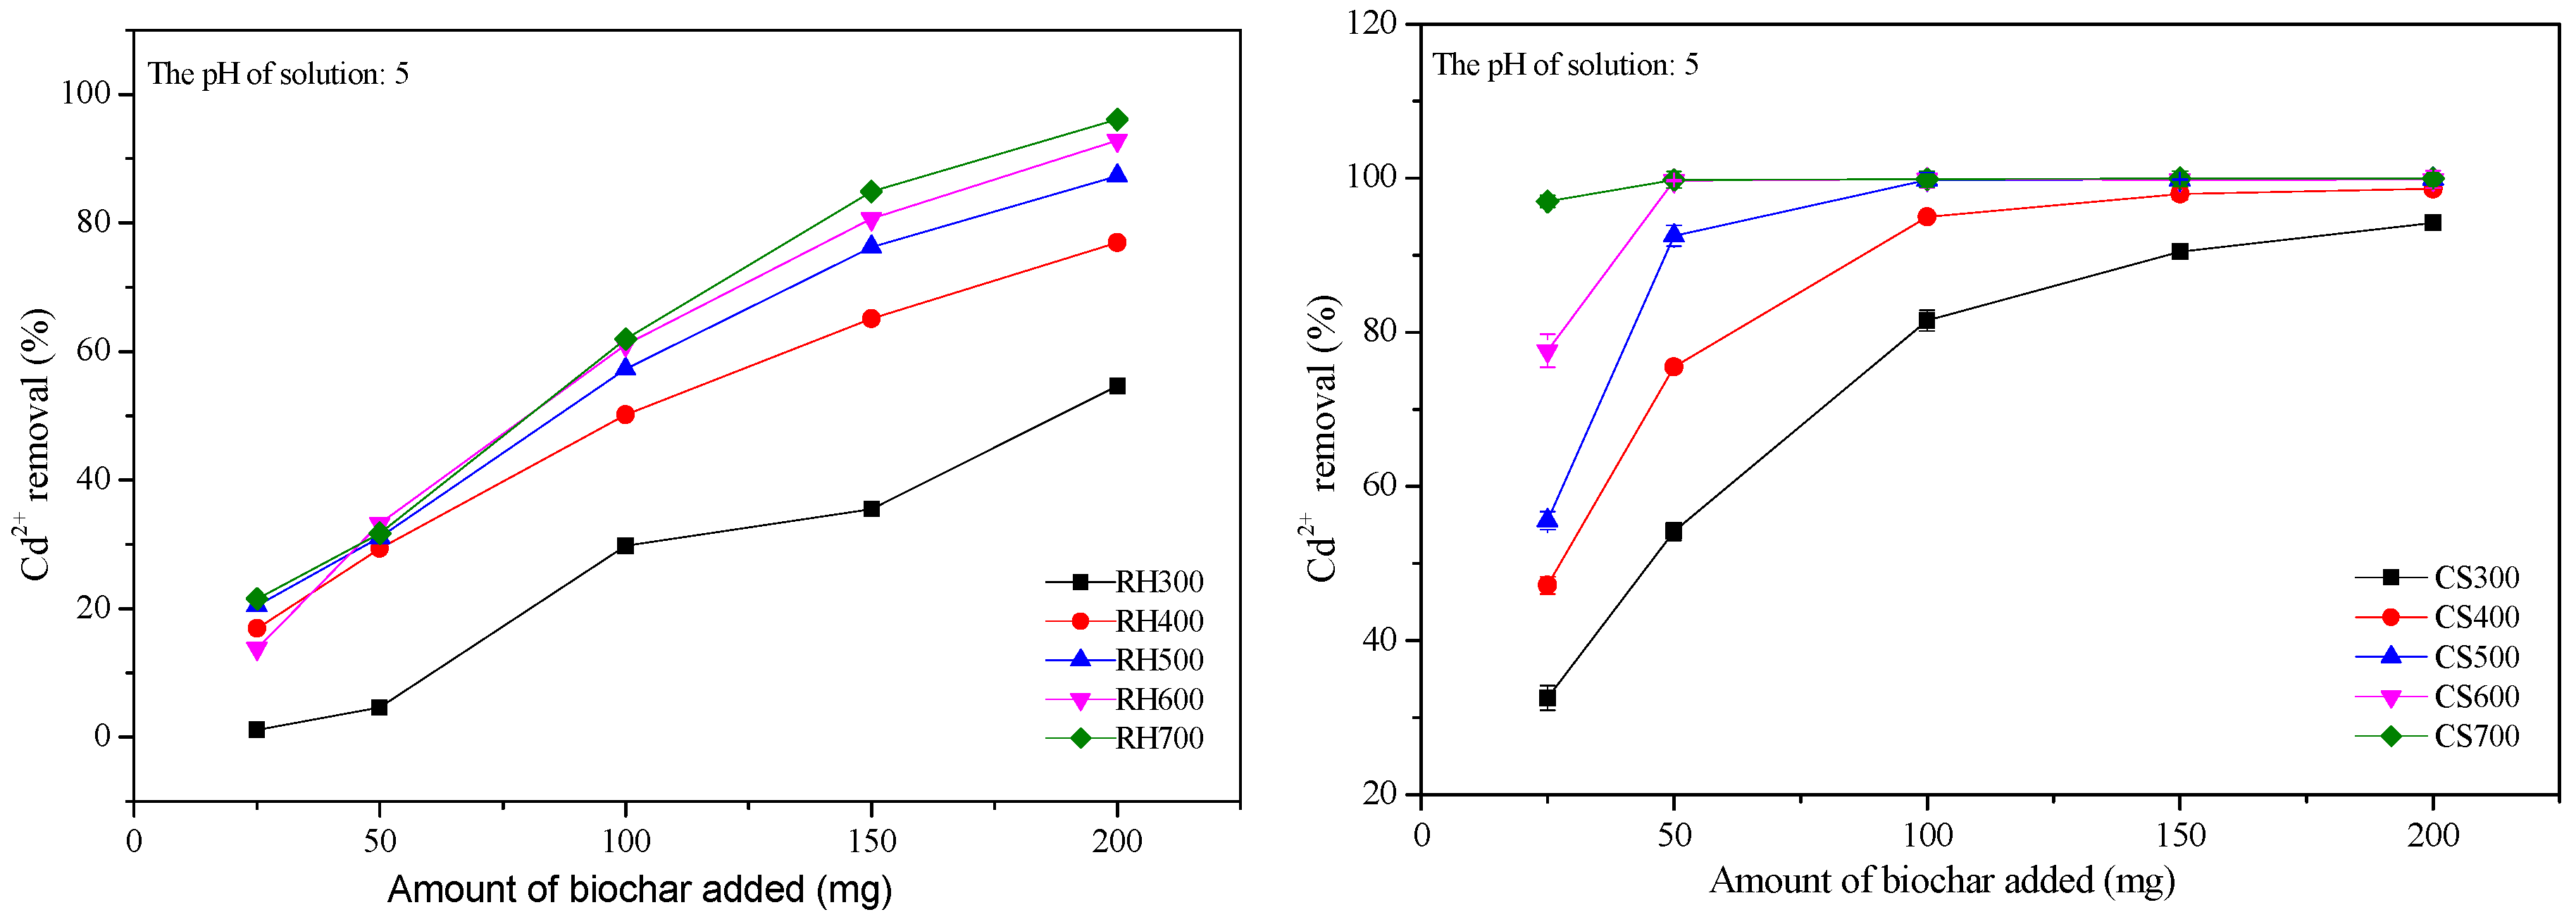
2.3.1. Effect of the Addition of Various Amounts of Biochar on the Cd2+ Removal

From Figure 3, we can see that, at pH 5, the Cd2+ removal of biochar obtained from both materials significantly increased with additive content. A larger biochar amount provided a larger adsorption surface area and a greater number of Cd2+ adsorption sites. Therefore, the removal increased. The highest Cd2+ removal was obtained with 200 mg of the rice-husk biochar, with RH300 affording the lowest (54.63%) removal, and RH700 the highest (96.12%) removal. For the cotton-straw biochar, the Cd2+ removal was highest for 200 mg of CS300 (94.22%). The Cd2+ removal reached 95% when 100 mg of CS400 and 50 mg of CS 500 were employed. Only 50 mg of CS600 was required to remove nearly 100% of Cd2+ ions, while only 25 mg of CS700 was required to achieve a Cd2+ removal of 99.67%. Therefore, huge differences existed in the Cd2+ adsorption by biochar obtained from both materials pyrolysed at various temperatures [30,31]. Upon comparing the two materials, we can see that a smaller amount of the cotton-straw biochar was required to achieve the same removal in a shorter time. Therefore, from an energy-saving perspective, the conditions to obtain the best adsorption performance involve the use of 150 mg of rice husk biochar pyrolysed at 500 °C.

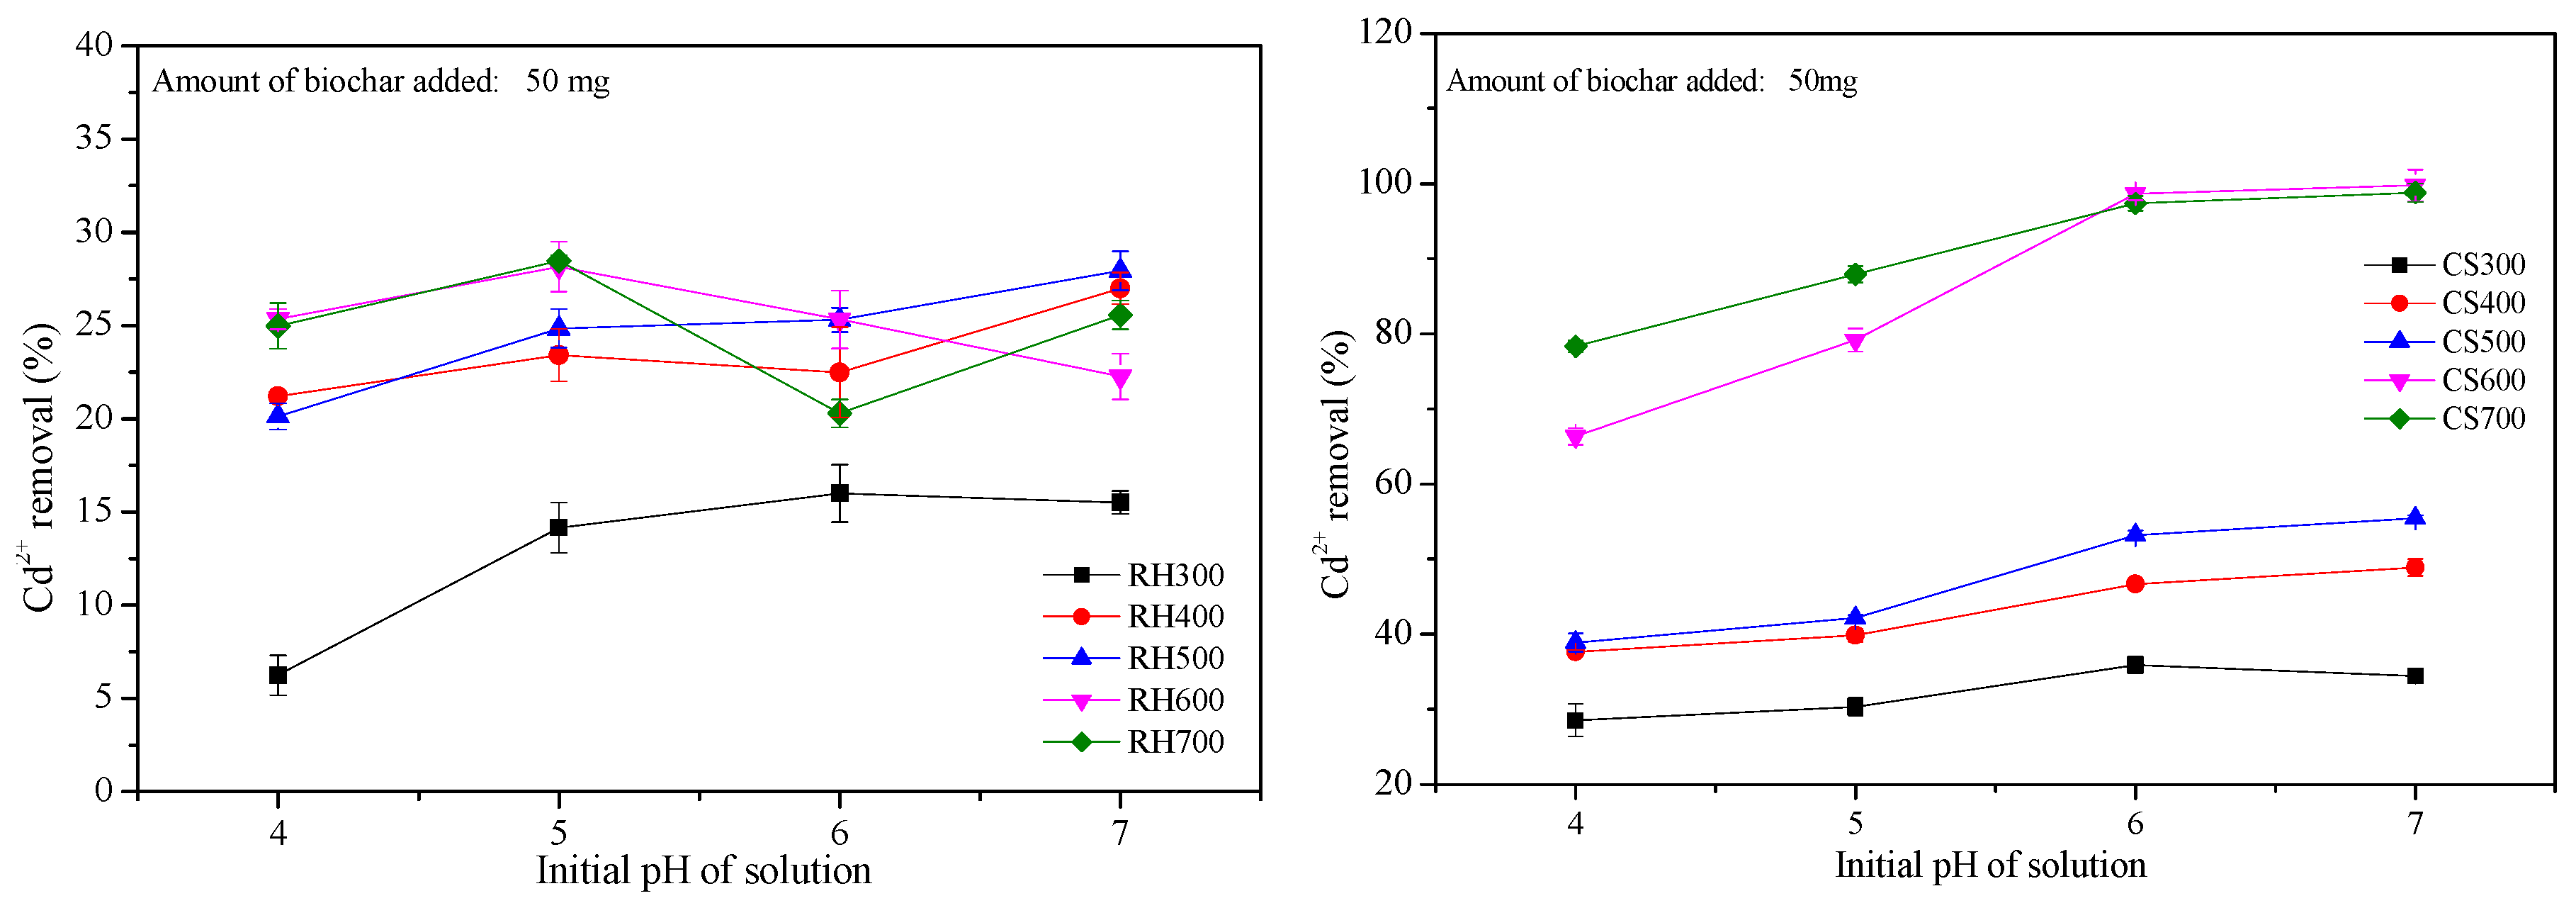
2.3.2. Effect of Various Initial Biochar pH Values on Cd2+ Removal

The pH of the solution not only affects the charge density on the surface of biochar, but also the state of the metal ions, thus affecting the removal of said metal ions by biochar [32]. From Figure 4, we can see that when the pH increased from 4 to 5, the Cd2+ removal with the rice-husk biochar significantly increased (e.g., from 6.24% to 14.15% for sample RH300). However, between pH 5 and 7, no large changes were observed. Therefore, an initial pH of 5 is the best condition for Cd2+ removal with rice-husk biochar. The Cd2+ removal reached its maximum when a pH of 6 was used for cotton-straw biochar, with sample CS300 showing the smallest changes. The Cd2+ removal increased from 28.57% (pH 4) to 35.92% (pH 6), while the removal of Cd2+ by CS600 increased from 66.33% (pH 4) to 98.62% (pH 6). A pH change from 6 to 7 did not result in significant changes in the Cd2+ removal. The isoelectric point of normal biochar is relatively low [33]. When the external pH is greater than the isoelectric points of the acidic functional groups (carboxyl–COOH, and phenolic) on the surface of biochar, these groups start dissociating, resulting in negative charges. Due to the electrostatic effects between Cd2+ and the adsorbent, the higher pH results in more negative charges, and therefore, a greater amount of Cd2+ adsorbed on the surface of biochar [34]. At the same time, due to the electron-shell characteristics of the heavy metal itself, as the pH increases, the degree of hydrolysis increases, and more free hydroxyl ions exist in the solution. Biochar displays greater adsorption capability towards hydroxyl ions than towards free ions [35]. The experimental results when the pH was increased from 4 to 5 for the rice-husk biochar and from 4 to 6 for the cotton-straw biochar confirmed this line of reasoning. However, with increasing pH, the basicity increases and the biochar particles may aggregate [36]. This causes the adsorbed Cd2+ to dissociate into the solution or to be trapped inside biochar aggregates, thus either reducing the removal or hampering the adsorption of further Cd2+, respectively. Further research is required to examine the reasons behind these phenomena. Under our experimental conditions, biochar presented the maximum Cd2+ adsorption at pH 5. When the pH was further increased, the Cd2+ ions in solution existed in the form of CdOH+ or Cd(OH)2, which could precipitate, becoming a main influencing factor on the Cd2+ removal [37].

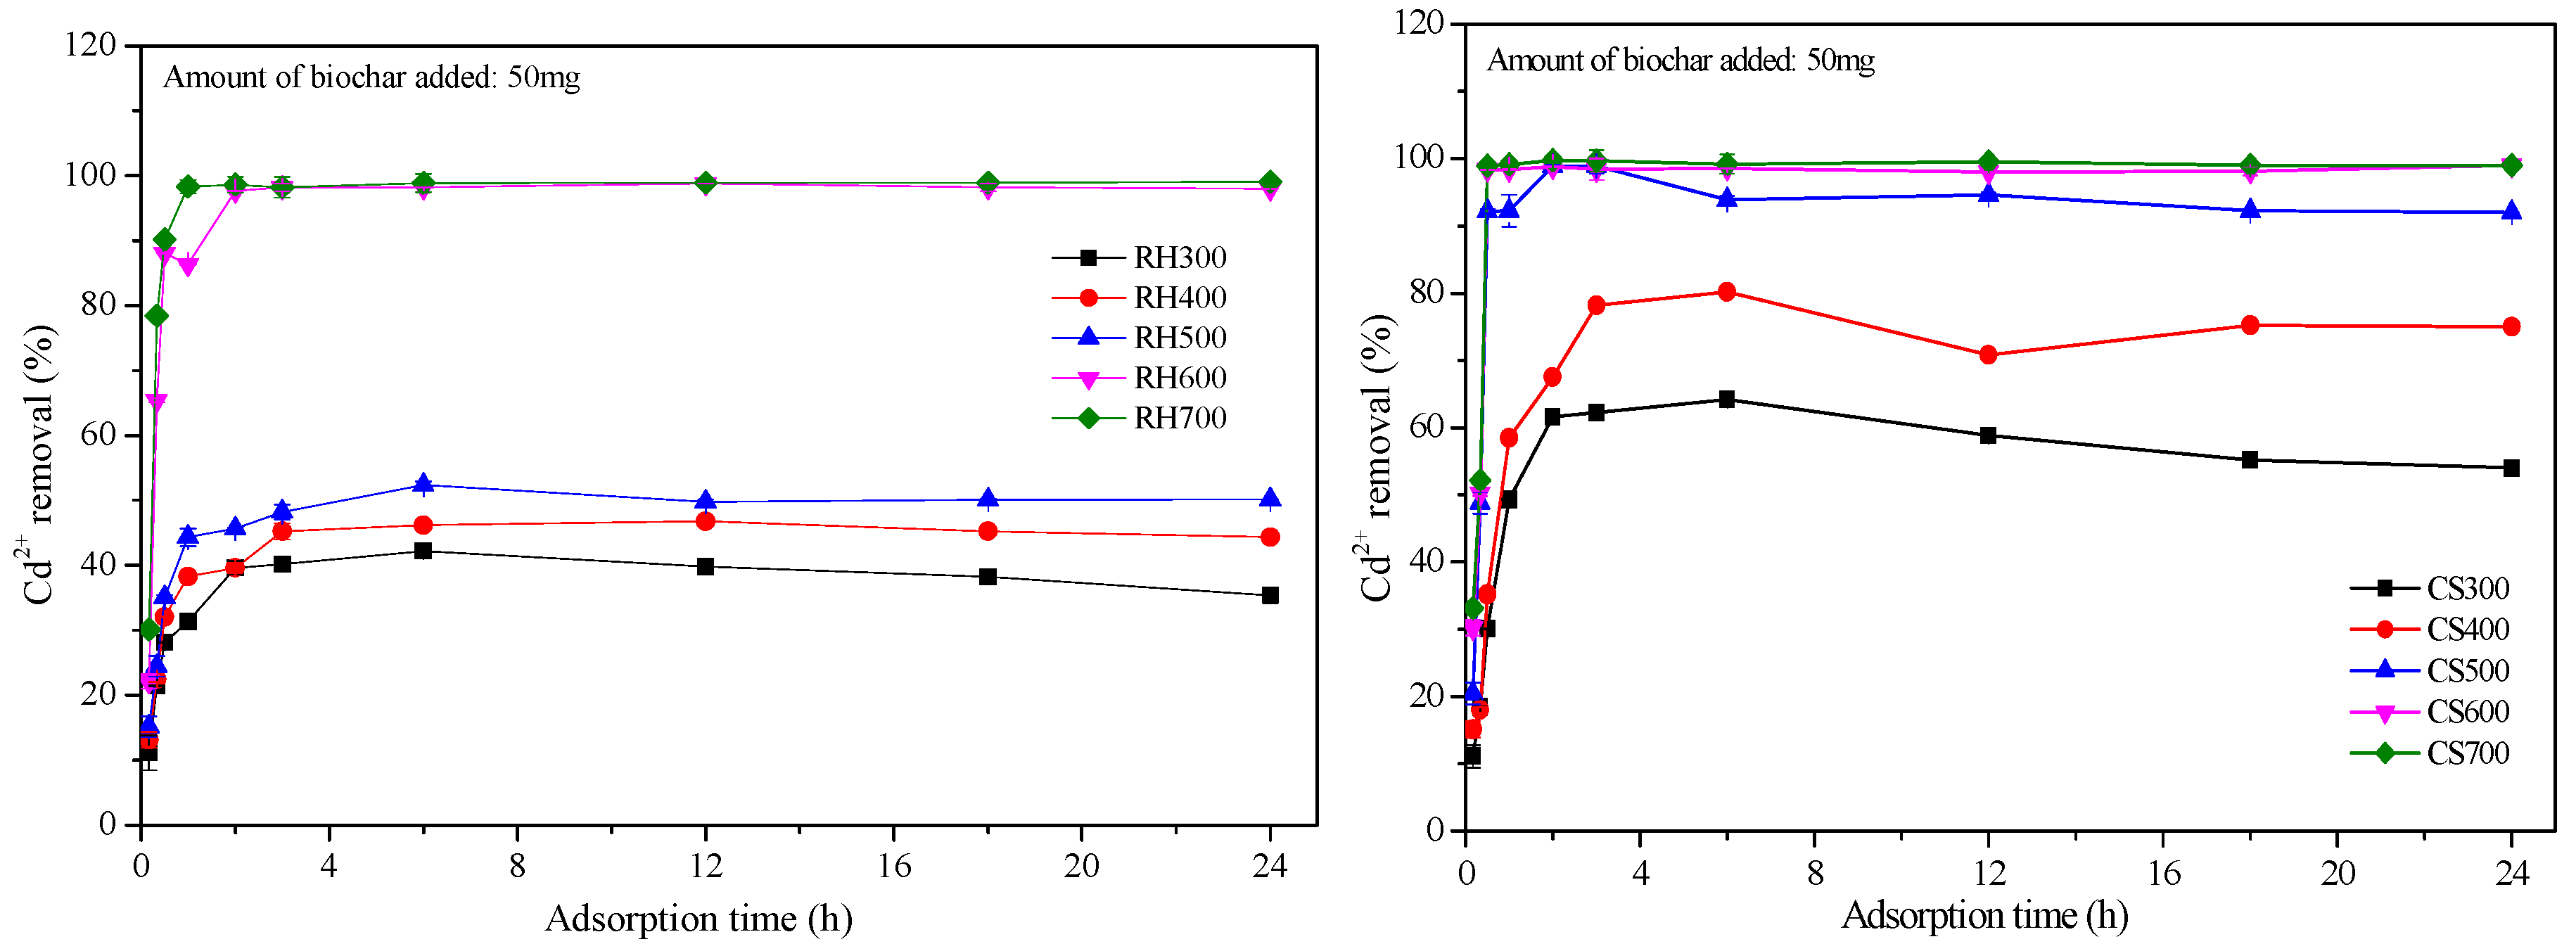
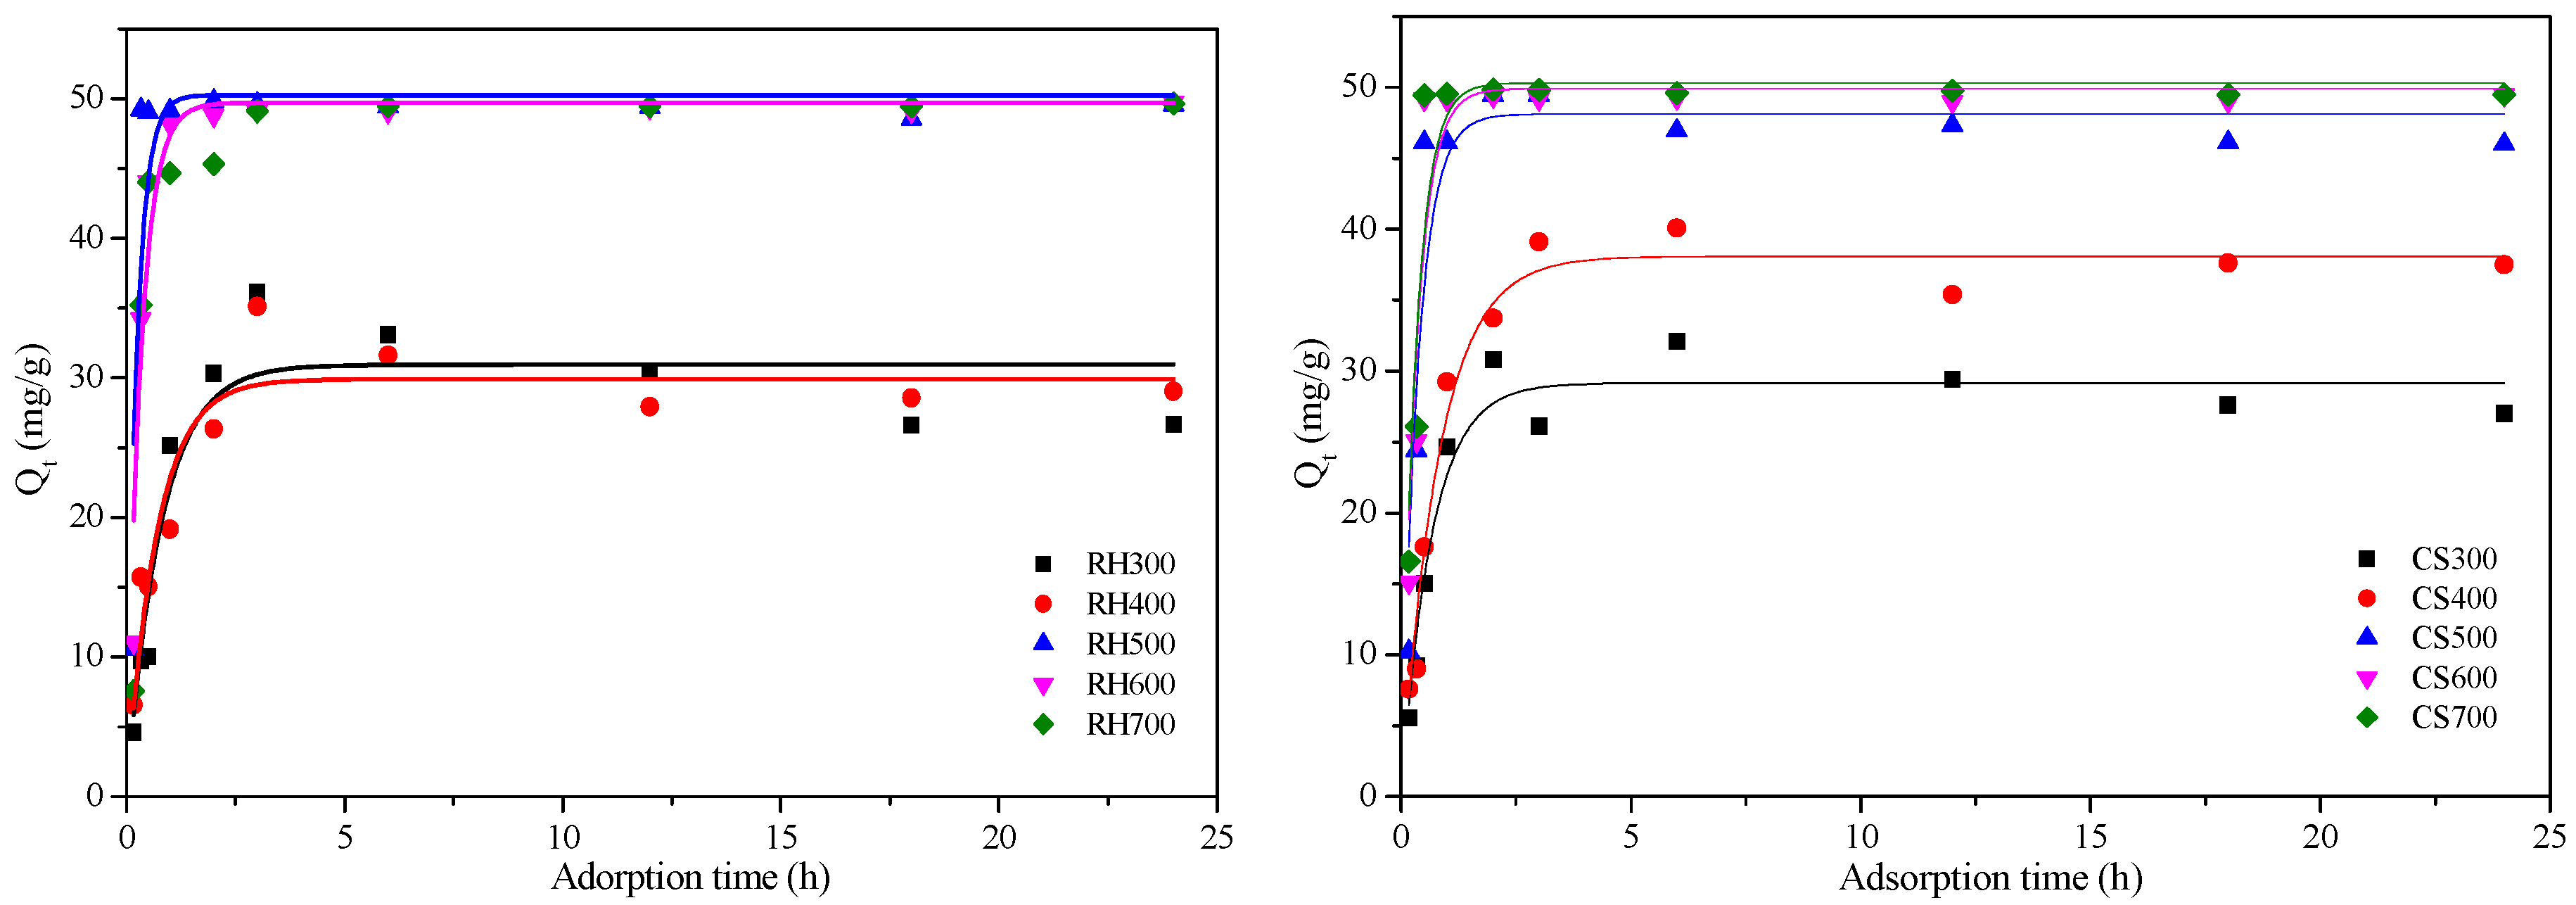
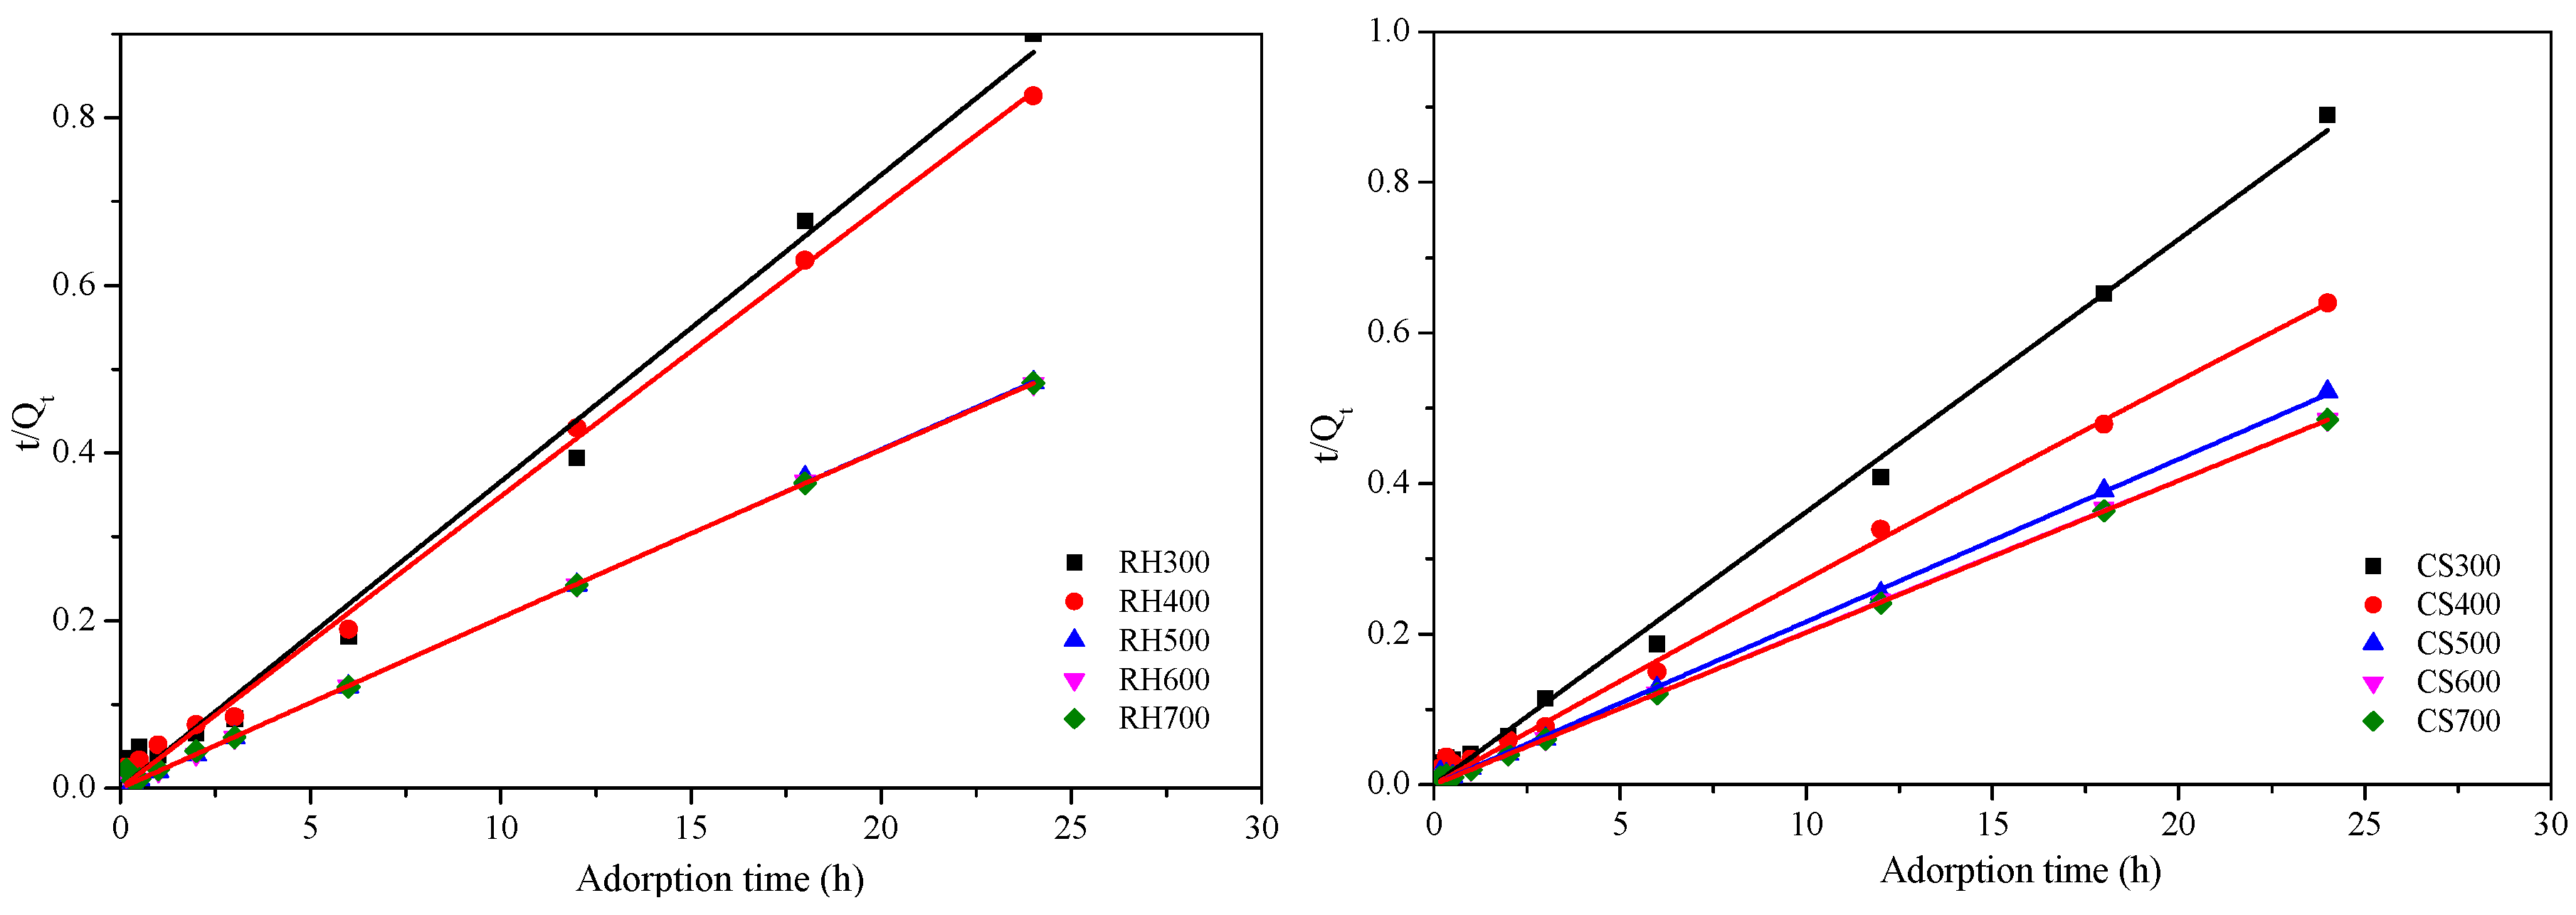
2.3.3. Cd2+ Adsorption Kinetics for Both Types of Biochar Samples

Figure 5 shows the results of the Cd2+ adsorption kinetics for both types of biochar samples obtained at various pyrolysis temperatures. The Cd2+ adsorption trends were consistent, regardless of the type of biochar, with initial rapid adsorption followed by decreased adsorption, whose equilibrium was reached after 6 h. This was due to the mass-transfer driving force induced by the Cd2+ concentration gradient existing between the liquid and solid phase (i.e., the solution and the biochar), and also the adsorption sites available on the biochar surface [38]. At the start of adsorption, the Cd2+ concentration gradient between the two phases was larger, resulting in a greater driving force for mass transfer and a greater adsorption rate. As the adsorption time increased, the Cd2+ concentration gradient decreased, and the adsorption sites on the biochar surface became saturated, resulting in intragranular diffusion becoming dominant. This intragranular adsorption rate was relatively slower. Therefore, the adsorption rate decreased and tended towards the adsorption equilibrium [39]. The higher the pyrolysis temperature, the longer the saturation time became, and the larger the adsorbent amount became, shortening the time required to reach said equilibrium. As such, the system with sample RH700 reached the equilibrium in less than 1 h, while sample CS700 achieved 99.32% of Cd2+ removal within 0.5 h. This was a direct consequence of the increased specific surface area of the biochar with increasing pyrolysis temperature, pH, and the number of surface charges [29].
In order to better evaluate the rate-limiting step and mechanism during the adsorption process, we used pseudo-first-order kinetics (Figure 6) and pseudo-second-order kinetics (Figure 7) models to fit the data (Table 4). From the results, we can see that the pseudo-second-order kinetics model provided a better fit, with a coefficient of determination, R2 ≥ 0.990. This model, therefore, better reflected the Cd2+ adsorption process for the rice-husk and cotton-straw biochar. In the reaction rate, the adsorption rate constant (K2) indicates the speed of the adsorption process. The higher the K2 value gets, the faster the adsorption becomes, and the shorter the time required to reach the equilibrium. With increasing pyrolysis temperature, the adsorption rate for the rice-husk and cotton-straw biochar gradually increased. However, the K2 of biochar produced at 700 °C was smaller than expected. Biochar made from both materials at 600 °C afforded the maximum adsorption rate, with RH600 and CS600 values of 9.09 × 10⁻⁴ mg·g−1·h−1 and 7.58 × 10⁻⁴ mg·g−1·h−1, respectively. From Table 4, the amount of Cd2+ (qm) adsorbed with rice husk biochar following the second-order kinetics model was highest for sample RH300 at 103.13 mg·g−1, although it was only 22.62 mg·g−1 for RH600. In contrast, the lowest amount of Cd2+ adsorbed by the cotton-straw biochar was 110.29 mg·g−1 for sample CS700.
The kinetics results for Cd2+ adsorption revealed that the performances of these two biochar materials fit the pseudo-second-order kinetics model well, indicating that the adsorption of Cd2+ by the rice-husk and cotton-straw biochar was mainly controlled by chemical adsorption, although the adsorption data for samples RH600, CS300, and CS400 were also satisfactorily fitted with the pseudo-first-order kinetics equations. The Cd2+ adsorption on these samples may occur through diffusion, in addition to chemical adsorption. Some researchers [40] suggested that this adsorption may be associated with the specific surface area. The chemical adsorption of Cd2+ on biochar mainly relies on an electrostatic ion-exchange mechanism. However, ion-exchange effects are not specific. When the external pH increases and more H+ ions dissociate from functional groups, a larger number of negative charges remain on the surface of the biochar to adsorb Cd2+. The increasing adsorbent amount increases the adsorption rate [41]. In our study, the greater the pyrolysis temperature, the higher the biochar pH became, and hence, the faster the adsorption rate became. The time taken for the biochar obtained at high temperatures (600 and 700 °C) to reach the adsorption equilibrium was shorter than that for the samples obtained at a moderate temperature (500 °C), which, in turn, was shorter than that for the samples pyrolysed at low temperatures (300 and 400 °C). However, the relationship between qm in the pseudo second-order kinetics and the amount of adsorbed Cd2+ was not evident. This may be directly related to the functional groups in the synthesised biochar. A study by Xu et al. [25] revealed that Cd2+ adsorption by corn straw mainly occurred through surface hydroxyl (–C–OH) and carbonyl (–C=O) groups. Hence, further research is required to understand which functional groups are present in rice-husk and cotton-straw biochar, and how the pyrolysis temperature changes said functional groups. In recent years, cation–π interactions attracted great attention [42]. These interactions are mainly determined by the aromaticity of the biochar surface. The more abundant the π-conjugated aromatic structure, the greater the ability of biochar is to donate electrons, and the more evident this interaction is. However, the adsorption affinity in ion-exchange phenomena is stronger than cation–π interactions, also presenting some electrostatic effects. However, the pH does not affect such ion exchange [43]. From the SEM results, we can see that the aromaticity increased with pyrolysis temperature. In addition, the Cd2+ adsorption rate on biochar produced at high temperatures was far faster than that on the materials produced at moderate and low temperatures (Figure 5). This may be due to cation–π interactions. Further research is required to determine whether cation-exchange effects or cation–π interactions are greater. In addition, some researchers [44] suggested that Cd2+ removal with biochar obtained by pyrolysis at high temperature was mainly due to Cd2+ precipitation caused by the increased pH (in our study, RH700 was able to remove more than 90% of Cd2+ in 0.5 h, while CS700 removed 99% of Cd2+ in 20 min). However, according to the solubility product constant and initial concentration at 25 °C, the initial pH at which Cd(OH)2 precipitation occurs is 10.75 [45]. Considering the experimental conditions employed in this study and the highest pH value of biochar for sample CS700 (pH = 10.42), we can conclude that precipitation was not the main mechanism for Cd2+ removal in this case.

3. Conclusions

The yield of both biochar materials gradually decreased with increasing temperature. As rice husk contains SiO2, the yield of rice-husk biochar far exceeded that of cotton-straw biochar. At increasing carbonisation temperatures, the biochar pH, specific surface area, and aromaticity of both materials increased, while their structure became more stable, and their hydrophilicity and polarity decreased. The surfaces of rice-husk and cotton-straw biochar are rich in functional groups. However, as the pyrolysis temperature increased, the absorption bands for some functional groups underwent large changes, which ultimately affected the cadmium adsorption capability of the materials. As the pyrolysis temperature increased, the amount of adsorbed Cd2+ on the two biochar materials increased. The Cd2+ adsorption data for both biochar materials were well fitted by the pseudo-second-order kinetics model. The adsorption mechanism may be due to ion exchange and cation–π interactions. In addition, it is obvious that the large specific surface area of biochar must also play an important role in the Cd2+ adsorption process.

Author Contributions

J.L. conceived and designed the experiments; S.S. and T.L. performed the experiments; Q.L. analyzed the data; X.Z. contributed reagents/materials/analysis tools; Y.J. and S.S. wrote the paper.

Acknowledgments

The present study was financially supported by Scientific Research Project of Beijing Educational Committee (KM201610020009) and National key R&D program (2016YFD0200301 and 2016YFD0801003). This research received no external funding. The authors thank all scientists associated with the research. This research received no external funding. The authors thank all scientists associated with the research.

Conflicts of Interest

The authors declare no conflict of interest.

References

  1. Coen, N.; Mothersill, C.; Kadhim, M.; Wright, E.G. Heavy metals of relevance to human health induce genomic instability. J. Pathol. 2001, 195, 293–299. [Google Scholar] [CrossRef] [PubMed]
  2. Zhao, F.J.; Ma, Y.; Zhu, Y.G.; Tang, Z.; McGrath, S.P. Soil contamination in China: Current status and mitigation strategies. Environ. Sci. Technol. 2015, 49, 750–759. [Google Scholar] [CrossRef] [PubMed]
  3. Wu, H.; Liao, Q.; Chillrud, S.N.; Yang, Q.; Huang, L.; Bi, J.; Yan, B. Environmental Exposure to Cadmium: Health Risk Assessment and its Associations with Hypertension and Impaired Kidney Function. Sci Rep. 2016, 6, 29989. [Google Scholar] [CrossRef] [PubMed] [Green Version]
  4. Zeng, G.; Liu, Y.; Tang, L.; Yang, G.; Pang, Y.; Zhang, Y.; Zhou, Y.; Li, Z.; Li, M.; Lai, M.; et al. Enhancement of Cd(II) adsorption by polyacrylic acid modified magnetic mesoporous carbon. Chem. Eng. J. 2015, 259, 153–160. [Google Scholar] [CrossRef]
  5. Chen, T.; Zhou, Z.; Han, R.; Meng, R.; Wang, H.; Lu, W. Adsorption of cadmium by biochar derived from municipal sewage sludge: Impact factors and adsorption mechanism. Chemosphere 2015, 134, 286–293. [Google Scholar] [CrossRef] [PubMed]
  6. Chen, T.; Zhou, Z.; Han, R.; Meng, R.; Wang, H.; Lu, W. Adsorption and desorption of phenanthrene on carbon nanotubes in simulated gastrointestinal fluids. Environ. Sci. Technol. 2011, 45, 6018–6024. [Google Scholar]
  7. Koptsik, G.N. Modern approaches to remediation of heavy metal polluted soils: A review. Eurasian Soil Sci. 2014, 47, 707–722. [Google Scholar] [CrossRef]
  8. Lehmann, J.; Joseph, S. Biochar for Environmental Management: Science and Technology; Earthscan: London, UK, 2009; pp. 33–52. [Google Scholar]
  9. Liu, Z.; Zhang, F.S. Removal of lead from water using biochars prepared from hydrothermal liquefaction of biomass. J. Hazard. Mater. 2009, 167, 933–939. [Google Scholar] [CrossRef] [PubMed] [Green Version]
  10. ISO9277–1995 Determination of the Specific Surface Area of Solids by Gas Adsorption Using the BET Method; Powder Metallurgy Industry; International Organization for Standardization: Geneva, Switzerland, 1996.
  11. Singh, B.; Fang, Y.; Johnston, C.T. A Fourier-Transform Infrared Study of Biochar Aging in Soils. Soil Sci. Soc. Am. J. 2016, 80, 613–622. [Google Scholar] [CrossRef] [PubMed]
  12. Nassar, N.N. Rapid removal and recovery of Pb(II) from wastewater by magnetic nanoadsorbents. J. Hazard. Mater. 2010, 184, 538–546. [Google Scholar] [CrossRef] [PubMed]
  13. Wu, H.; Yip, K.; Kong, Z.; Li, C.Z.; Liu, D.; Yu, Y.; Gao, X. Removal and Recycling of Inherent Inorganic Nutrient Species in Mallee Biomass and Derived Biochars by Water Leaching. Ind. Eng. Chem. Res. 2011, 50, 12143–12151. [Google Scholar] [CrossRef]
  14. An, Z.L. Biochar Preparation and Its Pb2+ Adsorption Characteristics. Master’s Thesis, Huaqiao University, Xiamen, China, 2011. (In Chinese). [Google Scholar]
  15. Liou, T.H. Preparation and characterization of nano-structured silica from rice husk. Mater. Sci. Eng. A 2004, 364, 313–323. [Google Scholar] [CrossRef]
  16. Phuong, H.T.; Uddin, M.A.; Kato, Y. Characterization of Biochar from Pyrolysis of Rice Husk and Rice Straw. J. Biobased Mater. Bioenergy 2015, 9, 439–446. [Google Scholar] [CrossRef]
  17. Lehmann, J. A handful of carbon. Nature 2007, 443, 143–144. [Google Scholar] [CrossRef] [PubMed]
  18. Luo, Y. Characteristics of Biochar Derived from Arundo Donax and Its Inhibition of Soil Nitroous Oxide Discharge. Master’s Thesis, Ocean University of China, Qingdao, China, 2012. (In Chinese). [Google Scholar]
  19. Sinha, R.; Kumar, S.; Singh, R.K. Production of biofuel and biochar by thermal pyrolysis of linseed seed. Biomass Convers. Biorefin. 2013, 3, 327–335. [Google Scholar] [CrossRef]
  20. Tsai, W.T.; Huang, C.N.; Chen, H.R.; Cheng, H.Y. Pyrolytic Conversion of Horse Manure into Biochar and Its Thermochemical and Physical Properties. Waste Biomass Valoriz. 2015, 6, 975–981. [Google Scholar] [CrossRef]
  21. Nelson, N.O.; Agudelo, S.C.; Yuan, W.; Gan, J. Nitrogen and phosphorus availability in biochar-amended soils. Soil Sci. 2011, 176, 218–226. [Google Scholar] [CrossRef]
  22. Xu, G.; Zhang, Y.; Wu, Y.; Shao, H.B.; Qin, S. Effects of Biochar Application on Nitrogen and Phosphorus Availability in Soils: A Review. Sci. Sin. Vitae 2016, 46, 1085–1090. (In Chinese) [Google Scholar]
  23. Hardie, M.; Clothier, B.; Bound, S.; Oliver, G.; Close, D. Does biochar influence soil physical properties and soil water availability? Plant Soil 2014, 376, 347–361. [Google Scholar] [CrossRef]
  24. Liu, P.; Wang, Q.; Yan, D.; Fang, W.; Mao, L.; Wang, D.; Li, Y.; Ouyang, C.; Guo, M.; Cao, A. Effects of Biochar Amendment on Chloropicrin Adsorption and Degradation in Soil. Energies 2016, 9, 869. [Google Scholar] [CrossRef]
  25. Nartey, O.D.; Zhao, B. Biochar Preparation, Characterization, and Adsorptive Capacity and Its Effect on Bioavailability of Contaminants: An Overview. Adv. Mater. Sci. Eng. 2014, 2014, 715398. [Google Scholar] [CrossRef]
  26. Xu, N.N.; Lin, D.S.; Xu, Y.M.; Xie, Z.L.; Liang, X.F.; Guo, W.J. Adsorption of Aquatic Cd2+ by Biochar Obtained from Corn Stover. J. Agro-Environ. Sci. 2014, 33, 958–964. (In Chinese) [Google Scholar]
  27. Chia, C.H.; Gong, B.; Joseph, S.D.; Marjo, C.E.; Munroe, P.; Rich, A.M. Imaging of mineral-enriched biochar by FTIR, Raman and SEM–EDX. Vib. Spectrosc. 2012, 62, 248–257. [Google Scholar] [CrossRef]
  28. Xu, X.; Cao, X.; Zhao, L.; Wang, H.; Yu, H.; Gao, B. Removal of Cu, Zn, and Cd from aqueous solutions by the dairy manure-derived biochar. Environ. Sci. Pollut. Res. 2013, 20, 358–368. [Google Scholar] [CrossRef] [PubMed]
  29. Cao, X.D.; Harris, W. Properties of dairy-manure-derived biochar pertinent to its potential use in remediation. Bioresour. Technol. 2010, 101, 5222–5228. [Google Scholar] [CrossRef] [PubMed]
  30. Hai, T.N.; You, S.J.; Chao, H.P. Adsorption Capacity and Mechanism of Cadmium on Orange Peel- Derived Biochar at Different Pyrolysis Temperatures and Times. J. Solid Waste Technol. Manag. 2016, 42, 709–720. [Google Scholar]
  31. Guo, W.J.; Liang, X.F.; Lin, D.S.; Xu, Y.M.; Wang, L.; Sun, Y.B.; Qin, X. Adsorption of Cd2+ on biochar from aqueous solution. Environ. Sci. 2013, 34, 3716–3721. [Google Scholar]
  32. Wang, X.P.; Xue, Y.W.; Cheng, X.R.; Liu, Y. An Overview of Heavy Metal Removal Using Biochar. China Rural Water Hydropower 2013, 12, 51–56. [Google Scholar]
  33. Zheng, H.; Wang, Z.; Zhao, J.; Herbert, S.; Xing, B. Sorption of antibiotic sulfamethoxazole varies with biochars produced at different temperatures. Environ. Pollut. 2013, 181, 60–67. [Google Scholar] [CrossRef] [PubMed]
  34. Liu, Y.Y.; Qin, H.Z.; Li, L.Q.; Pan, G.X.; Zhang, X.H.; Zheng, J.W.; Han, X.J.; Yu, X.Y. Adsorption of Cd2+ and Pb2+ in aqueous solution by biochars produced from the pyrolysis of different crop feedstock. Ecol. Environ. Sci. 2012, 21, 146–152. (In Chinese) [Google Scholar]
  35. Zhang, H.M.; Xu, M.G.; Lv, J.L.; Li, J.M.; Liu, H.X. Study on the effects of pH on cadmium adsorption and analysis by soil machine components. J. Agro-Environ. Sci. 2005, 24, 320–324. (In Chinese) [Google Scholar]
  36. Kołodyńska, D.; Wnętrzak, R.; Leahy, J.J.; Hayes, M.H.; Kwapiński, W.; Hubicki, Z. Kinetic and adsorptive characterization of biochar in metal ions removal. Chem. Eng. J. 2012, 197, 295–305. [Google Scholar] [CrossRef]
  37. Chen, X.; Chen, G.; Chen, L.; Chen, Y.; Lehmann, J.; McBride, M.B.; Hay, A.G. Adsorption of copper and zinc by biochars produced from pyrolysis of hardwood and corn straw in aqueous solution. Bioresour. Technol. 2011, 102, 8877–8884. [Google Scholar] [CrossRef] [PubMed]
  38. Ma, F.F.; Zhao, B.W.; Diao, J.R. Adsorptive characteristics of cadmium onto biochar produced from pyrolysis of wheat straw in aqueous solution. China Environ. Sci. 2017, 37, 551–559. (In Chinese) [Google Scholar]
  39. Scheidegger, A.M.; Sparks, D.L. Kinetics of the formation and the dissolution of nickel surface precipitates on pyrophyllite. Chem. Geol. 1996, 132, 157–164. [Google Scholar] [CrossRef]
  40. Li, R.Y.; Chen, D.; Li, L.Q.; Pan, G.X.; Chen, J.Q.; Guo, H. Adsorption of Pb2+ and Cd2+ in Aqueous Solution by Biochars Derived from Different Crop Residues. J. Agro-Environ. Sci. 2015, 34, 1001–1008. (In Chinese) [Google Scholar]
  41. Yang, Y.T.; Zhang, Y.P. The Characteristics of Cu2+ And Pb2+ Electrostatic and Specific Adsorptions of Constant Charge Soil Colloids. Acta Pedol. Sin. 2003, 40, 102–109. (In Chinese) [Google Scholar]
  42. Cho, H.H.; Wepasnick, K.; Smith, B.A.; Bangash, F.K.; Fairbrother, D.H.; Ball, W.P. Sorption of aqueous Zn(II) and Cd(II) by multiwall carbon nanotubes: The relative roles of oxygen-containing functional groups and carbon. Langmuir 2009, 26, 967–981. [Google Scholar] [CrossRef] [PubMed]
  43. Ma, J.C.; Dougherty, D.A. The cation-π interaction. Chem. Rev. 1997, 97, 1303–1324. [Google Scholar] [CrossRef] [PubMed]
  44. Inyang, M.; Gao, B.; Yao, Y.; Xue, Y.; Zimmerman, A.R.; Pullammanappallil, P.; Cao, X. Removal of heavy metals from aqueous solution by biochars derived from anaerobically digested biomass. Bioresour. Technol. 2012, 110, 50–56. [Google Scholar] [CrossRef] [PubMed]
  45. Dai, J.; Liu, Y.S. Adsorption of Pb2+ and Cd2+ onto Biochars Derived from Pyrolysis of Four Kinds of Biomasses. Acta Sci. Nat. Univ. Pekin. 2013, 49, 1075–1082. (In Chinese) [Google Scholar]
Figure 1. Scanning electron microscopy (SEM) images of the biochar materials obtained from rice husk (RH) and cotton straw (CS) at various pyrolysis temperatures (300, 400, 500, 600, and 700 °C).
Applsci 08 01019 g001
Figure 2. Fourier-transform infrared (FTIR) spectra of the biochar samples obtained at various pyrolysis temperatures. Notes: RH300, RH400, RE500, RH600, and RH700 indicate that rice husk were pyrolyzed at 300, 400, 500, 600 and 700 °C, respectively; CS300, CS400, CS500, CS600, and CS700 indicate that cotton straw were pyrolyzed at 300, 400, 500, 600 and 700 °C, respectively.
Applsci 08 01019 g002
Figure 3. Effect of the addition of various biochar amounts on Cd2+ removal. Notes: RH300, RH400, RE500, RH600, and RH700 indicate that rice husk were pyrolyzed at 300, 400, 500, 600 and 700 °C, respectively; CS300, CS400, CS500, CS600, and CS700 indicate that cotton straw were pyrolyzed at 300, 400, 500, 600 and 700 °C, respectively.
Applsci 08 01019 g003
Figure 4. Effects of the solution pH on Cd2+ removal. Notes: RH300, RH400, RE500, RH600, and RH700 indicate that rice husk were pyrolyzed at 300, 400, 500, 600 and 700 °C, respectively; CS300, CS400, CS500, CS600, and CS700 indicate that cotton straw were pyrolyzed at 300, 400, 500, 600 and 700 °C, respectively.
Applsci 08 01019 g004
Figure 5. Effect of various adsorption times on Cd2+ removal by both sets of biochar samples. Notes: RH300, RH400, RE500, RH600, and RH700 indicate that rice husk were pyrolyzed at 300, 400, 500, 600 and 700 °C, respectively; CS300, CS400, CS500, CS600, and CS700 indicate that cotton straw were pyrolyzed at 300, 400, 500, 600 and 700 °C, respectively.
Applsci 08 01019 g005
Figure 6. First-order kinetics analysis for Cd2+ adsorption by both sets of biochar samples. Notes: RH300, RH400, RE500, RH600, and RH700 indicate that rice husk were pyrolyzed at 300, 400, 500, 600 and 700 °C, respectively; CS300, CS400, CS500, CS600, and CS700 indicate that cotton straw were pyrolyzed at 300, 400, 500, 600 and 700 °C, respectively.
Applsci 08 01019 g006
Figure 7. Second-order kinetics analysis for Cd2+ adsorption by both sets of biochar samples. Notes: RH300, RH400, RE500, RH600, and RH700 indicate that rice husk were pyrolyzed at 300, 400, 500, 600 and 700 °C, respectively; CS300, CS400, CS500, CS600, and CS700 indicate that cotton straw were pyrolyzed at 300, 400, 500, 600 and 700 °C, respectively.
Applsci 08 01019 g007
Table 1. Biochar yield and ash content of the biochar samples obtained from rice husk (RH) and cotton straw (CS) at various pyrolysis temperatures (300, 400, 500, 600, and 700 °C).
BiocharRH300RH400RH500RH600RH700CS300CS400CS500CS600CS700
Yield37.5228.7427.624.8523.3251.6433.6122.2420.9119.92
(%)±0.01±0.01±0.01±0.00±0.00±0.03±0.02±0.02±0.00±0.01
Ash content64.1966.0666.5675.3576.25.548.5211.4512.2912.15
(%)±0.01±0.00±0.01±0.01±0.01±0.00±0.00±0.02±0.01±0.02
Table 2. Biochar pH and elemental composition of the biochar materials obtained at various pyrolysis temperatures.
BiocharpHElement Content (%)Atomic Ratio
NCHOSH/CO/C(O + N)/CC/N
RH3005.310.6745.992.4826.550.010.050.580.5968.64
RH4006.490.5744.232.4220.460.010.050.460.4877.60
RH5008.150.5442.632.0014.870.100.050.350.3678.94
RH6009.200.3938.841.4010.030.030.040.260.2799.59
RH7009.420.3128.441.007.620.100.040.270.2891.74
CS3006.611.2364.043.8129.360.060.060.460.4852.07
CS4008.511.3470.233.3422.000.060.050.310.3352.41
CS5009.721.0174.243.1817.990.300.040.240.2673.50
CS60010.240.9479.152.4114.460.230.030.180.1984.20
CS70010.421.0377.132.1316.390.570.030.210.2374.88
Table 3. Biochar specific surface area, mean pore size, and micropore volume for the materials obtained at various pyrolysis temperatures.
BiocharBrunauer–Emmett–Teller (BET)
Area (m2·g−1)
Mean Pore Size (nm)Micropore Volume (cm3·g−1)
RH30078.4013.6970.009
RH400101.2953.6700.008
RH500292.5953.7720.015
RH600377.7173.8150.032
RH700406.2443.8200.049
CS30035.2583.4170.010
CS400117.5363.0650.011
CS500300.1034.0960.013
CS600500.8073.8070.014
CS700553.7093.7850.052
Table 4. Kinetic parameters of Cd2+ removal by both sets of biochar samples.
SampleFirst-Order KineticsSecond-Order Kinetics
K1 (min−1)qm (mg·g−1)R2K2 (mg·g−1·min−1)qm (mg·g−1)R2
RH3001.0231.080.7833.32 × 10−4103.130.990
RH4001.4329.900.8804.57 × 10−476.540.997
RH5004.2150.240.6885.72 × 10−435.910.999
RH6003.0649.690.9089.09 × 10−422.620.999
RH7002.9549.000.8478.68 × 10−426.660.998
CS3001.5029.150.9394.71 × 10−4168.970.995
CS4001.2238.070.9705.76 × 10−4115.760.995
CS5002.7451.110.8726.13 × 10−4191.240.998
CS6003.0059.900.8427.58 × 10−4127.140.999
CS7003.0962.300.8596.31 × 10−4110.290.999

