Fatigue Strength Assessment of Steel Rollers: On the Reliability of the Strain Energy Density Approach on Real Components


Abstract
1. Introduction
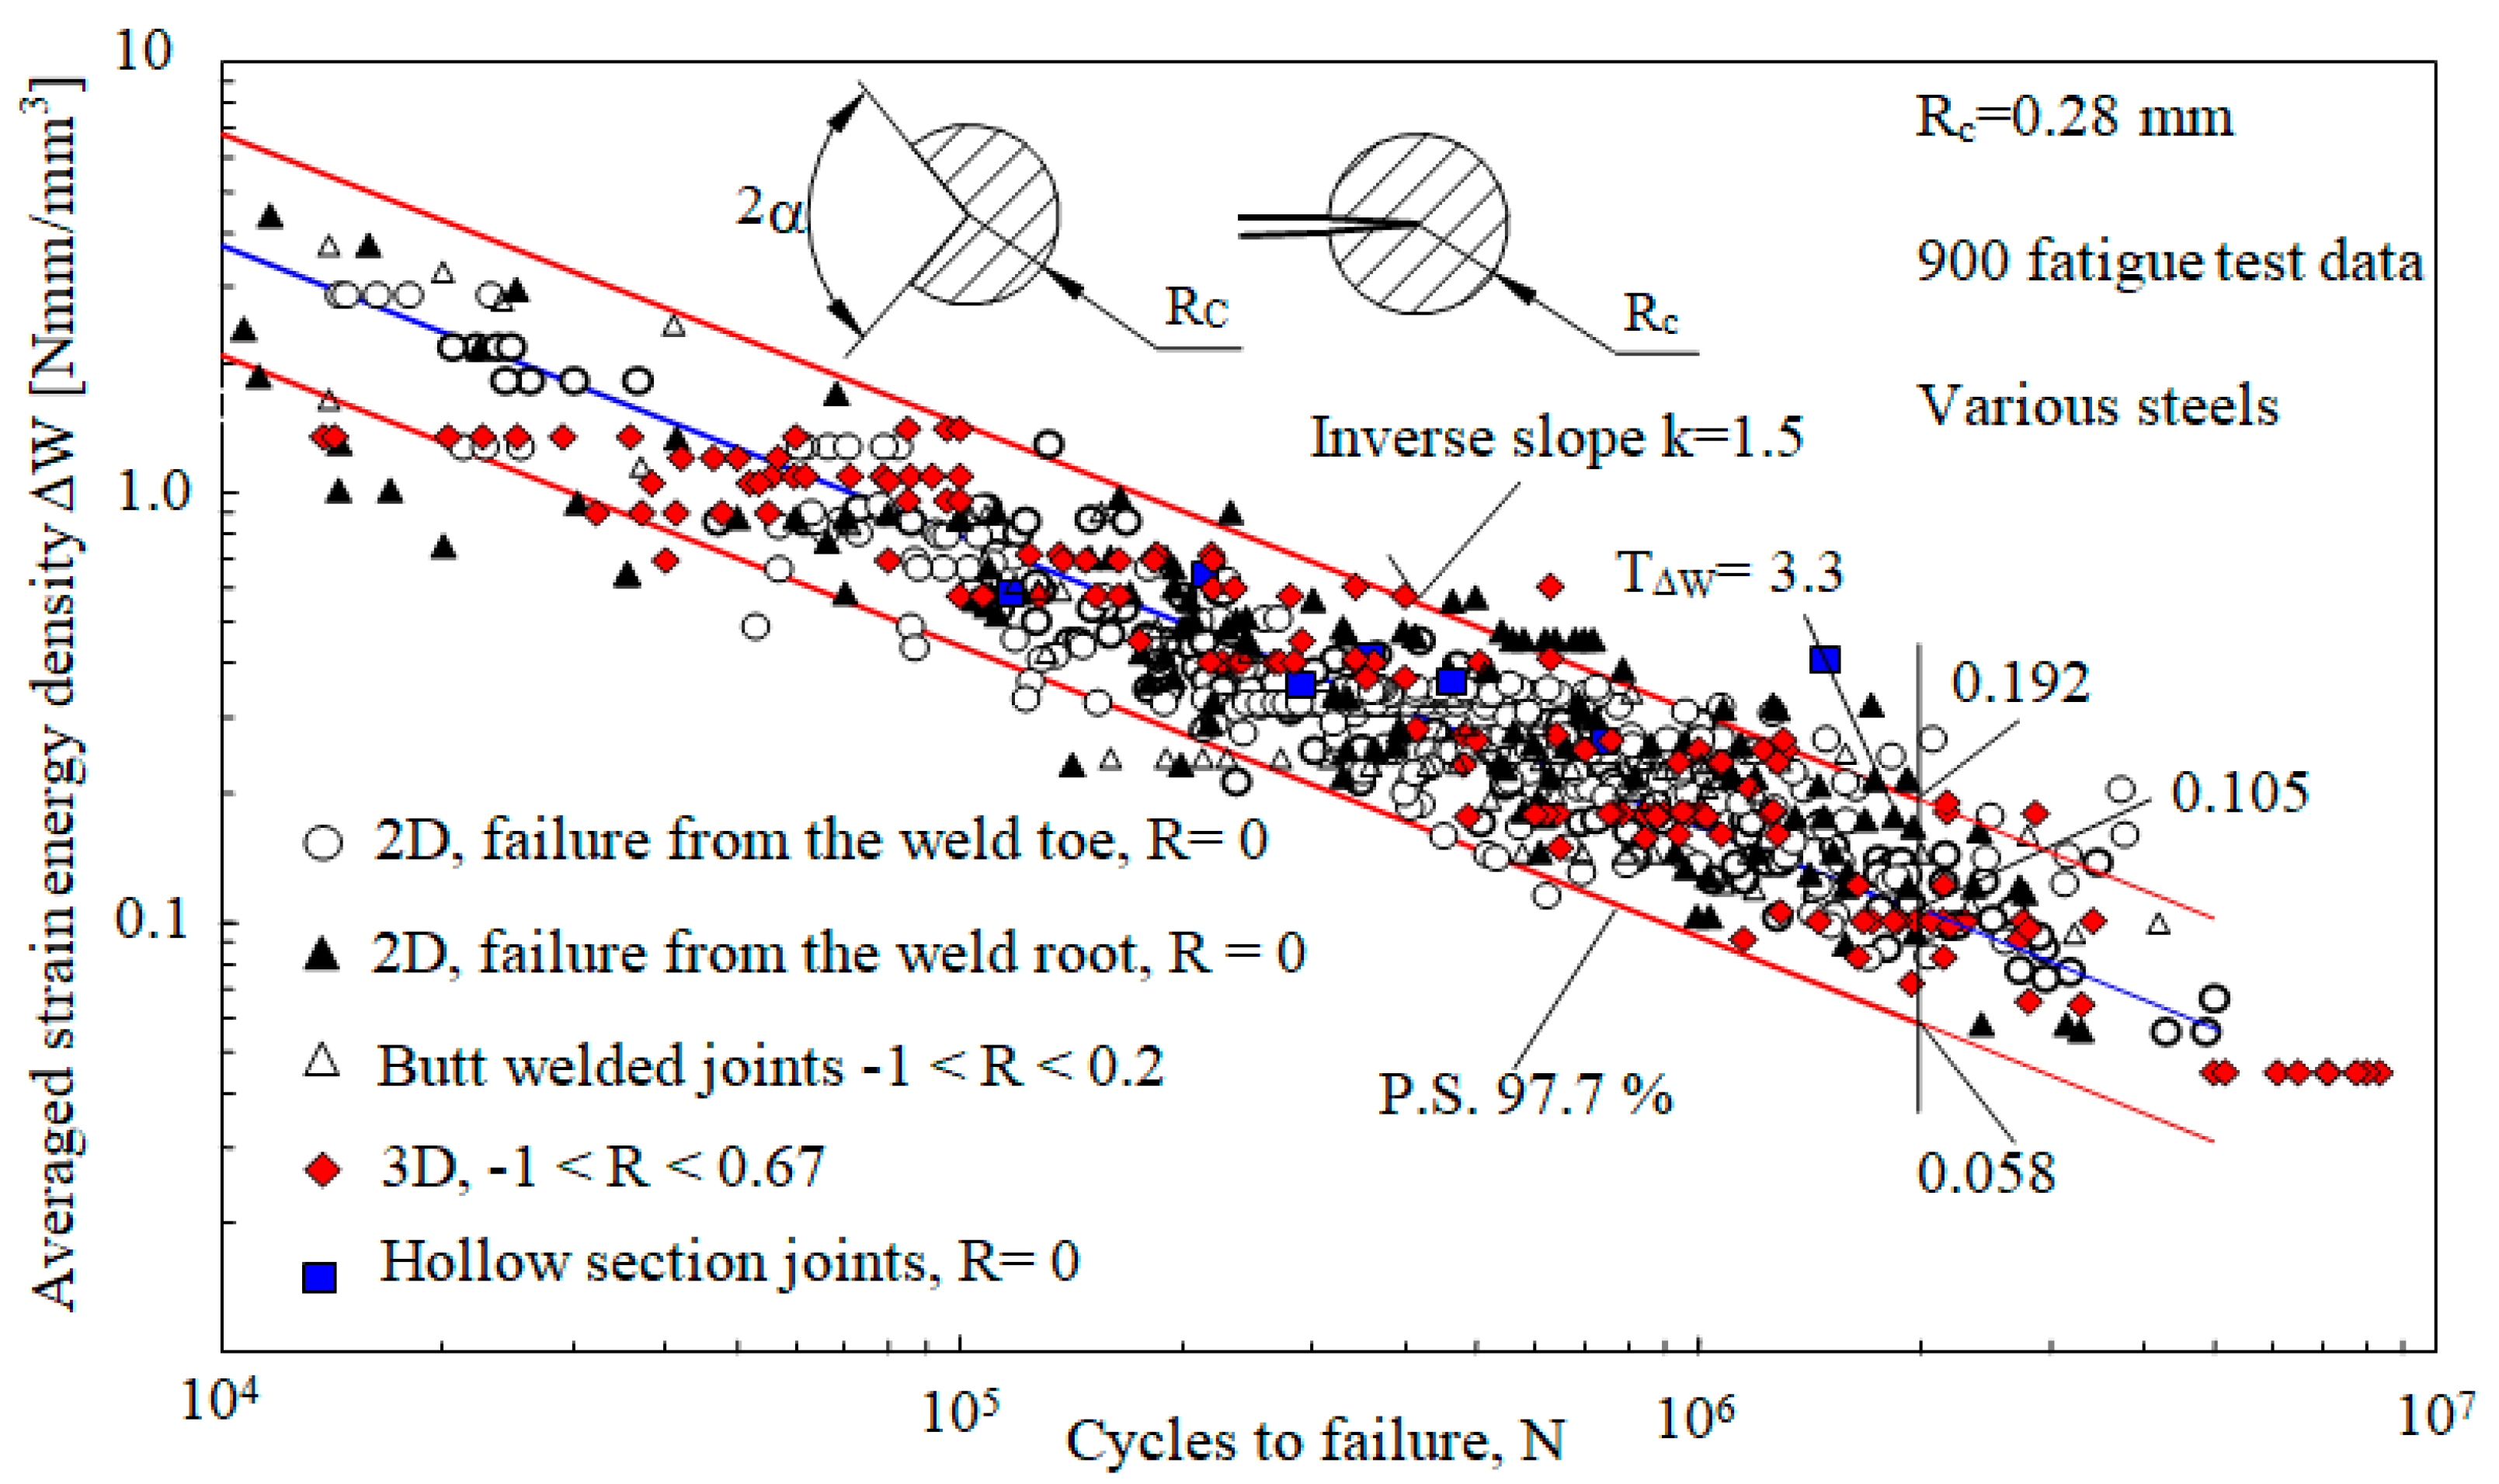
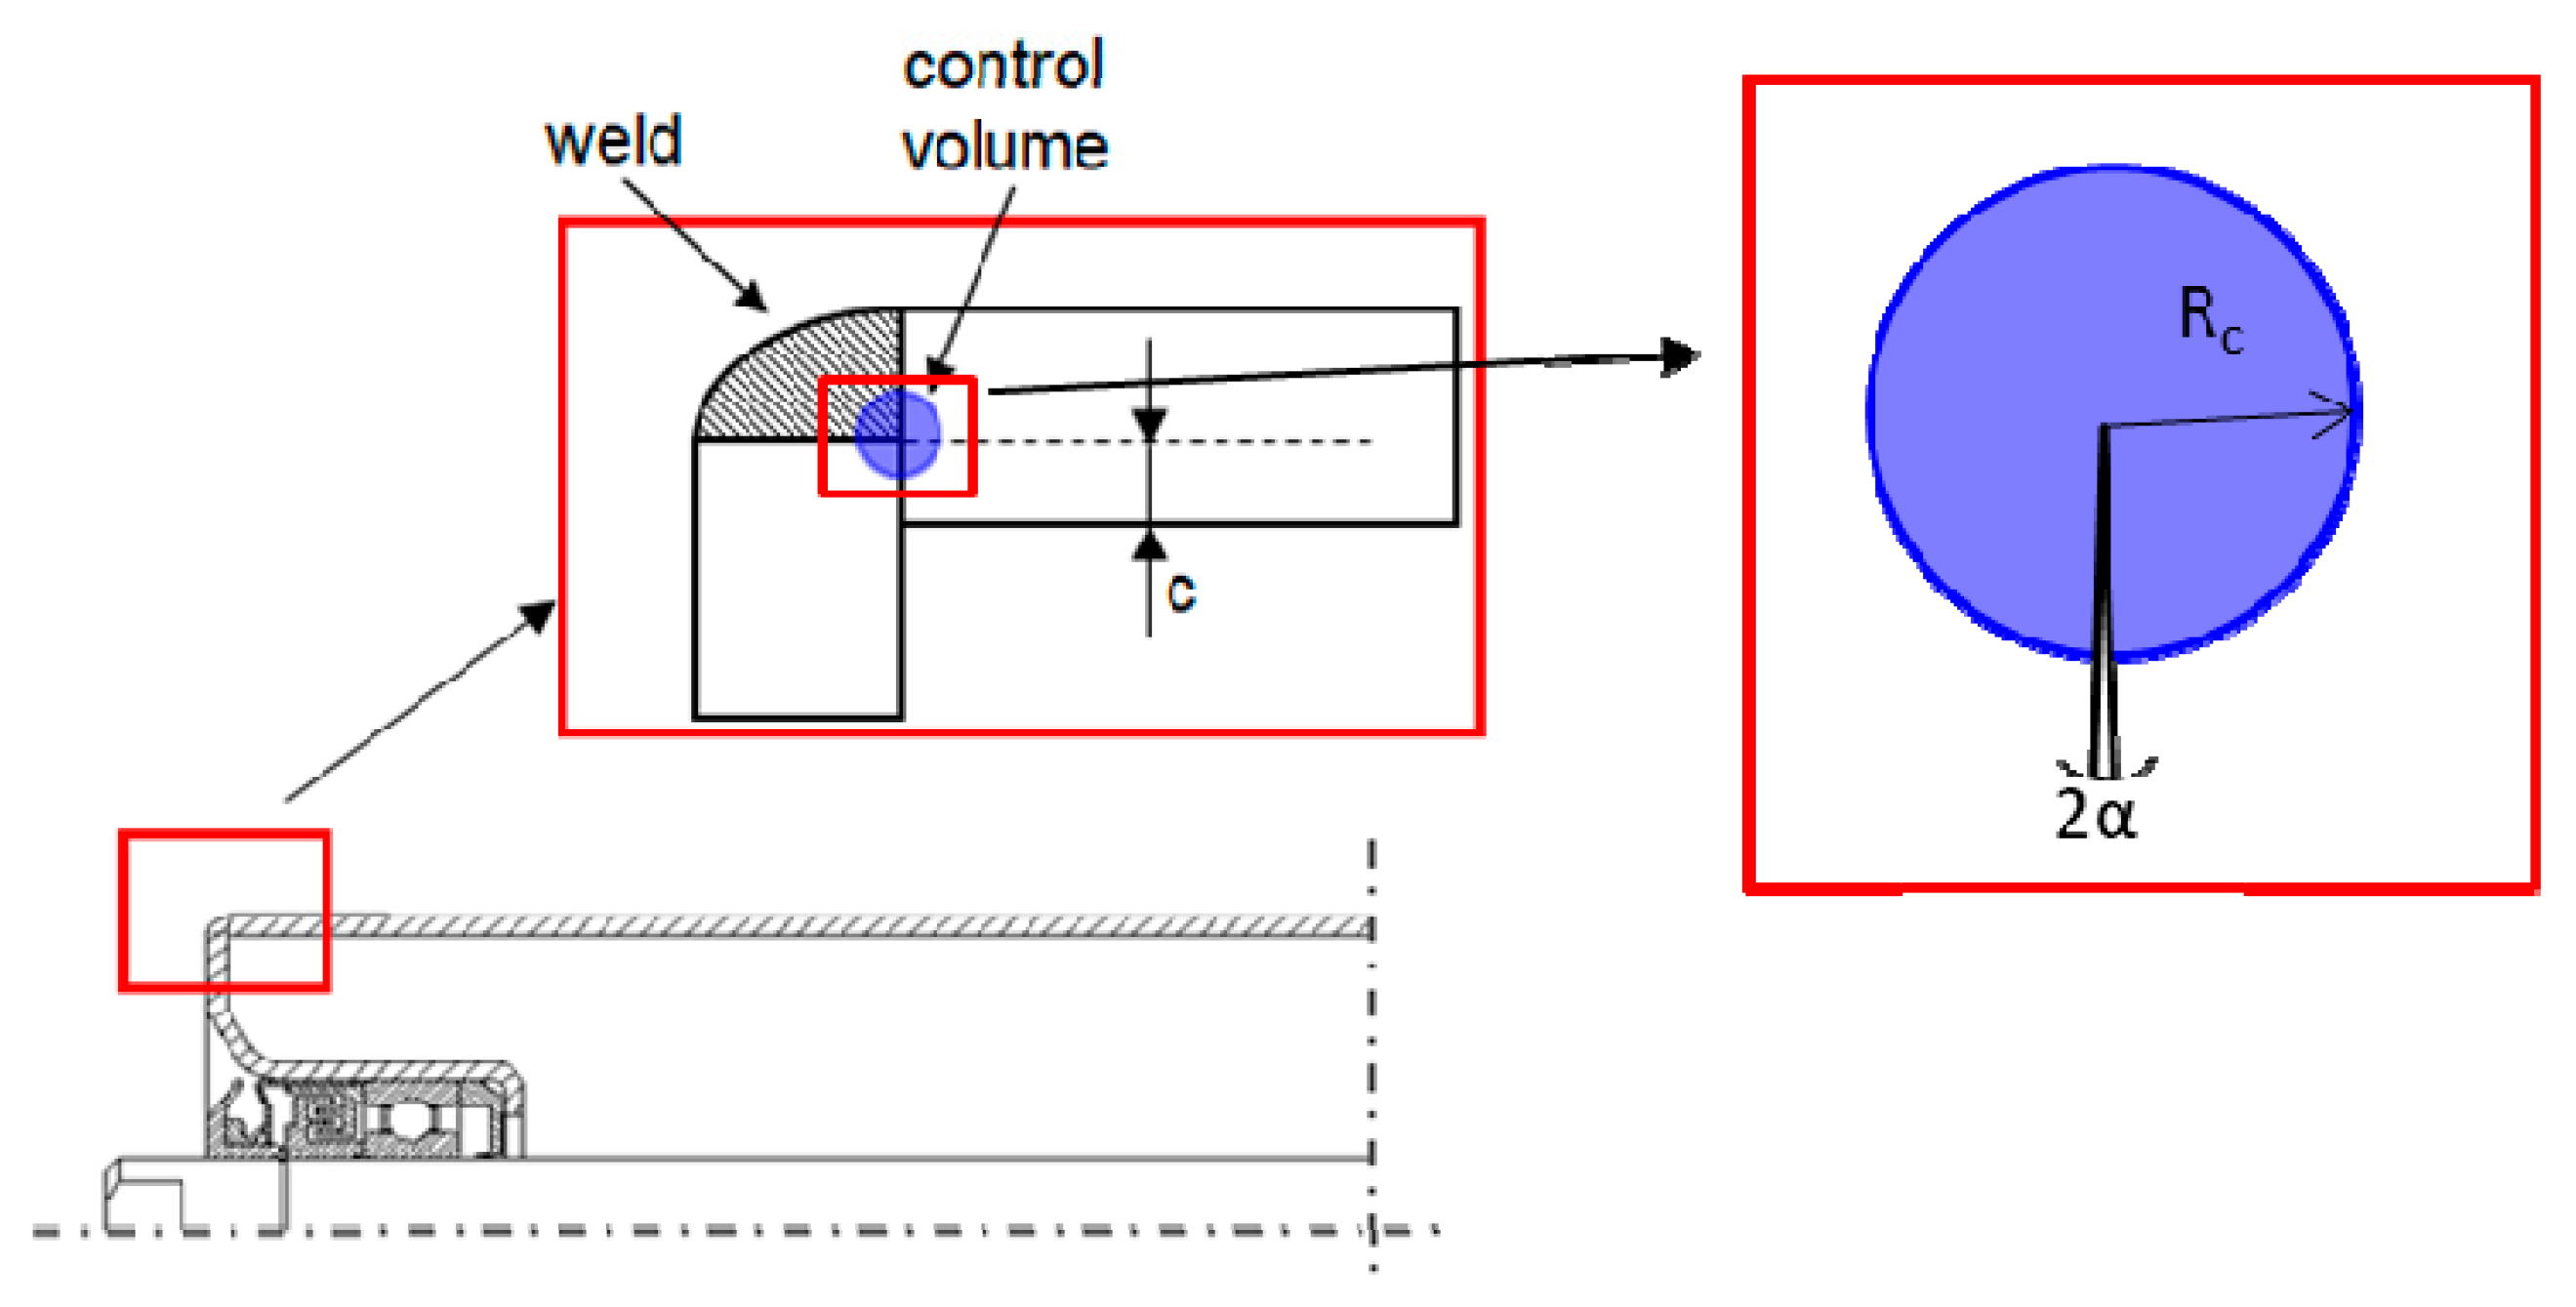
2. A Brief Description of the Strain Energy Density Approach
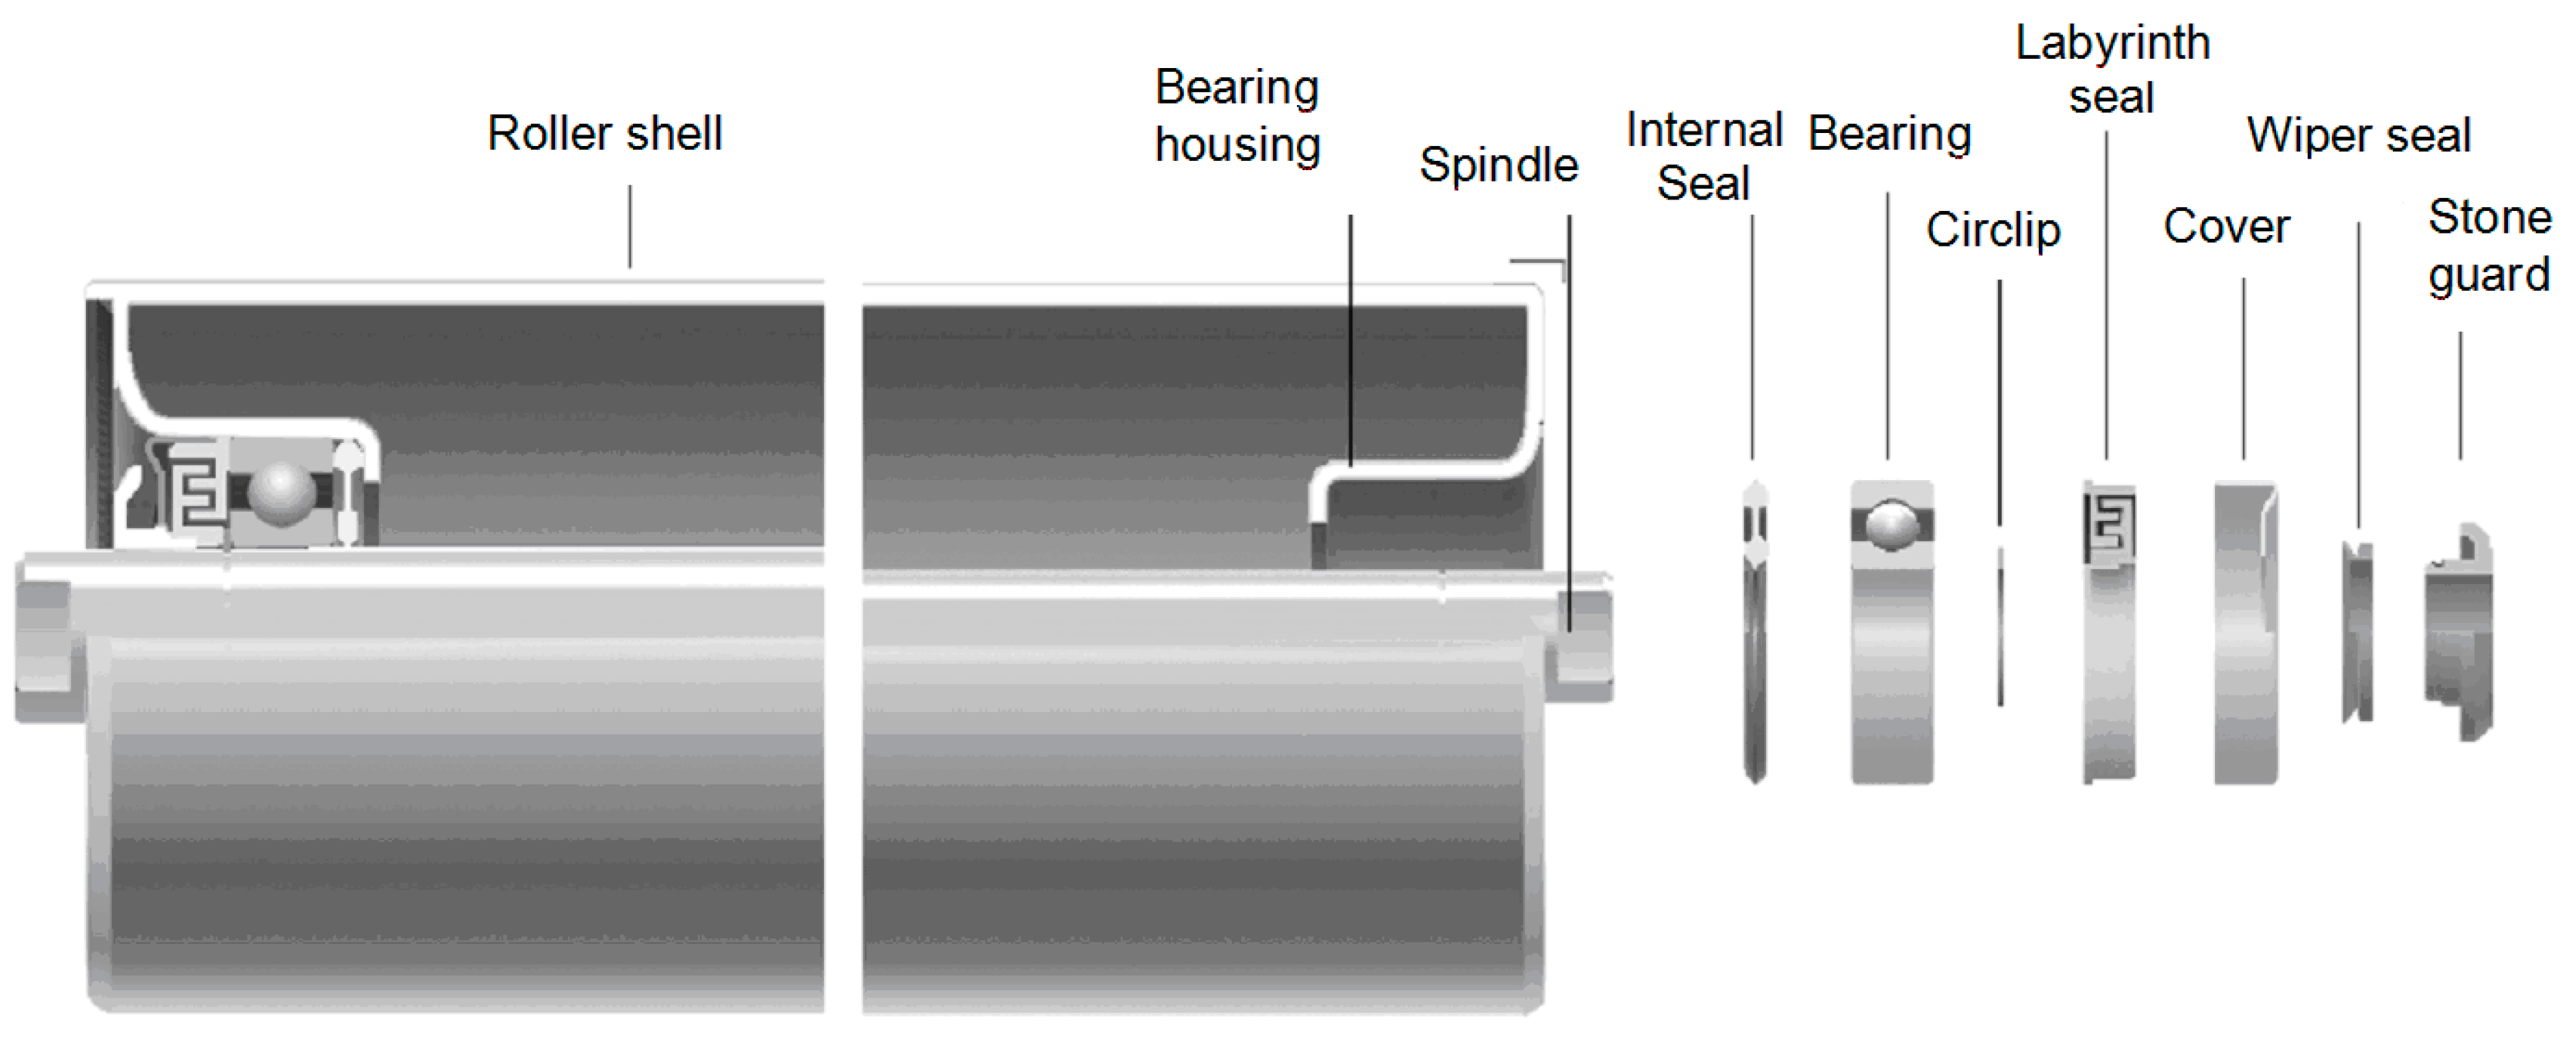
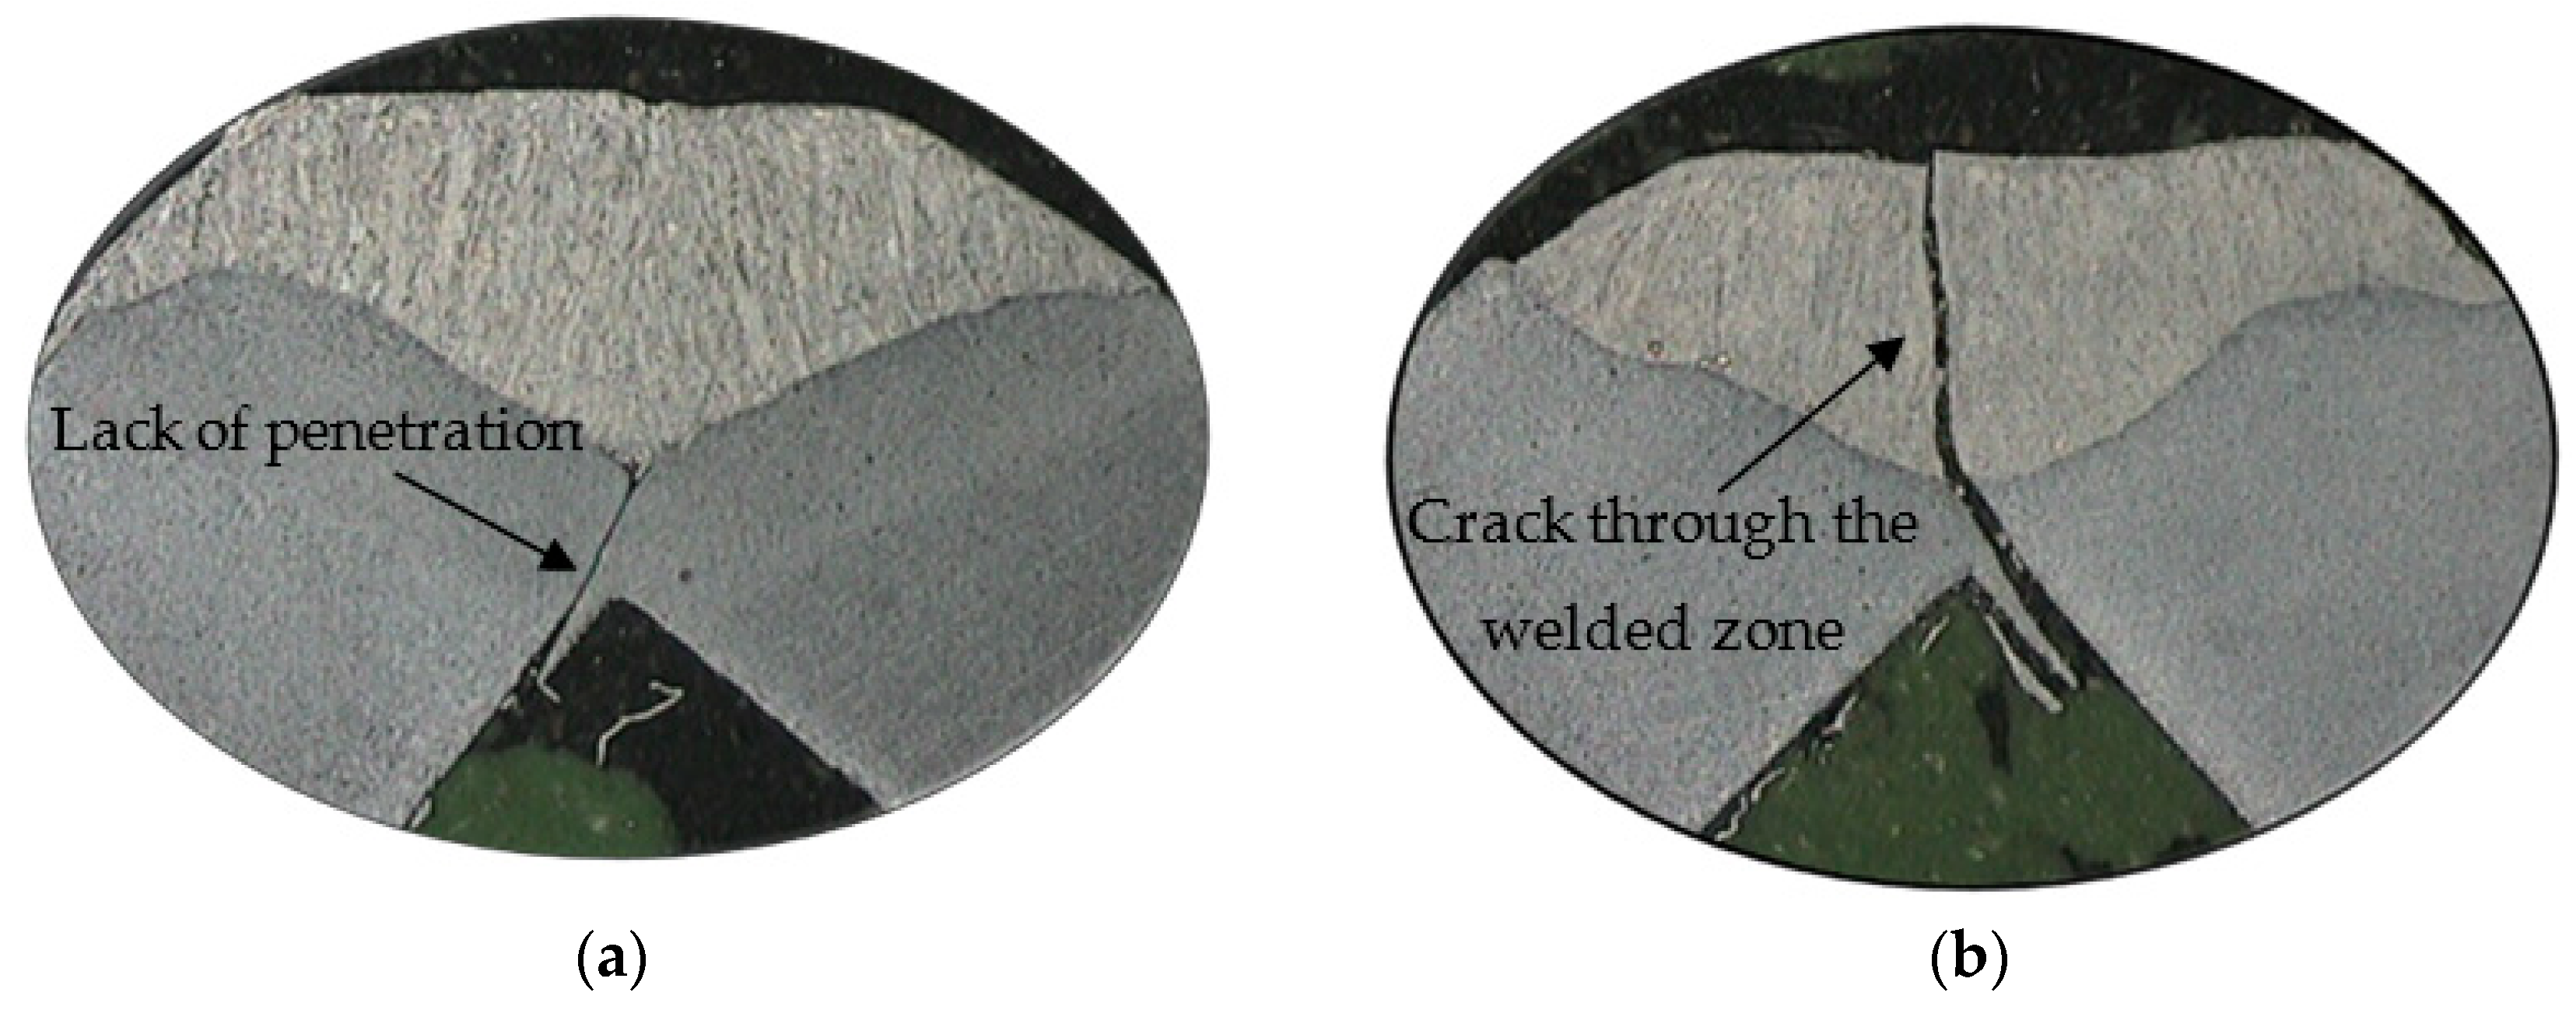
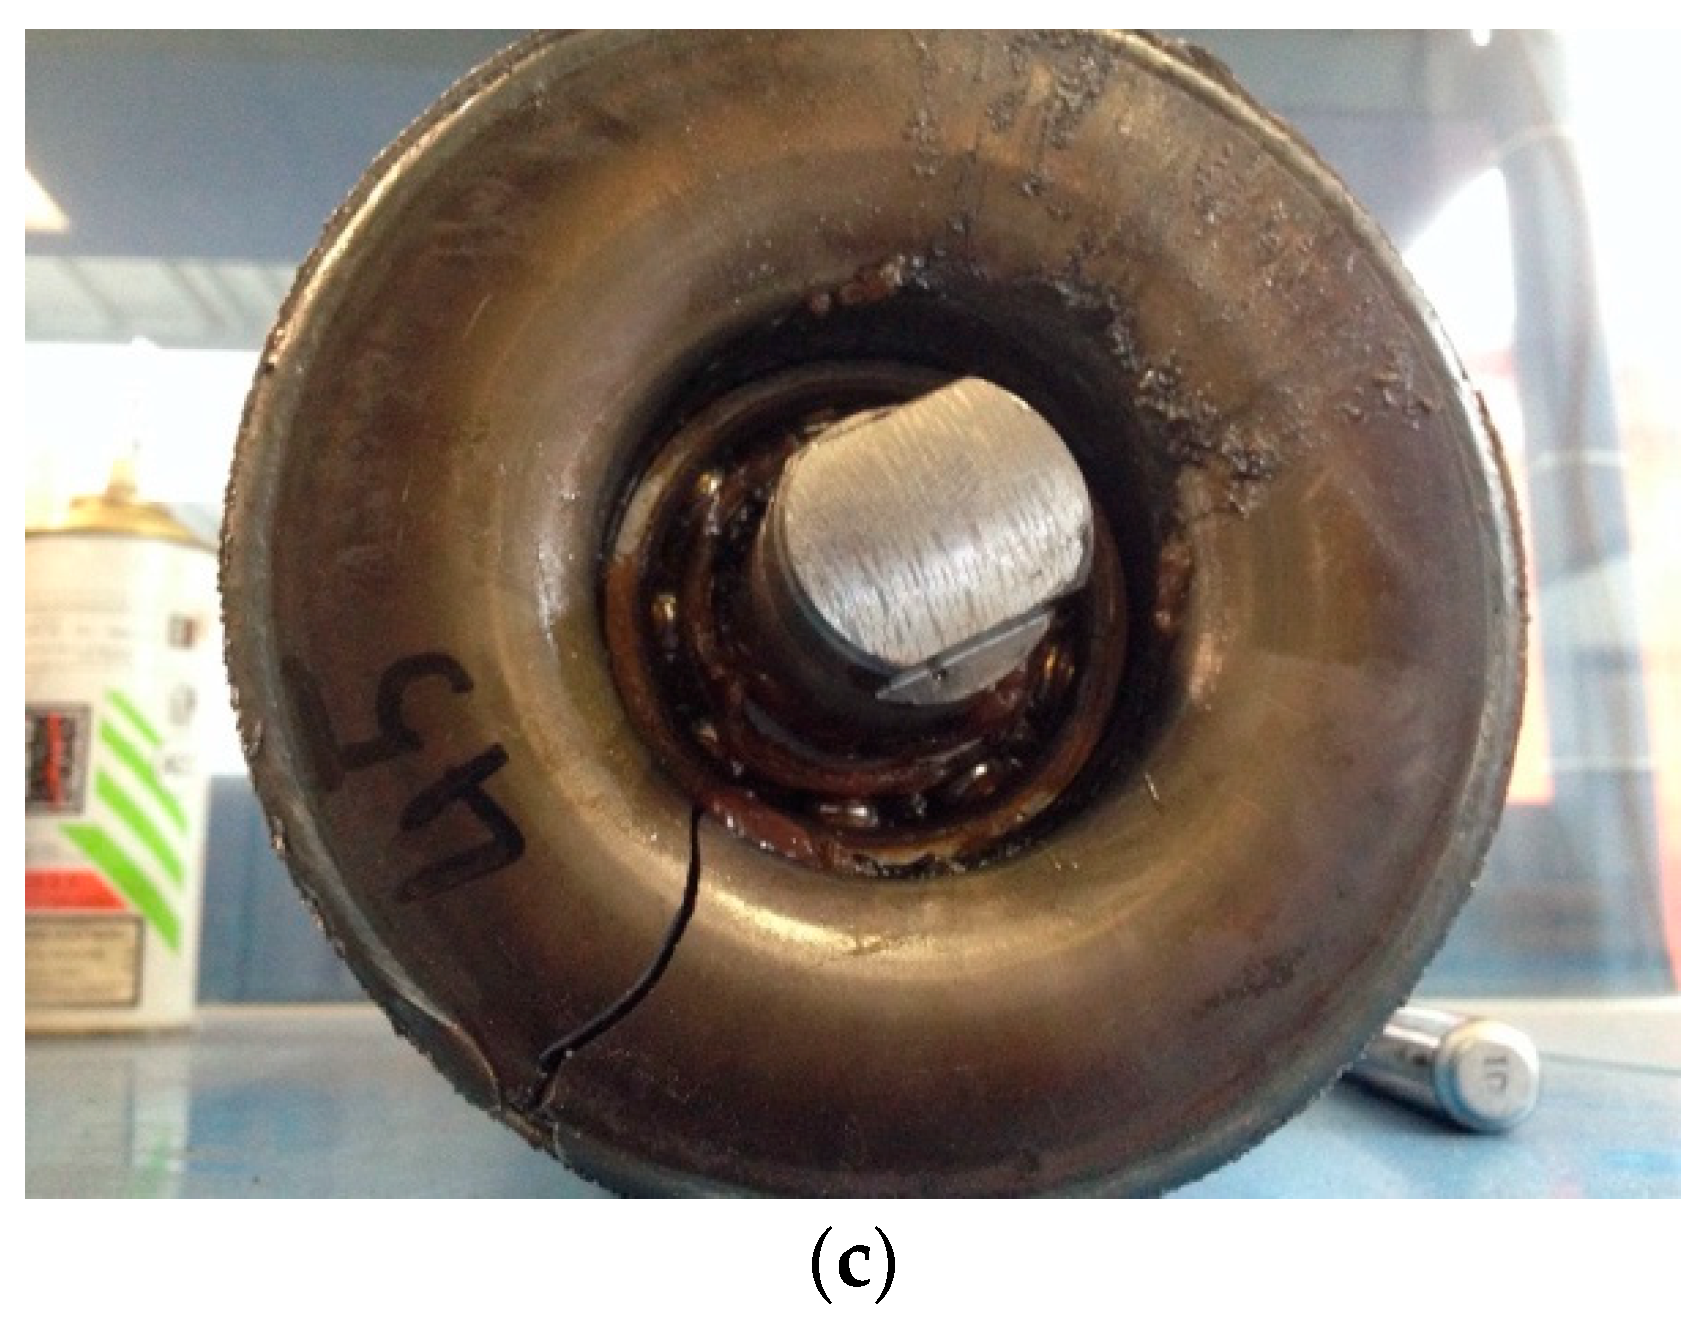
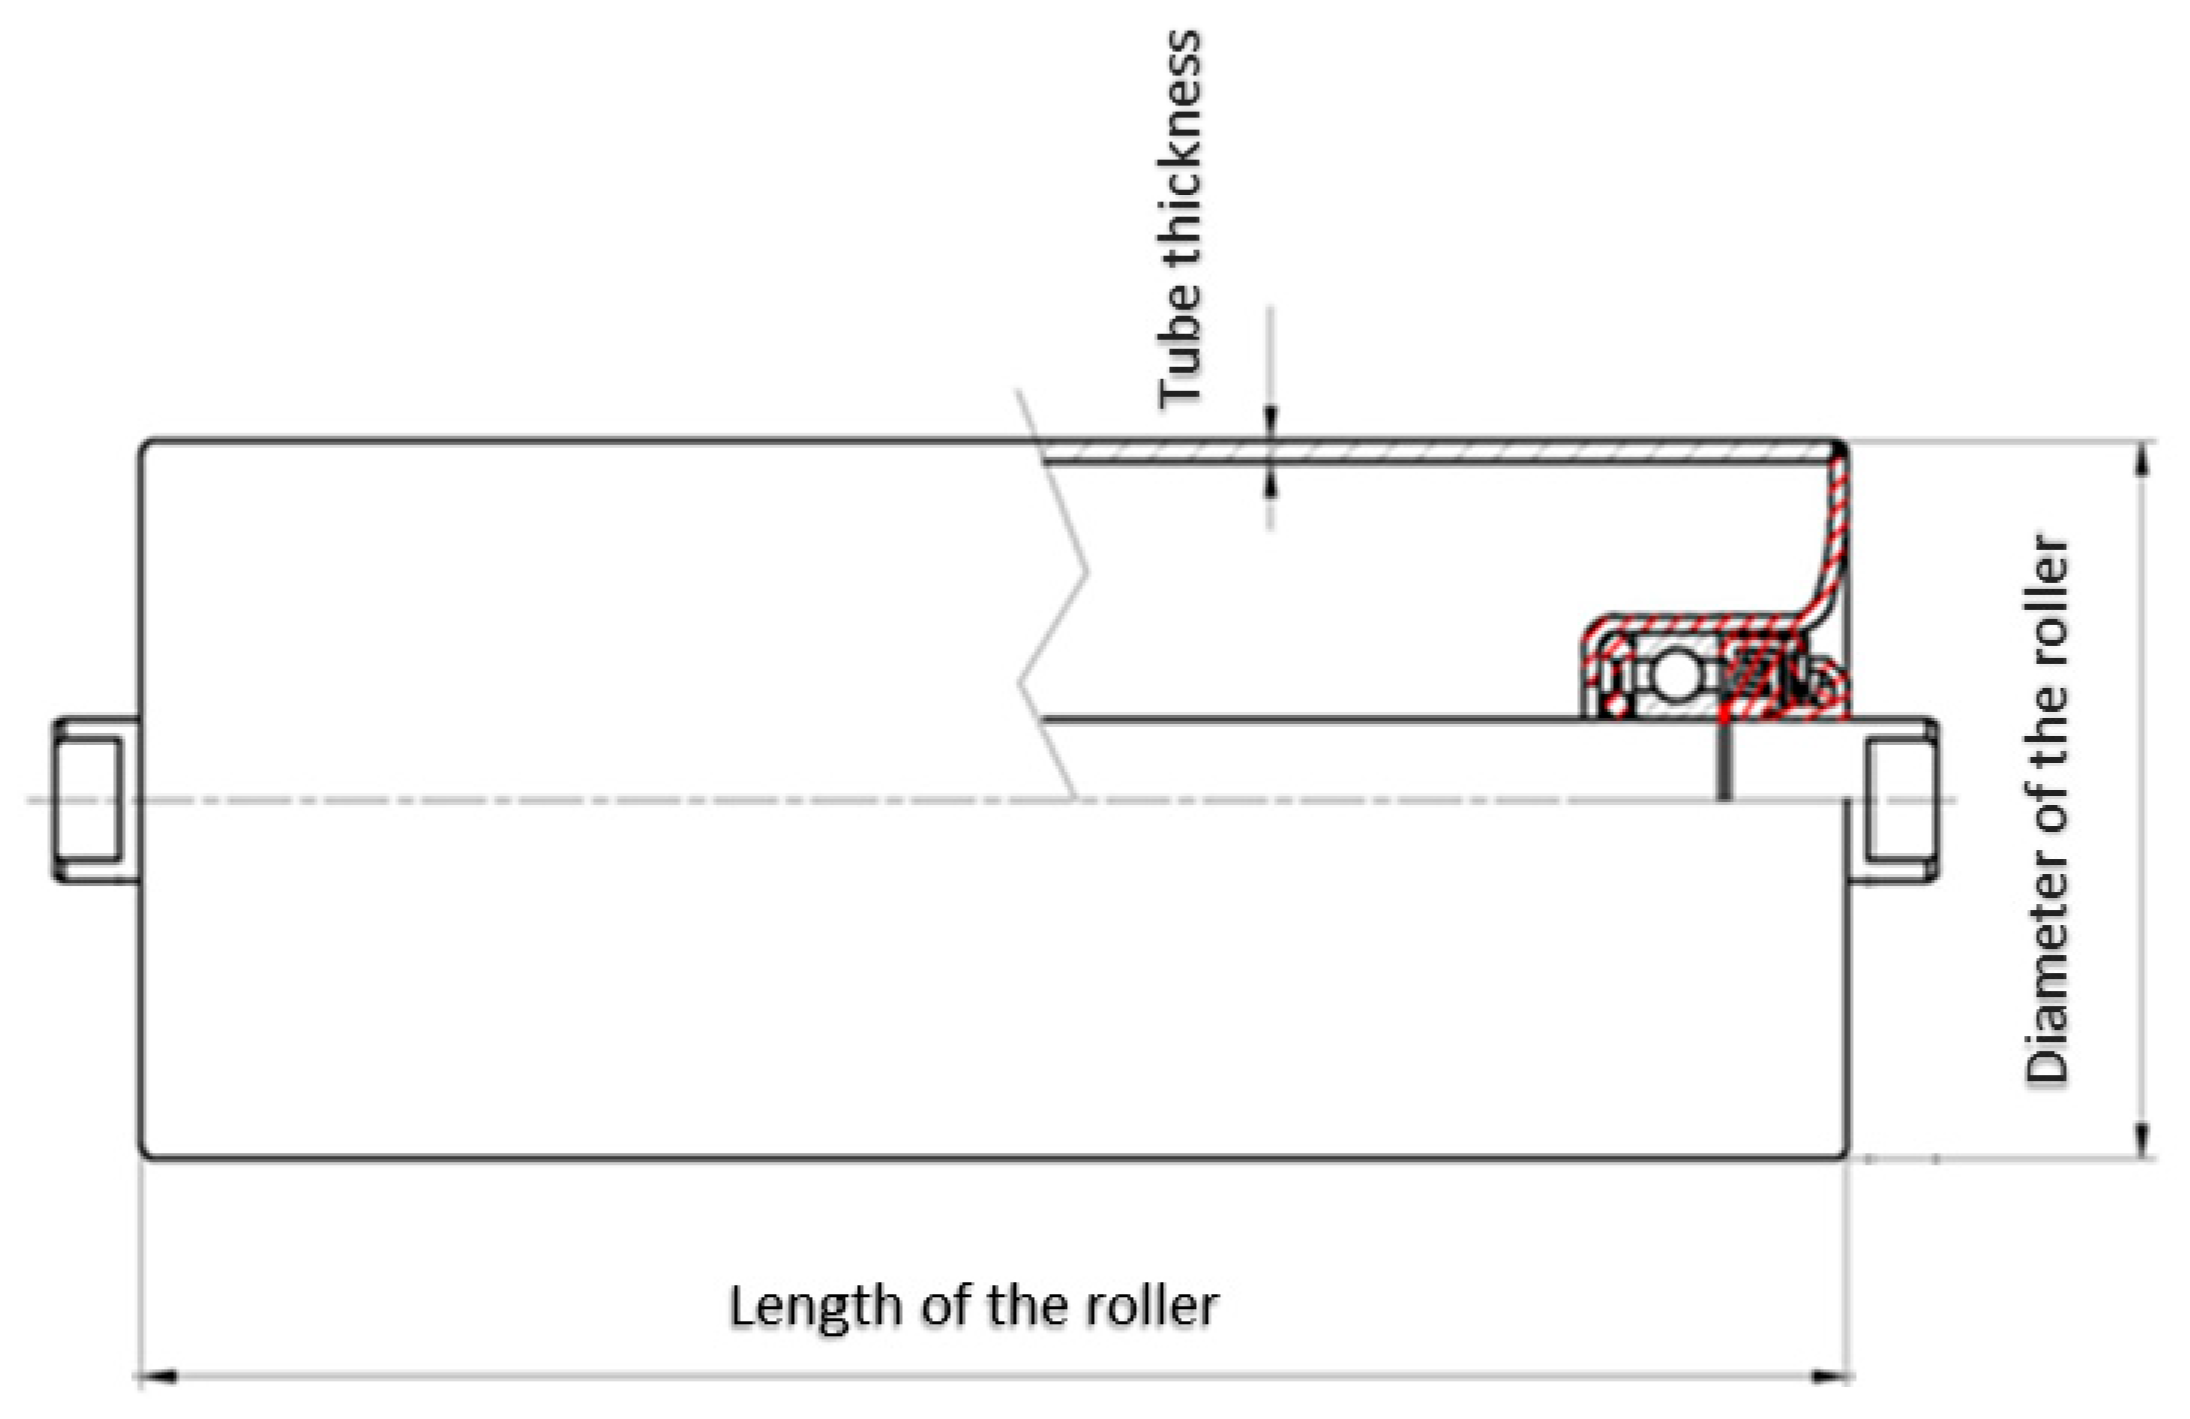
3. Geometry
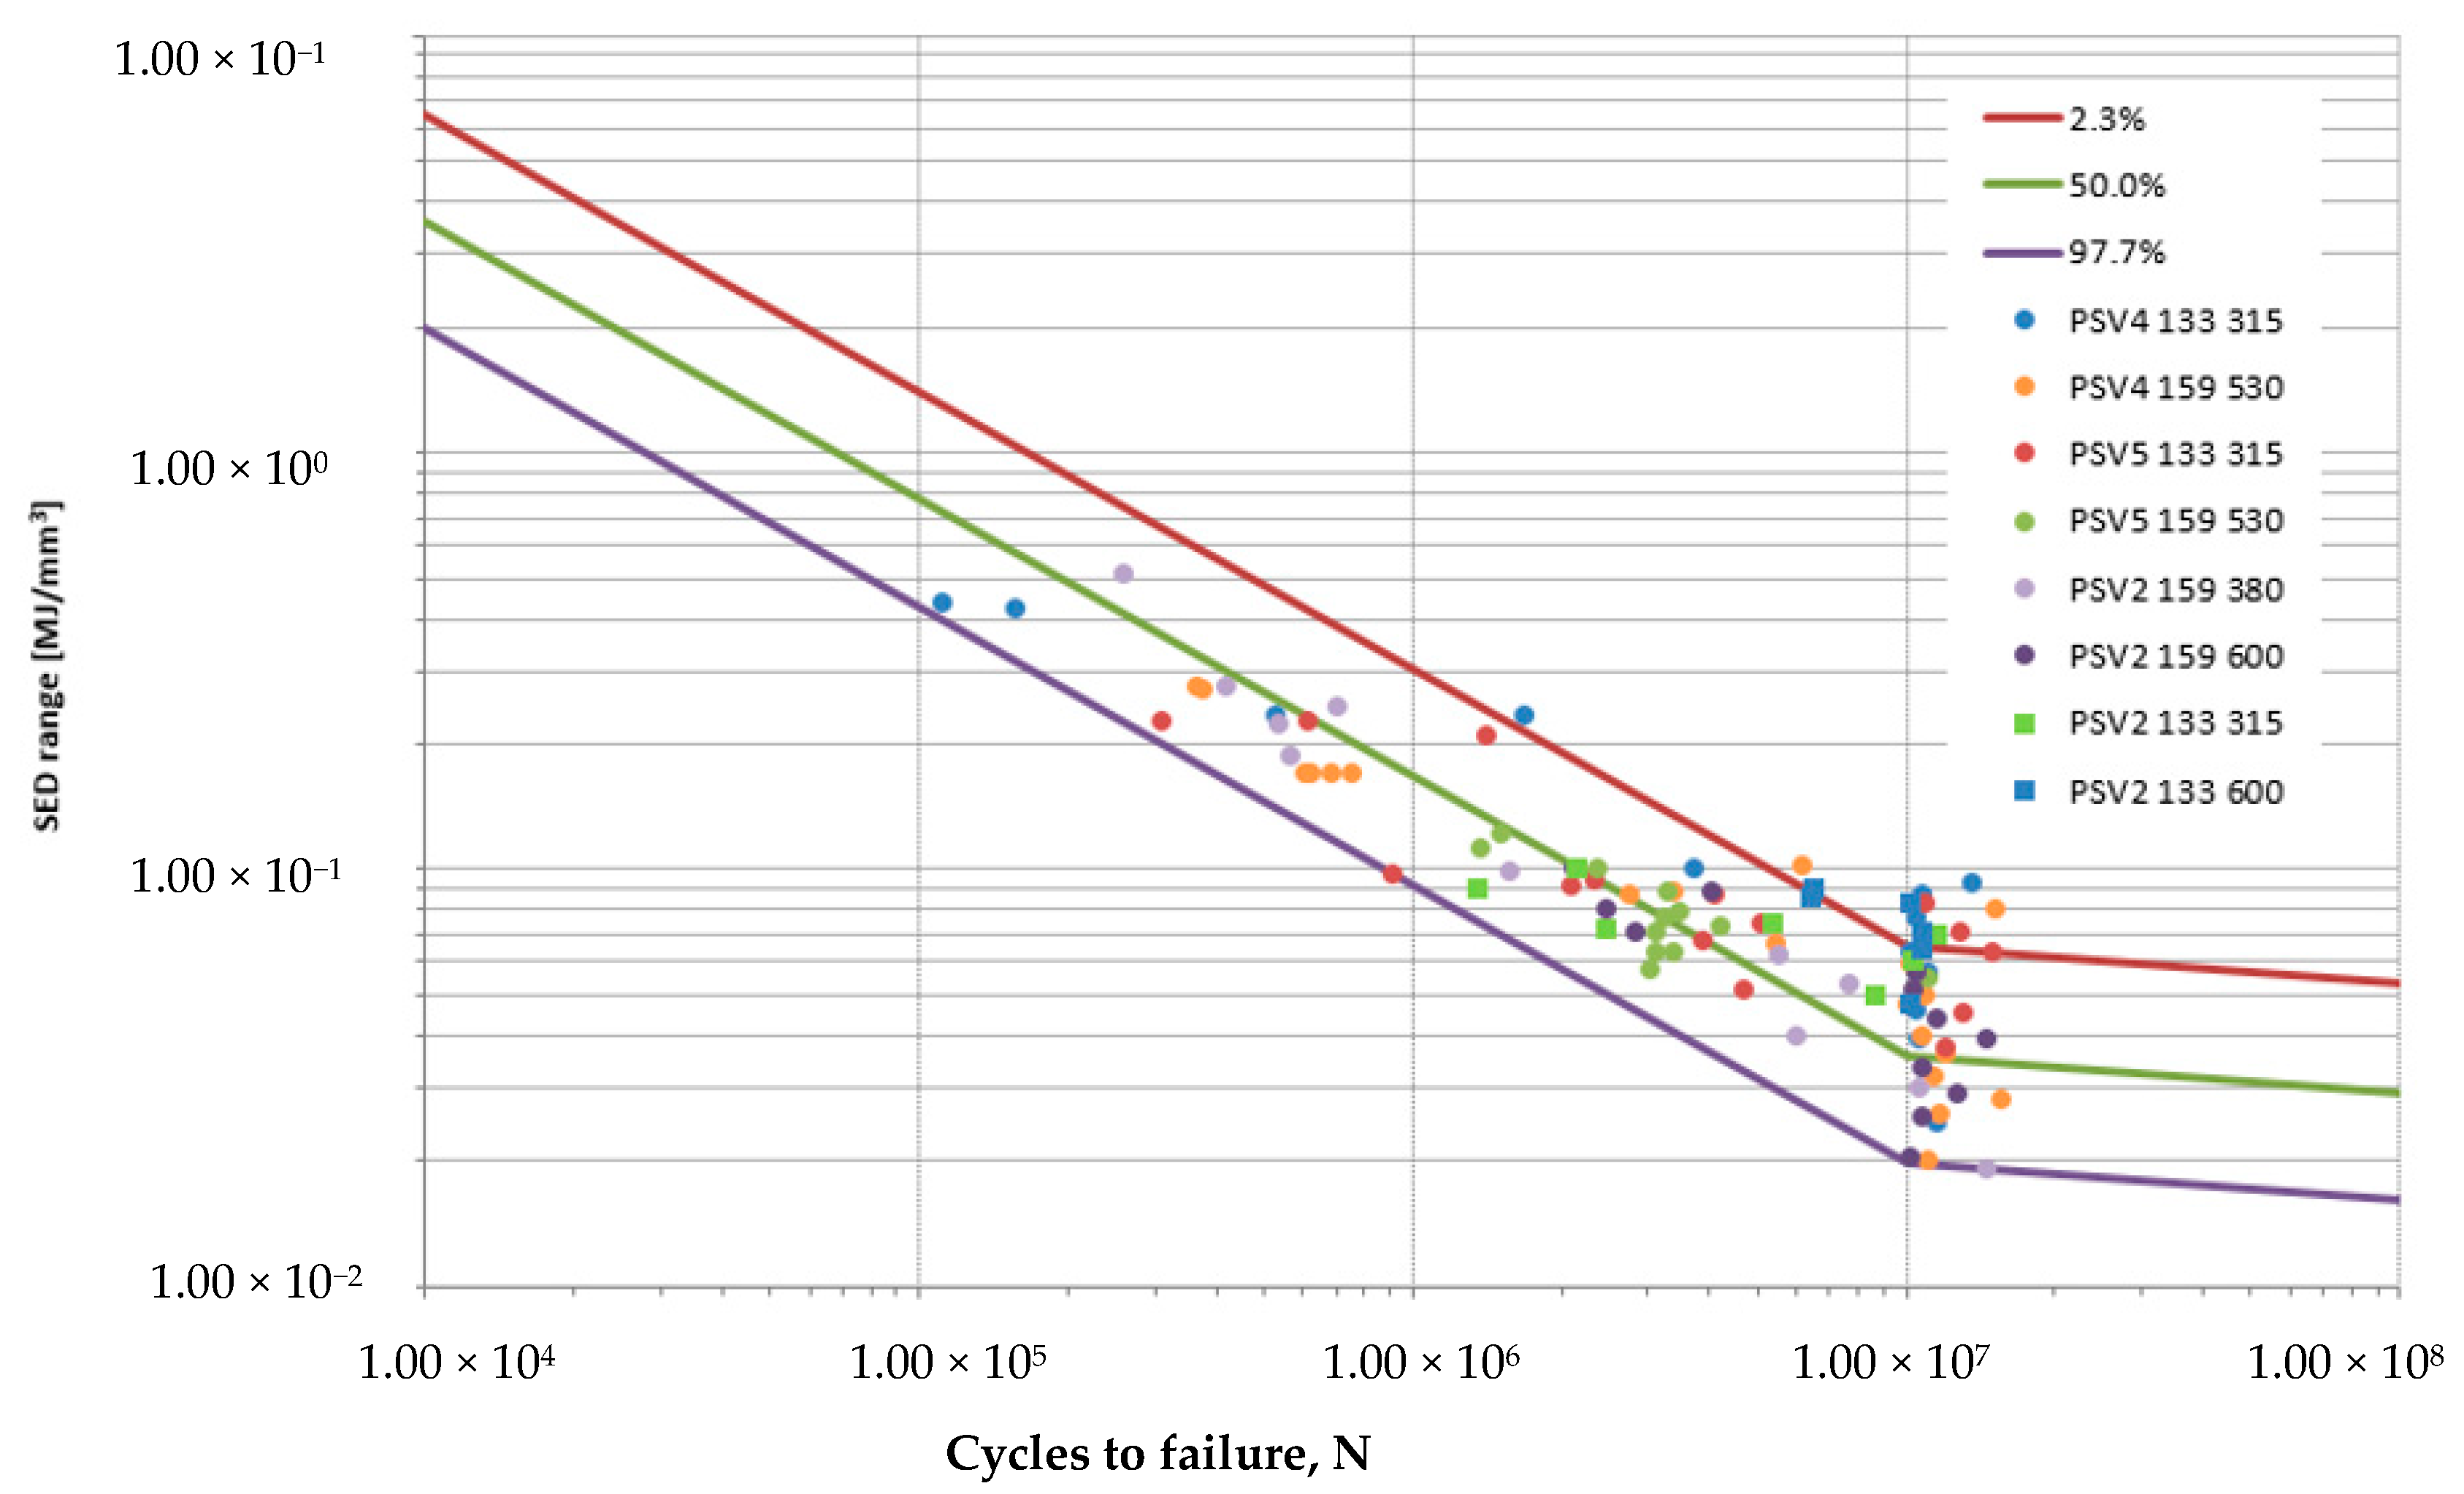
4. Results
5. Conclusions
Author Contributions
Funding
Conflicts of Interest
References
- Liu, H.; Wang, P.; Wei, X.; Xiao, J.; Chen, R. Longitudinal Seismic Response of Continuously Welded Track on Railway Arch Bridges. Appl. Sci. 2018, 8, 775. [Google Scholar] [CrossRef]
- Stadler, M.; Freton, P.; Gonzalez, J.-J. Influence of Welding Parameters on the Weld Pool Dimensions and Shape in a TIG Configuration. Appl. Sci. 2017, 7, 373. [Google Scholar] [CrossRef]
- Jin, L.; Xue, J.; Zhang, Z.; Hu, Y. Effects of Thermal Frequency on Microstructures, Mechanical and Corrosion Properties of AA6061 Joints. Appl. Sci. 2018, 8, 540. [Google Scholar] [CrossRef]
- Ikram, A.; Chung, H. The Effect of EN Ratio and Current on Microstructural and Mechanical Properties of Weld Joined by AC-GMAW on Square Groove Butt Joints. Appl. Sci. 2017, 7, 261. [Google Scholar] [CrossRef]
- Schijve, J. Fatigue of Welded Joints. In Fatigue of Structures and Materials; Springer: Dordrecht, The Netherlands, 2009; pp. 535–558. [Google Scholar]
- Atzori, B.; Lazzarin, P.; Meneghetti, G. Fatigue strength assessment of welded joints: From the integration of Paris’ law to a synthesis based on the notch stress intensity factors of the uncracked geometries. Eng. Fract. Mech. 2008, 75, 364–378. [Google Scholar] [CrossRef]
- Peron, M.; Razavi, S.M.J.; Berto, F.; Torgersen, J. Notch stress intensity factor under mixed mode loadings: An overview of recent advanced methods for rapid calculation. Fract. Integr. Struct. 2017, 42, 196–204. [Google Scholar]
- Ferro, P.; Peron, M.; Razavi, S.M.J.; Berto, F.; Torgersen, J. The fatigue behavior of V-notches in presence of residual stresses: Recent developments and future outcomes. Fract. Integr. Struct. 2017, 42, 189–195. [Google Scholar]
- Dunn, M.L.; Suwito, W.; Cunningham, S.; May, C.W. Fracture initiation at sharp notches under mode I, mode II, and mild mixed mode loading. Int. J. Fract. 1997, 84, 367–381. [Google Scholar] [CrossRef]
- Dunn, M.L.; Suwito, W.; Cunningham, S. Fracture initiation at sharp notches: Correlation using critical stress intensities. Int. J. Solids Struct. 1997, 34, 3873–3883. [Google Scholar] [CrossRef]
- Berto, F.; Lazzarin, P. Recent developments in brittle and quasi-brittle failure assessment of engineering materials by means of local approaches. Mater. Sci. Eng. R 2014, 75, 1–48. [Google Scholar] [CrossRef]
- Ferro, P. The local strain energy density approach applied to pre-stressed components subjected to cyclic load. Fatigue Fract. Eng. Mater. Struct. 2014, 37, 1268–1280. [Google Scholar] [CrossRef]
- Radaj, D. State-of-the-art review on the local strain energy density concept and its relation to the J-integral and peak stress method. Fatigue Fract. Eng. Mater. Struct. 2015, 38, 2–28. [Google Scholar] [CrossRef]
- Radaj, D. State-of-the-art review on extended stress intensity factor concepts. Fatigue Fract. Eng. Mater. Struct. 2014, 37, 1–28. [Google Scholar] [CrossRef]
- Lassen, T. The Effect of the Welding Process on the Fatigue Crack Growth. Weld J. 1990, 69, 75–81. [Google Scholar]
- Singh, P.J.; Guha, B.; Achar, D.R. Fatigue life improvement of AISI 304L cruciform welded joints by cryogenic treatment. Eng. Fail. Anal. 2003, 10, 1–12. [Google Scholar] [CrossRef]
- Singh, P.J.; Achar, D.R.; Guha, B.; Nordberg, H. Fatigue life prediction of gas tungsten arc welded AISI 304L cruciform joints with different LOP sizes. Int. J. Fatigue 2003, 25, 1–7. [Google Scholar] [CrossRef]
- Williams, M.L. Stress singularities resulting from various boundary conditions in angular corners on plates in extension. J. Appl. Mech. 1952, 19, 526–528. [Google Scholar]
- Lazzarin, P.; Zambardi, R. A finite-volume-energy based approach to predict the static and fatigue behavior of components with sharp V-shaped notches. Int. J. Fract. 2001, 112, 275–298. [Google Scholar] [CrossRef]
- Livieri, P.; Lazzarin, P. Fatigue strength of steel and aluminium welded joints based on generalised stress intensity factors and local strain energy values. Int. J. Fract. 2005, 133, 247–276. [Google Scholar] [CrossRef]
- Berto, F.; Lazzarin, P. A review of the volume-based strain energy density approach applied to V-notches and welded structures. Theor. Appl. Fract. Mech. 2009, 52, 183–194. [Google Scholar] [CrossRef]
- Berto, F.; Lazzarin, P. Fatigue strength of structural components under multi-axial loading in terms of local energy density averaged on a control volume. Int. J. Fatigue 2011, 33, 1055–1065. [Google Scholar] [CrossRef]
- Lazzarin, P.; Sonsino, C.M.; Zambardi, R. A notch stress intensity approach to assess the multiaxial fatigue strength of welded tube-to-flange joints subjected to combined loadings. Fatigue Fract. Eng. Mater. Struct. 2004, 27, 127–140. [Google Scholar] [CrossRef]
- Peron, M.; Torgersen, J.; Berto, F. Rupture Predictions of Notched Ti-6Al-4V Using Local Approaches. Materials 2018, 11, 663. [Google Scholar] [CrossRef] [PubMed]
- Razavi, S.M.J.; Peron, M.; Torgersen, J.; Berto, F.; Welo, T. 40CrMoV13.9 notched specimens under multiaxial fatigue: An overview of recent results. Fract. Integr. Struct. 2017, 41, 440–446. [Google Scholar]
- Razavi, S.M.J.; Peron, M.; Torgersen, J.; Berto, F.; Mutignani, F. Effect of hot dip galvanization on the fatigue strength of steel bolted connections. Fract. Integr. Struct. 2017, 41, 432–439. [Google Scholar]
- Gallo, P.; Razavi, S.M.J.; Peron, M.; Torgersen, J.; Berto, F. Creep behavior of V-notched components. Fract. Integr. Struct. 2017, 41, 456–463. [Google Scholar]
- Razavi, S.M.J.; Peron, M.; Mutignani, F.; Torgersen, J.; Berto, F. Fatigue Strength of Hot-Dip Galvanized Welded Steel Connections. Key Eng. Mater. 2017, 754, 244–247. [Google Scholar] [CrossRef]
- Peron, M.; Razavi, S.M.J.; Berto, F.; Torgersen, J.; Colussi, M. Fracture assessment of magnetostrictive materials. Fract. Integr. Struct. 2017, 42, 223–230. [Google Scholar]
- Campagnolo, A.; Razavi, S.M.J.; Peron, M.; Torgersen, J.; Berto, F. Mode II brittle fracture: Recent developments. Fract. Integr. Struct. 2017, 42, 181–188. [Google Scholar]
- Peron, M.; Razavi, S.M.J.; Berto, F.; Torgersen, J.; Mutignani, F. Local strain energy density for the fatigue assessment of hot dip galvanized welded joints: Some recent outcomes. Fract. Integr. Struct. 2017, 42, 205–213. [Google Scholar]
- Razavi, S.M.J.; Peron, M.; Mutignani, F.; Torgersen, J.; Berto, F. A Study on the Fatigue Behavior of Hot Dip Galvanized Steel Connections. Key Eng. Mater. 2017, 754, 241–243. [Google Scholar] [CrossRef]
- Peron, M.; Razavi, S.; Torgersen, J.; Berto, F. Fracture Assessment of PEEK under Static Loading by Means of the Local Strain Energy Density. Materials 2017, 10, 14–23. [Google Scholar]
- Peron, M.; Razavi, S.M.J.; Berto, F.; Torgersen, J.; Marsavina, L. Local strain energy density for the fracture assessment of polyurethane specimens weakened by notches of different shape. Fract. Integr. Struct. 2017, 42, 214–222. [Google Scholar]
- Berto, F.; Cendon, D.A.; Lazzarin, P.; Elices, M. Fracture behaviour of notched round bars made of PMMA subjected to torsion at −60 °C. Eng. Fract. Mech. 2013, 102, 271–287. [Google Scholar] [CrossRef]
- Razavi, S.M.J.; Peron, M.; Torgersen, J.; Berto, F. Static Multiaxial Fracture Behavior of Graphite Components: A Review of Recent Results. Key Eng. Mater. 2017, 754, 35–38. [Google Scholar] [CrossRef]
- Razavi, S.M.J.; Peron, M.; Torgersen, J.; Berto, F. Notched graphite under multiaxial loading. Fract. Integr. Struct. 2017, 41, 424–431. [Google Scholar]
- Berto, F.; Campagnolo, A.; Chebat, F.; Cincera, M.; Santini, M. Fatigue strength of steel rollers with failure occurring at the weld root based on the local strain energy values: Modelling and fatigue assessment. Int. J. Fatigue 2016, 82, 643–657. [Google Scholar] [CrossRef]
- Seki, M.; Nishie, N.; Kozai, S.; Kakuda, M.; Soyama, H.; Naito, A.; Fujii, M. Fatigue Strength of Steel Rollers and Gears Treated by Cavitation Peening with Short Processing Time (A Case of Processing Time of 1 min and 5 min). J. Adv. Mech. Des. Syst. Manuf. 2012, 6, 33–43. [Google Scholar] [CrossRef]
- Fujita, K.; Yoshida, A. Surface fatigue failure of nitride-hardened aluminium-chromium-molybdenum steel rollers under pure rolling and sliding-rolling contacts. Wear 1979, 53, 61–68. [Google Scholar] [CrossRef]
- Lazzarin, P.; Livieri, P. Notch stress intensity factors and fatigue strength of aluminium and steel welded joints. Int. J. Fatigue 2001, 23, 225–232. [Google Scholar] [CrossRef]
- Taylor, D.; Barrett, N.; Lucano, G. Some new methods for predicting fatigue in welded joints. Int. J. Fatigue 2002, 24, 509–518. [Google Scholar] [CrossRef]


| Model Name | Length of the Roller [mm] | Diameter of the Roller [mm] | Tube Thickness [mm] | Bearing Type |
|---|---|---|---|---|
| PSV2 133 315 | 315 | 133 | 4 | 6205 |
| PSV2 133 600 | 600 | 133 | 4 | 6205 |
| PSV2 159 380 | 380 | 159 | 4.5 | 6205 |
| PSV2 159 600 | 600 | 159 | 4.5 | 6205 |
| PSV4 133 315 * | 315 | 133 | 4 | 6206 |
| PSV4 159 530 * | 530 | 159 | 4.5 | 6206 |
| PSV5 133 315 | 315 | 133 | 4 | 6306 |
| PSV5 159 530 | 530 | 159 | 4.5 | 6306 |
| Samples | Load [Kg] | RPM | Cycles | SED [MJ/mm3] | |
|---|---|---|---|---|---|
| PSV2 133 315 | 1 | 541 | 545 | 2,151,388 | 0.101 |
| 2 | 512 | 545 | 1,343,313 | 0.091 | |
| 3 | 466 | 545 | 5,328,121 | 0.075 | |
| 4 | 457 | 545 | 2,440,852 | 0.072 | |
| 5 | 451 | 545 | 11,468,429 | 0.071 | |
| 6 | 420 | 545 | 10,198,955 | 0.061 | |
| 7 | 380 | 591 | 8,620,179 | 0.050 | |
| Samples | Load [Kg] | RPM | Cycles | SED [MJ/mm3] | |
|---|---|---|---|---|---|
| PSV2 133 600 | 1 | 545 | 653 | 6,478,432 | 0.091 |
| 2 | 531 | 653 | 6,373,931 | 0.086 | |
| 3 | 522 | 648 | 10,132,740 | 0.083 | |
| 4 | 484 | 641 | 10,699,396 | 0.072 | |
| 5 | 461 | 641 | 10,722,269 | 0.065 | |
| 6 | 395 | 493 | 10,075,994 | 0.048 | |
| Samples | Load [Kg] | RPM | Cycles | SED [MJ/mm3] | |
|---|---|---|---|---|---|
| PSV2 159 380 | 1 | 1231 | 534 | 259,463 | 0.517 |
| 2 | 899 | 534 | 416,956 | 0.276 | |
| 3 | 856 | 534 | 695,104 | 0.250 | |
| 4 | 814 | 534 | 534,408 | 0.226 | |
| 5 | 745 | 534 | 557,365 | 0.189 | |
| 6 | 540 | 534 | 1,556,243 | 0.099 | |
| 7 | 448 | 534 | 10,752,532 | 0.068 | |
| 8 | 431 | 534 | 5,451,923 | 0.063 | |
| 9 | 397 | 534 | 7,611,444 | 0.054 | |
| 10 | 344 | 534 | 5,958,036 | 0.040 | |
| 11 | 298 | 534 | 10,612,449 | 0.030 | |
| 12 | 238 | 534 | 14,382,785 | 0.019 | |
| Samples | Load [Kg] | RPM | Cycles | SED [MJ/mm3] | |
|---|---|---|---|---|---|
| PSV2 159 600 | 1 | 561 | 534 | 2,119,258 | 0.101 |
| 2 | 527 | 534 | 3,983,769 | 0.089 | |
| 3 | 502 | 534 | 2,452,618 | 0.081 | |
| 4 | 471 | 534 | 2,809,780 | 0.071 | |
| 5 | 424 | 534 | 10,434,390 | 0.058 | |
| 6 | 402 | 534 | 10,224,224 | 0.052 | |
| 7 | 373 | 534 | 11,459,075 | 0.045 | |
| 8 | 351 | 534 | 14,488,277 | 0.039 | |
| 9 | 324 | 534 | 10,663,603 | 0.034 | |
| 10 | 302 | 544 | 12,563,405 | 0.029 | |
| 11 | 283 | 544 | 10,665,627 | 0.026 | |
| 12 | 254 | 544 | 10,159,436 | 0.021 | |
| Samples | Load [Kg] | RPM | Cycles | SED [MJ/mm3] | |
|---|---|---|---|---|---|
| PSV4 159 530 | 1 * | 1262 | 541 | 363,234 | 0.278 |
| 2 * | 1251 | 541 | 370,432 | 0.274 | |
| 3 * | 994 | 541 | 677,279 | 0.173 | |
| 4 * | 992 | 541 | 747,548 | 0.172 | |
| 5 * | 991 | 541 | 598,390 | 0.172 | |
| 6 * | 990 | 541 | 619,344 | 0.171 | |
| 7 | 768 | 545 | 6,140,003 | 0.103 | |
| 8 | 715 | 545 | 3,352,651 | 0.089 | |
| 9 * | 708 | 545 | 2,749,333 | 0.088 | |
| 10 | 681 | 545 | 15,139,928 | 0.081 | |
| 11 | 621 | 545 | 5,433,742 | 0.067 | |
| 12 | 585 | 545 | 10,065,572 | 0.060 | |
| 13 | 536 | 545 | 10,791,789 | 0.050 | |
| 14 * | 523 | 545 | 9,962,179 | 0.048 | |
| 15 | 480 | 545 | 10,690,499 | 0.040 | |
| 16 | 456 | 545 | 11,909,310 | 0.036 | |
| 17 | 428 | 545 | 11,221,894 | 0.032 | |
| 18 | 401 | 545 | 15,489,417 | 0.028 | |
| 19 | 388 | 545 | 11,608,328 | 0.026 | |
| 20 | 340 | 545 | 10,967,692 | 0.020 | |
| Samples | Load [Kg] | RPM | Cycles | SED [MJ/mm3] | |
|---|---|---|---|---|---|
| PSV5 133 315 | 1 | 1251 | 643 | 306,221 | 0.230 |
| 2 | 1245 | 643 | 605,933 | 0.228 | |
| 3 | 1200 | 643 | 1,399,867 | 0.212 | |
| 4 | 815 | 638 | 910,164 | 0.098 | |
| 5 | 807 | 638 | 231,3360 | 0.096 | |
| 6 | 795 | 638 | 2,089,012 | 0.093 | |
| 7 | 776 | 638 | 4,078,198 | 0.089 | |
| 8 | 752 | 638 | 10,913,677 | 0.083 | |
| 9 | 713 | 638 | 5,059,160 | 0.075 | |
| 10 | 695 | 638 | 12,802,353 | 0.071 | |
| 11 | 678 | 638 | 3,863,892 | 0.068 | |
| 12 | 657 | 643 | 14,832,967 | 0.064 | |
| 13 | 593 | 641 | 4,625,783 | 0.052 | |
| 14 | 556 | 641 | 12,891,317 | 0.045 | |
| 15 | 508 | 641 | 11,974,027 | 0.038 | |
| Samples | Load [Kg] | RPM | Cycles | SED [MJ/mm3] | |
|---|---|---|---|---|---|
| PSV5 159 530 | 1 | 919 | 543 | 1,500,112 | 0.124 |
| 2 | 883 | 543 | 1,368,180 | 0.114 | |
| 3 | 832 | 543 | 2,351,632 | 0.101 | |
| 4 | 782 | 543 | 3,250,568 | 0.090 | |
| 5 | 736 | 543 | 3,463,929 | 0.079 | |
| 6 | 727 | 543 | 3,203,478 | 0.077 | |
| 7 | 710 | 543 | 4,187,825 | 0.074 | |
| 8 | 698 | 543 | 3,082,748 | 0.071 | |
| 9 | 660 | 543 | 3,361,271 | 0.064 | |
| 10 | 659 | 543 | 3,086,549 | 0.064 | |
| 11 | 628 | 543 | 2,994,251 | 0.058 | |
| 12 | 615 | 543 | 10,945,983 | 0.055 | |
| Samples | Load [Kg] | RPM | Cycles | SED [MJ/mm3] | |
|---|---|---|---|---|---|
| PSV4 133 315 | 1 | 1700 | 617 | 110,000 | 0.442 |
| 2 | 1675 | 617 | 155,500 | 0.429 | |
| 3 | 1245 | 643 | 1,680,000 | 0.237 | |
| 4 | 1245 | 643 | 521,658 | 0.237 | |
| 5 | 813 | 638 | 3,687,621 | 0.101 | |
| 6 | 786 | 638 | 13,484,745 | 0.094 | |
| 7 | 760 | 638 | 10,728,361 | 0.088 | |
| 8 | 752 | 638 | 10,685,583 | 0.086 | |
| 9 | 713 | 638 | 1,044,041 | 0.078 | |
| 10 | 647 | 638 | 10,164,948 | 0.064 | |
| 11 | 610 | 638 | 11,055,235 | 0.057 | |
| 12 | 553 | 646 | 10,479,312 | 0.047 | |
| 13 | 510 | 646 | 10,615,367 | 0.040 | |
| 14 | 404 | 646 | 11,446,934 | 0.025 | |
© 2018 by the authors. Licensee MDPI, Basel, Switzerland. This article is an open access article distributed under the terms and conditions of the Creative Commons Attribution (CC BY) license (http://creativecommons.org/licenses/by/4.0/).
Share and Cite
Chebat, F.; Peron, M.; Viespoli, L.M.; Welo, T.; Berto, F. Fatigue Strength Assessment of Steel Rollers: On the Reliability of the Strain Energy Density Approach on Real Components. Appl. Sci. 2018, 8, 1015. https://doi.org/10.3390/app8071015
Chebat F, Peron M, Viespoli LM, Welo T, Berto F. Fatigue Strength Assessment of Steel Rollers: On the Reliability of the Strain Energy Density Approach on Real Components. Applied Sciences. 2018; 8(7):1015. https://doi.org/10.3390/app8071015
Chicago/Turabian StyleChebat, Francesco, Mirco Peron, Luigi Mario Viespoli, Torgeir Welo, and Filippo Berto. 2018. "Fatigue Strength Assessment of Steel Rollers: On the Reliability of the Strain Energy Density Approach on Real Components" Applied Sciences 8, no. 7: 1015. https://doi.org/10.3390/app8071015
APA StyleChebat, F., Peron, M., Viespoli, L. M., Welo, T., & Berto, F. (2018). Fatigue Strength Assessment of Steel Rollers: On the Reliability of the Strain Energy Density Approach on Real Components. Applied Sciences, 8(7), 1015. https://doi.org/10.3390/app8071015