Article

Techniques and Emerging Trends for State of the Art Equipment Maintenance Systems—A Bibliometric Analysis

1
Institute of Databases and Information Systems (DBIS), Ulm University, 89081 Ulm, Germany
2
Institute of Technology and Process Management, Ulm University, 89081 Ulm, Germany
3
ATR Software GmbH, 89231, Neu-Ulm, Germany
*
Author to whom correspondence should be addressed.
Appl. Sci. 2018, 8(6), 916; https://doi.org/10.3390/app8060916
Submission received: 28 March 2018 / Revised: 29 May 2018 / Accepted: 30 May 2018 / Published: 2 June 2018

Abstract

:
The increasing interconnection of machines in industrial production on one hand, and the improved capabilities to store, retrieve, and analyze large amounts of data on the other, offer promising perspectives for maintaining production machines. Recently, predictive maintenance has gained increasing attention in the context of equipment maintenance systems. As opposed to other approaches, predictive maintenance relies on machine behavior models, which offer several advantages. In this highly interdisciplinary field, there is a lack of a literature review of relevant research fields and realization techniques. To obtain a comprehensive overview on the state of the art, large data sets of relevant literature need to be considered and, best case, be automatically partitioned into relevant research fields. A proper methodology to obtain such an overview is the bibliometric analysis method. In the presented work, we apply a bibliometric analysis to the field of equipment maintenance systems. To be more precise, we analyzed clusters of identified literature with the goal to obtain deeper insight into the related research fields. Moreover, cluster metrics reveal the importance of a single paper and an investigation of the temporal cluster development indicates the evolution of research topics. In this context, we introduce a new measure to compare results from different time periods in an appropriate way. In turn, among others, this simplifies the analysis of topics, with a vast amount of subtopics. Altogether, the obtained results particularly provide a comprehensive overview of established techniques and emerging trends for equipment maintenance systems.

1. Motivation

This presented literature study systematically reviews existing literature related to equipment maintenance systems to elaborate the state of the art as well as to discover current research trends. In this context, predictive maintenance (PdM) constitutes a specific method that aims to improve maintenance management methods, such as run-to-failure [1] or preventive maintenance [2], by including knowledge of the machine behavior with the goal to derive an optimal maintenance strategy. According to Mobley, the common target of predictive maintenance applications (PMA) constitutes “[...] regular monitoring of the actual mechanical condition, operating efficiency, and other indicators of the operating condition of machine-trains [...] to ensure the maximum interval between repairs as well as to minimize the number and cost of unscheduled outages created by machine-train failures ” [3].
In general, literature reviews [4] offer a technique to structure scientific articles. Existing review types focus on different strategies and should be chosen to fit best to the problem definition. Our requirements for reviewing the field of state of the art equipment maintenance systems are (1) to cover a wide range of articles, (2) to identify contemporary maintenance procedures and techniques, (3) to discover current trends, (4) to discover highly cited and influential articles, and (5) to include latest research on equipment maintenance systems. Other literature reviews do not always satisfy these requirements, e.g., the authors of [5,6] do not address Requirement 1. Concerning Requirement 2, for example, the authors of [7,8] do not consider recent research. In other works, in turn, the analyzed equipment maintenance strategy is too specific [9,10] or too general [11] compared to the literature review presented in this paper. To properly address Requirements 1–5, the literature review we accomplished uses the bibliometric analysis. In particular, the bibliometric analysis offers several advantages:
  • It visualizes relevant study articles based on various connection types, e.g., research fronts, knowledge bases, authors, and author affiliations.
  • It enables us to automatically cluster articles.
  • It enables quick recalculations of clusters based on different time periods.
Consequently, bibliometric analyses tend to be very effective when facing large and heterogeneous data sets. Thus, we apply the bibliometric analysis in the context of our literature review on equipment maintenance systems. We believe that this research field involves a multitude of research issues as well as complex interdependencies between them.
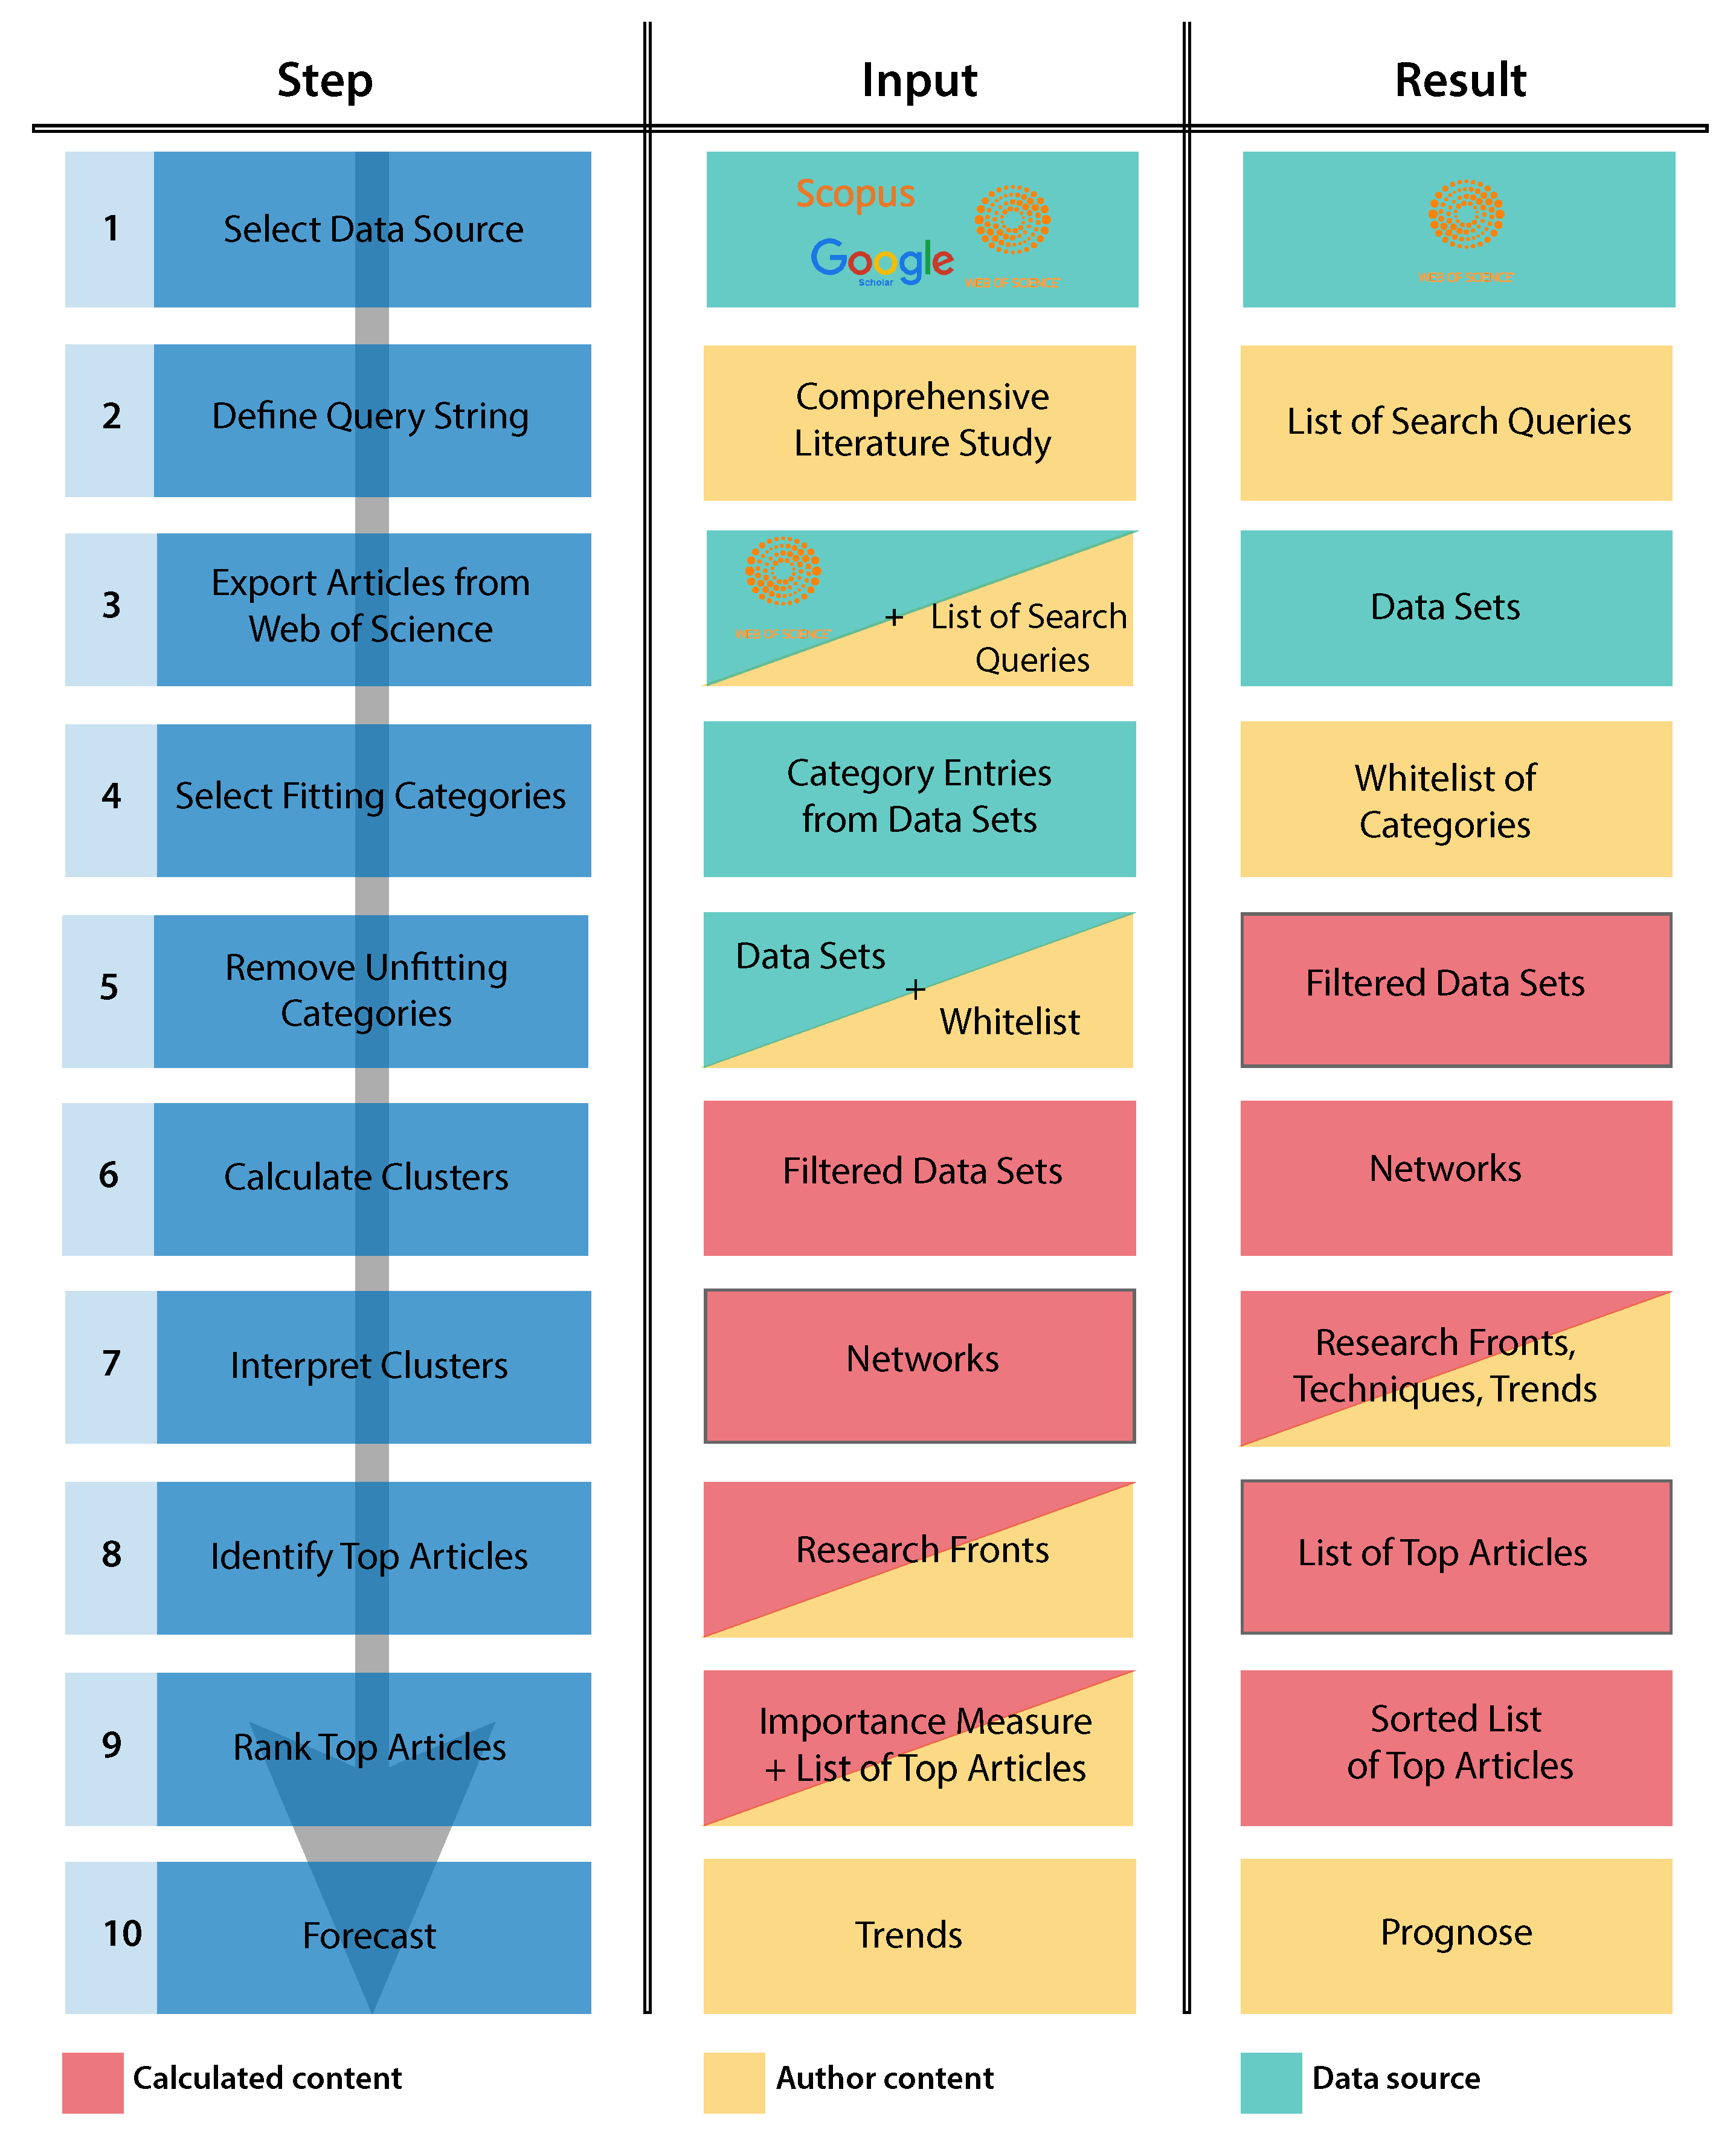
The procedure to accomplish the presented bibliometric analysis comprises ten steps as illustrated in Figure 1 in the left column. (Please note that that Figure 1 also shows in the middle and right columns, which steps have been actually accomplished for the present work.) The first step (cf. Figure 1, 1) is to select the academic databases from which relevant works shall be obtained. Frequently, the following databases are used: Google Scholar, Scopus, Web of Science, and ScienceDirect. Despite the wide-spread use of Google Scholar in Computer Science, we decided to base our review on Web of Science for two reasons. First, Web of Science and Scopus (Scopus would be another valuable source for our approach. Please note that both Web of Science and Scopus are payment platforms [12]. The reason we use just one is that our institution only has an account for Web of Science. In addition, according to [12], the differences between the two platforms constitute no crucial threat to validity.) currently generate citation data that can be comfortably used with existing bibliometric analysis software tools. Second, Web of Science is compared to Google Scholar a so-called human-curated academic database, which leads to more controlled citation data. On the other hand, Google Scholar reflects a more current status of all published papers and theses in most cases. However, we still rely on Web of Science, as a visual inspection revealed that only a few recent papers can be found with Google Scholar, but not in Web of Science. Furthermore, an in-depth comparison of academic databases is a complex endeavor, which is beyond the scope of this paper. However, we are aware of this limitation regarding the presented review.
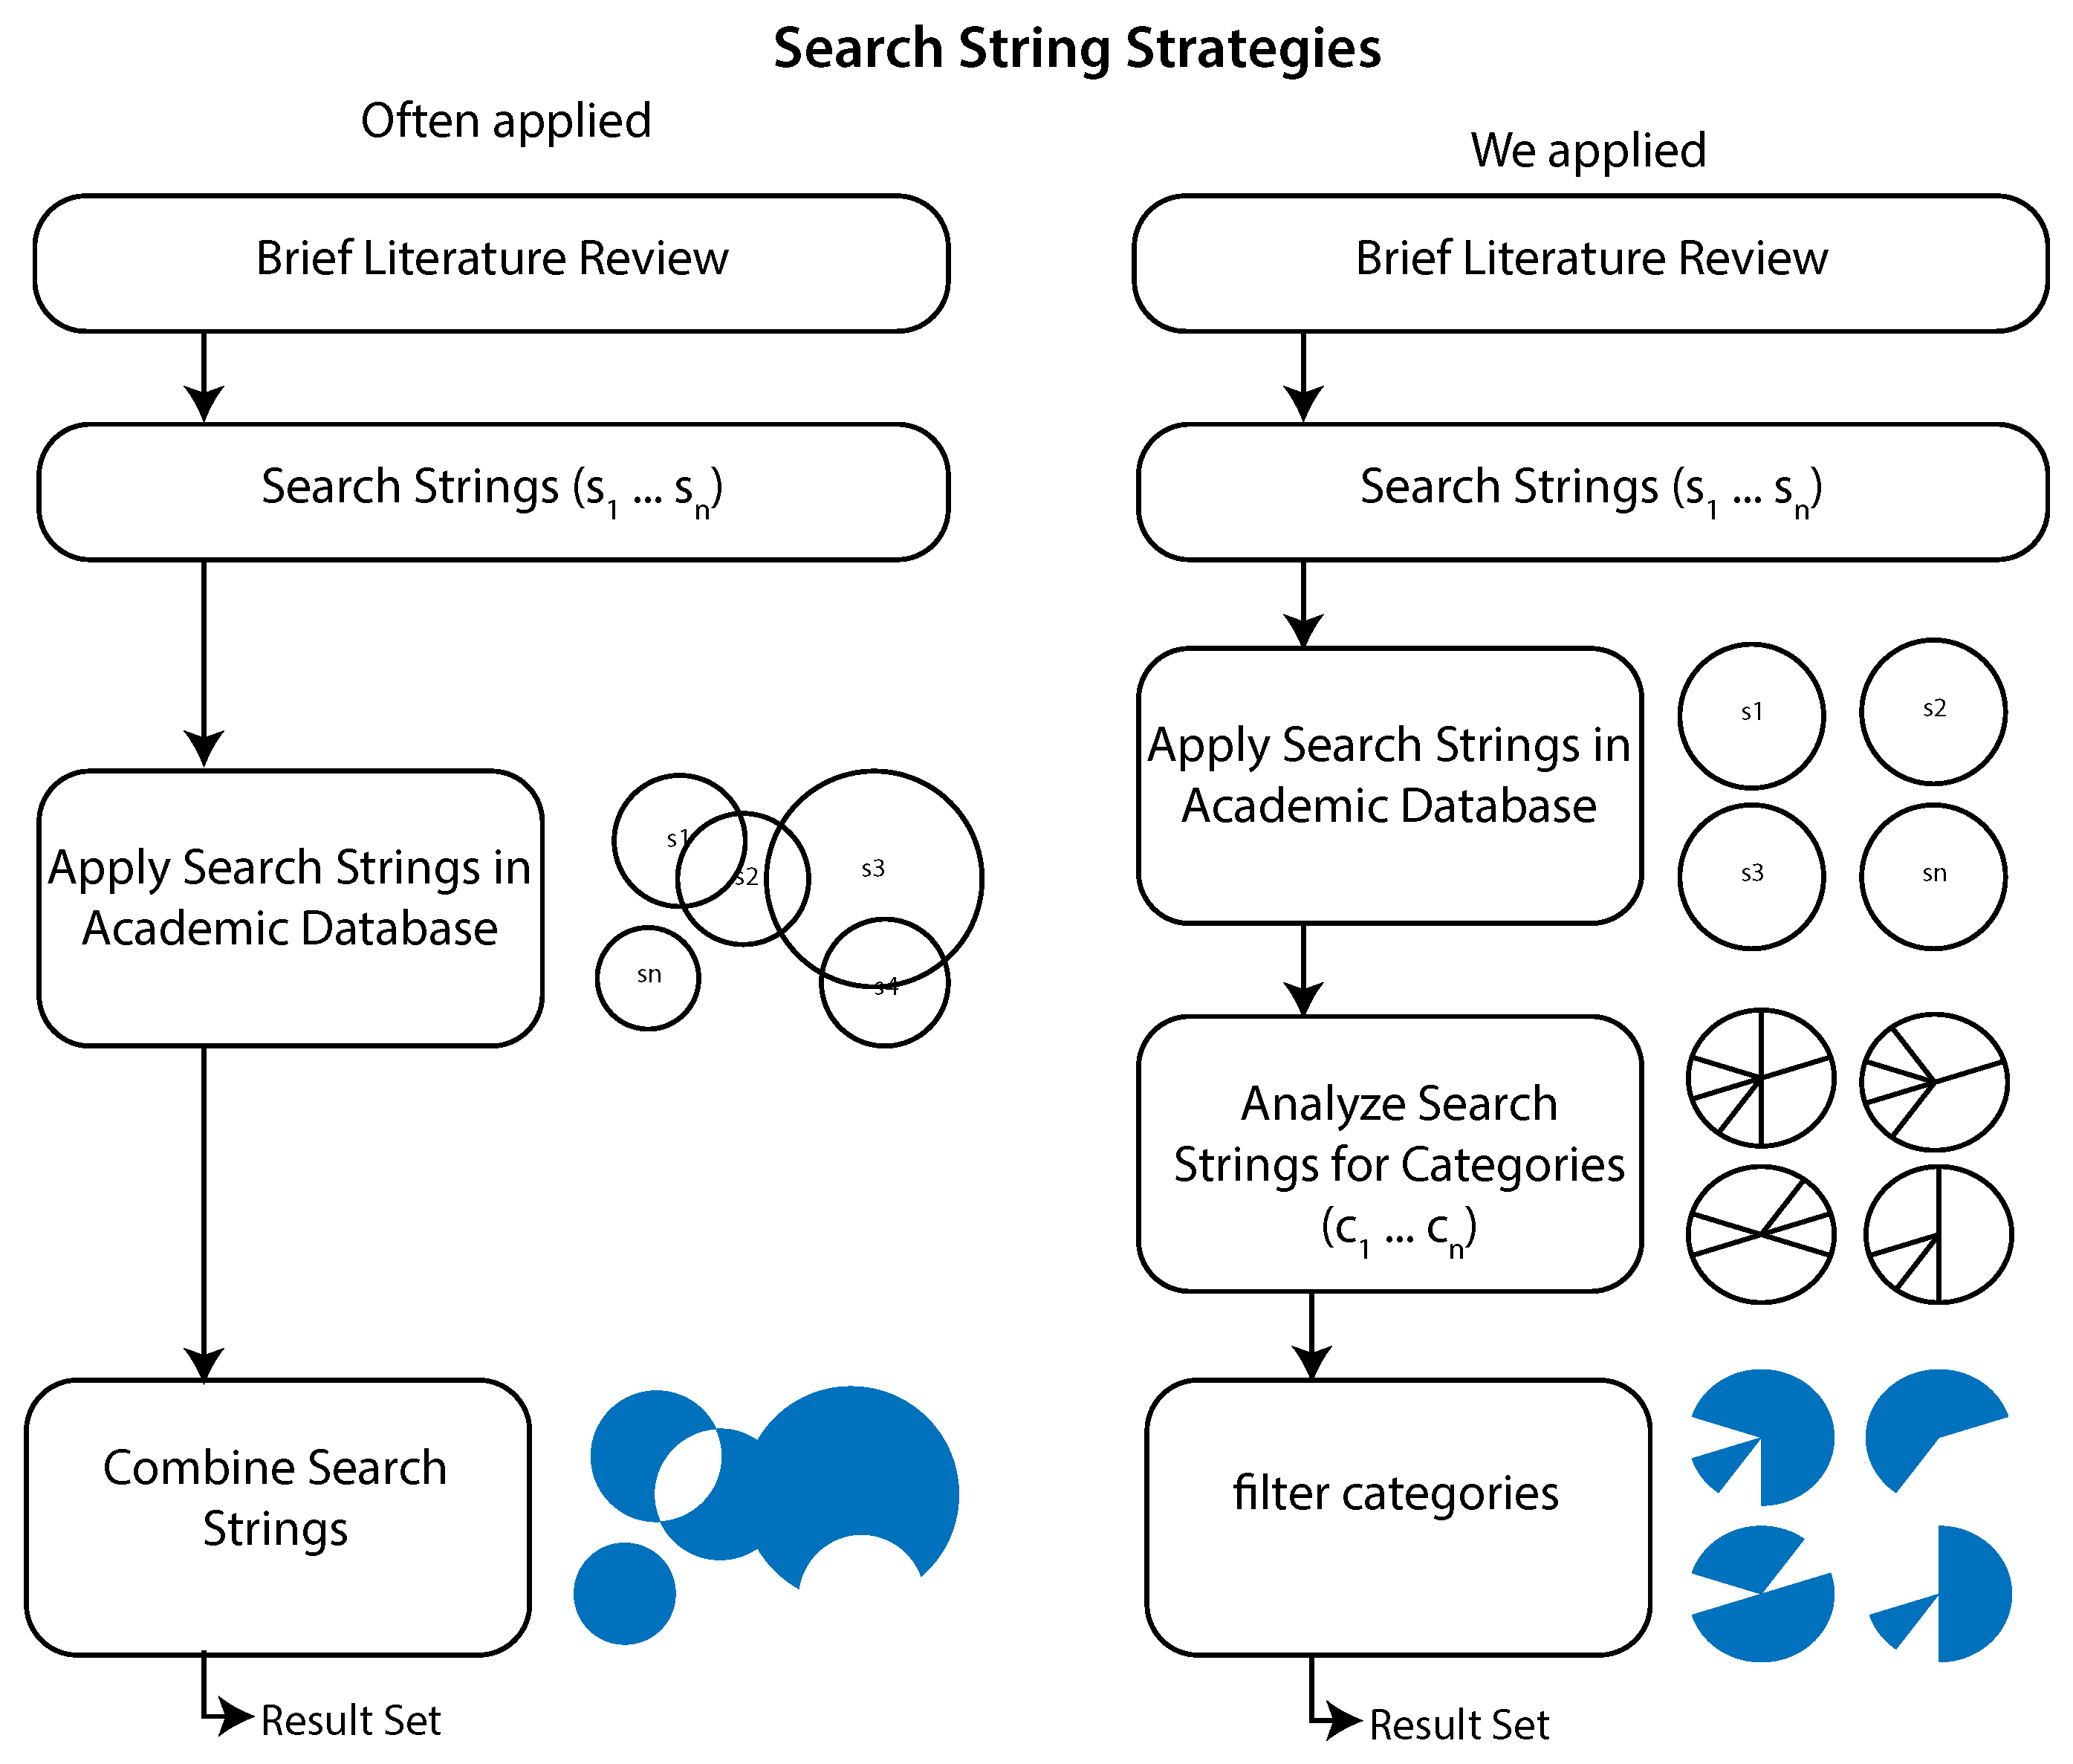
In the second step of a bibliometric analysis, one must specify the set of search strings to be applied to the used academic database (cf. Figure 1, 2). In the context, we applied the following search strings to Web of Science: predictive maintenance, condition monitoring, smart maintenance, lean maintenance, reliability-centered maintenance, and predictive analytics. Those search strings were defined after an open search on various maintenance techniques. All those techniques can be also applied in the field of Engineering Asset Management ([13,14]). Concerning the 12 functions of general asset management, as introduced by [15], we are mainly interested in Risk Management, Condition Monitoring, Asset Usage Life Cycle, Performance Measures, and Information Systems. For example, the integration of a maintenance method into asset management, e.g., by using condition monitoring [16], represents one typical workflow that is relevant for us.
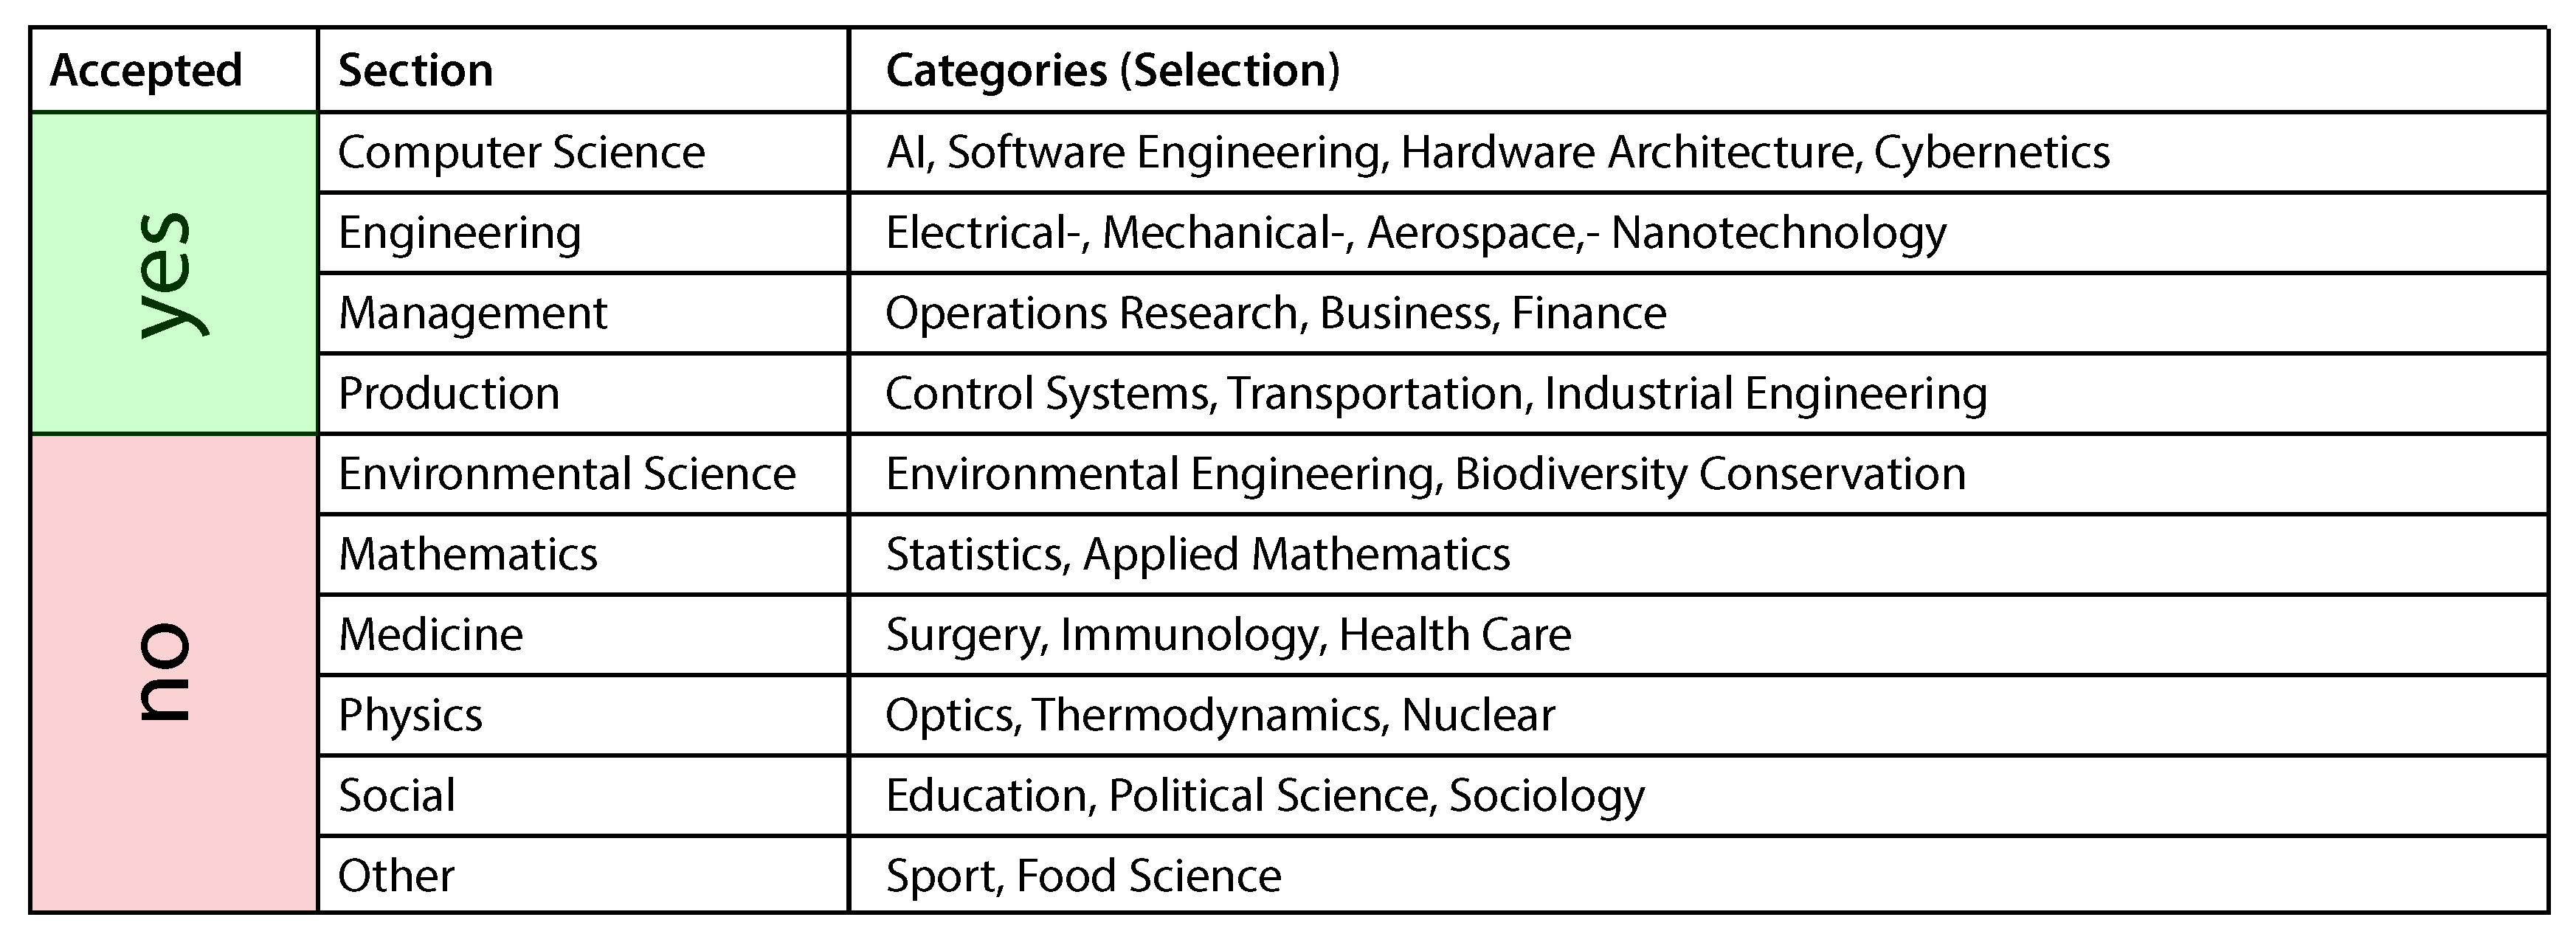
After applying the search strings to Web of Science, we exported the results (cf. Figure 1, 3) to apply several preprocessing steps (cf. Figure 1, 4–5) to remove unfitting results (e.g., maintenance in a medical context) from the extracted data. Following this, the cleansed data was fed into a software for bibliometric analysis. As depicted in Figure 1, the performed calculations and related interpretations comprise five steps (i.e., Steps 5–10 in Figure 1). The obtained results, in turn, provide a valuable overview for state of the art maintenance systems in general and predictive maintenance in particular. Additionally, we were able to identify fundamental (i.e., distinguished) papers in this field. Moreover, to the best of our knowledge, the work at hand is the first one that applied bibliometric analysis in reviewing the research field of equipment maintenance systems. In addition, our results underlie that bibliometric analyses are able to gain valuable insights.
The remainder of this paper is structured as follows: Section 2 provides deeper insight into the methodology applied, i.e., the bibliometric analysis. The result set obtained from the search strings applied to Web of Science are discussed in Section 3. In Section 4, results of the bibliometric analysis are presented. In turn, Section 5 introduces a novel measure to rank single articles in a multi-dimensional way. Section 6 predicts research trends based on the past development of related topics, whereas Section 7 discusses threats to validity. Finally, Section 8 concludes the paper and gives an outlook.

2. Bibliometric Analysis

Bibliometric analysis is a method from the field of Bibliometrics [17]. The latter, in turn, has connotations with the term statistical bibliography and constitutes a quantitative approach to literature research. In the bibliometric analysis we performed with the goal to identify existing research fields in the context of state of the art equipment maintenance systems, we follow the basic idea presented in [
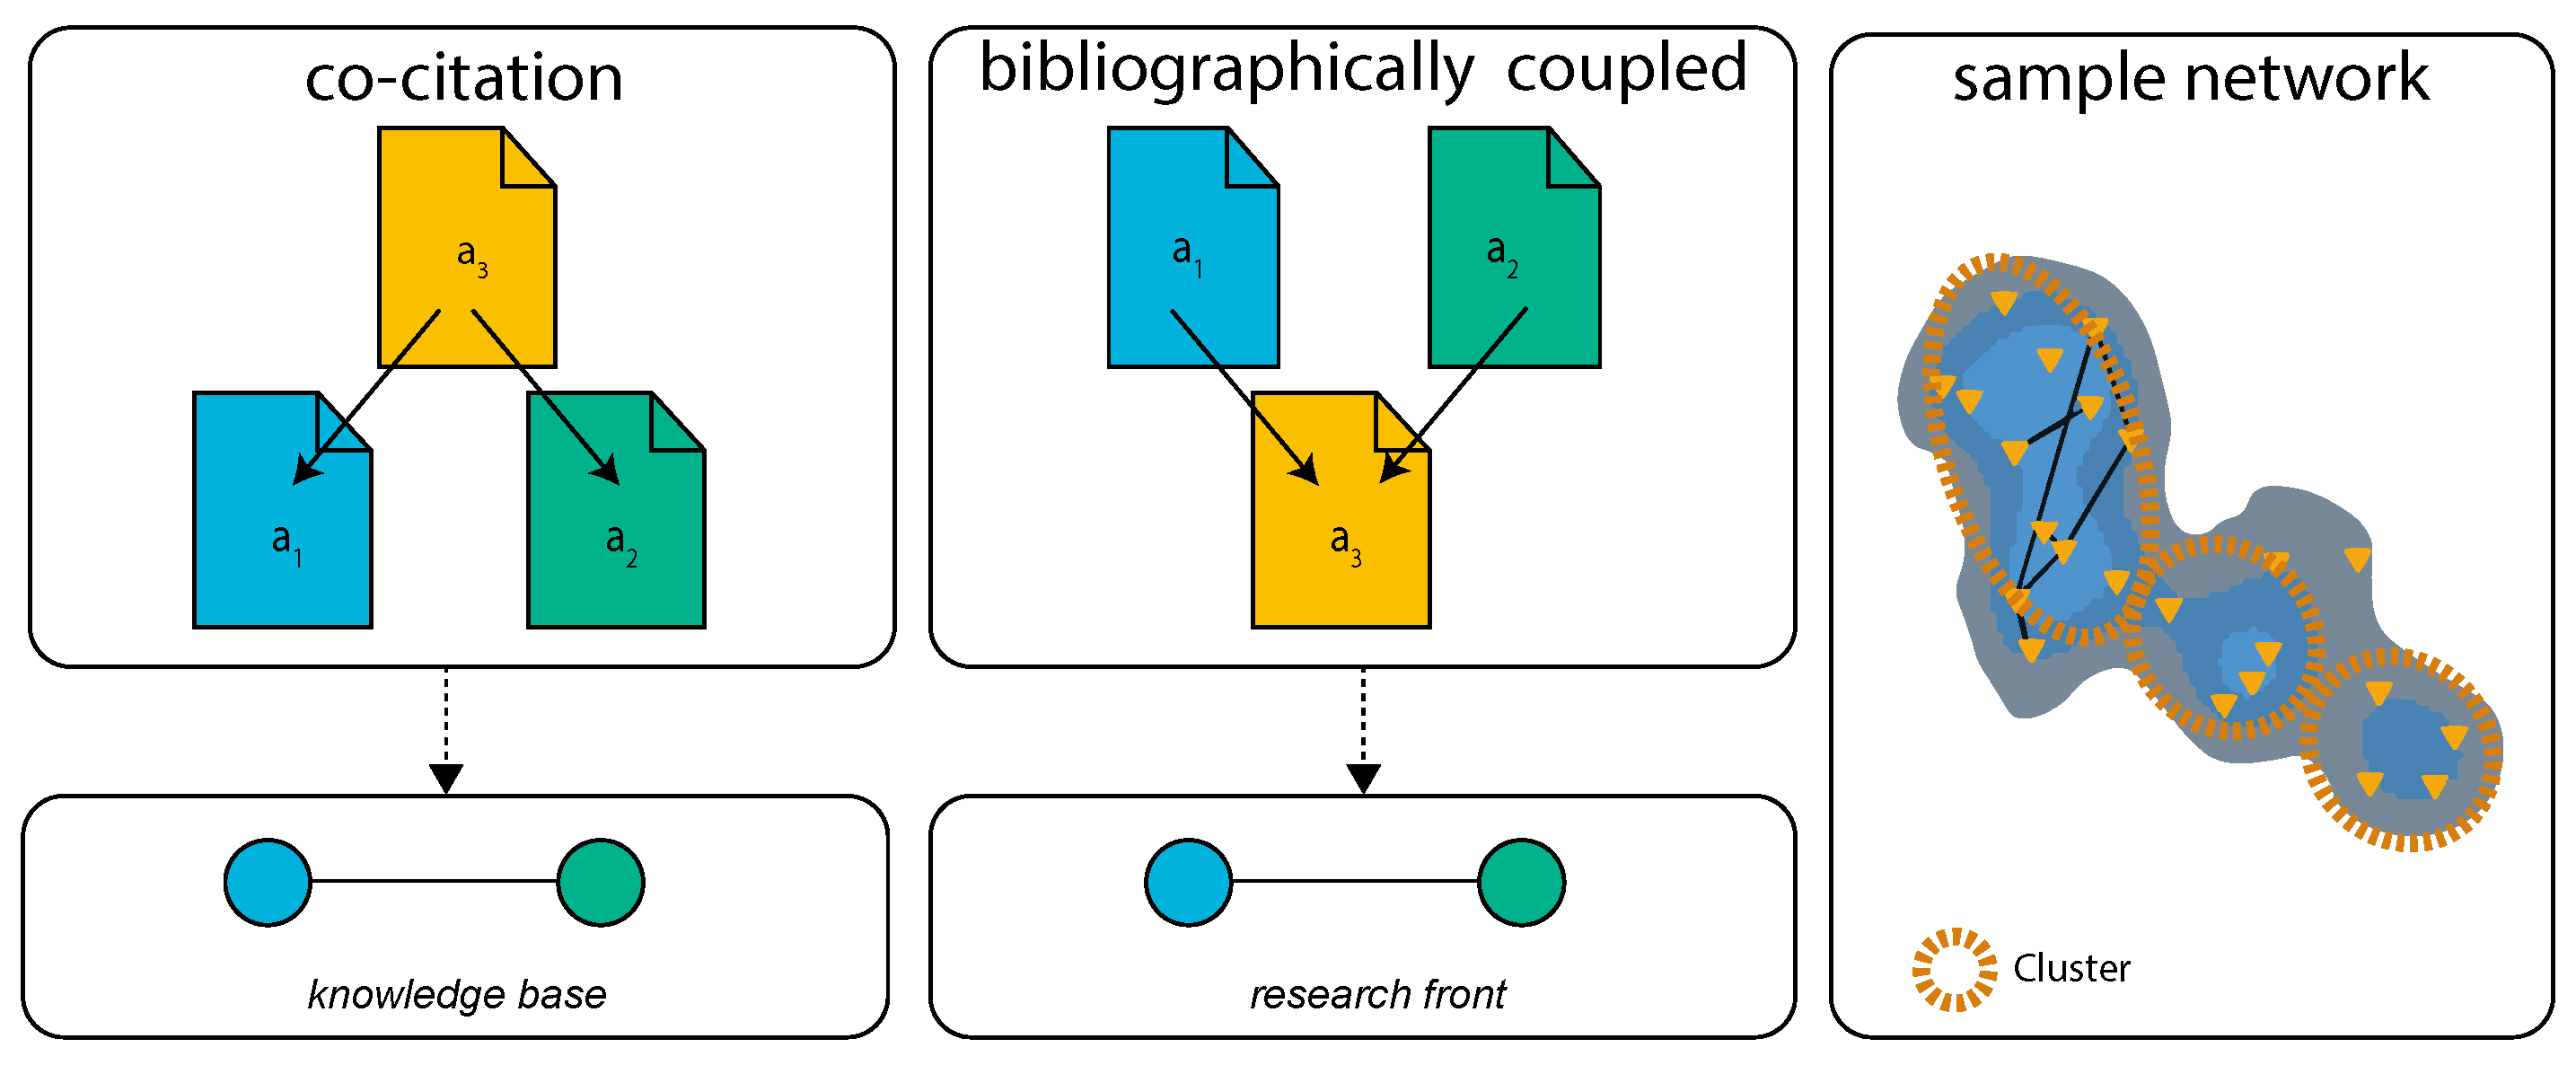
18], which introduced mathematical graphs, denoted as networks, as a suitable solution to represent a set of connected literature. In this network, each article is represented by a node, whereas edges constitute their bibliographic connections. In turn, connections can be established based on a multitude of similarity measures. In general, a similarity measure is based on the assumption that two articles pose a similarity in terms of thematic content. To identify entire research fields, denoted as clusters in a network (cf. Figure 2), two similarity measures are of utmost importance: Knowledge Bases and Research Fronts [19] (cf. Figure 2). Two articles are bibliographically coupled (i.e., they are part of a research front) if they reference the same third article. Couplings between nodes become stronger (i.e., represented by a thicker line in the plotted network) if they co-cite multiple articles. By contrast, two references are connected by co-citation (i.e., they are part of a knowledge base) if they are both referenced by a third article. In addition to identify relevant research fields, we were interested in networks for authors [20], countries, and organizations, which can be established by other similarity measures. Based on the evaluation of networks, valuable results can be obtained according to [21]:
  • Identifying the research field structure
  • Detecting general contextual factors
  • Discovering developments in research
  • Forecasting coming trends
Another crucial aspect in performing a bibliometric analysis concerns the use of an appropriate software tool. In the field of bibliometrics, there exist tools that are specifically developed for for bibliometric analysis visualization techniques [22]). We used NetCulator [23] for the bibliometric analysis we conducted. NetCulator offers features to calculate the mentioned networks. Furthermore, it combines bibliographic coupling with lexical measures that, in turn, compare the similarity of terms (cf. TF-IDF in Appendix A.2). Next, NetCulator calculates hybrid second-order similarities (See Appendix A.2) with severe edge cutting [24]. The latter improves the calculation speed by ignoring all weak edges that result from weak coupling between nodes. Finally, NetCulator computes clusters based on Louvain Clustering [25]. Visualization and layouting for research fronts and knowledge bases either rely on the OpenOrd-Method [26], which provides a quick overview by automatically summarizing clusters, or the Fruchterman-Reingold algorithm [27] enabling a more detailed view. NetCulator offers many other valuable features, we utilized the context of our bibliometic analysis, e.g.,
  • Identifying core articles (i.e., significant papers within a research field).
  • Identifying frequently used terms in a research field.
  • Identifying trends based on calculated timelines [28] for research fronts.
Although the technique of bibliometric analysis is promising, it also comes with some limitations: First, the articles need to be published in an academic database. As a drawback, especially in the field of industrial production, articles are often represented as patents and internal enterprise documents. As another drawback, competition between companies leads to a large number of non-disclosure agreements. Second, any bibliometric analysis is dependent on the choice of the used search strings [29]. Finally, a time lag must be considered, as it might take years for research to be published and cited.

3. Data Set

3.1. Search Strings

Based on a comprehensive literature prestudy, as well as interviews with domain experts, we selected predictive maintenance [3], condition monitoring [30], smart maintenance [31], lean maintenance [32], reliability-centered maintenance [33], and predictive analytics [34] as appropriate search strings for our search strategy (cf. Figure 3).
The Web of Science Core Collection is used to gather the article result set (date of withdrawal: 11 November 2016). Results for the search strings applied to Web of Science are shown in Table 1.
In this paper, we particularly focus on the results related to predictive maintenance. Concerning research history, the first article referring to predictive maintenance in its title [35] was published in 1970 in the field of chemical engineering. The number of papers published per year has significantly increased since the 1990s (cf. Figure 4). For example, in 2015, the extracted predictive maintenance articles had an average h-index [36] of 118 and a mean of 17 . 18 citations per item. By contrast, articles dealing with condition monitoring have an average h-index of 36 and a mean of 2 . 97 citations per item. Finally note that the search string condition monitoring is often used as a synonym for predictive maintenance in case of a costly monitoring approach. Accordingly, the borders between predictive maintenance and condition monitoring blur.

3.2. Preprocessing Dataset

As Web of Science categorizes each article based on a multitude of categories, first of all, we had to choose the relevant ones. To simplify the categorization, we summarized Web of Science categories to sections. Figure 5 illustrates all sections (In addition, the left side of Figure 6 illustrates the distribution of sections for the search string predictive maintenance.) on one hand and the ones identified as being relevant on the other. Based on the relevant Web of Science categories, we filter articles utilizing the white list principle, i.e., we keep an article in the data set, if it matches at least with one of the relevant categories. As can be obtained from Figure 5, we excluded a lot of Web of Science categories for the search string predictive maintenance. First, we calculated an article density for sections (cf. Figure 6, right side). The density is defined as (number of articles in section)/(number of categories in section). If the density for a section is low, the section is excluded.
For example, in the section medicine (cf. Figure 6), the density is very low, meaning that the average number of articles per category is small. The reason we exclude such sections is based on the assumption that predictive maintenance solely plays a side role in these sections.

4. Biblometric Analysis Results

We apply the bibliometric analysis to the data set described in Section 3 using the NetCulator tool. Thereby, for each aspect to be evaluated (i.e., research fronts, knowledge bases, authors, organizations, countries, terms), several NetCulator parameters have to be defined.
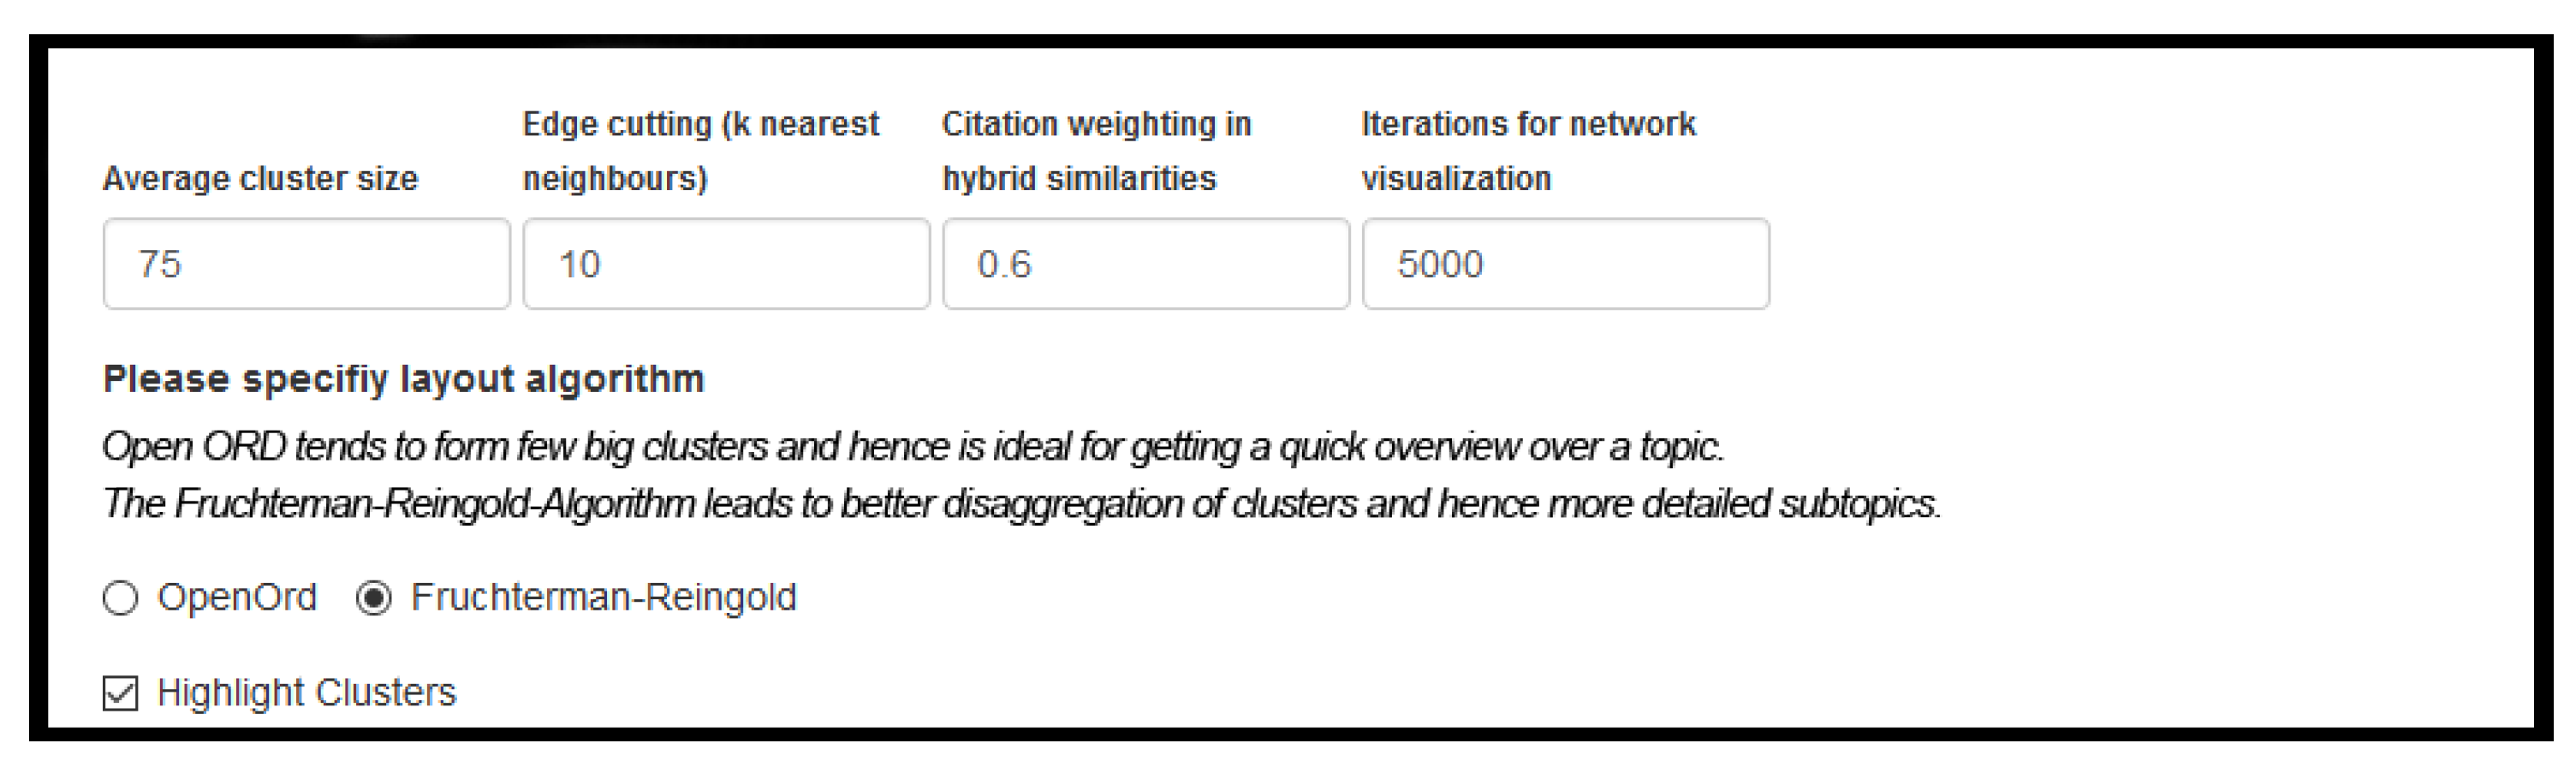
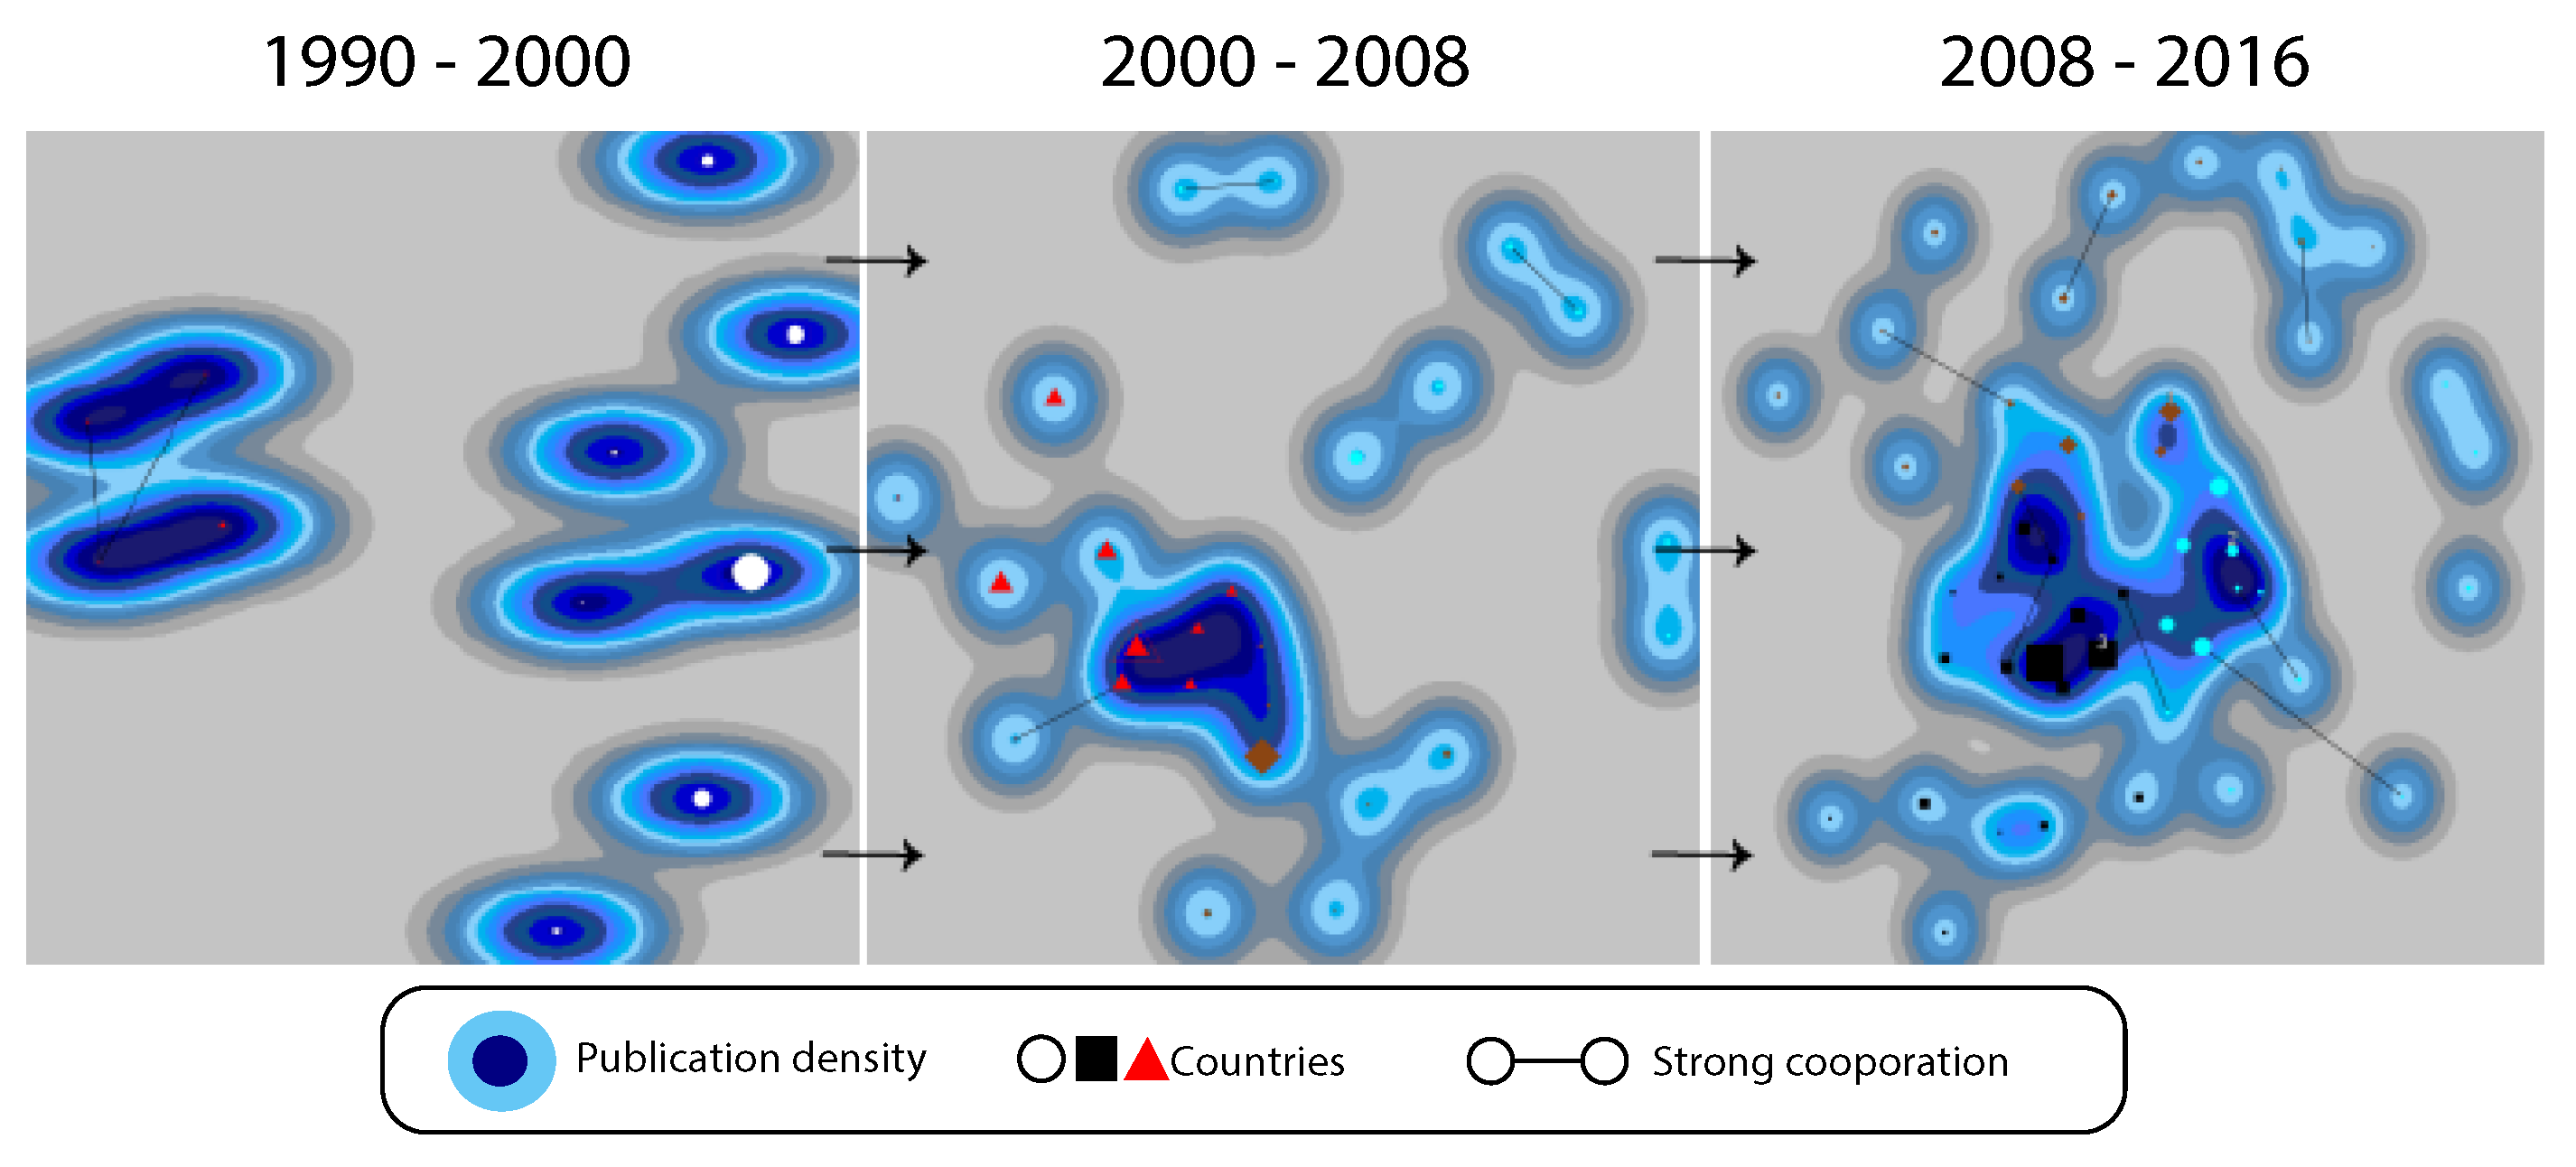
First of all, a time period needs to be specified. For our bibliometric analysis, we decided to do the calculations for different time periods in order to identify how the topic of predictive maintenance evolves over time. More specifically, we use three time periods: [1990–2000], [2000–2008], and [2008–2016]. These periods were defined using an iterative process in NetCulator and comparing emerging paper distributions. Please note that that this is a common way pursued in a bibliometric analysis. Then, the NetCulator user must define many more parameters (e.g., cluster size). Thereby, the user can either use default parameters or specifies his own parameter set. All parameters that can be specified are shown in Figure 7. Finally, NetCulator presents the calculated networks to the user. Please note that that the Figure 7 shows the actual parameters used for the presented bibliometric analysis in this work.

4.1. Predictive Maintenance

In the following, we provide a detailed analyses for predictive maintenance in the aforementioned time periods (cf. Figure 8).

4.1.1. Period 1990–2000

First of all, the results for the first period are based on 175 articles. The first work for this period was initiated by the American Association for Artificial Intelligence, whose subgroup, called Special Interest in Manufacturing (SIGMAN), organized workshops collecting ideas in this context. Since an American organization was pioneering the topic of predictive maintenance in this period, the leading publication nation was the US ( 29 . 7 % ), followed by France ( 8 . 0 % ) and Canada ( 7 . 4 % ). According to Figure 9, we can observe an increasing cooperation of countries over time and a stronger thematic focus. More specifically, each data point in Figure 9 represents a country, a close distance between them indicates researching in similar topics. However, closeness does not necessarily display collaborations, but constitutes an indicator of a high knowledge transfer between the involved countries. In general, the research in this first period did not reveal any outstanding research topic. Accordingly, no leading author or institution could be identified. The keyword analysis for the first period (cf. Table 2) shows a strong connection between the terms predictive maintenance and monitoring as they belong to the same cluster (i.e., Cluster 1 from Table 2. Furthermore, as monitoring is represented by the two keywords condition monitoring and monitoring, this topic is a leading one in this period.
Interestingly, monitoring and predictive maintenance are in the same cluster, while this does not apply to condition monitoring, i.e., in this period, despite the thematic closeness of condition monitoring and predictive maintenance, they were addressed independently. Please note that that this result supports our decision to consider condition monitoring as a separate search string. In general, we assume the following order of complexity for tasks in the context of equipment maintenance systems:
R e p o r t A n a l y s i s M o n i t o r i n g P r e d i c t i o n
Furthermore, we assume the technique monitoring needs mainly humans as decision makers and rarely relies on techniques of machine learning.
After calculating research fronts, we sort the articles based on the number of citations. The most popular paper, according to citations, is denoted as lead document. In a manual inspection, used techniques of the lead document and a thematic field for each cluster have been identified. The collected information are shown in Table 3, where the thematic field is denoted as cluster label. The manual labeling of each cluster, denoted as cluster caption, and the identification of the used technique considers top terms, scanning the resulting articles. Please note that not every article in each research front needs to deal with the topic the cluster caption implies. In general, a bigger cluster size increases the probability of a false-positive cluster classification. The research front clusters from Table 3 are explained in the following. Cluster 1 deals with the continuous status monitoring. This cluster is coined by a joint project between the US and Egypt, as represented by the Alexandria National Iron & Steel Company. Second, in Cluster 2, items were found dealing with vibration analysis. Here, vibrations caused by for example pumps, spindles and motors are used to refer to abnormal machine behavior. Cluster 3 assembles literature that deals with maintenance in risky environments, such as oil refinery and nuclear power plants. With a focus on special electronic equipment, such as radars and motors, Cluster 4 contains research based on the question how to predict electric systems behavior.
Cluster 5 represents the research field of stochastic approaches in various applications. Since not only machines need to be supervised, but also the software itself, the field of software maintenance 6 addresses these challenges with code metrics and fuzzy structures. Cluster 7 lists literature dealing with model predictive control (MPC). It is an advanced method of process control and it is frequently used in the context of lime production and kiln heating. Next, literature concerning emission control is collected in Cluster 8. Emission changes, e.g., caught by a infrared camera, indicate a changing machine behavior. Finally, Cluster 9 is labeled with the term hydroelectricity & photovoltaics. In this cluster, agent-based methods can be frequently found.

4.1.2. Period 2000–2008

First, research fronts and lead documents are extracted analogous to the way described in Section 4.1.1 (cf. Table A1). Some research front labels from the previous period can be reused, while new clusters are presented in the following. The topic of predictive models (1) bundles general approaches to model and improve maintenance approaches, including even basic ideas (e.g., corporations between firms for data exchange). In the previous period, the keyword analysis recognized monitoring (3) as being important, but no further cluster were identified for monitoring. In turn, during the second period, there exists a cluster with a focus on visualization. Third, when considering maintenance, costs constitute an important factor as well. The cluster of cost-based models (4) emphasizes the costs for exchanging and maintaining machine parts. This cluster can be seen in contrast to the approach of reliability-centered maintenance. Concerning abrasion and the condition of cables, the cluster cable diagnostic (8) discusses solutions. With growing complexity of maintenance systems, the management (9) aspect is evolving accordingly. In this cluster, the literature stresses the organization of maintenance strategies as well as the evaluation of their performance. Next, research on motor fault prediction (10) grew forming a cluster. A widely used method in this context is the root cause analysis. Moreover, a new cluster denoted as generic approach (11) was found. Thereby, in most papers data-mining or machine-learning methods are utilized to enable adaptive maintenance systems. Finally, the cluster sensor data (13) deals with the integration of sensors into maintenance systems.
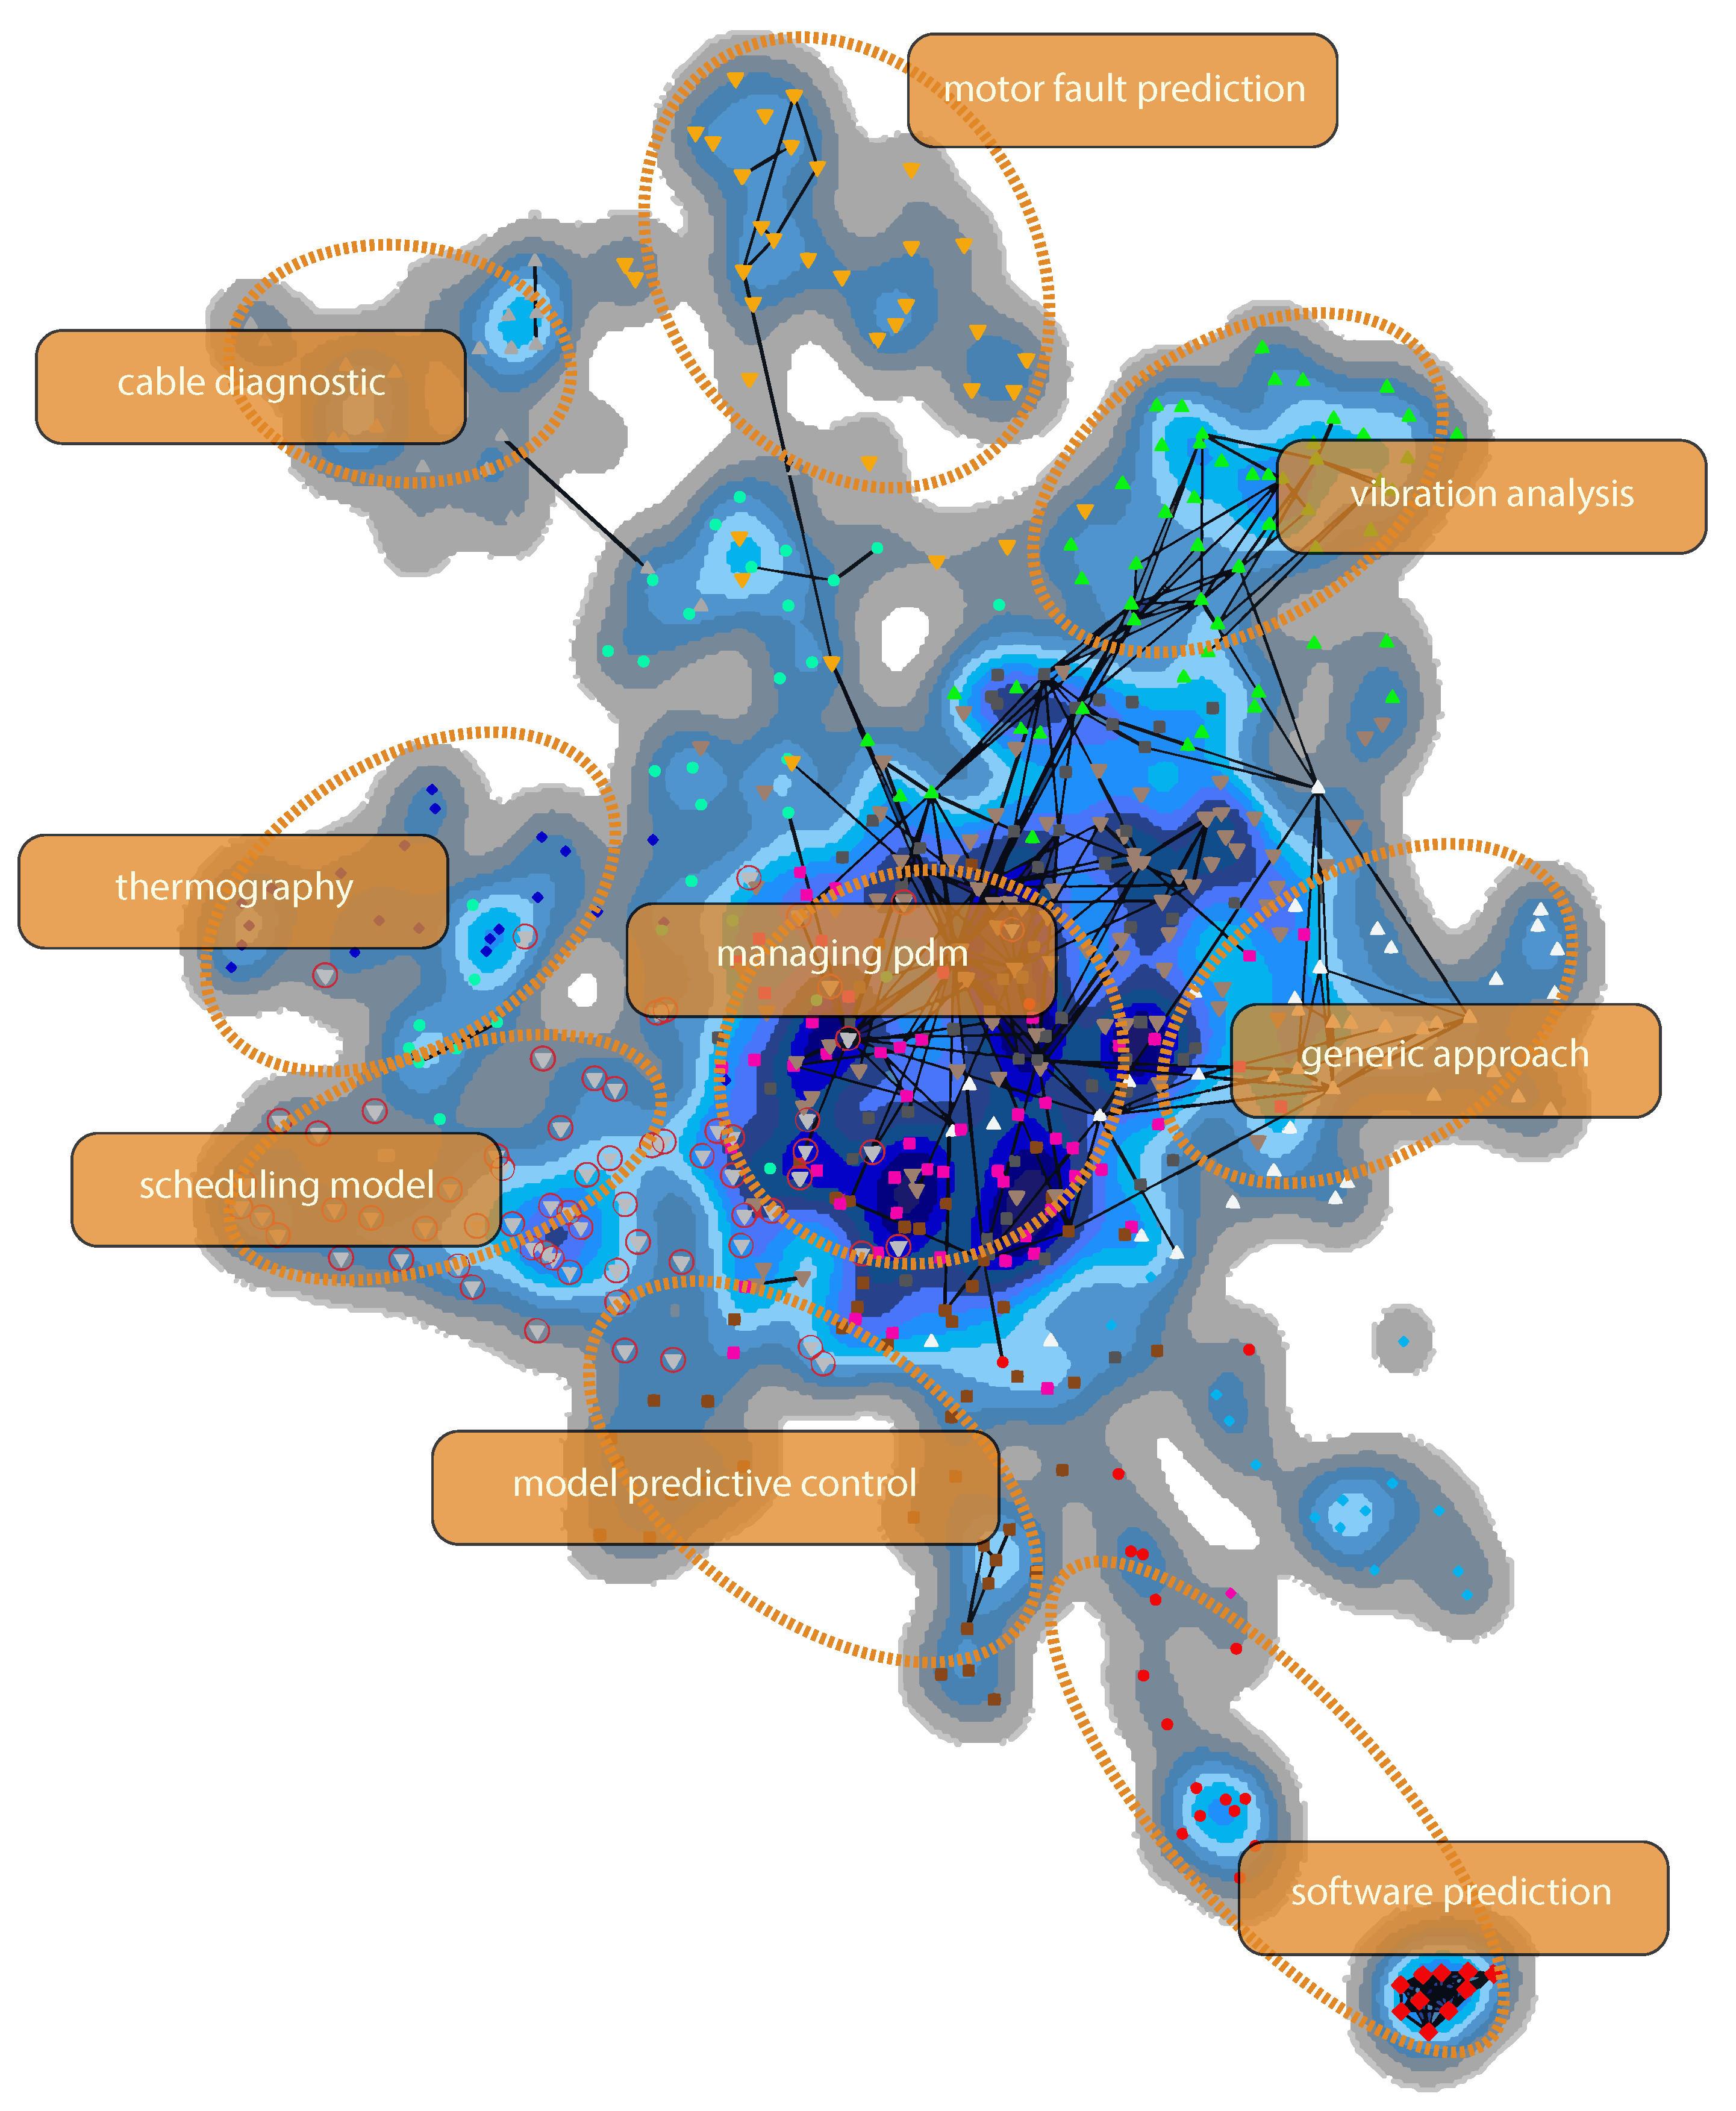
A visualization of the research fronts corresponding to Table A1 is illustrated in Figure 10. Articles from the same cluster are plotted with the same shape and color, whereas their proximity indicates a thematic similarity. Please note that a high article density is marked with dark blue. Figure 10 depicts all 574 papers from the second period. When regarding their connections, however, only the strongest 242 out of 4826 are shown. The research front managing pdm is the central cluster, as it is an indirect part of many other research fields. By contrast, the software prediction cluster is outside of the center as it is not thematically connected to most other clusters.
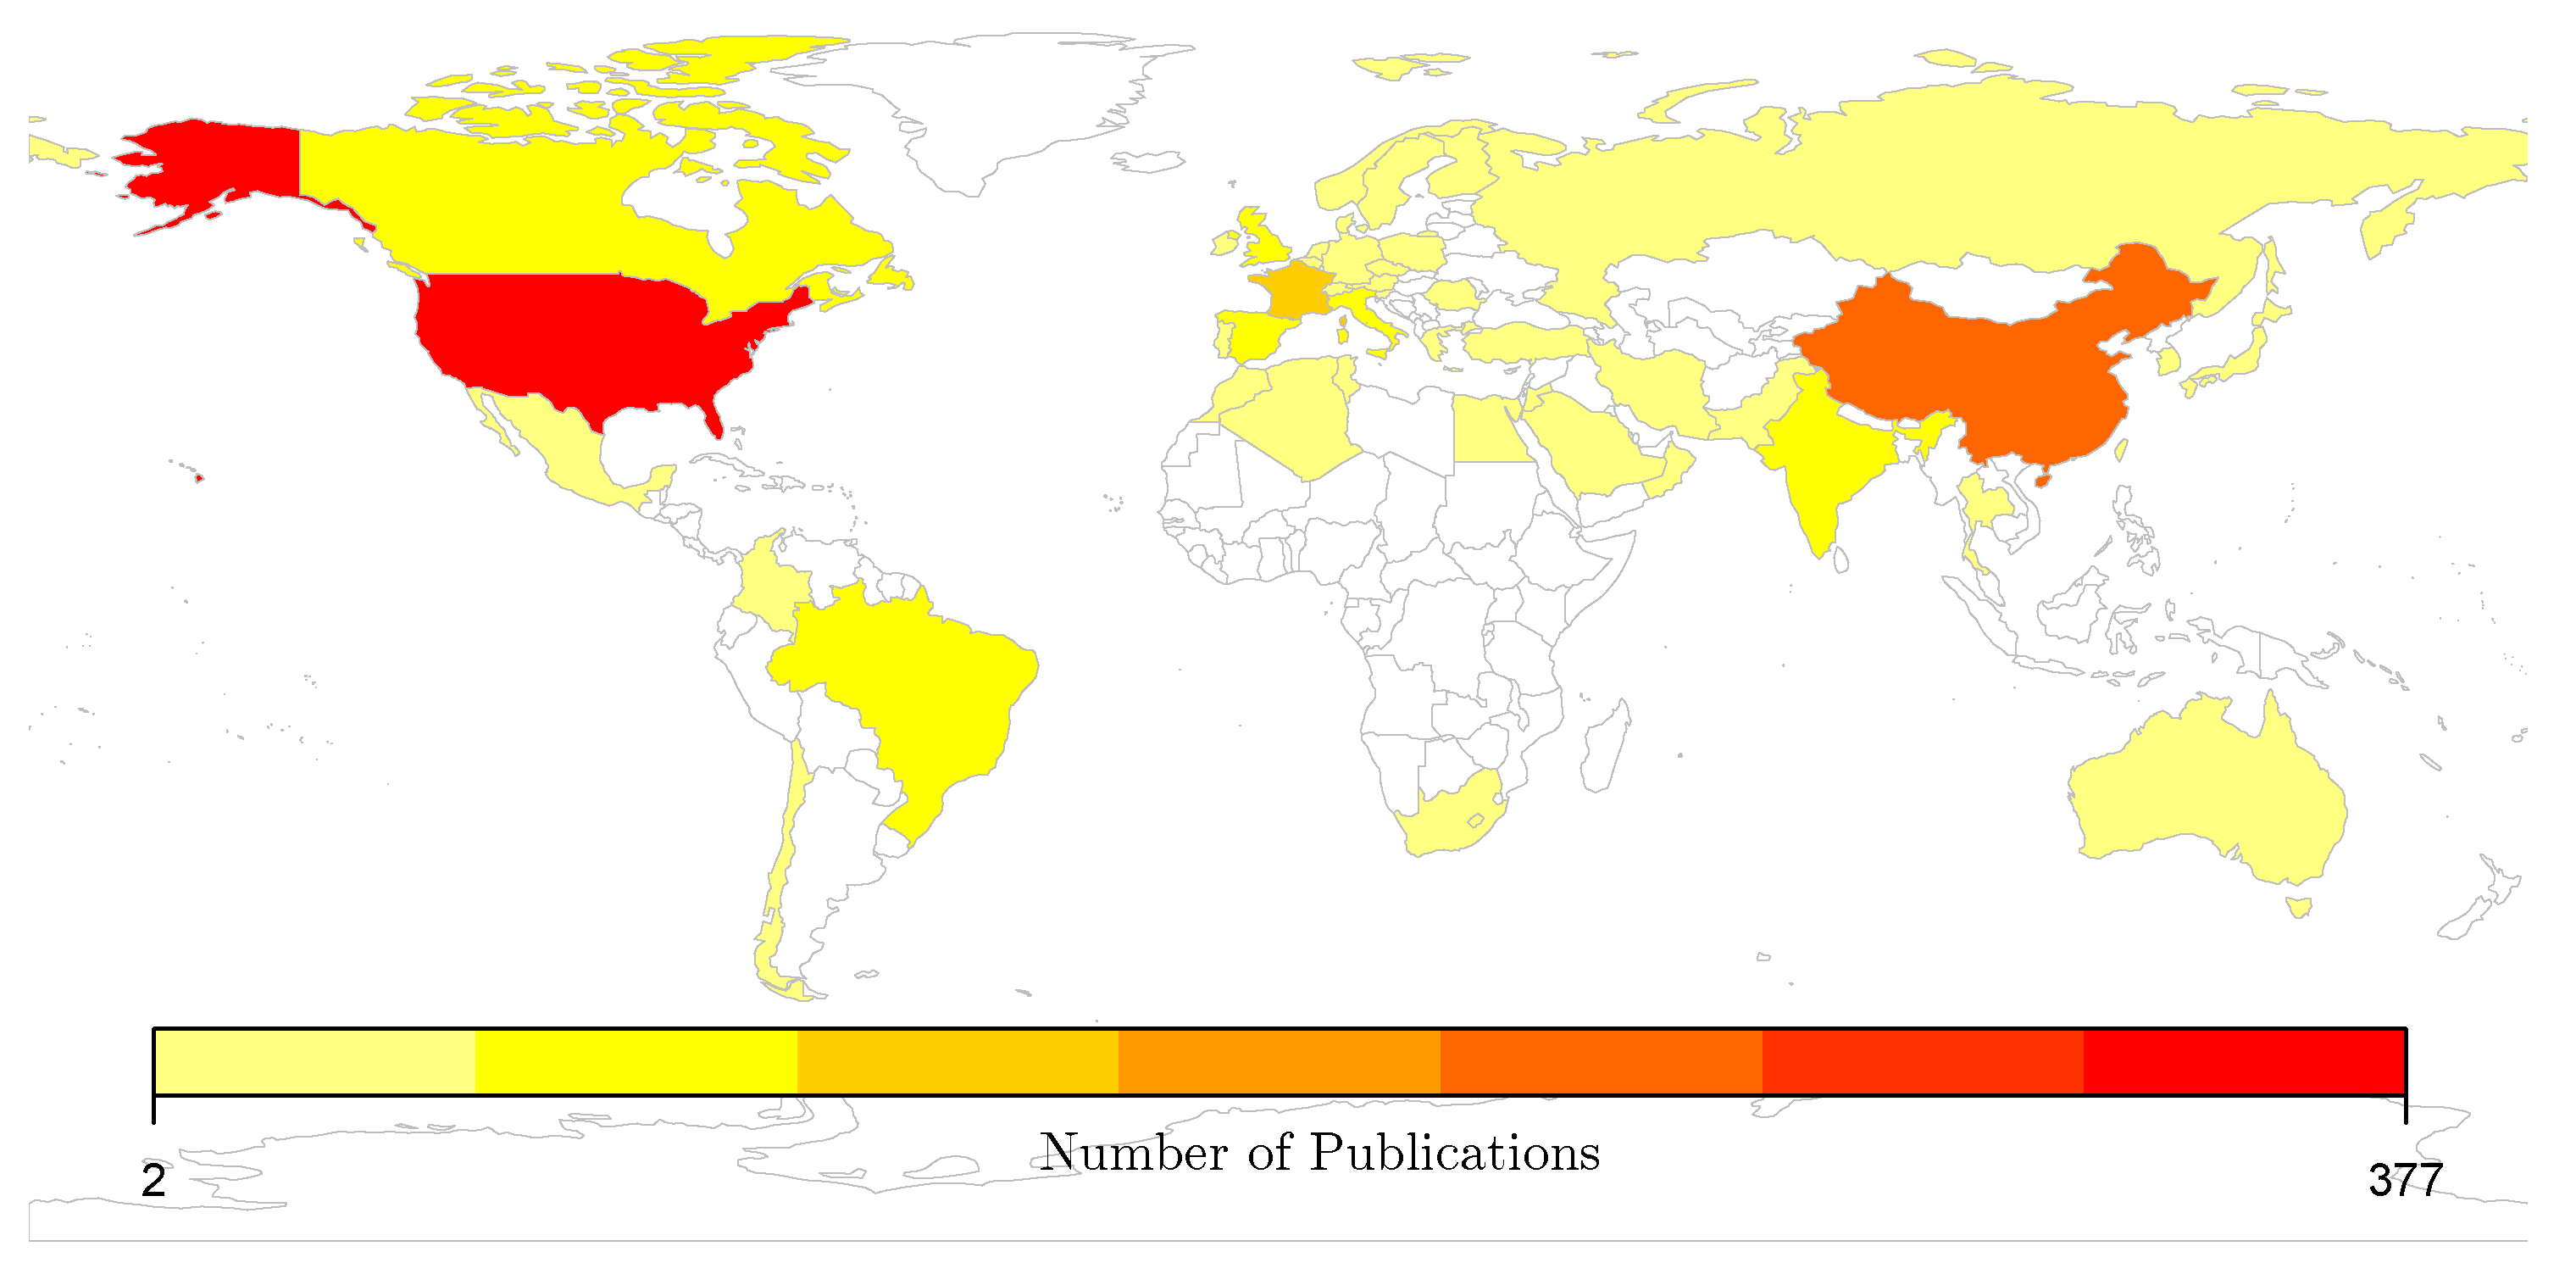
Concerning participating countries in research, the increase of Chinese publications is noticeable. More specifically, the number of publications grew from 0 to 54 (cf. Figure 11), making China the second most publishing country in this field. Remarkable seems to be the fairly low participation in research of highly industrialized countries like Japan and Germany. The United States remain the most active country in the research field of predictive maintenance and the University Cincinnati (Ohio) constitutes the driving force.

4.1.3. Period 2008–2016

Again, first of all, research fronts are calculated and evaluated (cf. Table A2). The newly emerging clusters are presented in the following. First, one of the added clusters deals with multi-component applications (1), that aim to combine data of multiple production units into one predictive model.
With increasing interest in alternative energies, wind turbines (4) come into the focus of predictive maintenance systems. Third, the discipline known as prognostics and health management (5), which links failure mechanisms to system life cycle management, forms a cluster as well. Furthermore cluster Cloud and IoT (6) aims at better production results by, first and foremost, including recent developments from Big Data Analytics and Distributed Systems. Dealing with certain machine components, the analyzes of rolling bearings (7) and capacitors (8) form other clusters. Literature referring to the prediction of metal deterioration due to corrosion is collected in (11), whereas rail maintenance (14) monitors the current state of roads and rails. Finally, by analyzing changes in oil (15) consistency and consumption, a changing machine behavior must be considered. Concerning the publishing countries, China increases its number of publications, while the US remain number one. In turn, the Tsinghua University (Peking) constitutes now the driving force for publications in this topic.
After discussing the results of the periods separately, keywords, research fronts, and techniques over all three periods are juxtaposed in the following.

Keyword Ranking

A first possibility of showing the development of research during the time periods is the comparison of top keywords. Table 4 shows the top mentioned key words, their percentage distribution, and their difference in ranking position compared to the previous period (cf. Section 4.1.1). The ranking difference is denoted as Δ , whereby a positive Δ denotes growing importance of this keyword. Furthermore, letter n stands for not mentioned yet, meaning that this keyword was not introduced in a previous period. Two particular developments can be obtained from Table 4. First, the complexity of predictive maintenance systems rises over time. During the first period, there is a focus on rather simple methods, such as monitoring and preventive maintenance, while their importance decrease during the last period, in which more complex issues (e.g., prediction and prognostics) are addressed. An example of this development can be seen in the ratio between fault detection and fault diagnosis. During the first period, they are equally important, while in the last period the diagnostic part is more important. As a second aspect, the used techniques are not explicitly mentioned anymore in the last period. The disappearance of techniques like neural networks and genetic algorithms, which had an outstanding ranking position before, indicates that they are now in a rather major state, i.e., they are no longer explicitly mentioned.

Research Front Development

To gain insights into the development of research fronts, we sort all identified research fronts according to their relative size in the period and search for recurrences (cf. Figure 12). Furthermore, we identify highly overlapping subjects, using the graphical representation of research fronts, and put related research fronts in brackets. As vibration analysis is constantly present in all periods, it is being revealed as the most important research field. In addition, we discovered that the thematic field Internet of Things gains importance over time and it is connected to generic approaches as well.

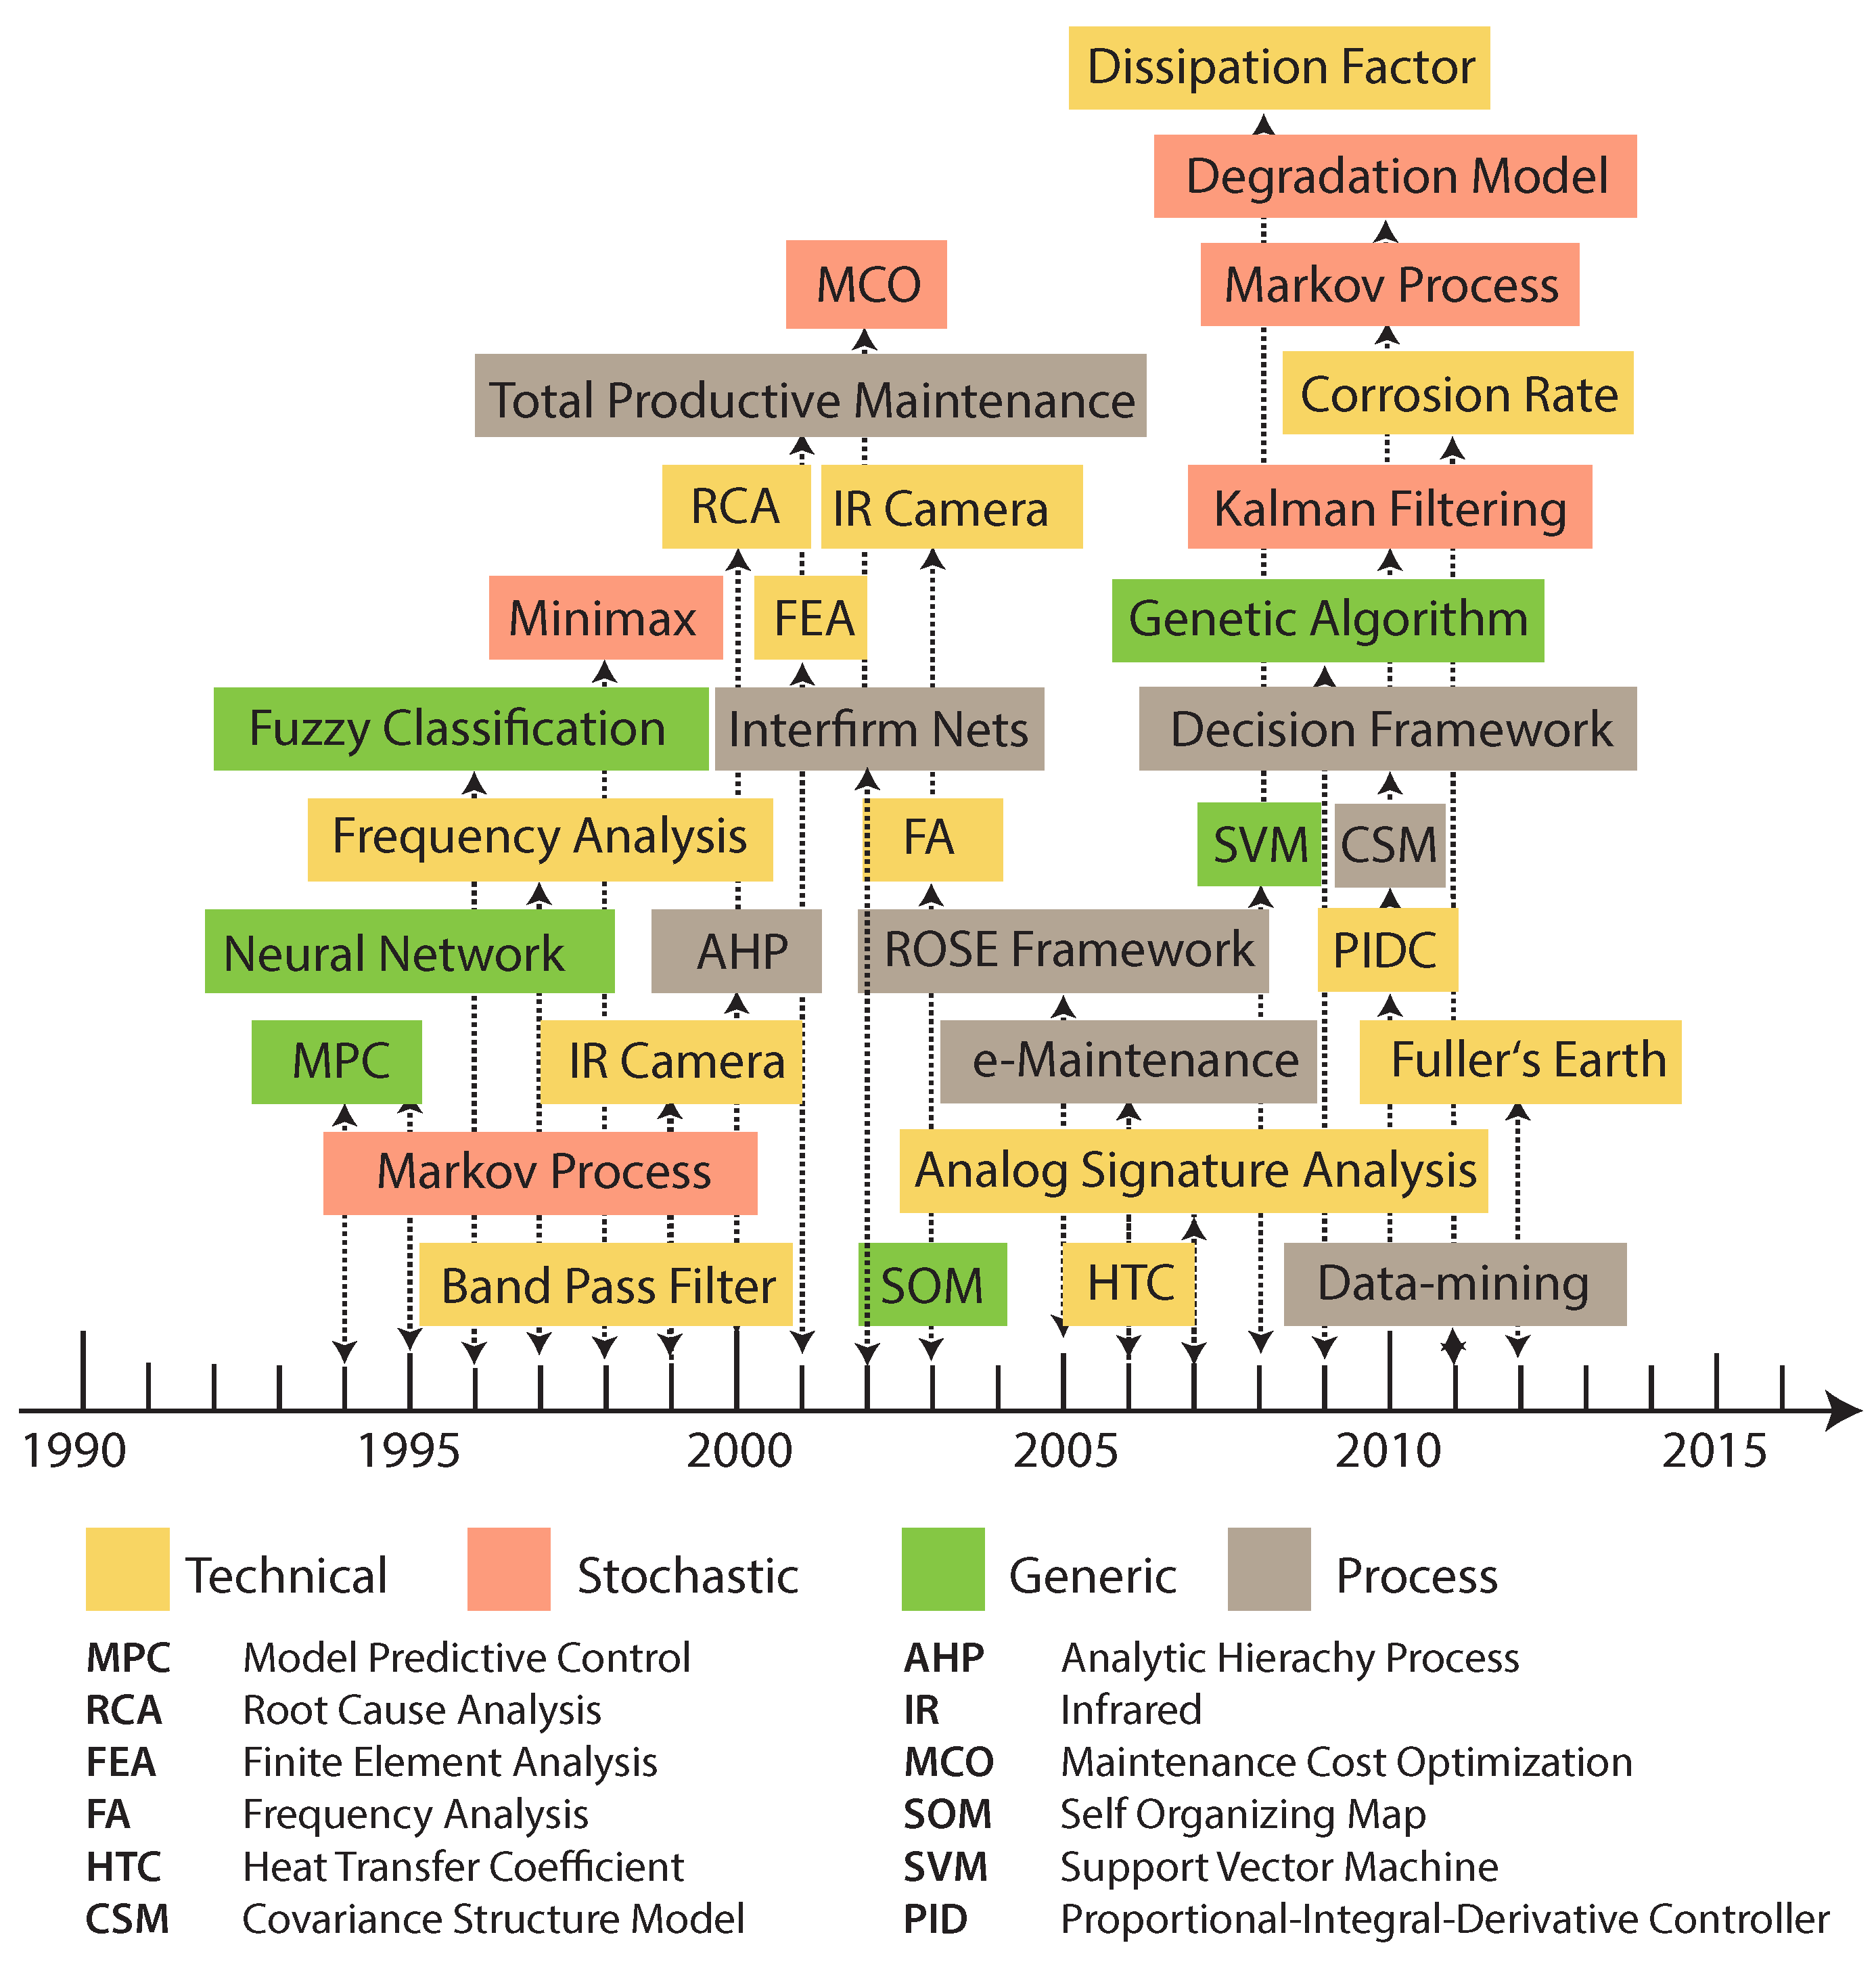
Technique Identification

A final comparison over all three time periods aims to identify the techniques applied in the maintenance approaches. Thereby, for the lead document of each cluster, the used technique is extracted from the abstract and keywords as well as by evaluating the context of the document. In addition, the identified techniques were manually classified into the following four categories:
  • Technical. The approach focuses on application-specific technical parameters.
  • Stochastic. The approach emphasizes the importance of stochastic issues.
  • Generic. The approach deals with adaptive and learning methods.
  • Process. The approach focuses on the maintenance lifecycle.
Based on these categories, the identified techniques are visualized in a timeline (cf. Figure 13) to obtain further insights. In general, we can observe a dominance of technical approaches. Thereby, most research focuses on concrete machine use cases, whereas general frameworks are less considered.

4.2. Predictive Analytics, Reliability-Centered Maintenance, Predictive Analytics, and Smart Maintenance

We combine the datasets of four search strings in order to obtain cluster sizes comparable to the ones for search strings predictive maintenance and 
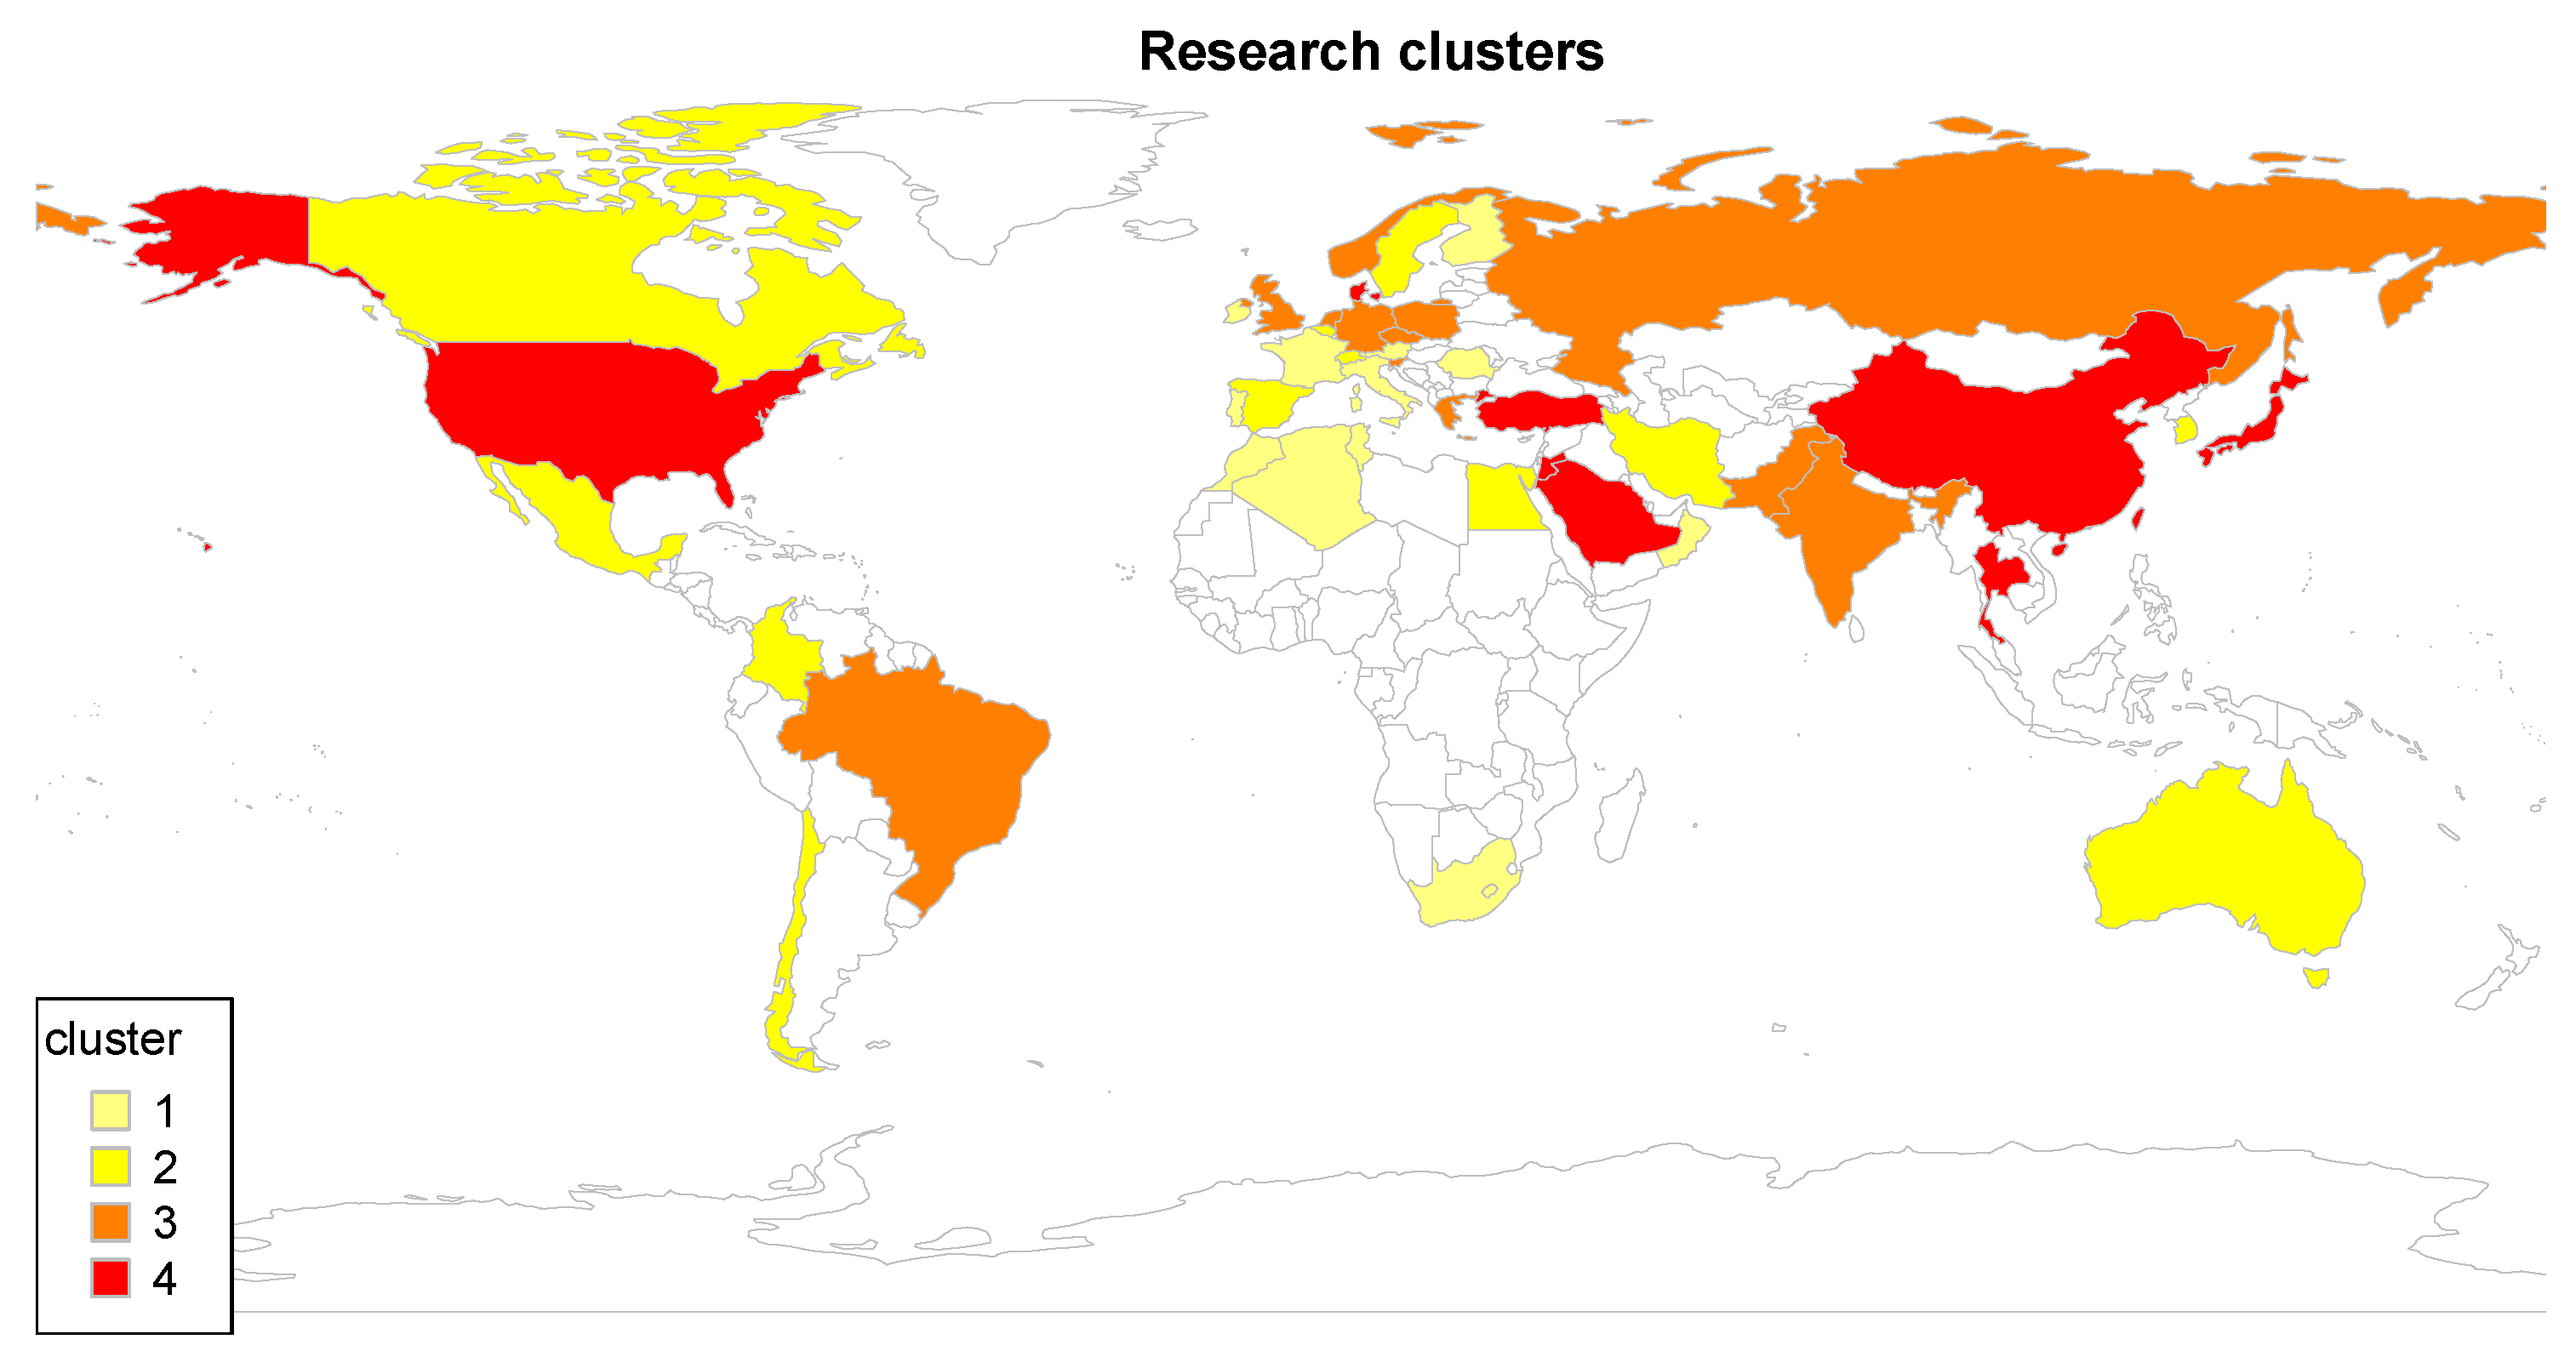
condition monitoring. The resulting dataset, in turn, contains 2330 items. Concerning countries, similar to the results we obtained for predictive maintenance, the US is the driving force in this research field, with the Universities of Washington, Illinois and Cincinnati being leading organizations for the time between 1990 and 2016. Please note that the University of Cincinnati was another driving force in the field of predictive maintenance in the period from 2000 to 2008. Finally, Figure 14 reveals corporations of countries from 2008 to 2016.

4.2.1. Period 1990–2000

Analogous to the approach used for predictive maintenance, research fronts are calculated and evaluated (cf. Table 5). If a research field for this evaluated search string was also identified in Section 4.1, it gets marked with (1)–(3). The numbers (1)–(3) represent periods. For example, the research field sensors from Table 5 was found in the second period of predictive maintenance, with the following results obtained: First, lean networks (1) deal with the process optimization for maintenance, especially for companies that want apply the method of lean production. Reliability-centered maintenance, in turn, can be frequently found in aircraft (2) applications due to the high safety standards required in this field. Finally, explanations on nuclear power plants (3) and sensors (4) can be already found in Section 4.1.

4.2.2. Period 2000–2008

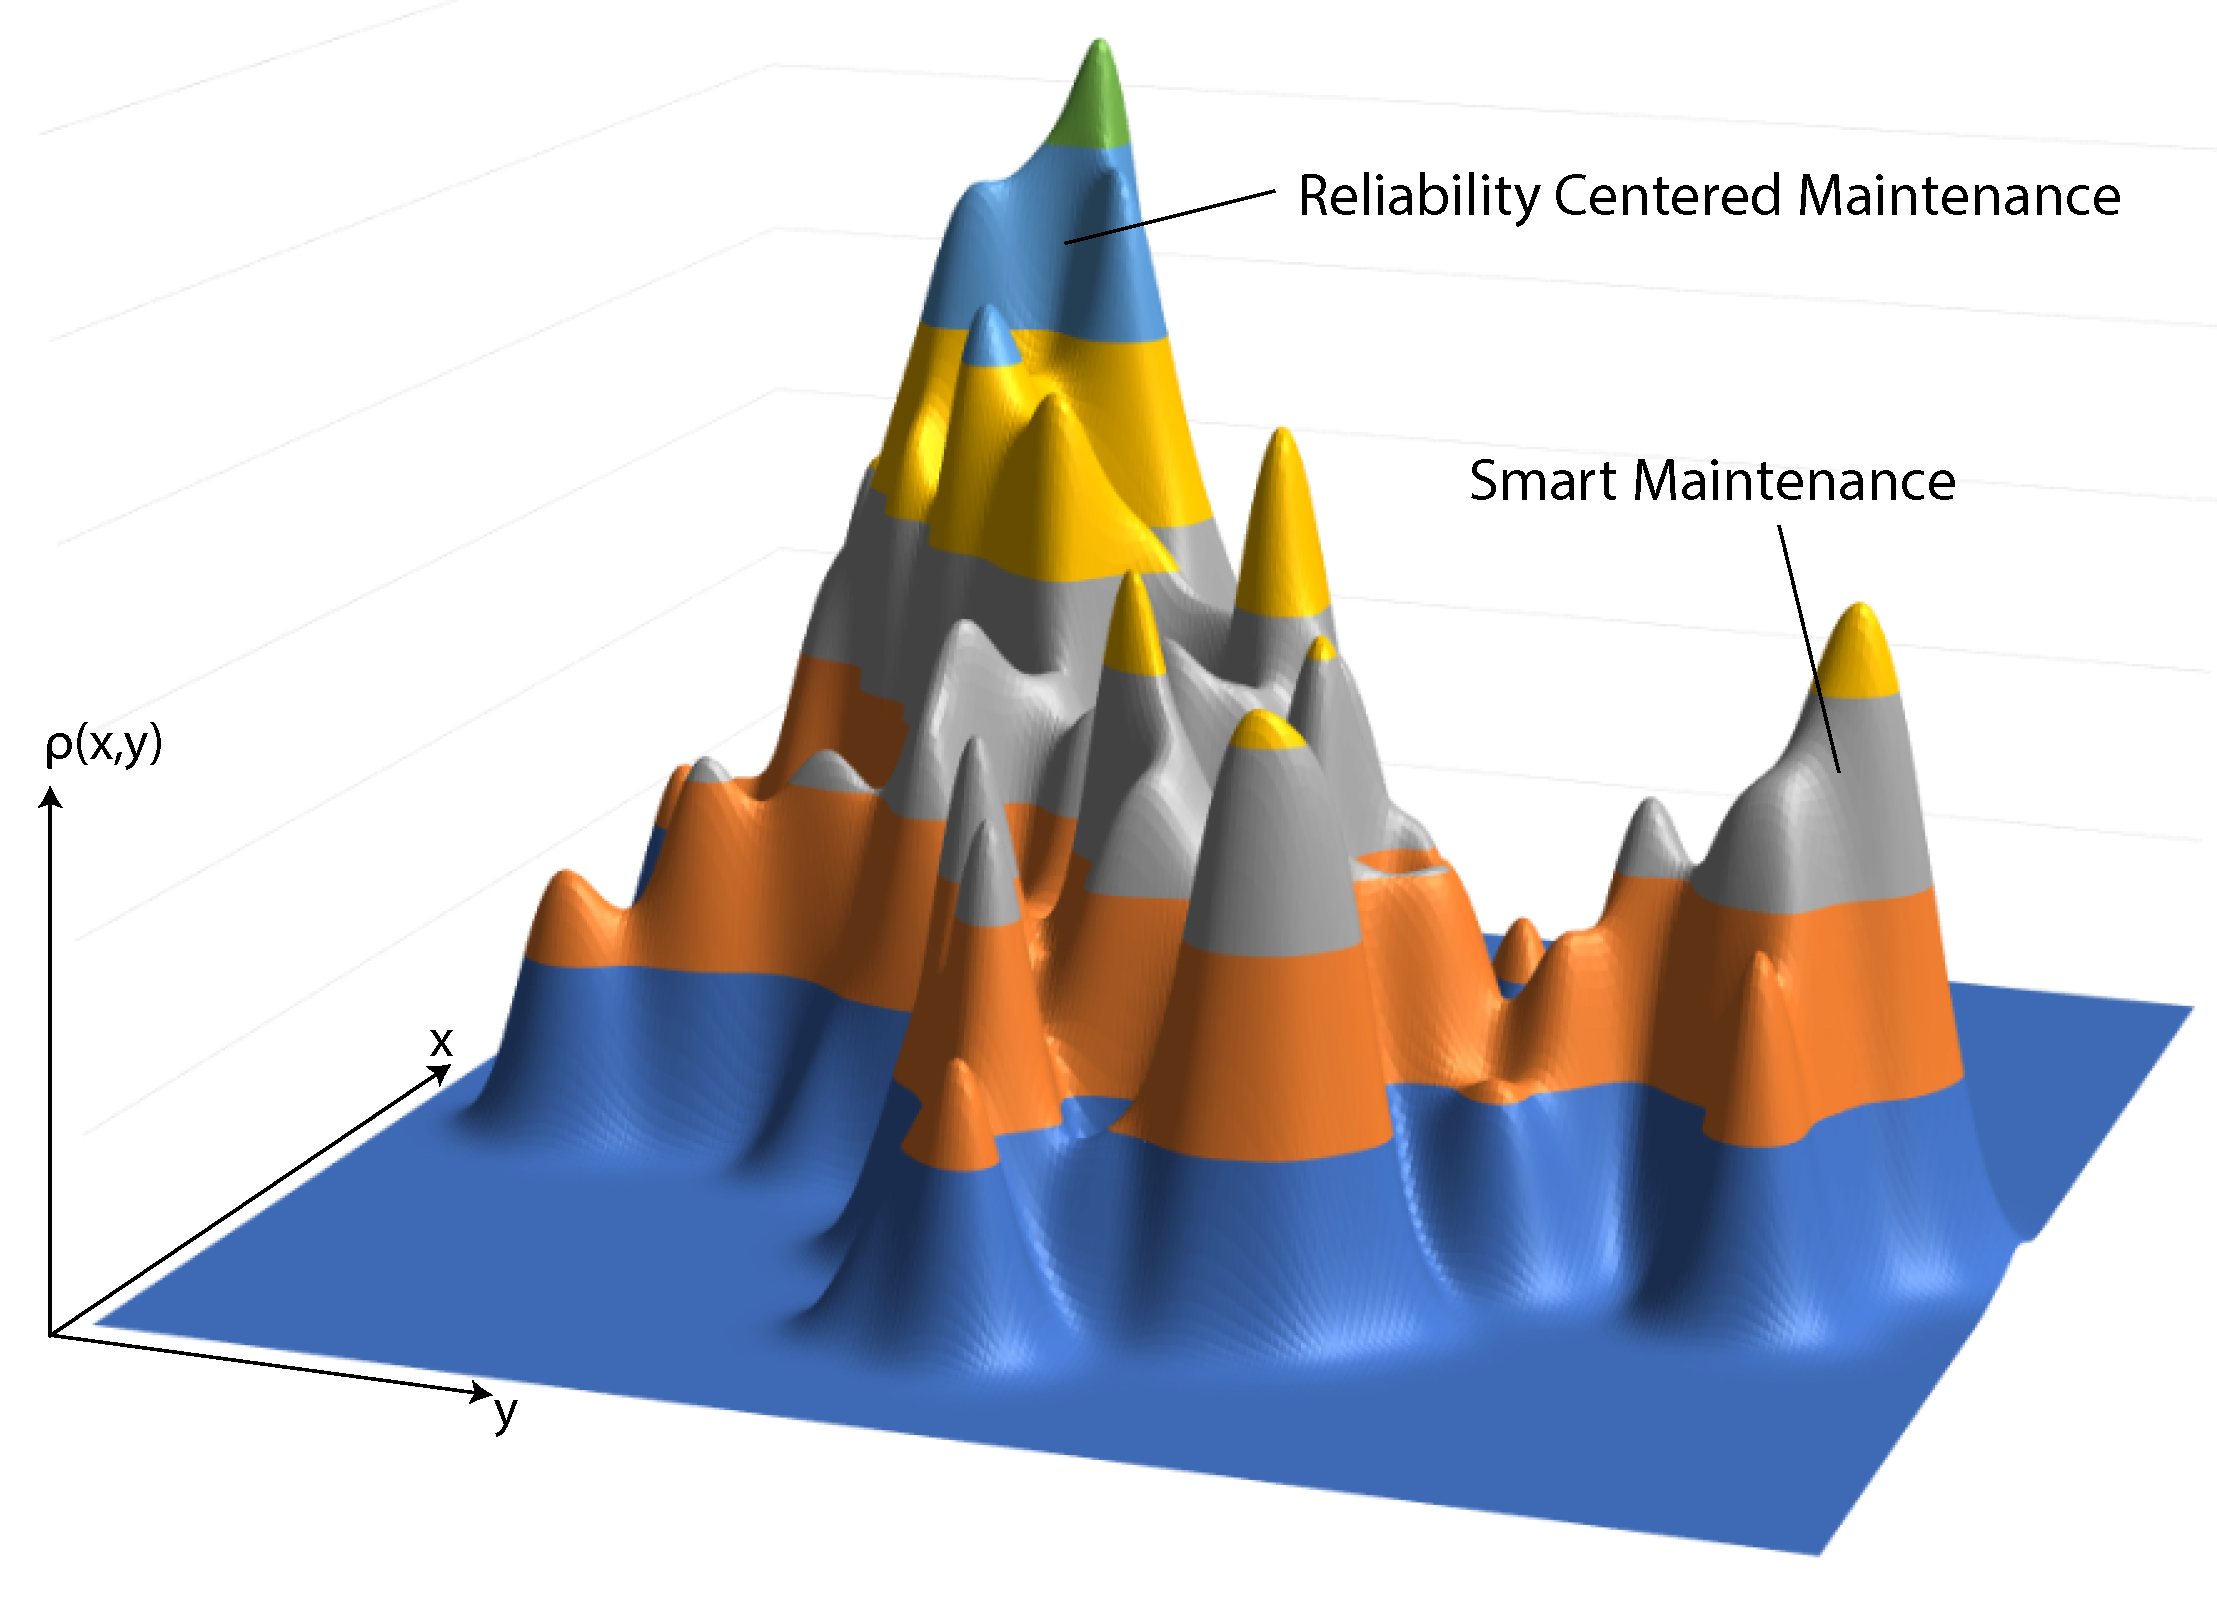
For the second period, the research fronts are shown in a 3D visualization (cf. Figure 15). Figure 15 is based on the same calculated data as Figure 10 (cf. Section 4.1). However, the article density, denoted as ρ , is represented through the height of the 3D surface plot. Thereby, local peaks in the surface plot represent research fields. The latter, in turn, are partly aggregated to finally form seven research fronts of this period (cf. Table 6)). Please note that the results of the search strings reliability centered maintenance and smart maintenance can be clearly separated.
The first cluster revealed is denoted as lean manufacturing (1). It is strongly connected to cluster lean maintenance discovered in the previous period. Second, a main cluster deals with maintainable systems (2). Process-oriented approaches, in turn, are collected in cluster lifecycle management (3). Moreover, clusters condition-based maintenance (4) and reliability-centered maintenance (5) are considered. Finally, smart networks (7) often integrate smart sensors in the production lifecycle.

4.2.3. Period 2008–2016

Table 7 shows the results for this period. Smart meters (1) constitute the first newly discovered research field. These intelligent electronic devices enable two-way communication between meter and production system. Furthermore, Big Data Analysis (3) and Data Science (4) are focusing on data analytics. The increasing capabilities of distributed systems increase the potential for automation systems (4). Finally, total productive maintenance (7) constitutes a method including key performance indicators (KPI) for production control.

4.3. Condition Monitoring

Papers related to condition monitoring contribute the largest dataset. To allow for a comparability with the other data sets, calculation parameters have to be adapted. To be more precise, the average cluster size is increased to 200, whereas each period of time is limited to one year. Hence, the periods differ from the previously defined ones. Following this approach, twelve research fronts were calculated.
Table 8 lists the discovered lead documents and techniques for each year. Interestingly, many known research fields from previous Sections could be observed and only two new research fields were discovered at the end: First, data-driven systems (8) enrich production workflows by including data evaluation methods. Second, cyber-physical systems (12) focus on the combination of physical and software components.

4.4. Engineering Asset Management

As we also consider that the revealed maintenance methods should be applicable in the field of Engineering Asset Management, which is not used as a direct search string, we discuss this connection briefly. Therefore, we show connections between revealed papers and this research field using the definition of general asset management functions as presented by the authors in [15]. First, Risk Management is the process of identifying risks and taking steps to reduce the latter [71]. In case of equipment maintenance, this would be the identification of the Remaining Useful Life (RUL) [72]. It is evident that Condition Monitoring can be directly found in our revealed papers, e.g., as shown by [73]. Next, the Asset Usage Life Cycle is of paramount importance and [70] uses this concept for energy storage systems. Moreover, maintenance strategies have a great impact on Performance Measures, as shown, for example, by the authors of [74]. Finally, Intelligent Information Systems enrich maintenance approaches by improving the reliability [66]. In conclusion, our revealed papers cover many parts of the Engineering Asset Management field.

5. Importance Measure

By collecting all lead documents for each time period, we obtain lists with potentially relevant papers. Please note that the importance of literature entries in these lists is not directly comparable for two reasons. First of all, when judging the importance of a paper, not only the number of its citations should be considered. Additionally, for two papers with same number of citations, their date of publication should be considered as well. For this purpose, we introduce a correction factor t c n (cf. Equation (2)). Second, the citing culture differs across the various research fields. For example, in economics, the mean number of citations is higher than in computer science. In line with the latter observation, regarding the results of search string Lean Maintenance, we obtain articles with high numbers of citations that mainly focus on management-oriented issues ([46,50]). To reduce these two effects and to express aspects from the bibliometric analysis more properly, we propose an alternative impact measure. (For a general overview of impact measures see [86]).
The first part of the importance measure represents anomalies caused by the different search strings (Predictive Maintenance (PDM), Condition Monitoring (CM), Predictive Analytics (PA), Reliability-centered Maintenance (RCM), Lean Maintenance (LM), and Smart Maintenance (SM)). Assuming that the search strings differ in their relevance for state of the art equipment maintenance systems, we express their importance on scale from 0 to 1. This factor is denoted as topic neighborhood(tn) assigned to each article a:
t n ( a ) = 1.0 , a { P D M } 0.7 , a { C M } 0.4 , a { P A R C M L M S M }
As opposed to the h-index [36], which cannot decrease over time, we apply a logarithmic reduction (cf . Figure 16) for the value of a citation. For example, Figure 16 shows a decreasing, normalized influence value for 88 fictive citations over a time span of 18 years.
Since the bibliometric analysis is based on clustering, it seems to be appropriate to include the relative cluster size (cs) of a cluster c in period p as well. In addition, the average h-index of the first and last author will be part of the importance measure to express that literature from authors widely read is very important. Finally, graph-based indicators contribute to the importance measure. The important papers from a cluster can be identified using the article degree, also named as well valency [87]. Besides, according to the graph theory, a cluster can be denoted as a graph G, with each article representing a vertex v, where deg(v) is the number of edges incident to the vertex. A second graph unit is betweenness [88], which constitutes a centrality measure. Betweenness represents the number of shortest paths in the cluster that cross v. Clusters containing a high number of items automatically produce large betweenness values and. Hence, the betweenness needs to be calculated relatively to the cluster size.
In a nutshell, the importance index of an article, suggested by us, considers the following attributes:
  • age t [2016-publish year]
  • times cited tc
  • cluster size cs
  • number of items n p in the assigned period p
  • h-index mean ( h i ) of the first and last author
  • topic neighbourhood tn
  • degree d
  • betweenness b
The newly introduced importance measure refers to five different variables (cf. Equation (2)), whereby each term is weighted according to the preferences of the study leader. For our analysis, we stress the importance of the centrality measures. (cf. Equation (3)).
t c n = t c · t n ( log ( t + 1 ) + 1 ) , c s n = 100 · c s n p , h n = h i , d n = d , b n = b n p
The resulting impact factor for each article is then calculated as follows:
i m = 0.3 · t c n + 0.15 · c s n + 0.05 · h n + 0.25 · d n + 0.25 · b n
The impact measures of selected articles and the parameters involved are shown in Table 9 (all values are normalized), accompanied by the statistical measures average (avg), median (med), and standard deviation (std). Please note that the high weight of the centrality measures leads to top positions for articles showing excellent degree and betweenness values. Exemplarly, we will discuss the first row of Table 9. The paper was cited 53 times and was 5 years old when the collection process took place. It is indirectly connected to maintenances and receives therefore the topic neighbourhood of 0.4. According to Equation (2), the value t c n is calculated and is 0.03. This number indicates that this paper is relatively seldom cited among all papers. Next, the paper was revealed as the most important paper in a cluster of size 318 in a period with 1813 entries. This results in a relative cluster size of about 17% and a normalized value of 0.43. According to Web of Science the h-Index of the first and last author are 17 and 15, which produces a normalzed value of 0.4. Both degree and degreeness are the highest values among all papers and therefore represented by the normalized value 1. Using Equation (3), the final importance measure for this paper is 0.59.
Finally, two other aspects need to be mentioned. First, the presented ranking can be easily parameterized by changing the values of tn and the used weights. Second, the introduced importance measure is well suited for a complex bibliometric analysis including various research areas.

6. Forecast

We forecast the development of identified research fronts based on the history of scientific and public interest. According to [90], 
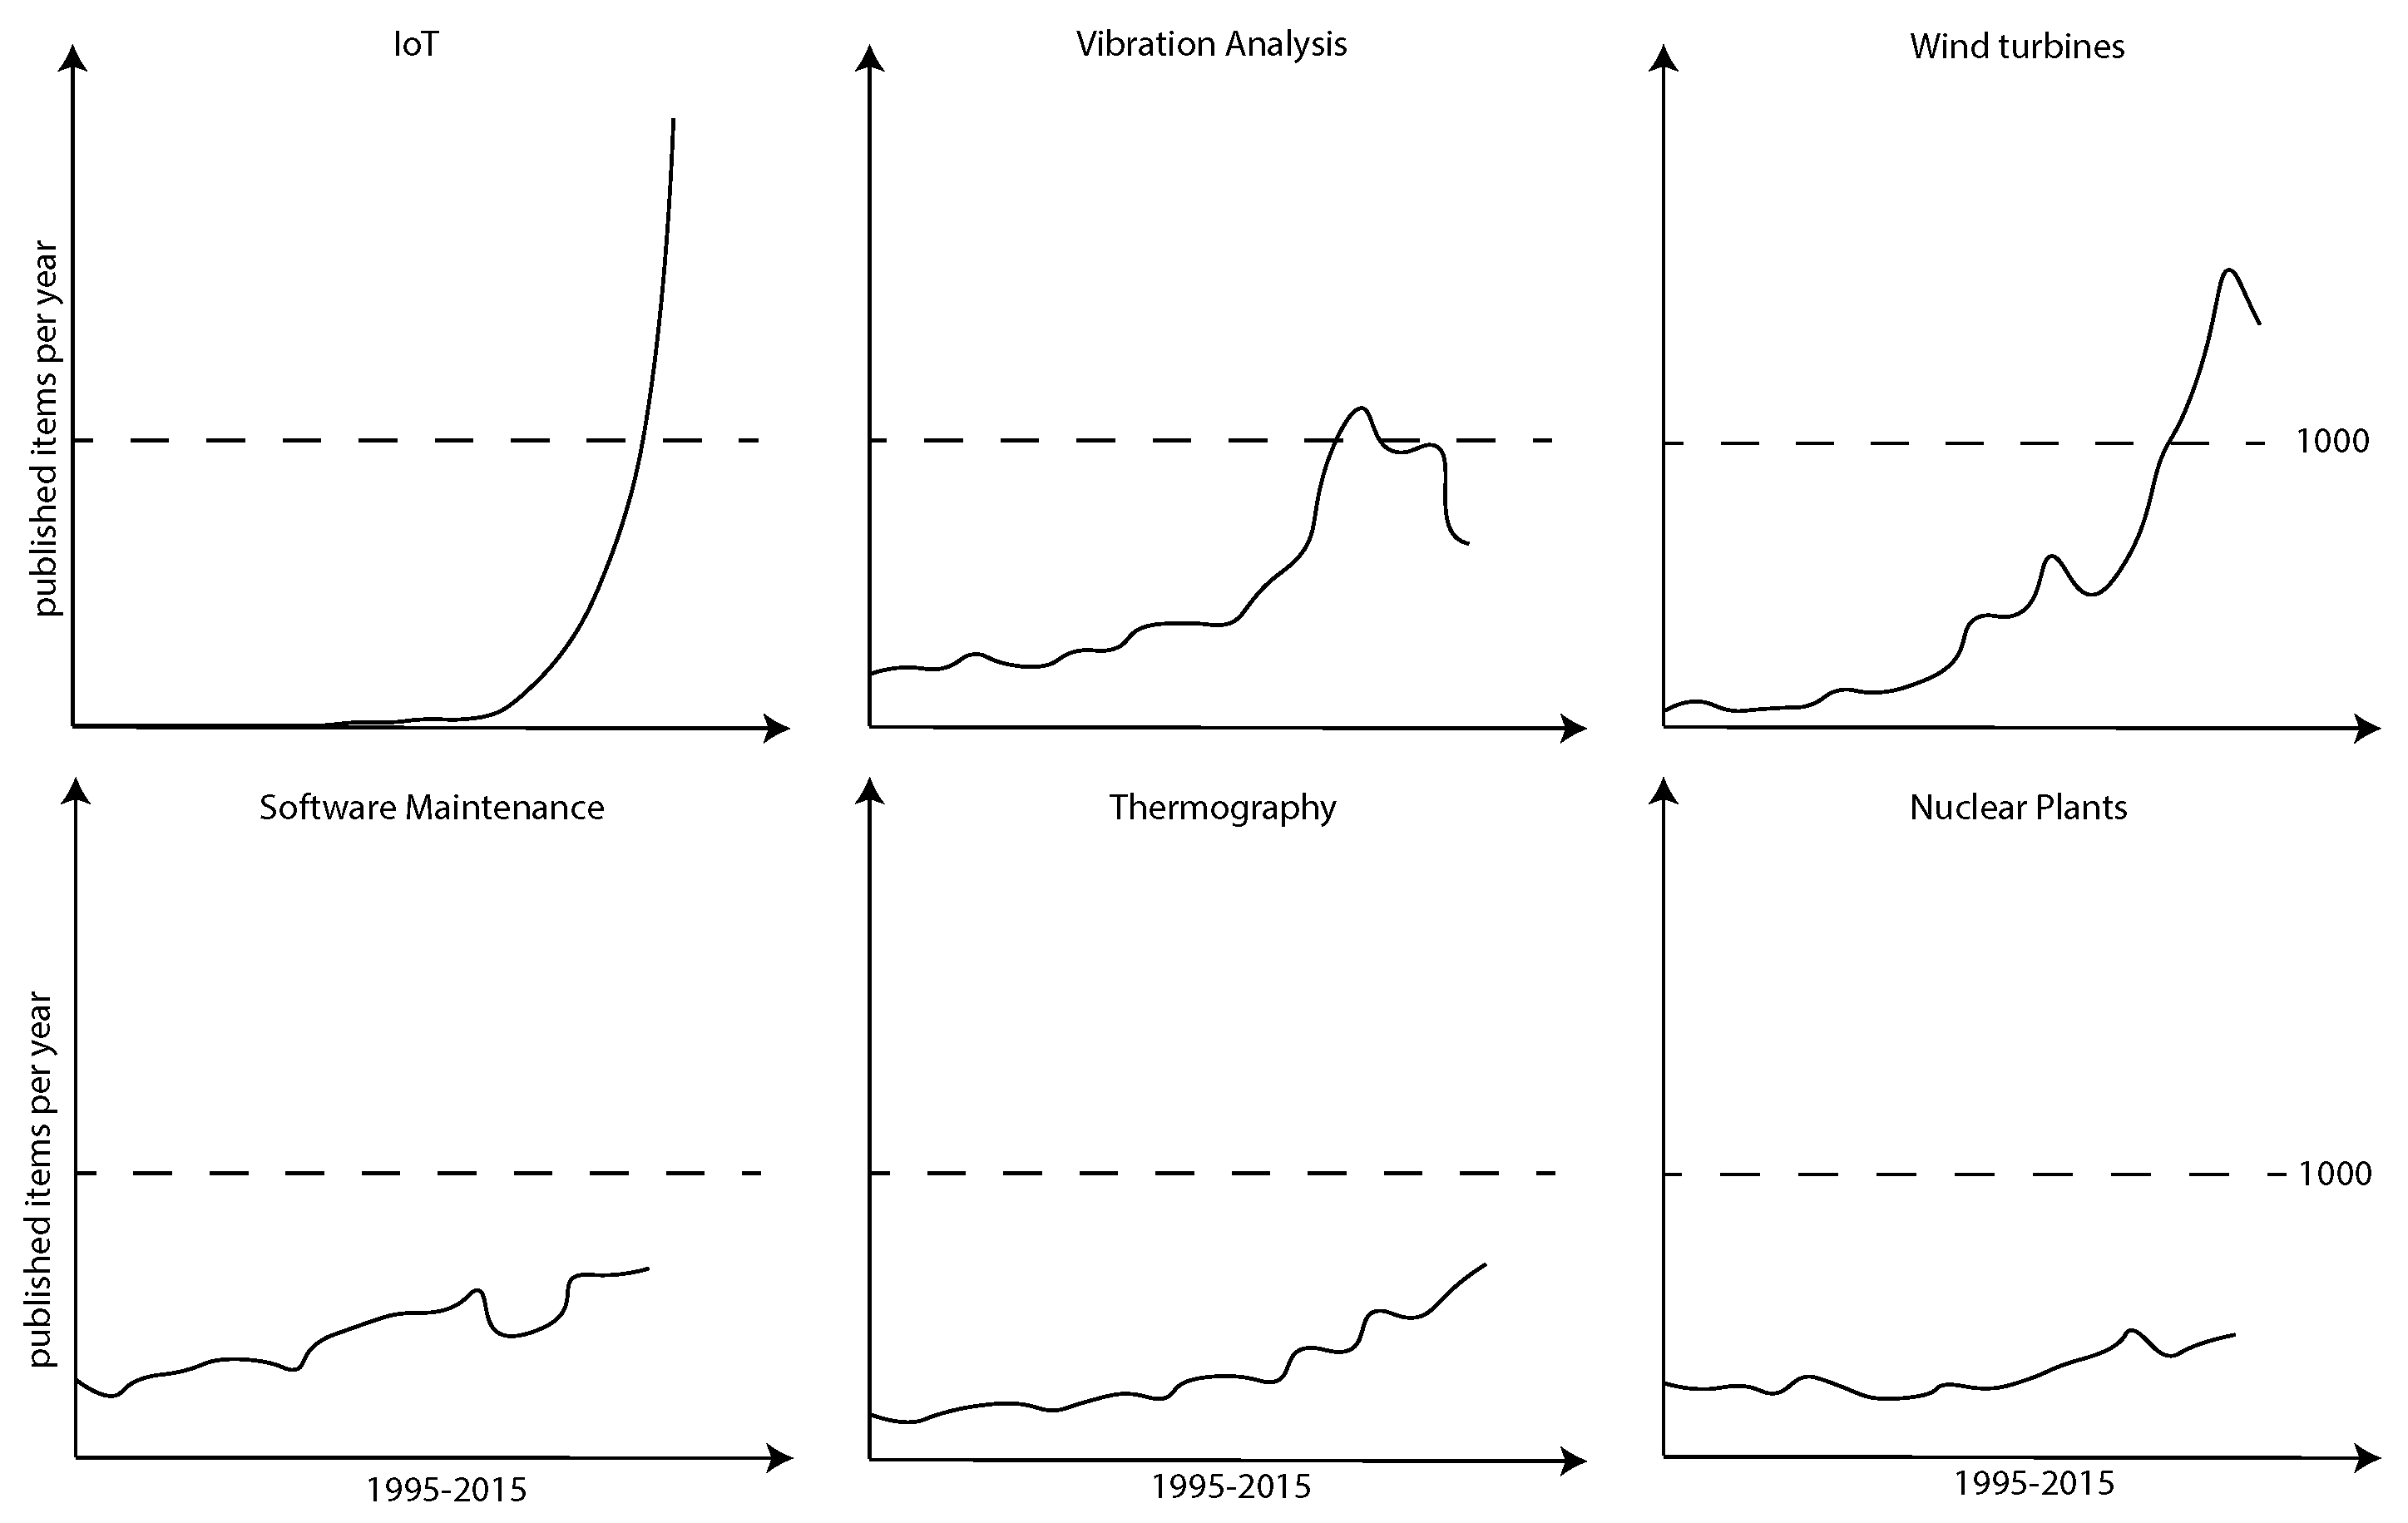
scanning constitutes a prerequisite of forecasting. Scanning involves “collecting information: the system, history, and context of the issue [...]”. We collected the required information from our bibliometric analysis. For this forecast, we only include those research fields connected to search string predictive maintenance. Thereby, we assume that a higher interest in the topic will result in more publications. Furthermore, we distinguish between scientific and public interest. To describe the scientific interest, six research fronts from the period 2008–2016 were chosen and their names were used as new search queries for Web of Science. This period constitutes the latest one and, hence, the most important period for us. From this period, we take six important research fronts and analyze their development over the last 20 years; i.e., according to the published items per year. . This time, we were not interested in extracting literature, but in measuring the published items per year (cf. Figure 17). Interestingly, the development over the last 20 years has shown a significant growth in almost all connected research fields. In particular, the research front Internet of Things is identified to be a potential driving force for publications in the context of predictive maintenance.
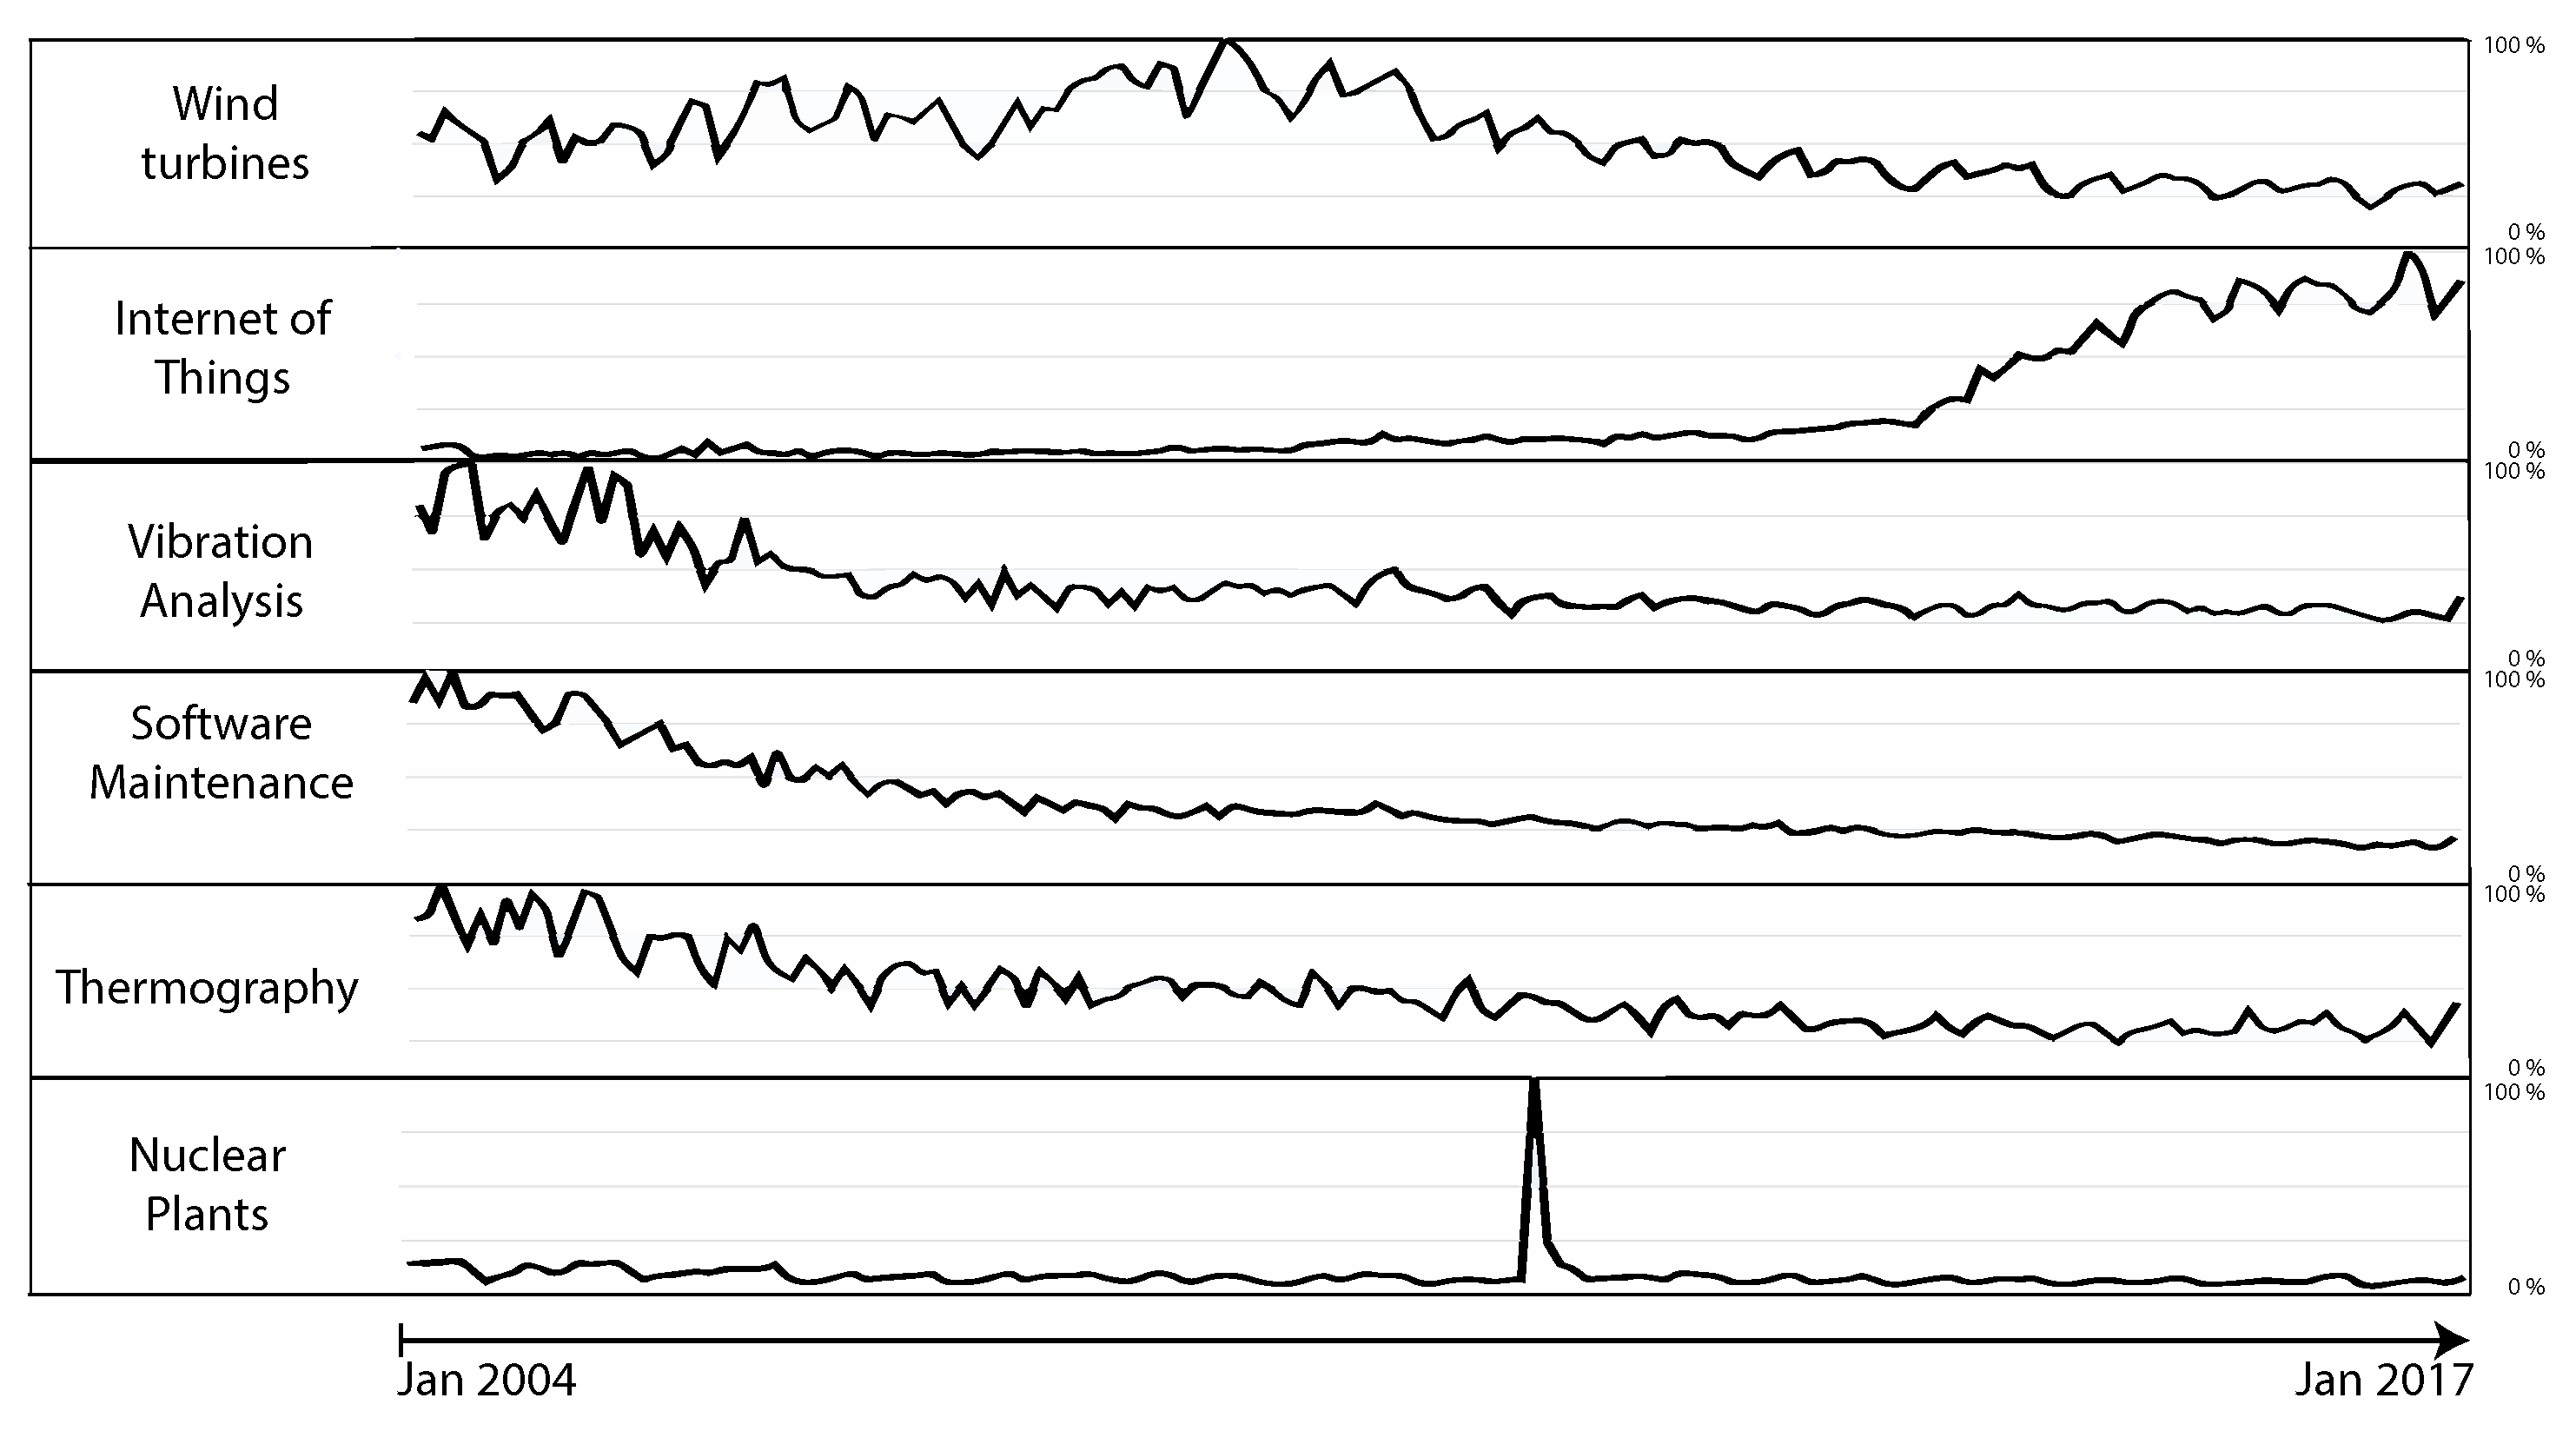
As an indicator for public interest, we choose the Google trend analysis. (https://www.google.de/trends/explore) Interest, as measured by Google searches, is visualized in a normalized form for the period from 2004 to 2017 (cf. Figure 18). The topic Internet of Things grew significantly during the last years. The greatest difference between scientific and public interest can be observed in the graphs related to software maintenance. Please note that the Fukushima Daiichi nuclear disaster in March 2001 distorts the graph for nuclear power plants. The public interest was enormous due to this event, causing a peak in the graph.
Furthermore, we link upcoming developments in the field of predictive maintenance to the development of the Internet of Things. Three aspects are of particular interest in this context:
  • Algorithm Development. Current success stories on deep learning have not affected research yet. In particular, neural networks were used in all periods. Please note that the introduction of convolutional neural networks (cnn) might improve predictions. So far, this technique has been widely used for image classification [91], but the tendency of bringing more and more sensors into industrial applications will make this multidimensional approach more attractive as well.
  • Trust. Using predictive systems, the importance of planning algorithms for industrial production is increasing. Decisions are based on algorithm results and a evolution of these systems is leveraged if people agree on calculations and if they trust their predictive systems. According to [92], high agreement rates can be achieved by trust, which, in turn, depends on reliability. Following the theory that improvements in algorithm result in a better reliability of predictive systems, we expect better trust and acceptance rates as well.
  • Alliances. From Figure 14, it can be discovered that in Clusters 3 and 4, the countries working in the same cluster are in a conflicting state. If deteriorating country relations influences research progress, the pairs US-China, Russia-Germany, and Great Britain-Germany (Brexit) might complicate research cooperations and consequently slow down the scientific progress due to reduced knowledge exchange.
Altogether, we expect a further growth in the number of research publications in the field of Predictive Maintenance.

7. Threats to Validity

The bibliometric analysis is a powerful tool. Though, some limitations need to be considered. First, a general quality measure for choosing search queries is challenging. As the total number of all published papers is unknown, it cannot be measured how good we cover the state of the art. Furthermore, the comparison with other search query choices is difficult as we use preprocessing filters. Our search strings result in many papers. Therefore, we improve the significance of centrality measures, such as betweenness and degree. On the other hand, we take the risk to include irrelevant papers in the analysis. Next, as there is an unlimited number of combinations for the parameters of the bibliometric analysis, we cannot guarantee optimal cluster sizes. When the cluster size is too small, related research fields are likely not to be representative for the dataset, i.e., they are too specific. By contrast, by conducting the analysis with too large cluster sizes, we might merge two different cluster labels and loose information as well as precision. Another thread to validity concerns the choice of the number of citations as an indicator for the importance of research, since quality is not necessarily expressed by public attention. Finally, the bibliometric analysis solely covers the academic part of approaches. Knowledge that is present within enterprises, but which is not publicly available, is not included in the analysis. Therefore, we cannot evaluate the feasibility of the presented approaches and techniques.

8. Summary and Outlook

This work identified important papers and techniques used in the field of state of the art equipment maintenance systems based on a bibliometric analysis. The latter covers temporal, geographical, author-related, and technique-related issues. For this analysis, we used search strings from contemporary maintenance methods to extract sets of papers from an academic database.
This work provides an overview on maintenance strategies on one hand and serves as a schema to categorize future research results on the other by providing look-up tables for research fields and techniques. The techniques, which were mostly identified by keywords, indicate how researchers approach the topic of state of the art equipment maintenance systems. Furthermore, each research field is represented by the most important paper, whose importance is determined by the number of citations. The collection of lead documents extracted from different search strings is not comparable due to different time periods and research fields.
We further introduced an importance measure to compare the papers by standardizing their properties and by expressing their relevance in a more cluster-independent way. The weighting of each parameter needed for calculating of the importance measure can be chosen by the conductor of the analysis. Therefore, this procedure is adaptive and can be reused in other bibliometric analyses. Since state of the art equipment maintenance systems, mainly represented by predictive maintenance, constitute a growing research field, it is important to stay informed about the current research. This work allows for the classification of emerging works as well as for the comparison with existing literature. As shown, the topic of equipment maintenance systems consists of many different research fields and various applied techniques. For our future work, we will focus our research on modular predictive maintenance applications. These applications, in turn, need to scale up with an increasing number of sensors, as particularly required in the context of the Internet of Things. We will evaluate the integration of the revealed techniques into new equipment maintenance systems modules. Finally, further research will emphasize the modular design of predictive maintenance applications to support scaling applications and flexible procedures.

Author Contributions

B.H. initiated, conceived and wrote the paper. R.P. and R.M. corrected and supervised this work. F.M.-B. and B.S. did the technical support for the bibliometric software. A.T. and K.K. offered resources and drew conclusions.

Conflicts of Interest

The authors declare no conflict of interest.

Abbreviations

The following abbreviations are used in this manuscript:
AHPAnalytic Hierarchy Process
FAFrequency Analysis
FEAFinite Element Analysis
IRInfrared
MCOMaintenance Cost Optimization
MPCModel Predictive Control
RCARoot Cause Analysis
SVMSupport Vector Machine

Appendix A. Research Fronts

Appendix A.1.

Table A1. Research field and technique of the most cited papers 2000–2008.
#Lead DocumentCitationsCluster LabelTechnique
1Strategic alliances as social capital: a multidimensional view [89]281Predictive ModelsInterfirm Networks
2Mining Version Histories to Guide Software Changes [93]196Software PredictionROSE framework
3Intelligent prognostics tools and e-maintenance [94]158Monitoringe-Maintenance
4Continuous time predictive maintenance scheduling for a deteriorating system [95]141Cost Based ModelMaintenance Cost Optimization
5The analytic hierarchy process applied to maintenance strategy selection [39]133Model Predictive ControlAnalytic Hierarchy Process
6Robust performance degradation assessment methods for enhanced rolling element bearing prognostics [96]127Vibration AnalysisSelf Organizing Map
7Infrared thermography for building diagnostics [97]119ThermographyIR Camera
8Applications of dielectric spectroscopy in time and frequency domain for HV power equipment [98]108Cable DiagnosticFrequency Analysis
9Linking maintenance strategies to performance [74]108Managing PdMTotal Productive Maintenance
10Root cause AC motor failure analysis [99]44Motor Fault PredictionRoot Cause Analysis
11Temperature development in structural stainless steel sections exposed to fire [100]44Generic ApproachHeat Transfer Coefficient
12Finite element analysis of internal winding faults in distribution transformers [101]35Prediction on Electric SystemsFinite Element Analysis
13Creating an abstraction of sensors to ease usage, distribution and management of a measurement network [102]0Sensor DataAnalog Signature Analysis

Appendix A.2.

To understand how clustering works, the computation of the second-order similarities will be explained. First, all the terms of title, abstract, and author keywords are combined and preprocessed. This procedure includes stemming (reducing words to their word stem), removing stopwords (like the, a...), and filtering special characters. Let f i m be the frequency of a term t in document m, while N represents the total number of documents and the number of documents containing t is denoted as j i . The resulting weight of terms is called TF-IDF:
w t m = f t m l o g N n t
By summing up the second-order weights and applying Salton’s Cosine for two documents m and p, with several terms k, we receive the first-order similarity:
s m p = i = 1 k w i m · w i p i = 1 k w i m 2 · i = 1 k w i p 2
To have a connection among all documents, we execute the cosine index once more and obtain the second-order similarity matrix s 2 , m p , which is filtered in a final step with the k-nearest- neighbour method.
s 2 , m p = j = 1 N s j m · s j p j = 1 N s j m 2 · j = 1 N s j p 2

Appendix A.3.

Table A2. Research field and technique of the most cited papers 2008–2016.
#ArticleCitedCluster LabelTechnique
1A survey of the application of gamma processes in maintenance [103]241Multi-componentMarkov Processes
2Classifying Software Changes: Clean or Buggy? [104]103Software predictionSupport Vector Machine
3The state of the art in chemical process control in Japan: Good practice and questionnaire survey [105]87Model-predictive ControlPID Control
4The prediction and diagnosis of wind turbine faults [106]84Wind TurbinesData-Mining
5Current status of machine prognostics in condition-based maintenance: a review [107]71Prognostics and Health ManagementDecision Framework
6The differing and mediating roles of trust and relationship commitment in service relationship maintenance and development [108]58Cloud and IoTCovariance Structure Model
7Rolling element bearing fault diagnosis based on the combination of genetic algorithms and fast kurtogram [109]58Rolling BearingGenetic algorithm
8A Real-Time Predictive-Maintenance System of Aluminum Electrolytic Capacitors Used in Uninterrupted Power Supplies [110]35CapacitorKalman Filtering
9Intelligent state estimation for fault tolerant nonlinear predictive control [111]28ThermographyKalman Filter
10Machine and component residual life estimation through the application of neural networks [112]19Generic approachNeural Network
11Concrete cover cracking caused by steel reinforcement corrosion [113]18CorrosionCorrosion Rate
12An Advanced Stator Winding Insulation Quality Assessment Technique for Inverter-Fed Machines [114]17Vibration AnalysisDissipation Factor
13On-line monitoring applications in nuclear power plants [73]17Nuclear Risks and SafetyNoise Analysis
14Development of improved railway track degradation models [115]15Rail MaintenanceDegradation Model
15Aged oils reclamation: Facts and arguments based on laboratory studies [116]7OilsFuller’s Earth

References

  1. Saxena, A.; Goebel, K.; Simon, D.; Eklund, N. Damage propagation modeling for aircraft engine run-to-failure simulation. In Proceedings of the International Conference on Prognostics and Health Management, Denver, CO, USA, 6–9 October 2018. [Google Scholar]
  2. Barlow, R.; Hunter, L. Optimum preventive maintenance policies. Oper. Res. 1960, 8, 90–100. [Google Scholar] [CrossRef]
  3. Mobley, R.K. An Introduction to Predictive Maintenance; Elsevier Science: New York City, NY, USA, 2002. [Google Scholar]
  4. Grant, M.J.; Booth, A. A typology of reviews: An analysis of 14 review types and associated methodologies. Health Inf. Libr. J. 2009, 26, 91–108. [Google Scholar] [CrossRef] [PubMed]
  5. Muller, A.; Crespo Marquez, A.; Iung, B. On the concept of e-maintenance: Review and current research. Reliab. Eng. Syst. Saf. 2008, 93, 1165–1187. [Google Scholar] [CrossRef]
  6. Wang, H. A survey of maintenance policies of deteriorating systems. Eur. J. Oper. Res. 2002, 139, 469–489. [Google Scholar] [CrossRef]
  7. Pierskalla, W.P.; Voelker, J.A. A survey of maintenance models: The control and surveillance of deteriorating systems. Naval Res. Logist. Q. 1976, 23, 353–388. [Google Scholar] [CrossRef]
  8. Cho, D.I.; Parlar, M. A survey of maintenance models for multi-unit systems. Eur. J. Oper. Res. 1991, 51, 1–23. [Google Scholar] [CrossRef]
  9. Lu, B.; Li, Y.; Wu, X.; Yang, Z. A review of recent advances in wind turbine condition monitoring and fault diagnosis. In Proceedings of the IEEE Power Electronics and Machines in Wind Applications, Lincoln, NE, USA, 24–26 June 2009; pp. 1–7. [Google Scholar]
  10. Barnish, T.; Muller, M.; Kasten, D. Motor Maintenance: A Survey of Techniques and Results; American Council for an Energy-Efficient Economy: Washington, DC, USA, 1997. [Google Scholar]
  11. Garg, A.; Deshmukh, S.G. Maintenance management: Literature review and directions. J. Qual. Maint. Eng. 2006, 12, 205–238. [Google Scholar] [CrossRef]
  12. Chadegani, A.A.; Salehi, H.; Yunus, M.M.; Farhadi, H.; Fooladi, M.; Farhadi, M.; Ebrahim, N.A. A Comparison between Two Main Academic Literature Collections: Web of Science and Scopus Databases. Asian Soc. Sci. 2013, 9. [Google Scholar] [CrossRef]
  13. Amadi-Echendu, J.E.; Willett, R.; Brown, K.; Hope, T.; Lee, J.; Mathew, J.; Vyas, N.; Yang, B.S. What is engineering asset management? In Definitions, Concepts and Scope of Engineering Asset Management; Springer: Berlin, Germany, 2010; pp. 3–16. [Google Scholar]
  14. Koronios, A.; Nastasie, D.; Chanana, V.; Haider, A. Integration through standards—An overview of international standards for engineering asset management. In Proceedings of the Fourth International Conference on Condition Monitoring, Harrogate, UK, 11–14 June 2007. [Google Scholar]
  15. Stapelberg, R. Professional skills training in integrated asset management: how to develop and implement the essential organisational asset management functions. In Engineering Asset Management; Springer: Berlin, Germany, 2006; pp. 1243–1251. [Google Scholar]
  16. Ma, L. Condition monitoring in engineering asset management. In Proceedings of the Asia Pacific Vibration Conference, Sapporo, Japan, 6–9 August 2007. [Google Scholar]
  17. Pritchard, A. Statistical Bibliography or Bibliometrics? J. Doc. 1969, 25, 348–349. [Google Scholar]
  18. de Solla Price, D.J. Networks of Scientific Papers. Science 1965, 149, 510–515. [Google Scholar] [CrossRef]
  19. Schiebel, E. Visualization of research fronts and knowledge bases by three-dimensional areal densities of bibliographically coupled publications and co-citations. Scientometrics 2012, 91, 557–566. [Google Scholar] [CrossRef]
  20. Liu, X.; Bollen, J.; Nelson, M.L.; van de Sompel, H. Co-authorship networks in the digital library research community. Inf. Process. Manag. 2005, 41, 1462–1480. [Google Scholar] [CrossRef] [Green Version]
  21. Stelzer, B.; Meyer-Brötz, F.; Schiebel, E.; Brecht, L. Combining the scenario technique with bibliometrics for technology foresight: The case of personalized medicine. Technol. Forecast. Soc. Chang. 2015, 98, 137–156. [Google Scholar] [CrossRef]
  22. Cobo, M.J.; López-Herrera, A.G.; Herrera-Viedma, E.; Herrera, F. Science mapping software tools: Review, analysis, and cooperative study among tools. J. Assoc. Inf. Sci. Technol. 2011, 62, 1382–1402. [Google Scholar] [CrossRef] [Green Version]
  23. Meyer-Brötz, F.; Stelzer, B.; Schiebel, E.; Brecht, L. Mapping the Technology and Innovation Management Literature Using Hybrid Bibliometric Networks; Inderscience: Olney, UK, 2017. [Google Scholar]
  24. Meyer-Brötz, F.; Schiebel, E.; Brecht, L. Experimental evaluation of parameter settings in calculation of hybrid similarities: effects of first- and second-order similarity, edge cutting, and weighting factors. Scientometrics 2017, 111, 1307–1325. [Google Scholar] [CrossRef]
  25. Blondel, V.D.; Guillaume, J.L.; Lambiotte, R.; Lefebvre, E. Fast unfolding of communities in large networks. J. Stat. Mech. 2008, 2008, P10008. [Google Scholar] [CrossRef]
  26. Martin, S.; Brown, W.M.; Klavans, R.; Boyack, K.W. OpenOrd: An Open-Source Toolbox for Large Graph Layout. In Proceedings of the SPIE 7868 Visualization and Data Analysis, San Francisco Airport, CA, USA, 23–27 January 2011. [Google Scholar]
  27. Fruchterman, T.M.J.; Reingold, E.M. Graph drawing by force-directed placement. Software 1991, 21, 1129–1164. [Google Scholar] [CrossRef] [Green Version]
  28. Meyer-Brötz, F. Bibliometric Timelines for the Identification of Emerging Technologies; Springer: Berlin, Gremany, 2017. [Google Scholar]
  29. Woon, W.L.; Zeineldin, H.; Madnick, S. Bibliometric Analysis of Distributed Generation. Technol. Forecast. Soc. Chang. 2009, 78, 408–420. [Google Scholar] [CrossRef]
  30. Davies, A. Handbook of Condition Monitoring: Techniques and Methodology; Springer Netherlands: Dordrecht, The Netherlands, 2012. [Google Scholar]
  31. Pantsar-Syvaniemi, S.; Ovaska, E.; Ferrari, S.; Cinotti, T.S.; Zamagni, G.; Roffia, L.; Mattarozzi, S.; Nannini, V. Case Study: Context-Aware Supervision of a Smart Maintenance Process. In Proceedings of the IEEE/IPSJ 11th International Symposium on Applications and the Internet (SAINT), Munich, Germany, 18–21 July 2011; pp. 309–314. [Google Scholar]
  32. Smith, R.; Hawkins, B. Lean Maintenance: Reduce Costs, Improve Quality, and Increase Market Share; Butterworth-Heinemann: Oxford, UK, 2004. [Google Scholar]
  33. Moubray, J. Reliability-Centered Maintenance, 2nd ed.; Industrial Press: New York, NY, USA, 1997. [Google Scholar]
  34. Siegel, E. Predictive analytics: The Power to Predict Who Will Click, Buy, Lie, or Die; John Wiley & Sons Incorporated: Hoboken, NY, USA, 2016. [Google Scholar]
  35. Trotter, J.A. Techniques of Preictive Maintenance. Chem. Eng. 1970, 77, 66. [Google Scholar]
  36. Hirsch, J.E. An index to quantify an individual’s scientific research output. Proc Natl. Acad. Sci. USA 2005, 102, 16569–16572. [Google Scholar] [CrossRef] [PubMed] [Green Version]
  37. Mehta, S.V.; Uzsoy, R.M. Predictable scheduling of a job shop subject to breakdowns. IEEE Trans. Robot. Autom. 1998, 14, 365–378. [Google Scholar] [CrossRef]
  38. Fyfe, K.R.; Munck, E. Analysis of computed order tracking. Mech. Syst. Signal Process. 1997, 11, 187–205. [Google Scholar] [CrossRef]
  39. Bevilacqua, M.; Braglia, M. The analytic hierarchy process applied to maintenance strategy selection. Reliab. Eng. Syst. Saf. 2000, 70, 71–83. [Google Scholar] [CrossRef]
  40. Cash, M.A.; Habetler, T.G.; Kliman, G.B. Insulation failure prediction in AC machines using line-neutral voltages. IEEE Trans. Ind. Appl. 1998, 34, 1234–1239. [Google Scholar] [CrossRef]
  41. Golabi, K.; Shepard, R. Pontis: A System for Maintenance Optimization and Improvement of US Bridge Networks. Interfaces 1997, 27, 71–88. [Google Scholar] [CrossRef]
  42. Ebert, C. Classification techniques for metric-based software development. Softw. Qual. J. 1996, 5, 255–272. [Google Scholar] [CrossRef]
  43. Gelormino, M.S.; Ricker, N.L. Model-predictive control of a combined sewer system. Int. J. Control 1994, 59, 793–816. [Google Scholar] [CrossRef]
  44. Madding, R.P. Emissivity measurement and temperature correction accuracy considerations. In Proceedings of the International Society for Optics and Photonics, Orlando, FL, USA, 5–9 April 1999; pp. 393–401. [Google Scholar]
  45. Lee, S.F.; Spanos, C.J. Prediction of wafer state after plasma processing using real-time tool data. IEEE Trans. Semicond. Manuf. 1995, 8, 252–261. [Google Scholar] [CrossRef]
  46. Kanter, R.M. Collaborative Advantage—The art of alliances. Harv. Bus. Rev. 1994, 72, 96–108. [Google Scholar]
  47. Rausand, M. Reliability centered maintenance. Reliab. Eng. Syst. Saf. 1998, 60, 121–132. [Google Scholar] [CrossRef]
  48. Harunuzzaman, M.; Aldemir, T. Optimization of standby safety system maintenance schedules in nuclear power plants. Nucl. Technol. 1996, 113, 354–367. [Google Scholar] [CrossRef]
  49. Yang, J.N.; Manning, S.D. Stochastic crack growth analysis methodologies for metallic structures. Eng. Fract. Mech. 1990, 37, 1105–1124. [Google Scholar] [CrossRef]
  50. Shah, R.; Ward, P.T. Lean manufacturing: context, practice bundles, and performance. J. Oper. Manag. 2003, 21, 129–149. [Google Scholar] [CrossRef]
  51. Endrenyi, J.; Aboresheid, S.; Allan, R.N.; Anders, G.J.; Asgarpoor, S.; Billinton, R.; Chowdhury, N.; Dialynas, E.N.; Fipper, M.; Fletcher, R.H.; et al. The present status of maintenance strategies and the impact of maintenance on reliability. IEEE Trans. Power Syst. 2001, 16, 638–646. [Google Scholar] [CrossRef] [Green Version]
  52. Kiritsis, D.; Bufardi, A.; Xirouchakis, P. Research issues on product lifecycle management and information tracking using smart embedded systems. Intell. Maint. Syst. 2003, 17, 189–202. [Google Scholar] [CrossRef]
  53. Kothamasu, R.; Huang, S.H.; VerDuin, W.H. System health monitoring and prognostics—A review of current paradigms and practices. Int. J. Adv. Manuf. Technol. 2006, 28, 1012–1024. [Google Scholar] [CrossRef]
  54. Zhou, X.; Xi, L.; Lee, J. Reliability-centered predictive maintenance scheduling for a continuously monitored system subject to degradation. Reliab. Eng. Syst. Saf. 2007, 92, 530–534. [Google Scholar] [CrossRef]
  55. Avdelidis, N.P.; Almond, D.P.; Dobbinson, A.; Hawtin, B.C.; Ibarra-Castanedo, C.; Maldague, X. Aircraft composites assessment by means of transient thermal NDT. Prog. Aerosp. Sci. 2004, 40, 143–162. [Google Scholar] [CrossRef]
  56. Ramamurthy, H.; Prabhu, B.S.; Gadh, R.; Madni, A.M. Wireless Industrial Monitoring and Control Using a Smart Sensor Platform. IEEE Sens. J. 2007, 7, 611–618. [Google Scholar] [CrossRef]
  57. Depuru, S.S.; Wang, L.; Devabhaktuni, V. Smart meters for power grid: Challenges, issues, advantages and status. Renew. Sustain. Energy Rev. 2011, 15, 2736–2742. [Google Scholar] [CrossRef]
  58. Lee, J.; Wu, F.; Zhao, W.; Ghaffari, M.; Liao, L.; Siegel, D. Prognostics and health management design for rotary machinery systems-Reviews, methodology and applications. Mech. Syst. Signal Process. 2014, 42, 314–334. [Google Scholar] [CrossRef]
  59. Shmueli, G.; Koppius, O.R. Predictive analytics in information systems research. Mis Q. 2011, 35, 553–572. [Google Scholar] [CrossRef]
  60. Candido, G.; Colombo, A.W.; Barata, J.; Jammes, F. Service-Oriented Infrastructure to Support the Deployment of Evolvable Production Systems. IEEE Trans. Ind. Inform. 2011, 7, 759–767. [Google Scholar] [CrossRef]
  61. Waller, M.A.; Fawcett, S.E. Data Science, Predictive Analytics, and Big Data: A Revolution That Will Transform Supply Chain Design and Management. J. Bus. Logist. 2013, 34, 77–84. [Google Scholar] [CrossRef]
  62. Niu, G.; Yang, B.S.; Pecht, M. Development of an optimized condition-based maintenance system by data fusion and reliability-centered maintenance. Reliab. Eng. Syst. Saf. 2010, 95, 786–796. [Google Scholar] [CrossRef]
  63. Shah, R.; Chandrasekaran, A.; Linderman, K. In pursuit of implementation patterns: The context of Lean and Six Sigma. Int. J. Prod. Res. 2008, 46, 6679–6699. [Google Scholar] [CrossRef]
  64. Fischer, K.; Besnard, F.; Bertling, L. Reliability-Centered Maintenance for Wind Turbines Based on Statistical Analysis and Practical Experience. IEEE Trans. Energy Convers. 2012, 27, 184–195. [Google Scholar] [CrossRef]
  65. Li, V.C.; Herbert, E. Robust Self-Healing Concrete for Sustainable Infrastructure. J. Adv. Concr. Technol. 2012, 10, 207–218. [Google Scholar] [CrossRef] [Green Version]
  66. Russell, B.D.; Benner, C.L. Intelligent Systems for Improved Reliability and Failure Diagnosis in Distribution Systems. IEEE Trans. Smart Grid 2010, 1, 48–56. [Google Scholar] [CrossRef]
  67. Ahmad, R.W.; Gani, A.; Hamid, S.H.A.; Shiraz, M.; Yousafzai, A.; Xia, F. A survey on virtual machine migration and server consolidation frameworks for cloud data centers. J. Netw. Comput. Appl. 2015, 52, 11–25. [Google Scholar] [CrossRef]
  68. Liu, Z.; Kleiner, Y. State of the art review of inspection technologies for condition assessment of water pipes. Measurement 2013, 46, 1–15. [Google Scholar] [CrossRef] [Green Version]
  69. Ingram, D.M.E.; Steinhauser, F.; Marinescu, C.; Taylor, R.R.; Schaub, P.; Campbell, D.A. Direct Evaluation of IEC 61850-9-2 Process Bus Network Performance. IEEE Trans. Smart Grid 2012, 3, 1853–1854. [Google Scholar] [CrossRef] [Green Version]
  70. Zakeri, B.; Syri, S. Electrical energy storage systems: A comparative life cycle cost analysis. Renew. Sustain. Energy Rev. 2015, 42, 569–596. [Google Scholar] [CrossRef]
  71. Stoneburner, G.; Goguen, A.; Feringa, A. Risk Management Guide for Information Technology Systems. Inf. Syst. Secur. Risk Model 2002, 800, 800–830. [Google Scholar]
  72. Si, X.S.; Wang, W.; Hu, C.H.; Zhou, D.H. Remaining useful life estimation—A review on the statistical data driven approaches. Eur. J. Oper. Res. 2011, 213, 1–14. [Google Scholar] [CrossRef]
  73. Hashemian, H.M. On-line monitoring applications in nuclear power plants. Prog. Nucl. Energy 2011, 53, 167–181. [Google Scholar] [CrossRef]
  74. Swanson, L. Linking maintenance strategies to performance. Int. J. Prod. Econ. 2001, 70, 237–244. [Google Scholar] [CrossRef]
  75. Nandi, S.; Toliyat, H.A.; Li, X.D. Condition monitoring and fault diagnosis of electrical motors—A review. IEEE Trans. Energy Convers. 2005, 20, 719–729. [Google Scholar] [CrossRef]
  76. Jardine, A.K.S.; Lin, D.; Banjevic, D. A review on machinery diagnostics and prognostics implementing condition-based maintenance. Mech. Syst. Signal Process. 2006, 20, 1483–1510. [Google Scholar] [CrossRef]
  77. Widodo, A.; Yang, B.S. Support vector machine in machine condition monitoring and fault diagnosis. Mech. Syst. Signal Process. 2007, 21, 2560–2574. [Google Scholar] [CrossRef]
  78. Yu, J.; Qin, S.J. Multimode process monitoring with Bayesian inference-based finite Gaussian mixture models. AICHE J. 2008, 54, 1811–1829. [Google Scholar] [CrossRef]
  79. Hameed, Z.; Hong, Y.S.; Cho, Y.M.; Ahn, S.H.; Song, C.K. Condition monitoring and fault detection of wind turbines and related algorithms: A review. Renew. Sustain. Energy Rev. 2009, 13, 1–39. [Google Scholar] [CrossRef]
  80. Pantelopoulos, A.; Bourbakis, N.G. A Survey on Wearable Sensor-Based Systems for Health Monitoring and Prognosis. IEEE Trans. Syst. Man Cybern. Part C 2010, 40, 1–12. [Google Scholar] [CrossRef] [Green Version]
  81. Yin, S.; Ding, S.X.; Haghani, A.; Hao, H.; Zhang, P. A comparison study of basic data-driven fault diagnosis and process monitoring methods on the benchmark Tennessee Eastman process. J. Process Control 2012, 22, 1567–1581. [Google Scholar] [CrossRef]
  82. Bagavathiappan, S.; Lahiri, B.B.; Saravanan, T.; Philip, J.; Jayakumar, T. Infrared thermography for condition monitoring—A review. Infrared Phys. Technol. 2013, 60, 35–55. [Google Scholar] [CrossRef]
  83. Yin, S.; Ding, S.X.; Xie, X.; Luo, H. A Review on Basic Data-Driven Approaches for Industrial Process Monitoring. IEEE Trans. Ind. Electron. 2014, 61, 6418–6428. [Google Scholar] [CrossRef]
  84. Yin, S.; Li, X.; Gao, H.; Kaynak, O. Data-Based Techniques Focused on Modern Industry: An Overview. IEEE Trans. Ind. Electron. 2015, 62, 657–667. [Google Scholar] [CrossRef]
  85. Zhang, X.; Clark, M.; Rattan, K.; Muse, J.; Khalili, M. Controller Integrity Monitoring in Adaptive Learning Systems Towards Trusted Autonomy. IEEE Trans. Autom. Sci. Eng. 2016, 13, 491–501. [Google Scholar] [CrossRef]
  86. Bollen, J.; van de Sompel, H.; Hagberg, A.; Chute, R. A principal component analysis of 39 scientific impact measures. PLoS ONE 2009, 4, e6022. [Google Scholar] [CrossRef] [PubMed]
  87. Hakimi, S.L. On Realizability of a Set of Integers as Degrees of the Vertices of a Linear Graph. I. J. Soc. Ind. Appl. Math. 1962, 10, 496–506. [Google Scholar] [CrossRef]
  88. Brandes, U. A Faster Algorithm for Betweenness Centrality. J. Math. Sociol. 2001, 25, 163–177. [Google Scholar] [CrossRef]
  89. Koka, B.R.; Prescott, J.E. Strategic alliances as social capital: A multidimensional view. Strateg. Manag. J. 2002, 23, 795–816. [Google Scholar] [CrossRef]
  90. Bishop, P.; Hines, A.; Collins, T. The current state of scenario development: An overview of techniques. Foresight 2007, 9, 5–25. [Google Scholar] [CrossRef]
  91. Ciresan, D.; Meier, U.; Schmidhuber, J. Multi-column deep neural networks for image classification. In Proceedings of the IEEE Conference on Computer Vision and Pattern Recognition (CVPR), Providence, RI, USA, 16–21 June 2012; pp. 3642–3649. [Google Scholar]
  92. Chancey, E.T.; Bliss, J.P.; Proaps, A.B.; Madhavan, P. The Role of Trust as a Mediator Between System Characteristics and Response Behaviors. Hum. Factors 2015, 57, 947–958. [Google Scholar] [CrossRef] [PubMed]
  93. Zimmermann, T.; Weisgerber, P.; Diehl, S.; Zeller, A. Mining Version Histories to Guide Software Changes. IEEE Trans. Softw. Eng. 2004, 31, 429–445. [Google Scholar] [CrossRef]
  94. Lee, J.; Ni, J.; Djurdjanovic, D.; Qiu, H.; Liao, H. Intelligent prognostics tools and e-maintenance. Comput. Ind. 2006, 57, 476–489. [Google Scholar] [CrossRef]
  95. Dieulle, L.; Berenguer, C.; Grall, A.; Roussignol, M. Continuous time predictive maintenance scheduling for a deteriorating system. In Proceedings of the Annual Reliability and Maintainability Symposium, the International Symposium on Product Quality & Integrity, Philadelphia, PA, USA, 22–25 January 2001; IEEE Operations Center: Piscataway, NJ, USA, 2001; pp. 150–155. [Google Scholar]
  96. Qiu, H.; Lee, J.; Lin, J.; Yu, G. Robust performance degradation assessment methods for enhanced rolling element bearing prognostics. Intell. Maint. Syst. 2003, 17, 127–140. [Google Scholar] [CrossRef]
  97. Balaras, C.A.; Argiriou, A.A. Infrared thermography for building diagnostics. Energy Build. 2002, 34, 171–183. [Google Scholar] [CrossRef]
  98. Zaengl, W.S. Applications of dielectric spectroscopy in time and frequency domain for HV power equipment. IEEE Electr. Insul. Mag. 2003, 19, 9–22. [Google Scholar] [CrossRef]
  99. Bonnett, A.H. Root cause AC motor failure analysis. In Proceedings of the Industry Applications Society 46th Annual Petroleum and Chemical Industry Conference, San Diego, CA, USA, 13–15 September 1999; pp. 85–97. [Google Scholar]
  100. Gardner, L.; Ng, K.T. Temperature development in structural stainless steel sections exposed to fire. Fire Saf. J. 2006, 41, 185–203. [Google Scholar] [CrossRef] [Green Version]
  101. Wang, H.; Butler, K.L. Finite element analysis of internal winding faults in distribution transformers. IEEE Trans. Power Deliv. 2001, 16, 422–428. [Google Scholar] [CrossRef]
  102. Marino, P.; Siguenza, C.; Poza, F.; Vazquez, F.; Machado, F. Creating an abstraction of sensors to ease usage, distribution and management of a measurement network. In Proceedings of the 2003 IEEE International Conference on Emerging Technologies and Factory Automation, Lisbon, Portugal, 16–19 September 2003; pp. 471–478. [Google Scholar]
  103. van Noortwijk, J.M. A survey of the application of gamma processes in maintenance. Maint. Model. Appl. 2009, 94, 2–21. [Google Scholar] [CrossRef]
  104. Kim, S.; Whitehead, E.J.; Zhang, Y. Classifying Software Changes: Clean or Buggy? IEEE Trans. Softw. Eng. 2008, 34, 181–196. [Google Scholar] [Green Version]
  105. Kano, M.; Ogawa, M. The state of the art in chemical process control in Japan: Good practice and questionnaire survey. J. Process Control 2010, 20, 969–982. [Google Scholar] [CrossRef]
  106. Kusiak, A.; Li, W. The prediction and diagnosis of wind turbine faults. Renew. Energy 2011, 36, 16–23. [Google Scholar] [CrossRef]
  107. Peng, Y.; Dong, M.; Zuo, M.J. Current status of machine prognostics in condition-based maintenance: A review. Int. J. Adv. Manuf. Technol. 2010, 50, 297–313. [Google Scholar] [CrossRef]
  108. Aurier, P.; N’Goala, G. The differing and mediating roles of trust and relationship commitment in service relationship maintenance and development. J. Acad. Mark. Sci. 2010, 38, 303–325. [Google Scholar] [CrossRef]
  109. Zhang, Y.; Randall, R.B. Rolling element bearing fault diagnosis based on the combination of genetic algorithms and fast kurtogram. Mech. Syst. Signal Process. 2009, 23, 1509–1517. [Google Scholar] [CrossRef]
  110. Abdennadher, K.; Venet, P.; Rojat, G.; Retif, J.M.; Rosset, C. A Real-Time Predictive-Maintenance System of Aluminum Electrolytic Capacitors Used in Uninterrupted Power Supplies. IEEE Trans. Ind. Appl. 2010, 46, 1644–1652. [Google Scholar] [CrossRef]
  111. Deshpande, A.P.; Patwardhan, S.C.; Narasimhan, S.S. Intelligent state estimation for fault tolerant nonlinear predictive control. J. Process Control 2009, 19, 187–204. [Google Scholar] [CrossRef] [Green Version]
  112. Herzog, M.A.; Marwala, T.; Heyns, P.S. Machine and component residual life estimation through the application of neural networks. Reliab. Eng. Syst. Saf. 2009, 94, 479–489. [Google Scholar] [CrossRef] [Green Version]
  113. Al-Harthy, A.S.; Stewart, M.G.; Mullard, J. Concrete cover cracking caused by steel reinforcement corrosion. Mag. Concr. Res. 2011, 63, 655–667. [Google Scholar] [CrossRef]
  114. Yang, J.; Cho, J.; Lee, S.B.; Yoo, J.Y.; Kim, H.D. An Advanced Stator Winding Insulation Quality Assessment Technique for Inverter-Fed Machines. IEEE Trans. Ind. Appl. 2008, 44, 555–564. [Google Scholar] [CrossRef]
  115. Sadeghi, J.; Askarinejad, H. Development of improved railway track degradation models. Struct. Infrastruct. Eng. 2010, 6, 675–688. [Google Scholar] [CrossRef]
  116. N’cho, J.S.; Fofana, I.; Beroual, A.; Aka-Ngnui, T.; Sabau, J. Aged oils reclamation: Facts and arguments based on laboratory studies. IEEE Trans. Dielectr. Electr. Insul. 2012, 19, 1583–1592. [Google Scholar] [CrossRef]
Figure 1. Workflow of a Bibliometric Analysis.
Applsci 08 00916 g001
Figure 2. Knowledge Base, Research Front, and Sample Network.
Applsci 08 00916 g002
Figure 3. Applied Search Strategy.
Applsci 08 00916 g003
Figure 4. Published Articles for Predictive Maintenance.
Applsci 08 00916 g004
Figure 5. Relevant Web of Science Categories.
Applsci 08 00916 g005
Figure 6. Section Distribution and Article Density (Improved Readability).
Applsci 08 00916 g006
Figure 7. Calculation Parameters (Improved Readability).
Applsci 08 00916 g007
Figure 8. Visualizations in each Period.
Applsci 08 00916 g008
Figure 9. Evolution of Country Networks (obsolete).
Applsci 08 00916 g009
Figure 10. Research Front Graph.
Applsci 08 00916 g010
Figure 11. Published Literature.
Applsci 08 00916 g011
Figure 12. Research Front Flow Diagram (Color and Font Sizes).
Applsci 08 00916 g012
Figure 13. Timeline of Techniques.
Applsci 08 00916 g013
Figure 14. Cross-Country Cooperations during 2008–2016.
Applsci 08 00916 g014
Figure 15. Article Density Surface.
Applsci 08 00916 g015
Figure 16. Logarithmic Importance Reduction.
Applsci 08 00916 g016
Figure 17. Published Items Per Year.
Applsci 08 00916 g017
Figure 18. Google Trend Visualization.
Applsci 08 00916 g018
Table 1. Overview of the gathered data set.
QueryEntriesOldestTypical CategoryArticles from 2016
PDM a 47421970EEE *311
CM b 144,7581956EEE *8416
SM c 14471970EEE *109
LM d 12991967ND **74
RCM e5881978EEE *27
PA f 7171996EEE *119
* Engineering Electrical Electronic. ** Nutrition Dietetics. a Predictive Maintenance. b Condition Monitoring. c Smart Maintenance. d Lean Maintenance. e Reliability-centered Maintenance. f Predictive Analytics.
Table 2. Keywords.
Table 2. Keywords.
KeywordQuantityPercentageCluster
Predictive Maintenance2514.31
Condition Monitoring126.93
Maintenance84.61
Diagnosis74.02
Monitoring63.41
Models63.41
Neural Networks52.92
Vibration52.92
Table 3. Research Front Clusters.
#Lead DocumentCitationsCluster LabelTechnique
1Predictable scheduling of a job shop subject to breakdowns [37]173On-line Monitoring NetworkMinimax
2Analysis of computed order tracking [38]173Vibration AnalysisFrequency analysis
3The analytic hierarchy process applied to maintenance strategy selection [39]133Nuclear Risks and SafetyAnalytic Hierarchy Process
4Insulation failure prediction in AC machines using line-neutral voltages [40]82Prediction on Electric SystemsBand Pass Filter
5Pontis: A System for Maintenance Optimization and Improvement of US Bridge Networks [41]53Stochastic ModelsMarkov Processes
6Classification techniques for metric-based software development [42]50Software MaintenanceFuzzy Classification
7Model-predictive control of a combined sewer system [43]39Model Predictive ControlModel Predictive Control
8Emissivity measurement and temperature correction accuracy considerations [44]26Emission ControlIR Camera
9Prediction of wafer state after plasma processing using real-time tool data [45]23Hydroelectricity & PhotovoltaicsNeural Network
Table 4. Keyword ranking.
1990–20002000–20082008-2016
#Key%Key% Δ Key% Δ
1predictive maintenance17.99predictive maintenance11.860predictive maintenance9.610
2condition monitoring8.63maintenance3.83+1condition monitoring3.17+1
3maintenance5.76condition monitoring3.35−1maintenance2.73−1
4diagnosis5.04neural network2.75+3reliability2.12+1
5monitoring4.32reliability2.51+27condition-based maintenance1.5+7
6models4.32fault detection1.92+7fault diagnosis1.32+11
7neural networks3.6preventive maintenance1.8+2prognostics1.28+2
8vibration3.6genetic algorithm1.56nprediction1.15+36
9preventive maintenance2.88prognostics1.44nmodel predictive control0.93+67
10emissivity2.16partial discharges1.32ndata mining0.93+8
11thermography2.16condition-based maintenance1.32npreventive maintenance0.93−4
12fault diagnosis2.16diagnostics1.2+22fault detection0.88−6
13fault detection2.16modelling1.08noptimization0.79+48
14failure prediction2.16sensors0.96nwind turbine0.75n
15failures1.44maintenance management0.96nmonitoring0.71+7
Table 5. Research Front Clusters.
#Lead DocumentCitationsCluster LabelTechnique
1Collaborative Advantage—The art of alliances [46]274Lean networksAlliances
2Reliability centered maintenance [47]92AircraftRCM
3Optimization of standby safety system maintenance schedules in nuclear power plants [48]76Nuclear Power Plants ( 1 ) , ( 3 ) Dynamic Programming
4Stochastic crack growth analysis methodologies for metallic structures [49]36Sensors ( 2 ) Crack Growth Analysis
Table 6. Research Front Clusters.
#Lead DocumentCitationsCluster LabelTechnique
1bundles, and performance [50]475Lean ManufacturingLean Manufacturing
bundles, and performance [50]
2The present status of maintenance strategies116Maintainable SystemsMaintainnable System
and the impact of maintenance on reliability [51]
3Research issues on product lifecycle management86Lifecycle managementLifecycle Management
and information tracking using smart embedded systems [52]
4System health monitoring and prognostics—a85Condition-basedHealth Monitoring
review of current paradigms and practices [53]Maintenance
5Reliability-centered predictive maintenance scheduling82Reliability-centeredReliability-centered
for a continuously monitored system subject to degradation [54]MaintenanceMaintenance
6Aircraft composites assessment by means71AircraftNon-destructive Testing
of transient thermal NDT [55]
7Wireless Industrial Monitoring and Control52Smart NetworksBluetooth
Using a Smart Sensor Platform [56]
Table 7. Research Front Clusters.
#Lead DocumentCitationsCluster LabelTechnique
1Smart meters for power grid: Challenges, issues, advantages and status [57]87Smart metersPower Grid
2Prognostics and health management design for rotary machinery systems-Reviews, methodology and applications [58]66Prognostics and Health Management ( 3 ) Prognostics and Health Management
3Predictive analytics in information systems research [59]52Big Data AnalysisStatistical Model
4Service-Oriented Infrastructure to Support the Deployment of Evolvable Production Systems [60]47Automation SystemsWeb Services
5Data Science, Predictive Analytics, and Big Data: A Revolution That Will Transform Supply Chain Design and Management [61]46Data ScienceSupply Chain management
6Development of an optimized condition-based maintenance system by data fusion and reliability-centered maintenance [62]44Reliability-centered MaintenanceData Fusion
7In pursuit of implementation patterns: The context of Lean and Six Sigma [63]44Total Productive MaintenanceTotal Productive Maintenance
8Reliability-Centered Maintenance for Wind Turbines Based on Statistical Analysis and Practical Experience [64]39Wind Turbine ( 3 ) Failure Mode and Effect Analysis
9Robust Self-Healing Concrete for Sustainable Infrastructure [65]39Smart MaterialSelf-healing Concrete
10Intelligent Systems for Improved Reliability and Failure Diagnosis in Distribution Systems [66]28Smart GridDistribution Fault Anticipation
11A survey on virtual machine migration and server consolidation frameworks for cloud data centers [67]27Cloud Computing ( 3 ) VM Migration
12State of the art review of inspection technologies for condition assessment of water pipes [68]26Road MaintenanceNon-destructive Inspection
13Direct Evaluation of IEC 61850-9-2 Process Bus Network Performance [69]12Circuit BreakersSmart Grids
14Electrical energy storage systems: A comparative life cycle cost analysis [70]11Energy SystemsMonte Carlo
Table 8. Research field and technique of the most cited papers or corresponding clusters 2005–2012.
#YearLead DocumentCitationsCluster LabelTechnique
12005[75]591Motor Analysis ( 2 ) Motor Current Signature Analysis
22006[76]936Prognostics and Health Management ( 3 ) Sensor Data Fusion
32007[77]284Motor analysis ( 2 ) Support Vector Machine
42008[78]187Motor analysis ( 2 ) Principle Component Analysis
52009[79]297Wind Turbines ( 3 ) Fault Detection System
62010[80]375Sensor-based Systems ( 2 ) Wearable Systems
72011[72]248Monitoring ( 2 ) Remaining Useful Life
82012[81]380Data-driven SystemsProcess Monitoring
92013[82]90Thermography ( 2 ) , ( 3 ) IR-Camera
102014[83]243Monitoring ( 2 ) Data-Driven Approach
112015[84]243Monitoring ( 2 ) Data-Based Techniques
122016[85]1Cyber-physical SystemsAdaptive Learning
Table 9. Article Ranking Sorted by Importance Measure
#CiteTimes CitedCluster SizeH-IndexDegreeBetweennessImportance
1[59]0.030.430.40110.59
2[89]0.280.050.430.2810.43
3[76]1.000.180.360.180.020.40
4[38]0.070.320.330.180.900.36
5[75]0.620.430.260.320.020.35
31[47]0.890.150.020.310.060.14
32[51]0.050.430.380.150.000.14
73[69]0.010.030.310.140.000.06
74[67]0.020.030.020.140.000.05
avg0.10.210.250.210.100.15
med0.050.180.190.170.030.12
std0.160.160.210.120.220.10

