Article

Influence of Linear Springing on the Fatigue Damage of Ultra Large Ore Carriers

1
College of Shipbuilding Engineering, Harbin Engineering University, Harbin 150001, China
2
Department of Mechanical and Structural Engineering and Materials Science, University of Stavanger, 4036 Stavanger, Norway
*
Author to whom correspondence should be addressed.
Appl. Sci. 2018, 8(5), 763; https://doi.org/10.3390/app8050763
Submission received: 31 March 2018 / Revised: 3 May 2018 / Accepted: 8 May 2018 / Published: 11 May 2018
(This article belongs to the Section Mechanical Engineering)

Abstract

:
Springing occurs more frequently to ultra large ships, as their natural frequencies are relatively low and approaches the spectral peak of the wave energy spectrum in certain sea states. Springing is a resonance phenomenon between the waves and the ship hull, and this high frequency vibration has a significant influence on the fatigue damage of hull structures. This paper deals with the influence of springing on the fatigue damage of ultra large ore carriers. The springing responses of ultra large ore carriers are calculated by a three-dimensional linear hydroelasticity method in the frequency domain. A fatigue damage calculation method accounting for the springing effect is applied that is based on the fatigue spectrum analysis method and the approximation method of joint narrowband. The fatigue damage of the deck and bottom longitudinals in the deck and bottom of ultra large ore carriers of various sizes has been calculated by this method. The influences of ship size, structural damping, sea state, wave heading, navigational speed, and loading condition on the structure fatigue damage ratio of ultra large ore carrier are analyzed.

1. Introduction

To meet the requirements of the maritime transportation and to reduce energy consumption, and also emission of ships and the size of certain types of merchant vessels has kept increasing. For example, 400 kDWT ultra large ore carriers have been put into service and the design of over-20000TEU ultra large container carriers is also under way. Due to the increase in ship size and the extensive use of high-strength steels as a common material in the whole ship to reduce the ship weight, the flexibility of the hull girder increases and the natural frequency of ship decreases [1,2], which result in wave encounter frequencies that are very close to the first order natural frequency of the hull, and consequently, the resonance between the hull and waves, i.e., springing, occurs [3,4]. Because of the small damping of hull structures, springing decays very slowly and the vibration stresses of high frequency remains in the ship structures, which will lead to severe structural fatigue damage. A number of researchers have studied the springing responses of large vessels theoretically and experimentally.
Based on full scale measurements on board an iron-ore carrier operating in the North Atlantic Ocean, Storhaug et al. [5] showed that the wave-induced vibrations caused 44% of the fatigue damage. The hydroelasticity model test that was conducted by Storhaug et al. [6] on a large ore carrier also showed that 56% of the damage was caused by springing and whipping. Drummen et al. [7] studied, experimentally and also numerically, the fatigue damage that was caused by wave induced vibrations of a containership operating in the North Atlantic Ocean. The measurements showed that the wave-induced vibrations accounted for approximately 40% of the total fatigue and the numerical results were found to overestimate the total fatigue damage by 50%. Moe et al. [8] found that, for a containership operating in the Pacific Ocean, the contribution of wave induced vibration caused about 50% of the total fatigue damage. Wang et al. [9] investigated, also both numerically and experimentally, the wave-induced vibration of a 156,800 m3 LNG ship; it was found that, for the full loading condition, the numerical results obtained by the hydroelasticity method for the fatigue damage was about 1.4 times larger than those by treating the hull as a rigid body. Li et al. [10] carried out an investigation of an ultra-large ore carrier. The adopted three-dimensional hydroelasticity method also showed good agreement with the experimental results. It has also been found that fatigue damage while considering springing responses is 1.36 times larger than that caused only by wave frequency load. It suggests that springing may have a significant influence on the fatigue damage of the large ship hull structure.
Slocum and Troesch [11] investigated, experimentally and numerically, the linear and nonlinear springing response, and analyzed the influence of a variety of parameters on the excitation force and the response, including the ship speed, wave length, and encounter frequency. According to the comparison between the theoretical results and the full-scale measurements, Storhaug et al. [6] found, generally, the springing predictions are lower than seen in the measurements for the omission of non-linear terms. Based on a second order strip theory formulation and comparison with measured data, Vidic-Perunovic and Jensen [12] found that the second-order terms could improve the numerical accuracy of springing calculation. However, there are also many cases where the adopted nonlinear method performs worse than the linear one in terms of accuracy. Shao and Faltinsen [13] analyzed the contribution of the second-order velocity potential and the quadratic velocity terms in the Bernoulli’s equation on the spring effect. It was found that the second-order springing wave excitation is higher for the blunt ship than the slender one.
There exists an amount of studies on nonlinear springing and some advances have been made. However, the comparison with experiment shows that the existing nonlinear springing methods do not guarantee better accuracy [12].
Although many researches have been carried out in the past decades, most of them dealt with ships of certain sizes, and some meaningful findings were presented, the size effect on the hydroelasticity and fatigue damage due to linear springing has not been systematically investigated and remains unclear. Aiming at a systematic parameter study, the responses of four ultra large ore carries of different size are investigated. In addition to the natural frequency and structural damping, a variety of loading conditions, speeds, and sea states are discussed in order to reveal the size effect on the fatigue damage of the structure.

2. Method of Solution for Hydroelasticity

The seminal and the most representative hydroelasticity method to numerically simulate springing was done by Bishop and Price [14]. The hull model is represented by a Timoshenko beam and the hydrodynamics by the strip theory [15]. In order to investigate the behavior of non-beam like structures, three-dimensional (3-D) hydroelasticity methods were devised by Wu [16] and also by Price and Wu [17]. In the early 1990s, hydroelasticity theoO MV Derbyshire [18,19]. The 3-D hydroelasticity method has now been widely applied in the analyry was applied to investigate structural failures of bulk carriers, such as the Onomichi Maru and OBsis of wave load and structural response of large ships and floating structures [20]. Adenya et al. [21] studied the motion and the load response of a 550,000 DWT ore carrier, both numerically and experimentally. The hydroelasticity theory and experiment were generally in good agreement, except that the rigid-body theory overestimates responses in the low frequency range. The hydroelasticity theory is more preferable when investigating the elastic effect on the wave load of large ships.
By taking a similar approach [22], a linear 3-D hydroelasticity method has been implemented in this study and applied to analyze the contribution of springing to fatigue damage to structures [10,21]. The free-surface Green’s function is adopted to satisfy the linear free-surface condition, and the speed effect is accounted for by means of encounter frequency. In order to calculate the motion and wave load response of the flexible structures, the diffraction potential φ d and the radiation potential φ k are solved with the generalized fluid-structure coupling boundary conditions [23]:
{ φ d n = φ 0 n φ r n = [ i ω 0 u ˙ r + ( W ) u r ( u r ) W ] n
where φ 0 is the incident wave potential, ω 0 the wave natural frequency, n the vector normal to the surface, u r the central point displacement on the surface under the rth mode, and W the constant velocity around the hull
W = U i
where i is the unit vector in the direction of the X axis and U is the navigation speed.
The equation of motion for a flexible body travelling with forward speed U in regular deep-water waves can be written as
[ ω e 2 ( a + A ) + i ω e ( b + B ) + ( c + C ) ] P r = F
where ω e is the encountered frequency; a , b , and c , of dimensions n × n , are the generalized masses, structural damping, and stiffness matrices, respectively; A , B , and C , of dimensions n × n , are the generalized added inertia, hydrodynamic damping, and fluid restoring matrices, respectively; F , of dimension n × 1 , is the generalized wave excitation vector, consisted of the contributions of both the incident wave and the diffraction; P r , of dimension n × 1 , is the principal coordinate vector.
A , B , and C can be calculated by
{ A r k = Re ( H r k ) ω e 2 B r k = Im ( H r k ) ω e C r k = ρ g S 0 n u r w k d s V b ρ b u r ( g s × θ k ) d V
and F by
F r = ρ ζ a S 0 n u r ( i ω e U x ) ( φ 0 + φ d ) d s
where H r k is the generalized radiation force and it takes the form:
H r k = ρ S 0 n u r ( i ω e U x ) φ k d s
ρ is the fluid density, ρ b the material density of structure, S 0 the average wetted body surface, V b the volume of ship, w k the vertical deflection of mesh central point on the body surface under the kth mode, g s the gravitational acceleration vector, θ k the angle deformation of hull under the kth mode, and ζ a the incident wave amplitude.
The elements of a and c can be obtained while using the orthogonality of the system mass matrix and the stiffness matrix of the modal function using the transfer matrix method. The structure damping matrix b can be determined experimentally or empirically.
Once the principal coordinates in regular waves are obtained, the distortions and section loads, such as bending moments, shear forces can be calculated by modal superposition. Then, the displacement including both the rigid body motion and the elastic deformation is
w ( x ) = r = 0 m P r w r ( x )
the vertical bending moment at a cross-section of the hull is
M ( x ) = r = 0 m P r M r ( x )
and the vertical shear force at a cross-section of the hull is
V ( x ) = r = 0 m P r V r ( x )
In these expressions, W r , M r , and V r denote, respectively, the modal vertical displacement, vertical bending moment and shear forces for the rth mode shape with the corresponding principal coordinate P r evaluated in regular waves from Equation (3).

3. Calculation of Fatigue Damage Accounting for the Effect of Wave

3.1. Spectral Analysis Method for the Calculation of Fatigue Damage

Most of the present methods for accessing the fatigue damage of ship structures are concerned with the accumulated damage due to the wave-induced low-frequency vibrations. The effect of wave induced high frequency vibration, for instance, springing, is not sufficiently considered in the assessment of fatigue damage of ultra large ships. In order to account for the contribution of springing, the vertical bending moment that was evaluated by Equation (8) is used to calculate the stress response, and then the fatigue damage of the ship structure is analyzed using a linear cumulative damage theory and the spectrum analysis method.
According to the Miner linear cumulative damage theory [24,25,26], the total fatigue damage D under the action of multi-stage constant amplitude cyclic stress is the sum of the fatigue damage D i corresponding to each S i . The following bilinear S - N curve is adopted for the calculation,
{ N S m = C S > S Q N S m + Δ m = K S S Q
where N is the fatigue failure cycle times of S ; m , Δ m , C , K the constants related to the material; and, S Q the stress at the inflection point of the bilinear S - N curve.
The total fatigue damage is calculated as follows:
D = T C ( 2 2 ) m Γ ( 1 + m 2 ) n = 1 n l j = 1 n s i = 1 n k [ p n p j p i f 0 n j i ( σ n j i ) m μ n j i ]
where T is the calculating fatigue life; n l , n s , and n k the total number of loading conditions, sea state, and wave direction, respectively; p n , p j , and p i are the probabilities of loading, sea state, and wave direction, respectively; and, μ i j k is the parameter of slope variation in the bilinear S - N curve, which takes the form
μ i j k = 1 Γ 0 ( 1 + m 2 , ( S Q 2 2 σ i j k ) 2 ) ( S Q 2 2 σ i j k ) Δ m Γ 0 ( 1 + m + Δ m 2 , ( S Q 2 2 σ i j k ) 2 ) Γ ( 1 + m + Δ m 2 )

3.2. Fatigue Damage Due to Stress Induced by Vertical Wave Bending Moment

Although the short-term distribution of stress range is considered as a narrow band process, a large number of actual measurements indicate that the alternating stress always has broadband characteristics. For this reason, it is improper to use the Rayleigh distribution as it is a narrow band distribution model. Instead, the correction coefficient of rain flow that was proposed by Wirsching [27] is adopted to calculate the fatigue damage due to low frequency stresses, which takes the form,
D i = λ i D R a , i
where D R a , i is the hot spot fatigue damage that is calculated by the Rayleigh distribution mode; D i is hot spot fatigue damage, as calculated by the rain flow counting method; and, λ i is the correction coefficient of rain flow, which is given by:
λ = a + ( 1 + a ) ( 1 ε ) b
where ε is the bandwidth factor, and a and b can be calculated by
{ a = 0.926 0.033 m b = 1.587 m 2.323
where m is the parameter of the S - N curve.

3.3. The Total Structural FATIGUE Damage Including the Effect of Springing

The ITTC two-parameter spectrum is used to describe the sea state. The stress response spectra of wave induced vibration exhibit distinct broad band characteristics, as shown in Figure 1 and Figure 2, and they both contain two peaks. The first peak is caused by the low-frequency wave load when being treated as a rigid body, and the second is resulted from springing. Jiao and Moan [28], based on the rain flow coefficient and Gauss process, devised a method for fatigue damage analysis that is capable of dealing with separated double-peaked spectra. By combining a narrow band approximation and the traditional spectrum analysis method for fatigue assessment, a method is proposed in the present study for calculating the fatigue damage due to wave induced vibrations.
The stress response spectrum is divided into two components: a low frequency component and a high frequency one, which can be described by separate statistical characteristics:
α = m 0 l m 0 h + m 0 l
ζ = T 02 l T 02 h = m 2 l m 0 l m 2 l m 0 h
ε l = 1 m 2 l 2 m 0 l m 4 l
where m i l and m i h are the ith moments of low frequency and high frequency components, respectively.
According to the joint narrow band approach that was proposed by Jiao and Moan [28], the fatigue damage calculation due to wave induced vibration can be obtained as,
D T = D l + 1 ζ ( 1 α 2 ) m 1 ( 1 α 2 ) + α 2 ε l 2 × [ ( 1 α 2 ) m / 2 + 1 ( 1 α 2 α ( 1 α 2 ) ) + α π ( 1 α 2 ) m Γ ( m + 1 2 ) Γ ( m + 1 2 ) ] D h
where D T is the total fatigue damages, D l and D h are the contributions of the low frequency and high frequency wave components, respectively, as given by Equation (11). Once D T and D l are obtained, the contribution of wave induced vibration to the fatigue damage can be described by the damage ratio of λ ,
λ = D T D l

4. Numerical Configurations and Parameters

To systematically investigate the influence of the calculation parameters on fatigue damage, four realistic ultra large ore carriers (OC) are used, namely, 250,000 DWT OC, 300,000 DWT OC, 388,000 DWT OC, and 400,000 DWT OC, and their principle particulars are given in Table 1. The mass distributions and the structural properties are shown in Figure 3.
In the present study, the sea states of the North Atlantic are adopted to calculate the fatigue damage to the ultra-large ore carriers. According to the results obtained for the vertical bending moment, the range of frequency 0.157 rad/s to 3.14 rad/s, which encompasses the two-node wet-mode natural frequency, is adopted for calculating the response of wave induced vibration. The wave induced vibration originates from the coupling effects of wave encounter frequency and the first order natural frequency of the ship hull. When the encounter frequency coincides with the natural frequencies of the hull, linear springing will occur. Since the encounter frequency is dependent of the ship speed, so are the numerical results. The actual ship speed is, in general, reduced in high seas. The speeds in relation with the significant wave heights explored in the present study are shown in Table 2, where V S is the service speed.
In the calculation of the fatigue damage, inclusion of more lower-order elastic modes will improve the numerical accuracy while decrease the efficiency, the same thing goes with the mesh refinement for the hull. In order to improve the computational efficiency at the cost of negligible loss of accuracy, a convergence study has been conducted for both, and the results are presented in the Appendix A, see Figure A1, Figure A2, Figure A3, Figure A4 and Figure A5.

5. Results and Analysis

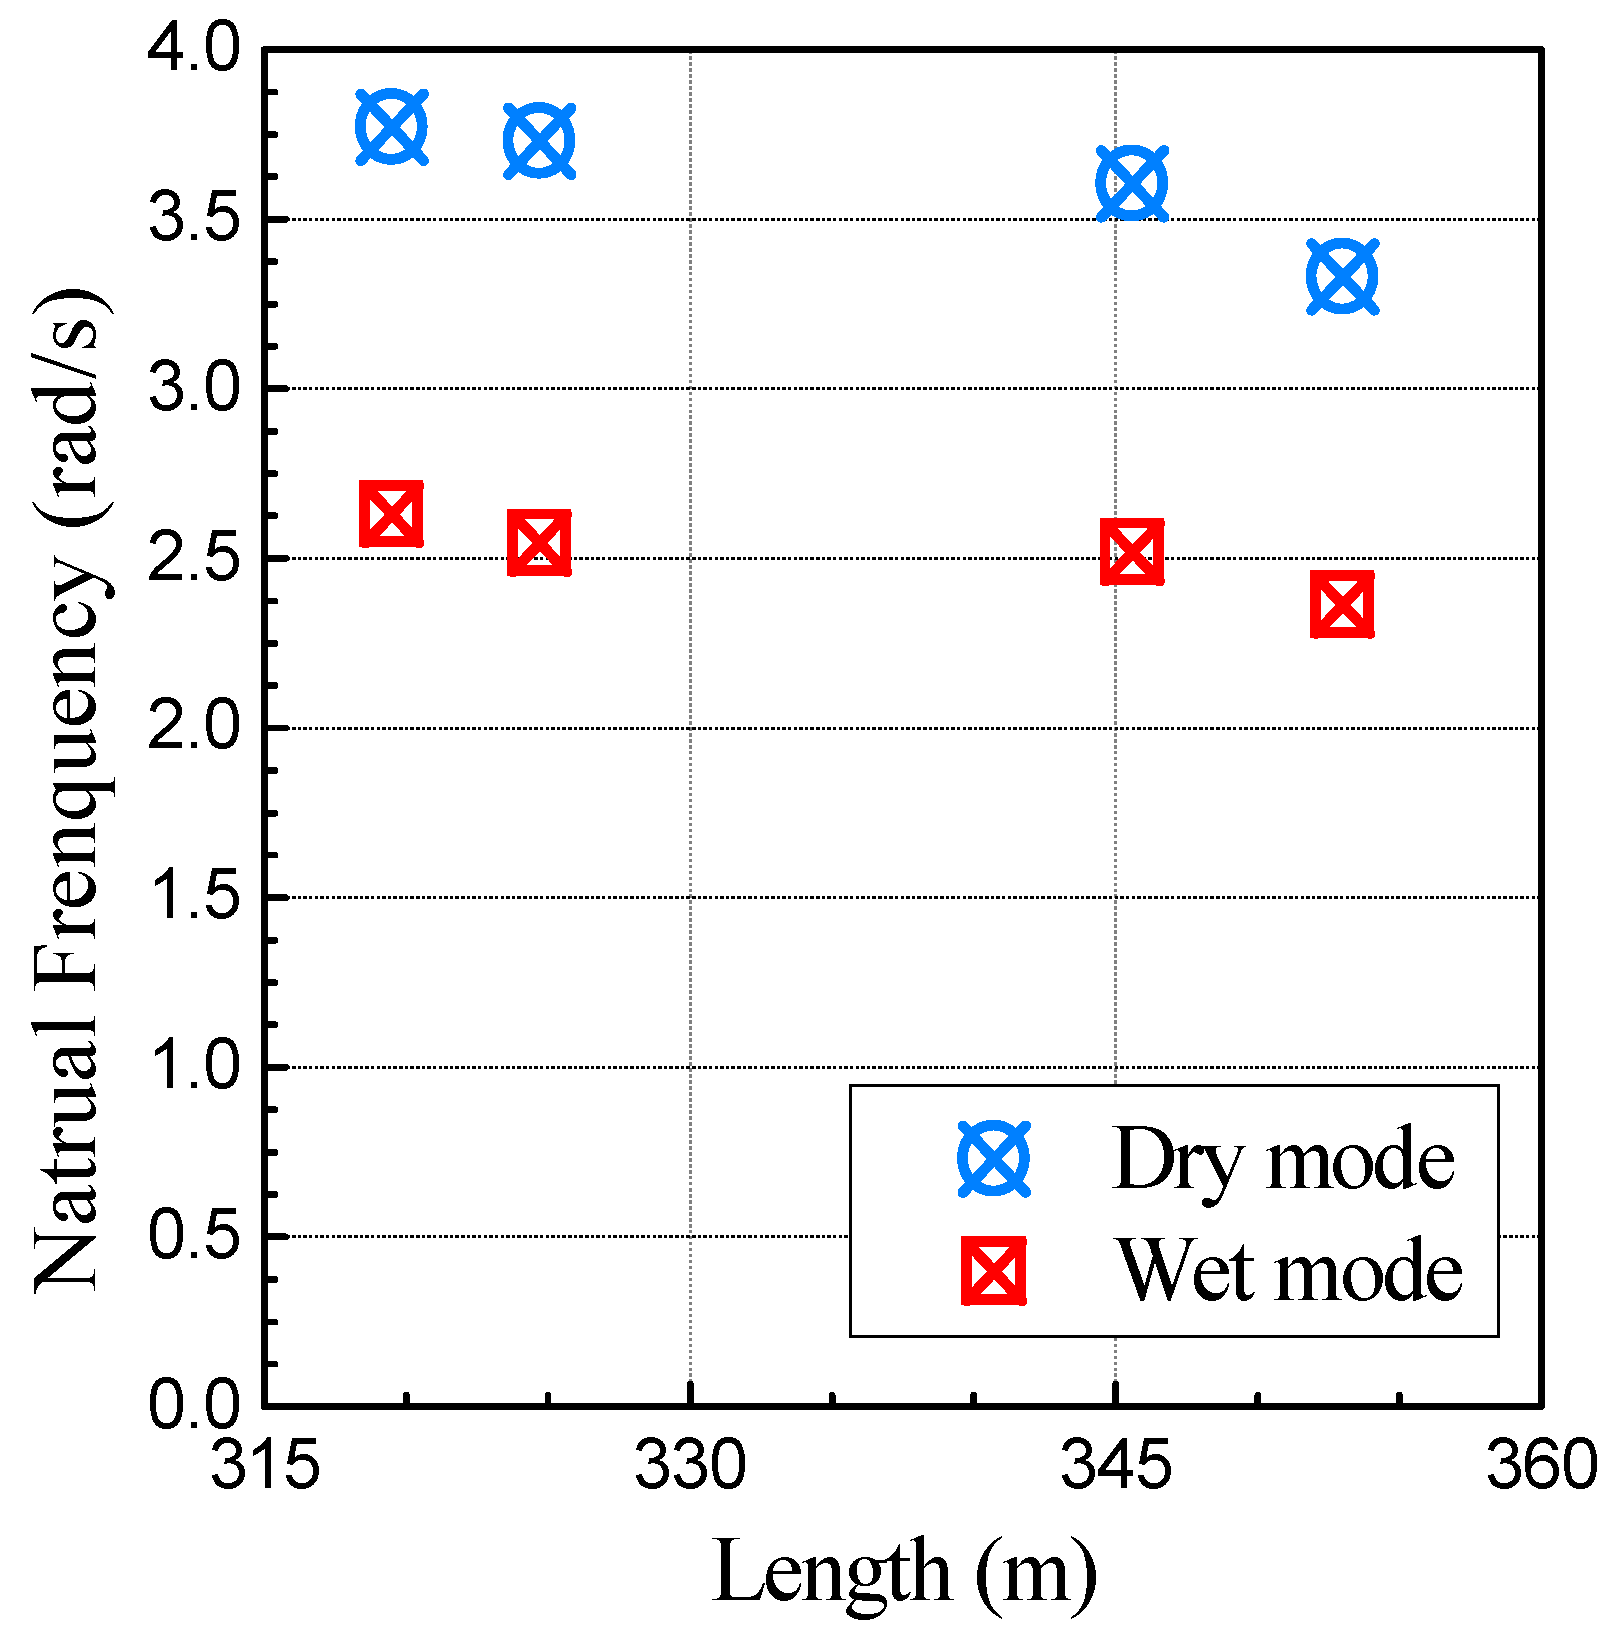
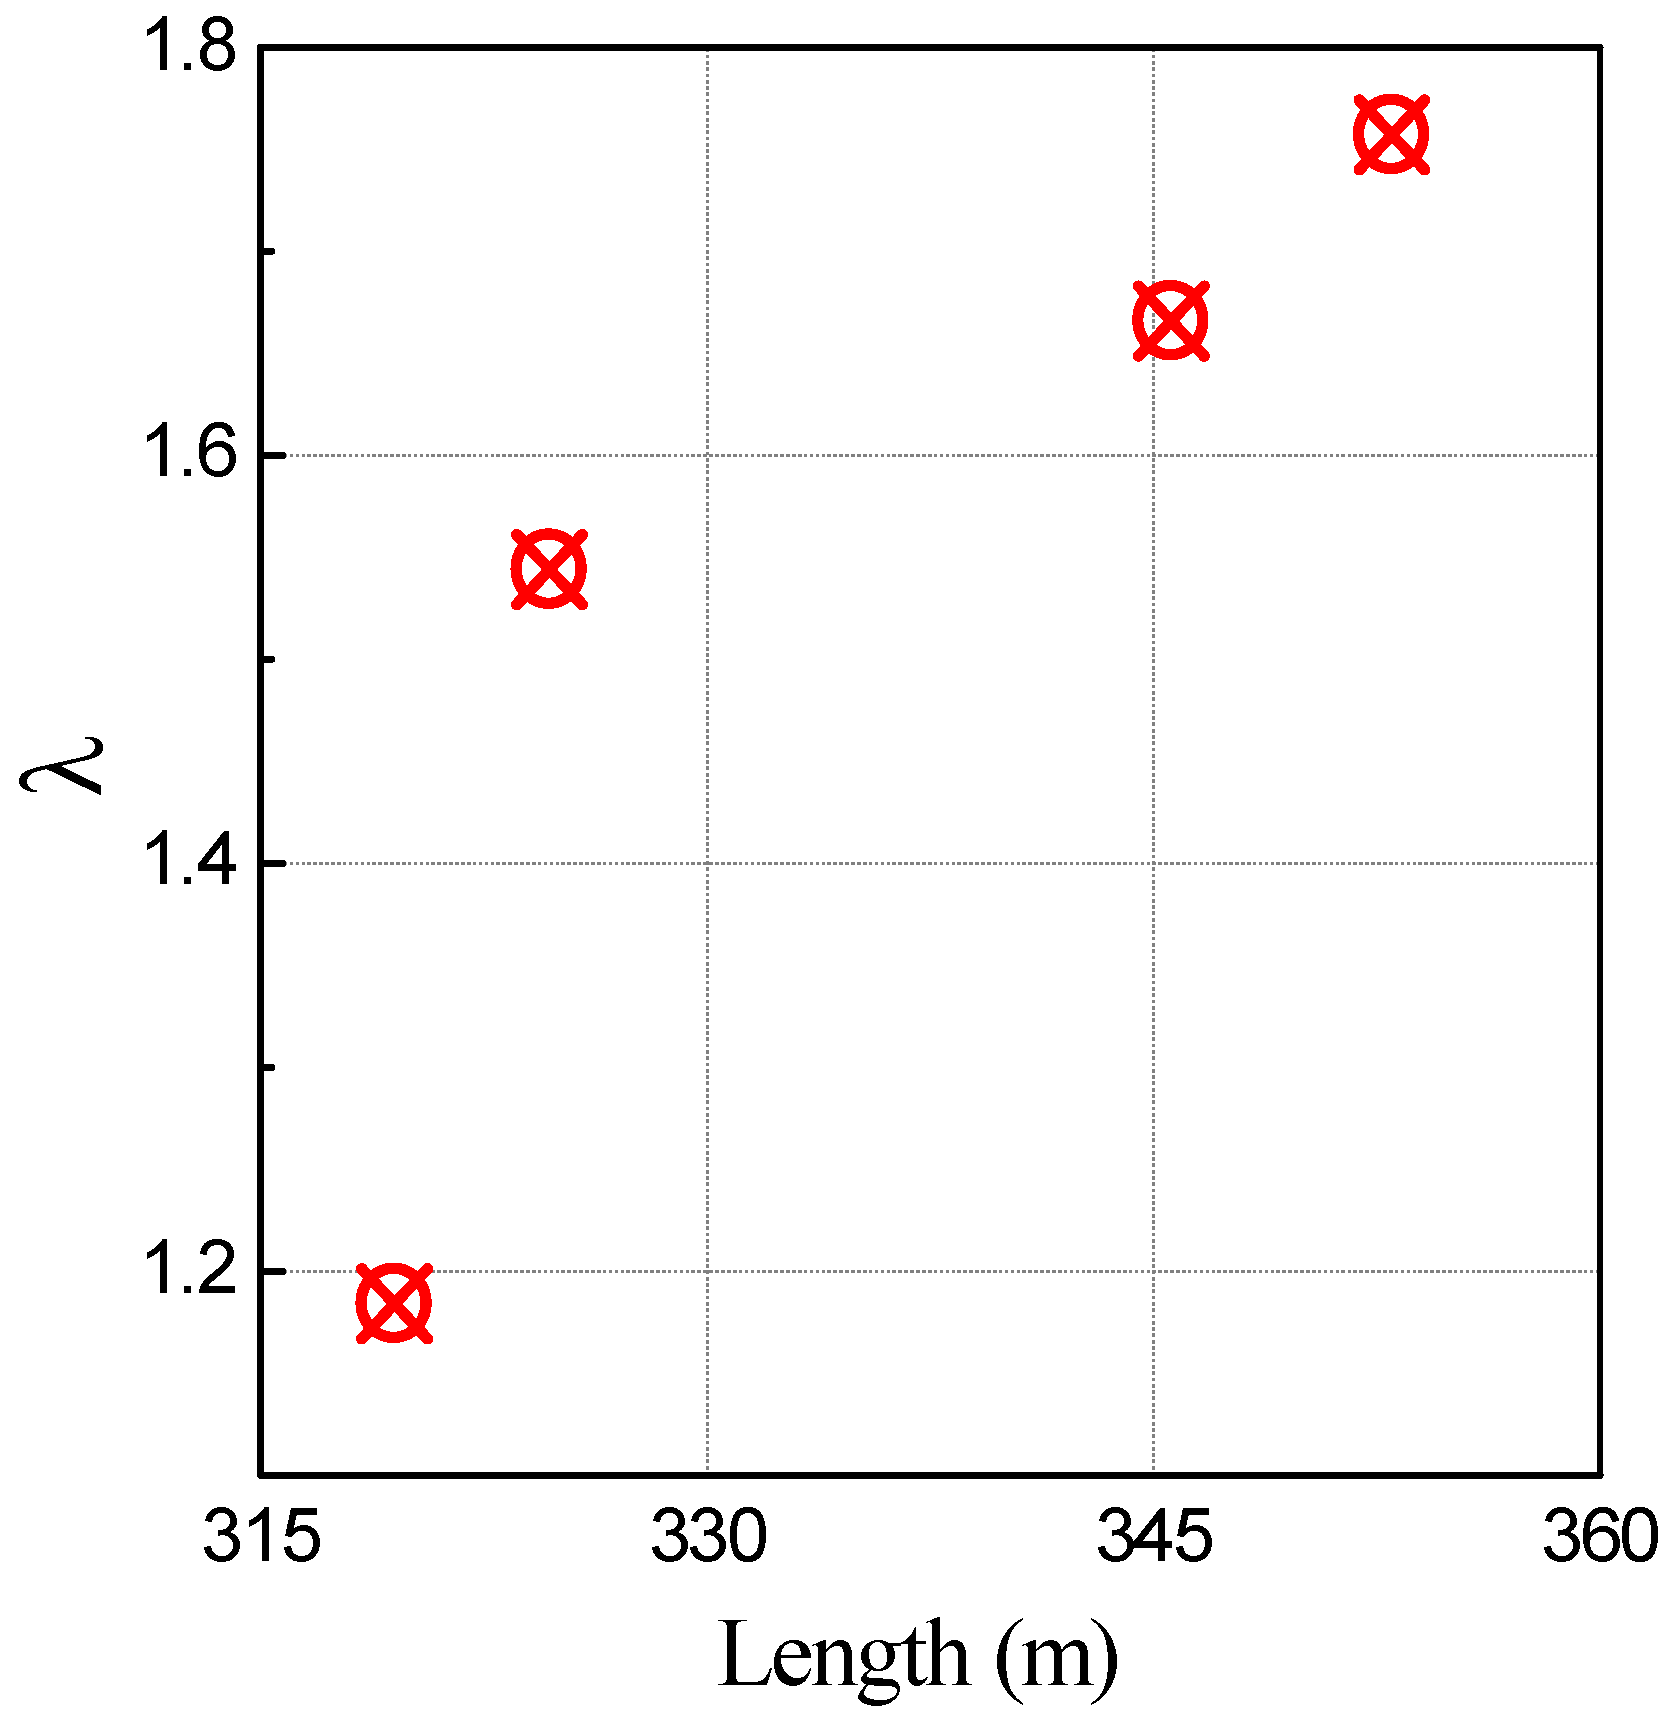
5.1. Influence of Hull Length

The results for the fatigue damage to the deck and bottom longitudinals at midship are presented in Table 3 and Table 4, respectively. The damage ratio is 1.184 for the 319.5 m-long 250,000 DWT OC, but it is as high as 1.757 for the 353 m-long 400,000 DWT OC. Figure 4 shows the first order natural frequency of vertical vibration versus the hull length for the four OCs in the full loading condition. Both the dry mode and the wet mode natural frequencies decrease with the increase of hull length, and it is shown in Figure 5 that the damage ratio increases with the hull length. This suggests that, for ultra large ore carriers, the influence of springing shall be considered in the calculation of fatigue damage.

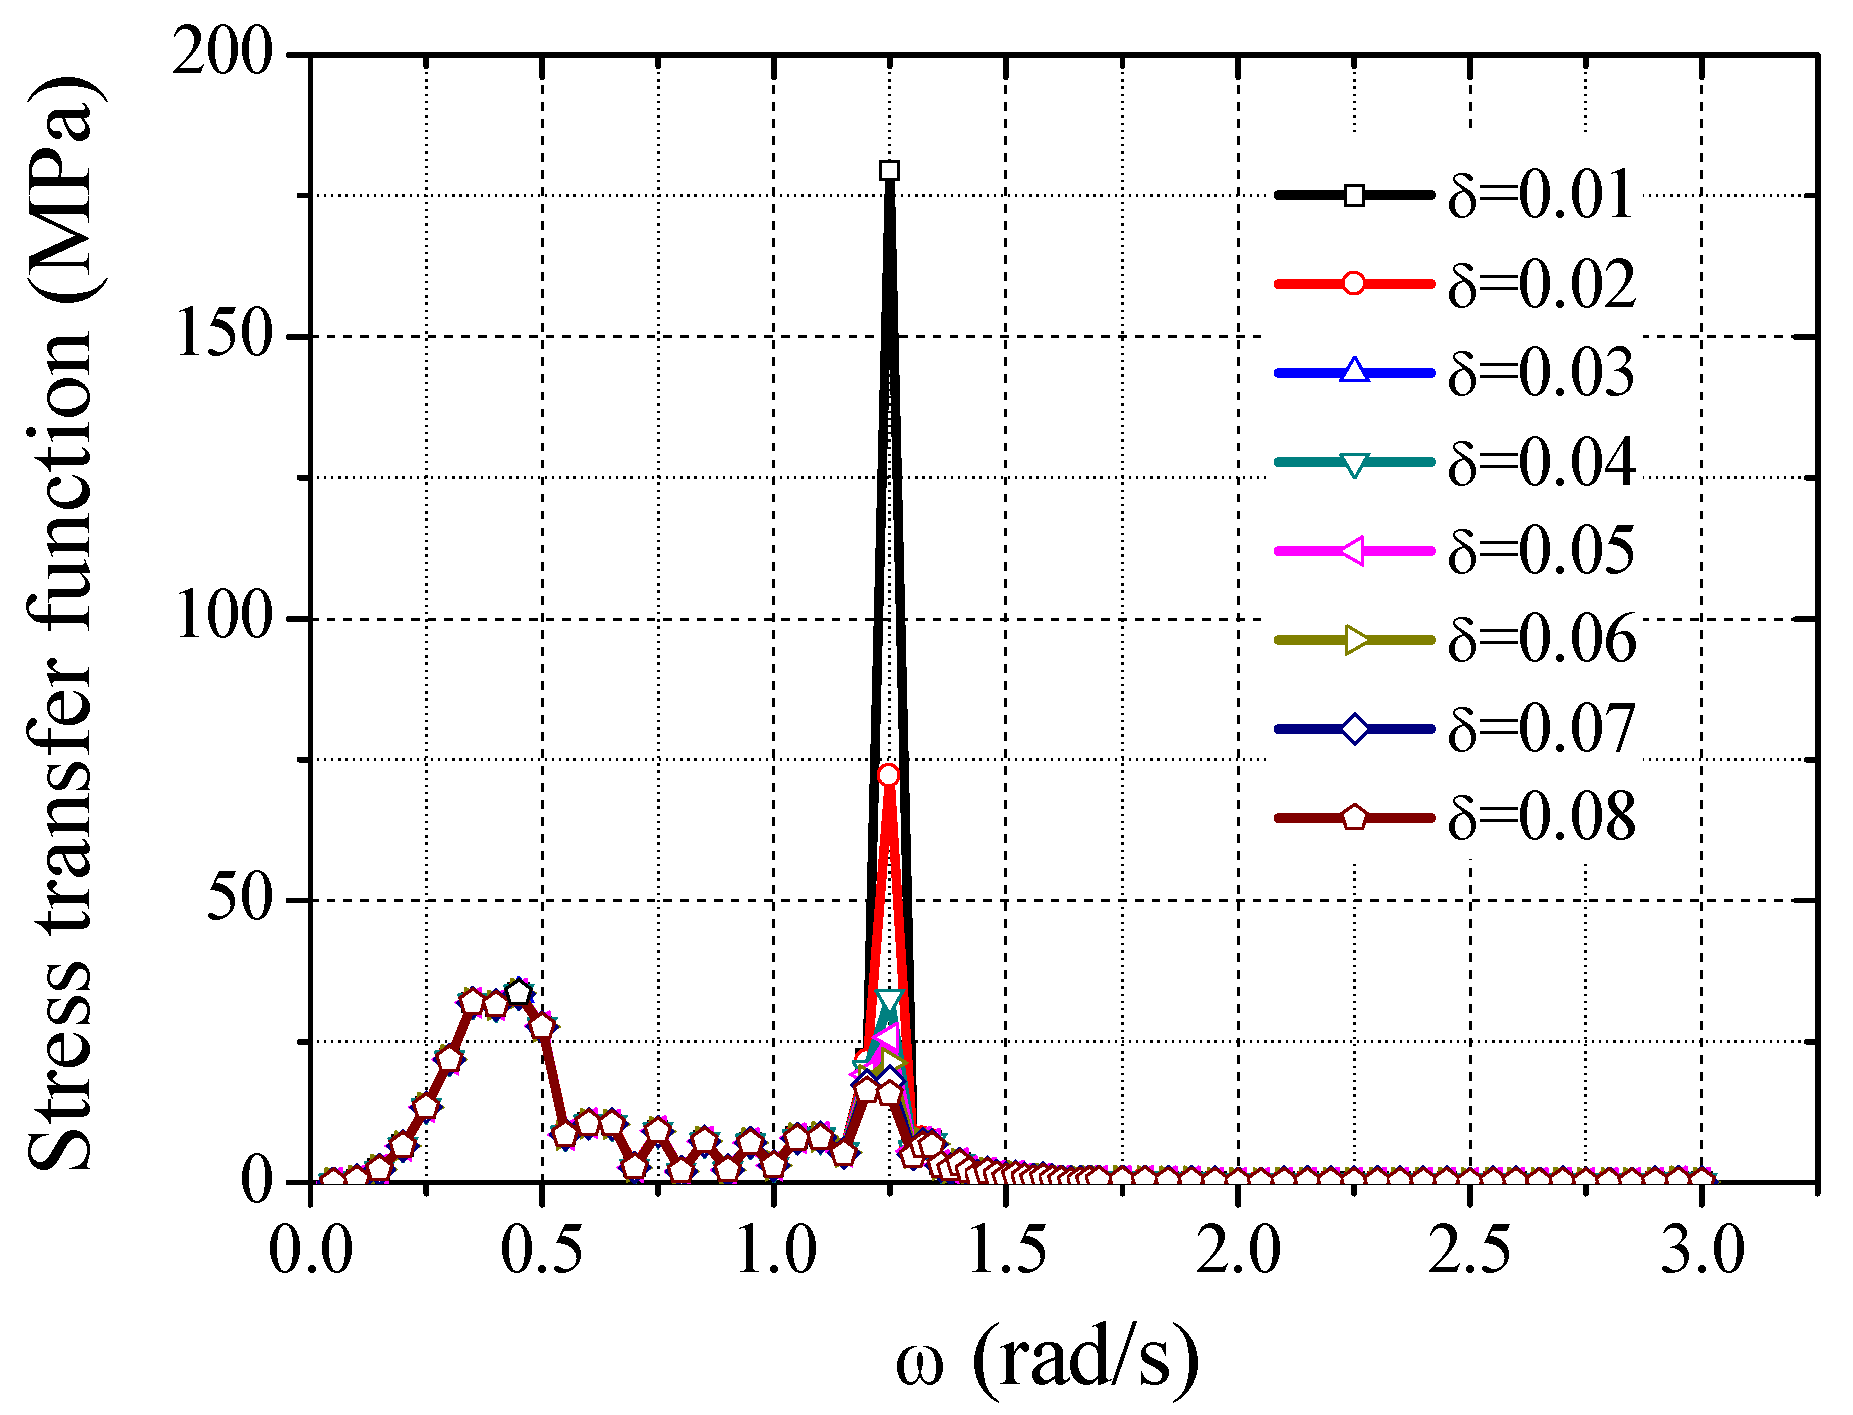
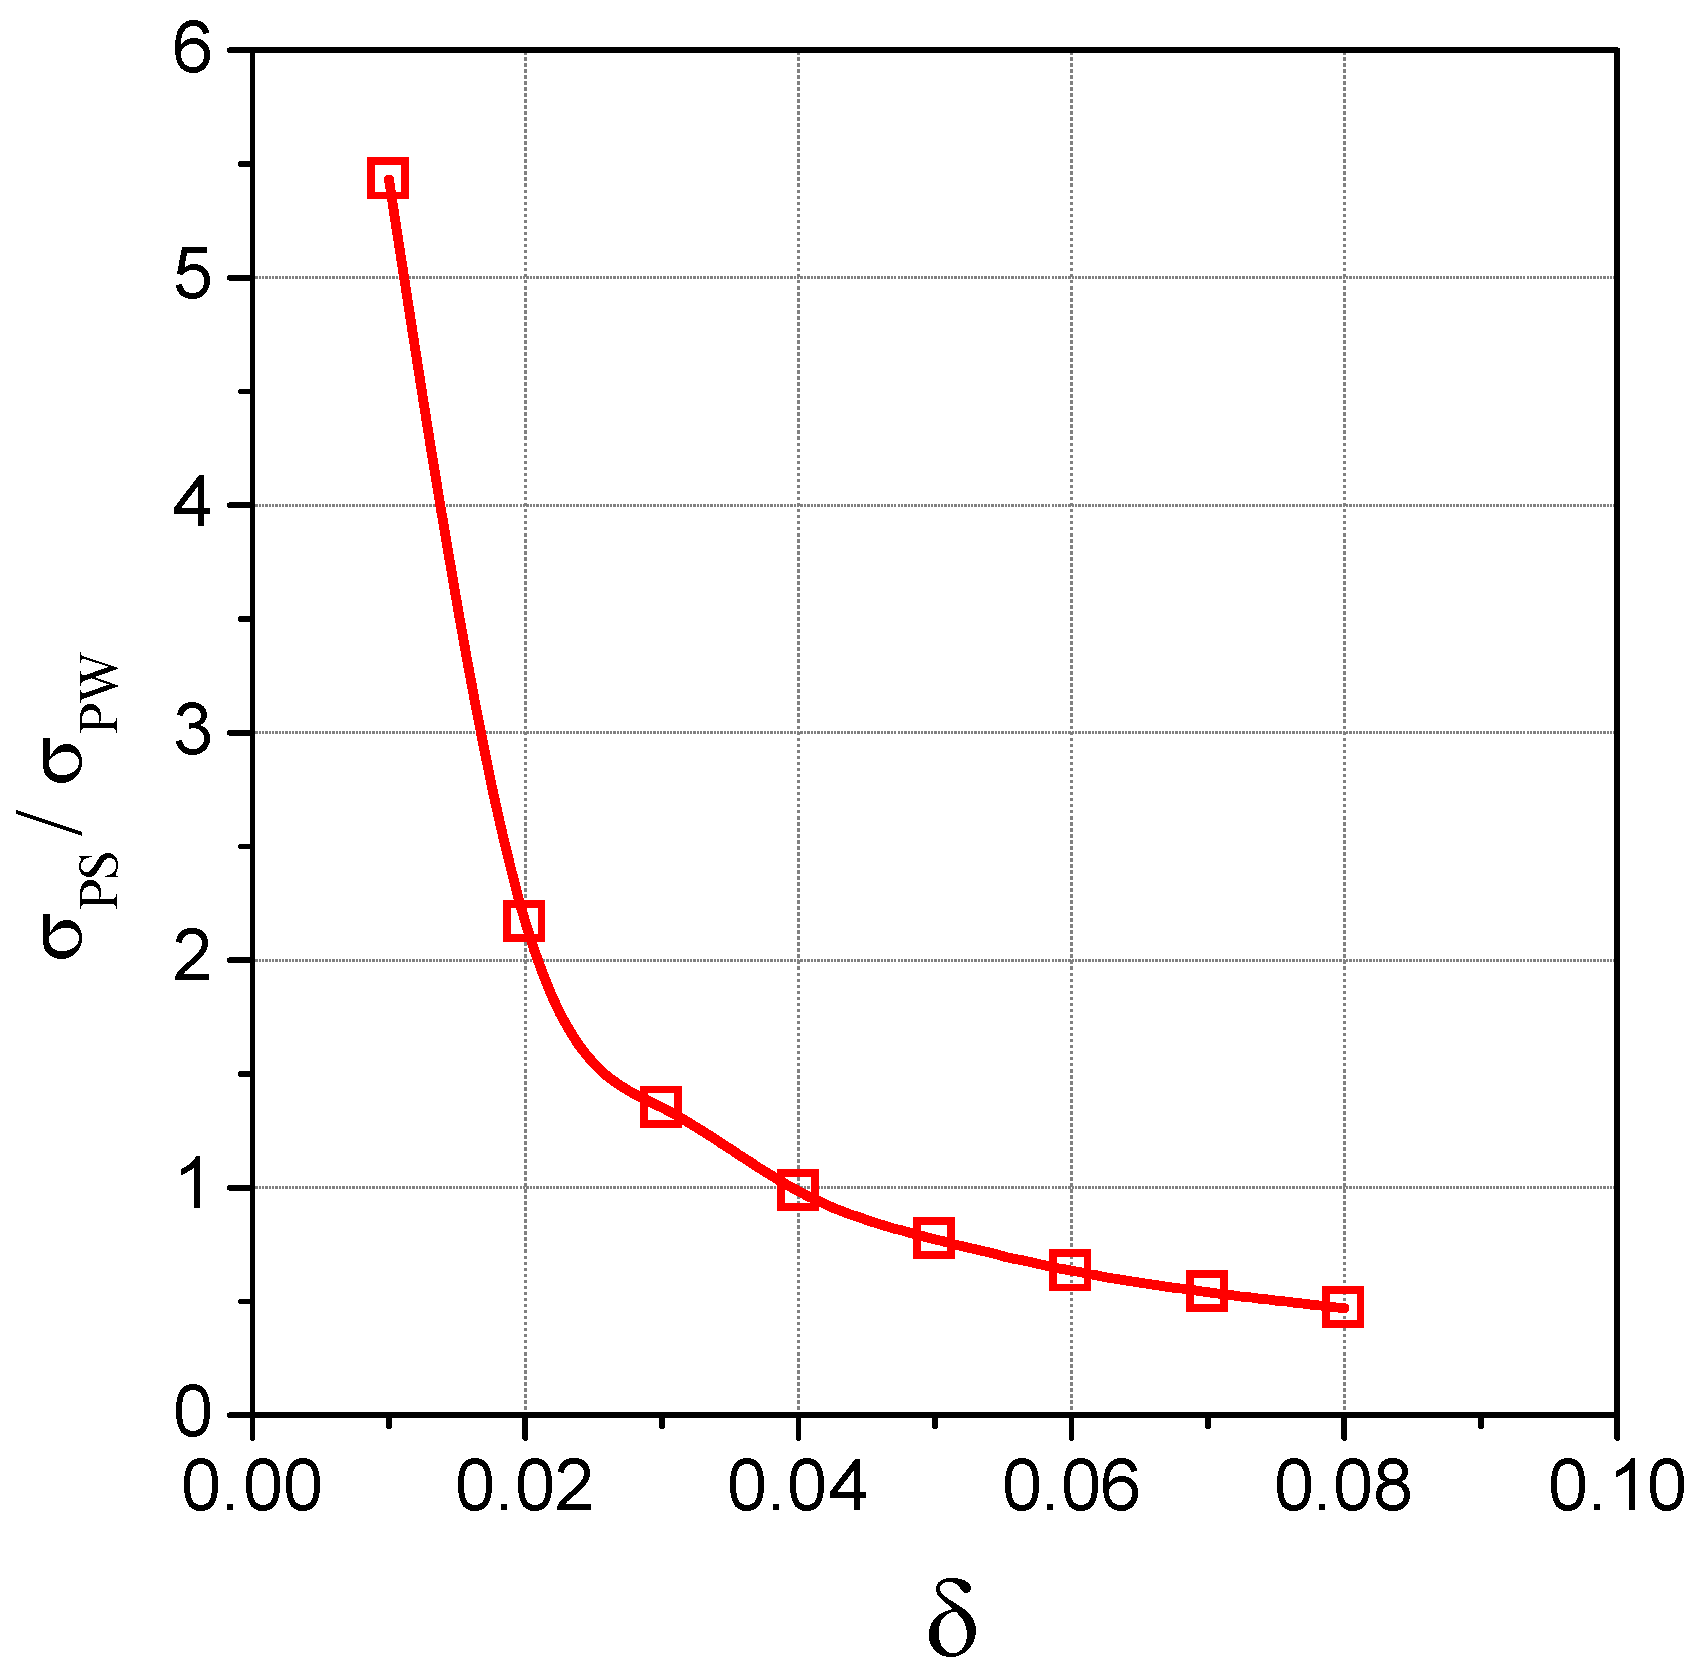
5.2. Influence of Structure Damping

For the resonance phenomenon, the wave-induced vibration response is closely related with the hull structure damping, which directly affects the peak of the springing response. Figure 6 shows the stress transfer RAOs with a different structural damping of deck longitudinals at midship of the 400,000 DWT OC advancing at 15 kn in head waves. It can be seen that the stress changes significantly with the structural damping. The smaller the structure damping, the larger the stress response in the resonance range.
Figure 7 shows the ratio of the stress peak of the springing response ( σ P S ) to the maximum amplitude of low frequency stress response ( σ P W ). As can been seen, the smaller the damping coefficient and the large the σ P S / σ P W , particularly, for the smallest δ explored, the amplitude of resonant response can be 5.5 times larger than that induced by low frequency waves. As δ increases, σ P S / σ P W decreases monotonically. As shown in Figure 8, the damage ratio of the upper deck longitudinal drops rapidly as the dimensionless structural damping coefficient δ increases from 0.01 to 0.03, after which (i.e., δ > 0.03 ), the rate of decease slows down. This is because the stress is amplified to its square when stress transfer function is converted into stress spectrum. For a small structural damping, the energy of wave-induced vibration response is significant and it plays an important role in the structural fatigue damage. If the damping is large, the wave-induced vibration will reduce rapidly.

5.3. Influence of Sea State

To investigate the influence of sea state on the fatigue damage to the four OCs, the fatigue damages to the deck longitudinals due to wave-induced vibration and that when the hull is treated as a rigid body are compared and the absolute differences are shown in Figure 9. It can be seen that the sea state has a significant influence on the fatigue damage. For the sea states with zero-crossing periods ( T Z ), being 4.5 s to 12.5 s, and the significant wave height ( H S ) being 3.5 m to 10.5 m, the fatigue damage of wave-induced vibration is the most significant; while in other sea states, the fatigue damage that is caused by springing is very small, see the corresponding damage ratios in Figure 10. Larger damage ratios appear in sea states with small zero-crossing periods; this is because the wave-induced vibration is easier to occur than springing in these sea states. For T Z from 0 s to 4 s, the damage ratio can reach 500 and above, but it does not actually affect the hull fatigue damage. This is because weak sea states only result in small structural responses.

5.4. Influence of Navigation Speed

Figure 11 shows the fatigue damage ratios of four different OCs at four different speeds: 5 kn, 7.5 kn, 11.25 kn, and 15 kn. It is found that the fatigue damage ratios of the 400,000 DWT OC, 388,000 DWT OC, and 250,000 DWT OC are close to each other at different navigational speeds. The corresponding average fatigue damage ratios for these three OCs are 40.74% for 15 kn, 41.11% for 12.25 kn, 14.98% for 7.5 kn, and 3.17% for 5 kn, respectively. The corresponding damage ratios of the 300,000 DWT OC at different speeds are 28.43%, 49.88%, 17.79%, and 3.9%. For all four OCs, the sum of the fatigue damage ratios at 15 kn, 11.25 kn, and 7.5 kn is close to 97%. It indicates that the fatigue damages resulting from springing mainly occur in the medium and high speed conditions. The fatigue damage at low speeds is very small. This is because the encountering frequency is much lower than the first order natural frequency of the hull.

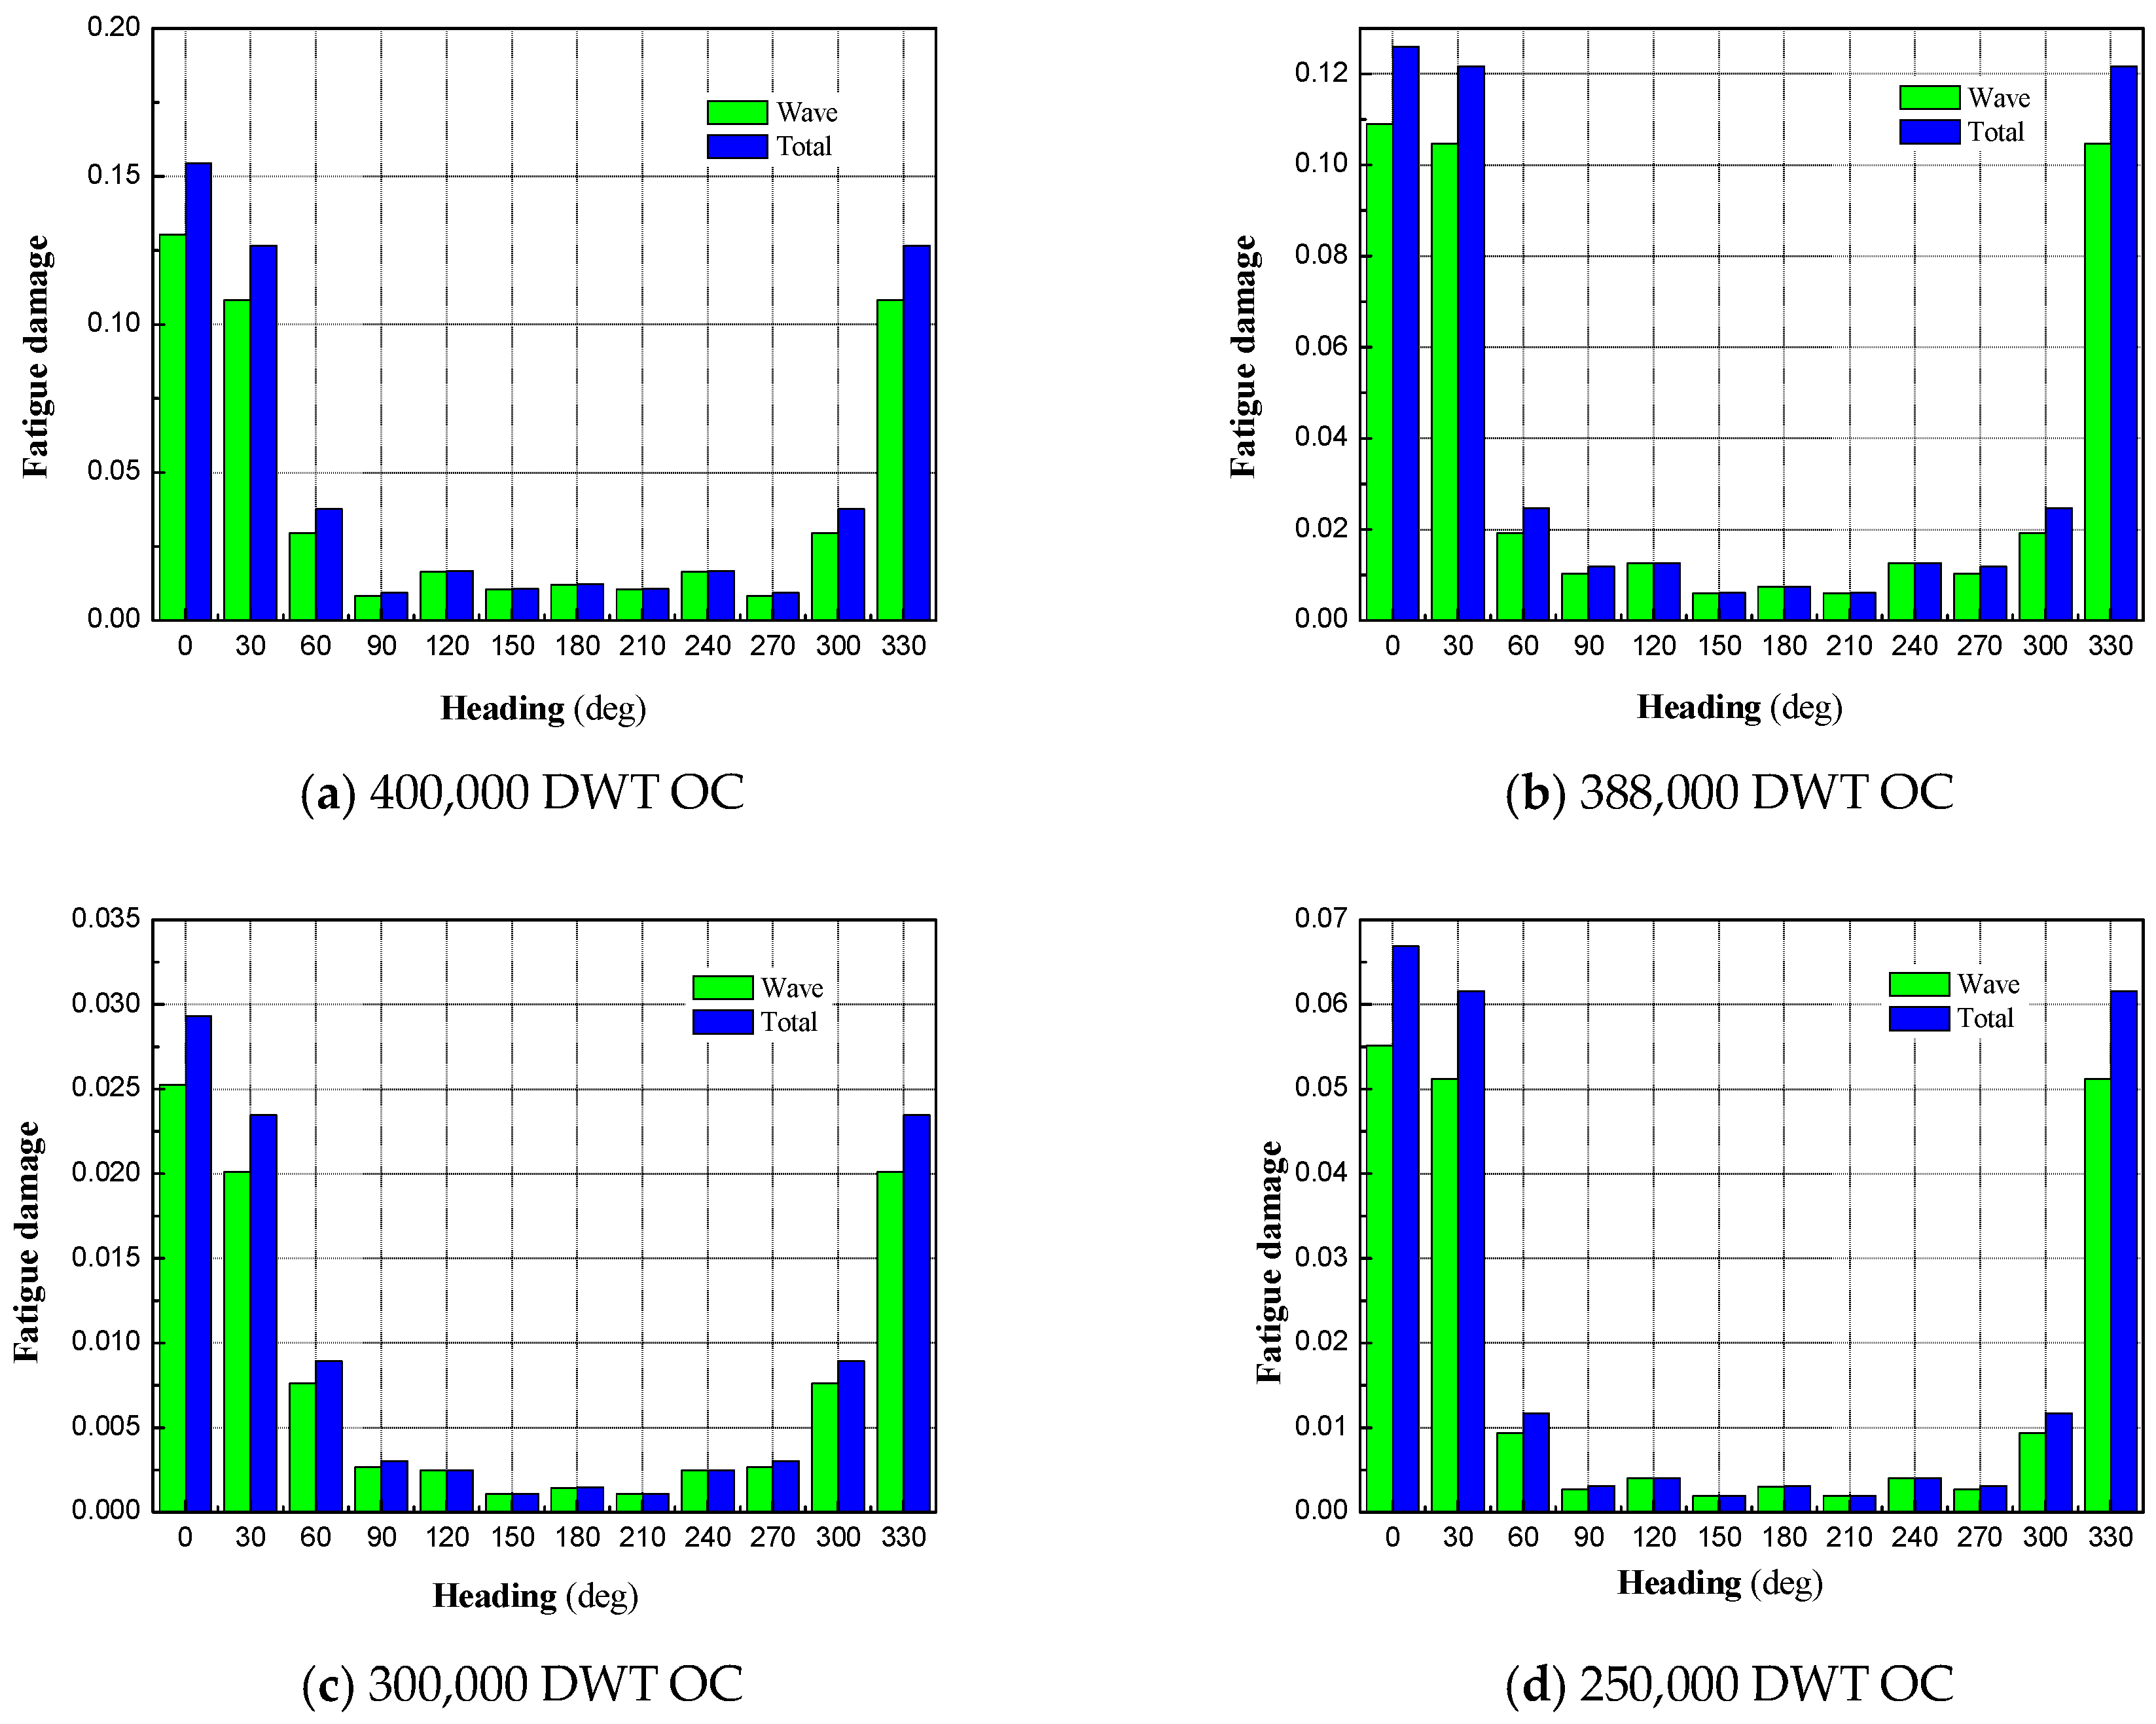
5.5. Influence of Wave Heading

The definition of wave heading is shown Figure 12, where 0o is defined as the wave heading direction. Figure 13 shows the RAOs of vertical bending moment of the four OCs at different wave headings. The peak of the RAOs of vertical bending moment in the low frequency range appears at different wave headings, which corresponds to the characteristics of the rigid motion of the hull. The wave encounter frequency can reach a relatively very high level when the vessels advance at the service speed in head waves, as well as in quartering waves. Springing occurs when the wave encounter frequency is close to the first order wet natural frequency of the hull. Therefore, another peak in the high frequency range can also be observed in head and quartering waves, which is caused by the wave induced vibration. The springing is prominent for the wave heading range −60° to 60° (300° to 360° and 0° to 60°), see Figure 14.
The corresponding fatigue damage to the deck longitudinals at midship for each wave heading are shown in Figure 14. It can be seen that, in the heading range of ±60° (head waves and bow quartering waves), the OCs experience large fatigue damage. This is because under these conditions, the encounter wave frequency will increase leading to the occurrence of springing. For the 400,000 DWT, 380,000 DWT and 300,000 DWT OCs, the fatigue damage is increased by 16.28%, 16.95%, and 16.41% due to the springing in bow quartering waves, respectively. For 250,000 DWT OCs, the fatigue damage is increased by 21.18%. Since the fatigue damage is insignificant and the influence of the wave induced vibration is not obvious in beam and stern quartering waves, these wave directions can be neglected in the analysis of the influence of springing on the fatigue damage of ultra large ore carriers.

5.6. Influence of Loading Condition

Table 5 shows the damage ratio of deck longitudinals at midship under different loading conditions. It can be seen that the damage in the ballast condition is significantly larger than that in the full loading condition. Under the ballast condition, the draft decreases, and the pressure that is caused by the waves at the hull bottom increases exponentially. As a result, the wave-induced stress at the hull bottom also increases, which causes further increase of wave-induced vibration response of hull structures under full loading condition.

6. Conclusions

This paper presents the hull structure fatigue damage calculation of the springing response of ultra large ore carriers. A three-dimensional linear frequency domain hydroelasticity analysis method is applied to calculate the load response of the hull girder, and a spectral analysis method is adopted to calculate the fatigue damage to the deck and bottom longitudinals. The rain flow correction and narrow band approximation are used to account for the effect of springing response on structural fatigue damage. Analyses have been conducted for the influence of a wide variety of parameters on the fatigue damage of the vessels, including hull length, sea state, vessel speed, heading angle, and also the loading condition. The following conclusions are drawn:
(1)
Based on a 3D linear frequency domain hydroelasticity analysis method, and when combined with a spectral analysis method for strength assessment of ship hull structure, a method is established for evaluating the structure fatigue damage of ultra large ore carriers.
(2)
The springing response may make significant contribution to the structure fatigue damage of ultra large ore carrier. Vessels of a larger length usually have larger fatigue damage ratio. In particular, the damage ratio is 1.184 for the smallest ship investigated, while 1.784 for the largest.
(3)
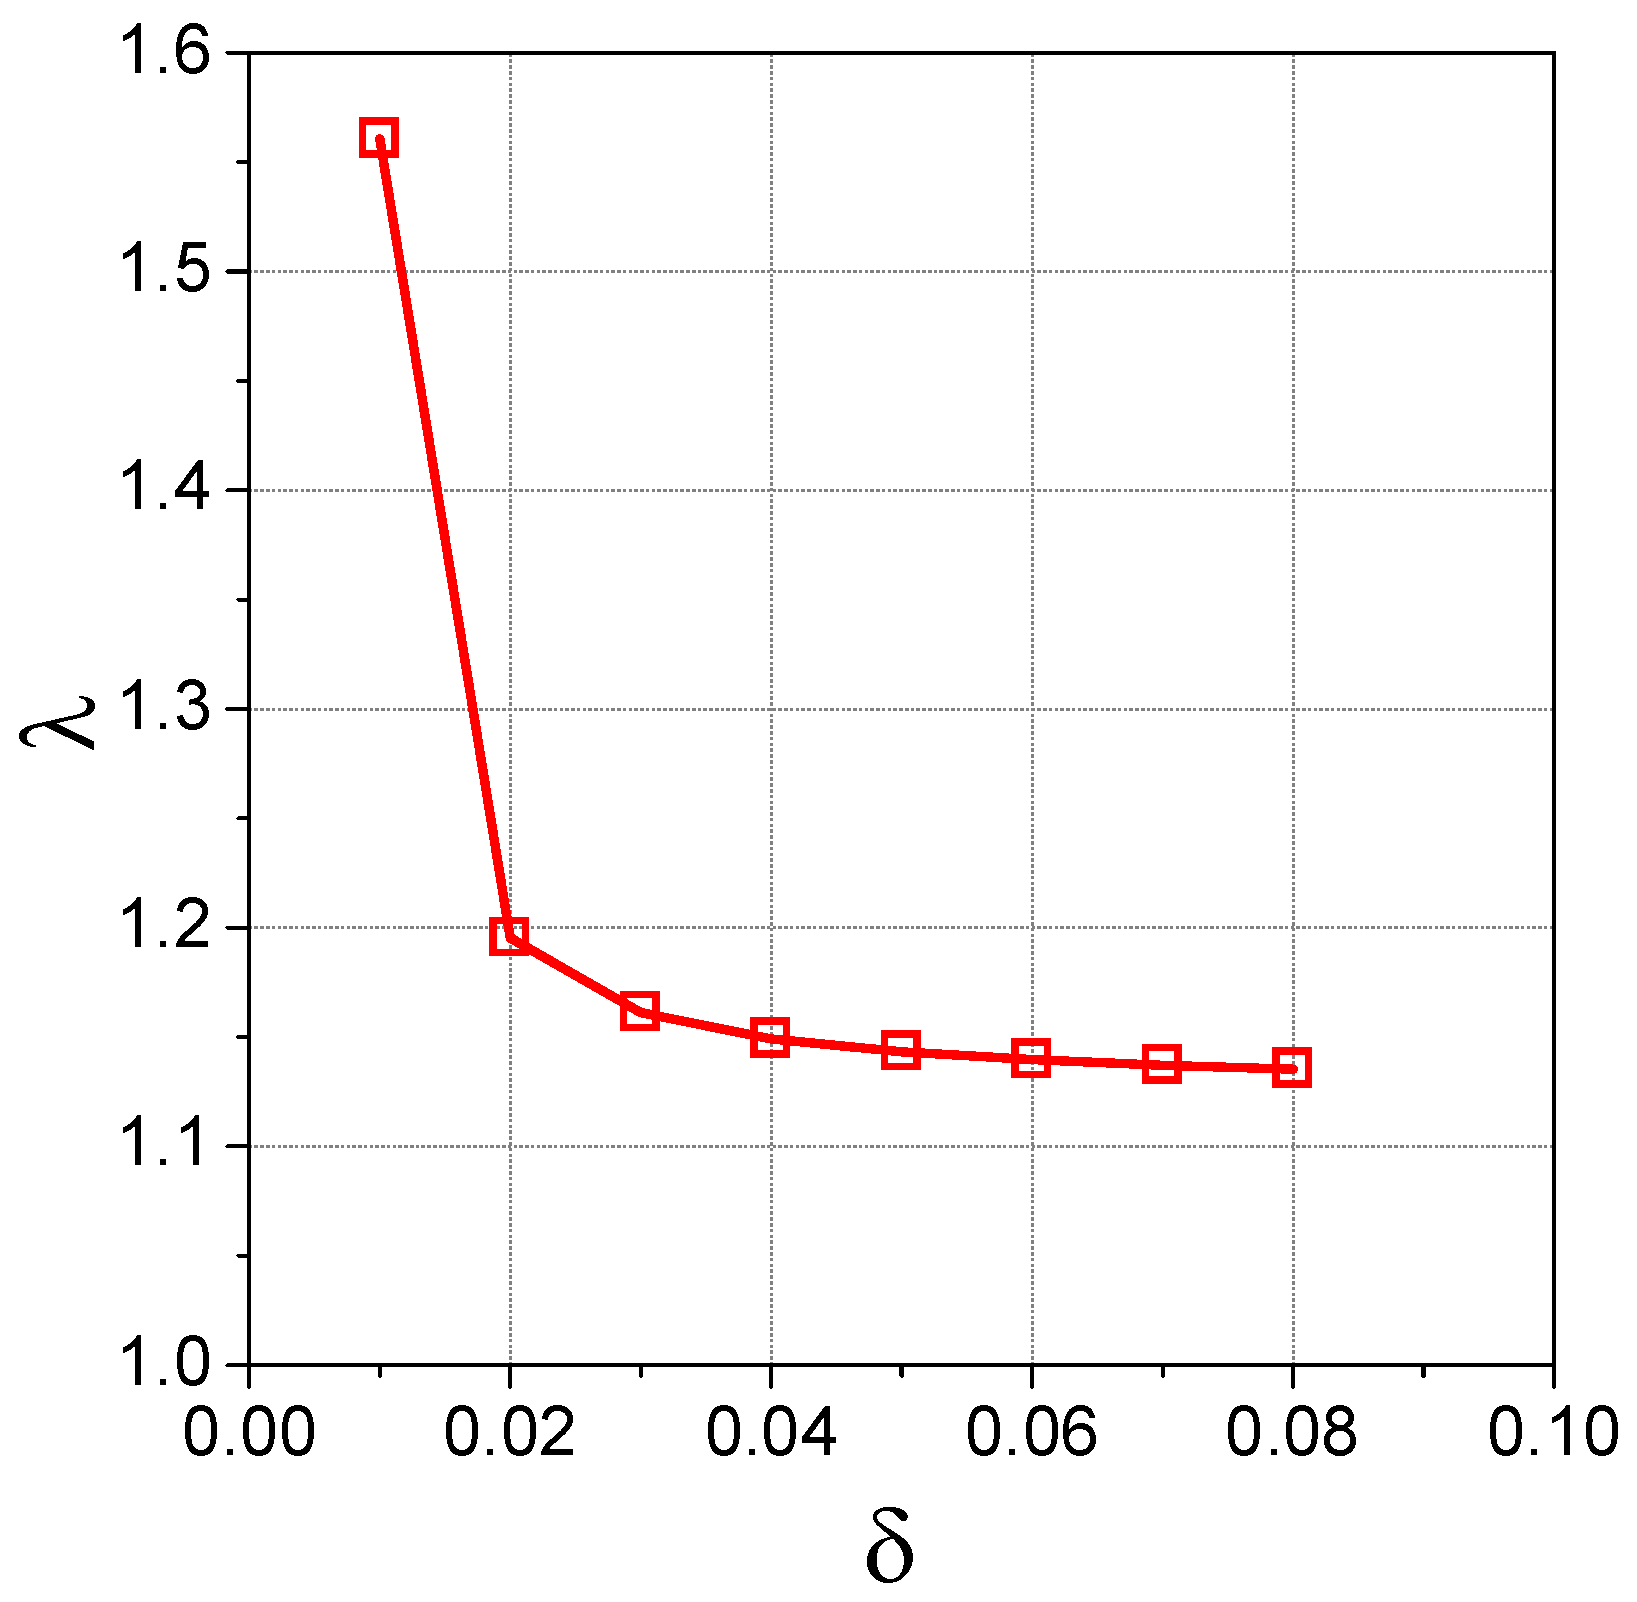
The structural damping has a large influence on the peak value of the springing response, and thus significantly affects the fatigue damage of ultra large ore carriers. For the 400,000 DWT ore carrier, the peak value of the springing response decreases rapidly when the structural damping coefficient increases from 0.01 to 0.03. However, the rate of decrease slows down after the structural damping coefficient exceeds 0.05.
(4)
The springing effect on the structural fatigue damage is pronounced in moderate sea states. The results that were obtained for the fatigue damage of the four ultra large ore carriers show that, when the range of zero-cross period is 4.5~12.5 s and with wave height of 3.5~10.5 m, the fatigue damage due to springing significantly increases. However, the significant effect is observed in other sea states.
(5)
According the results, navigation at a relatively high speed in moderate mild seas results in larger fatigue damage than that at a reduced speed in high seas.
(6)
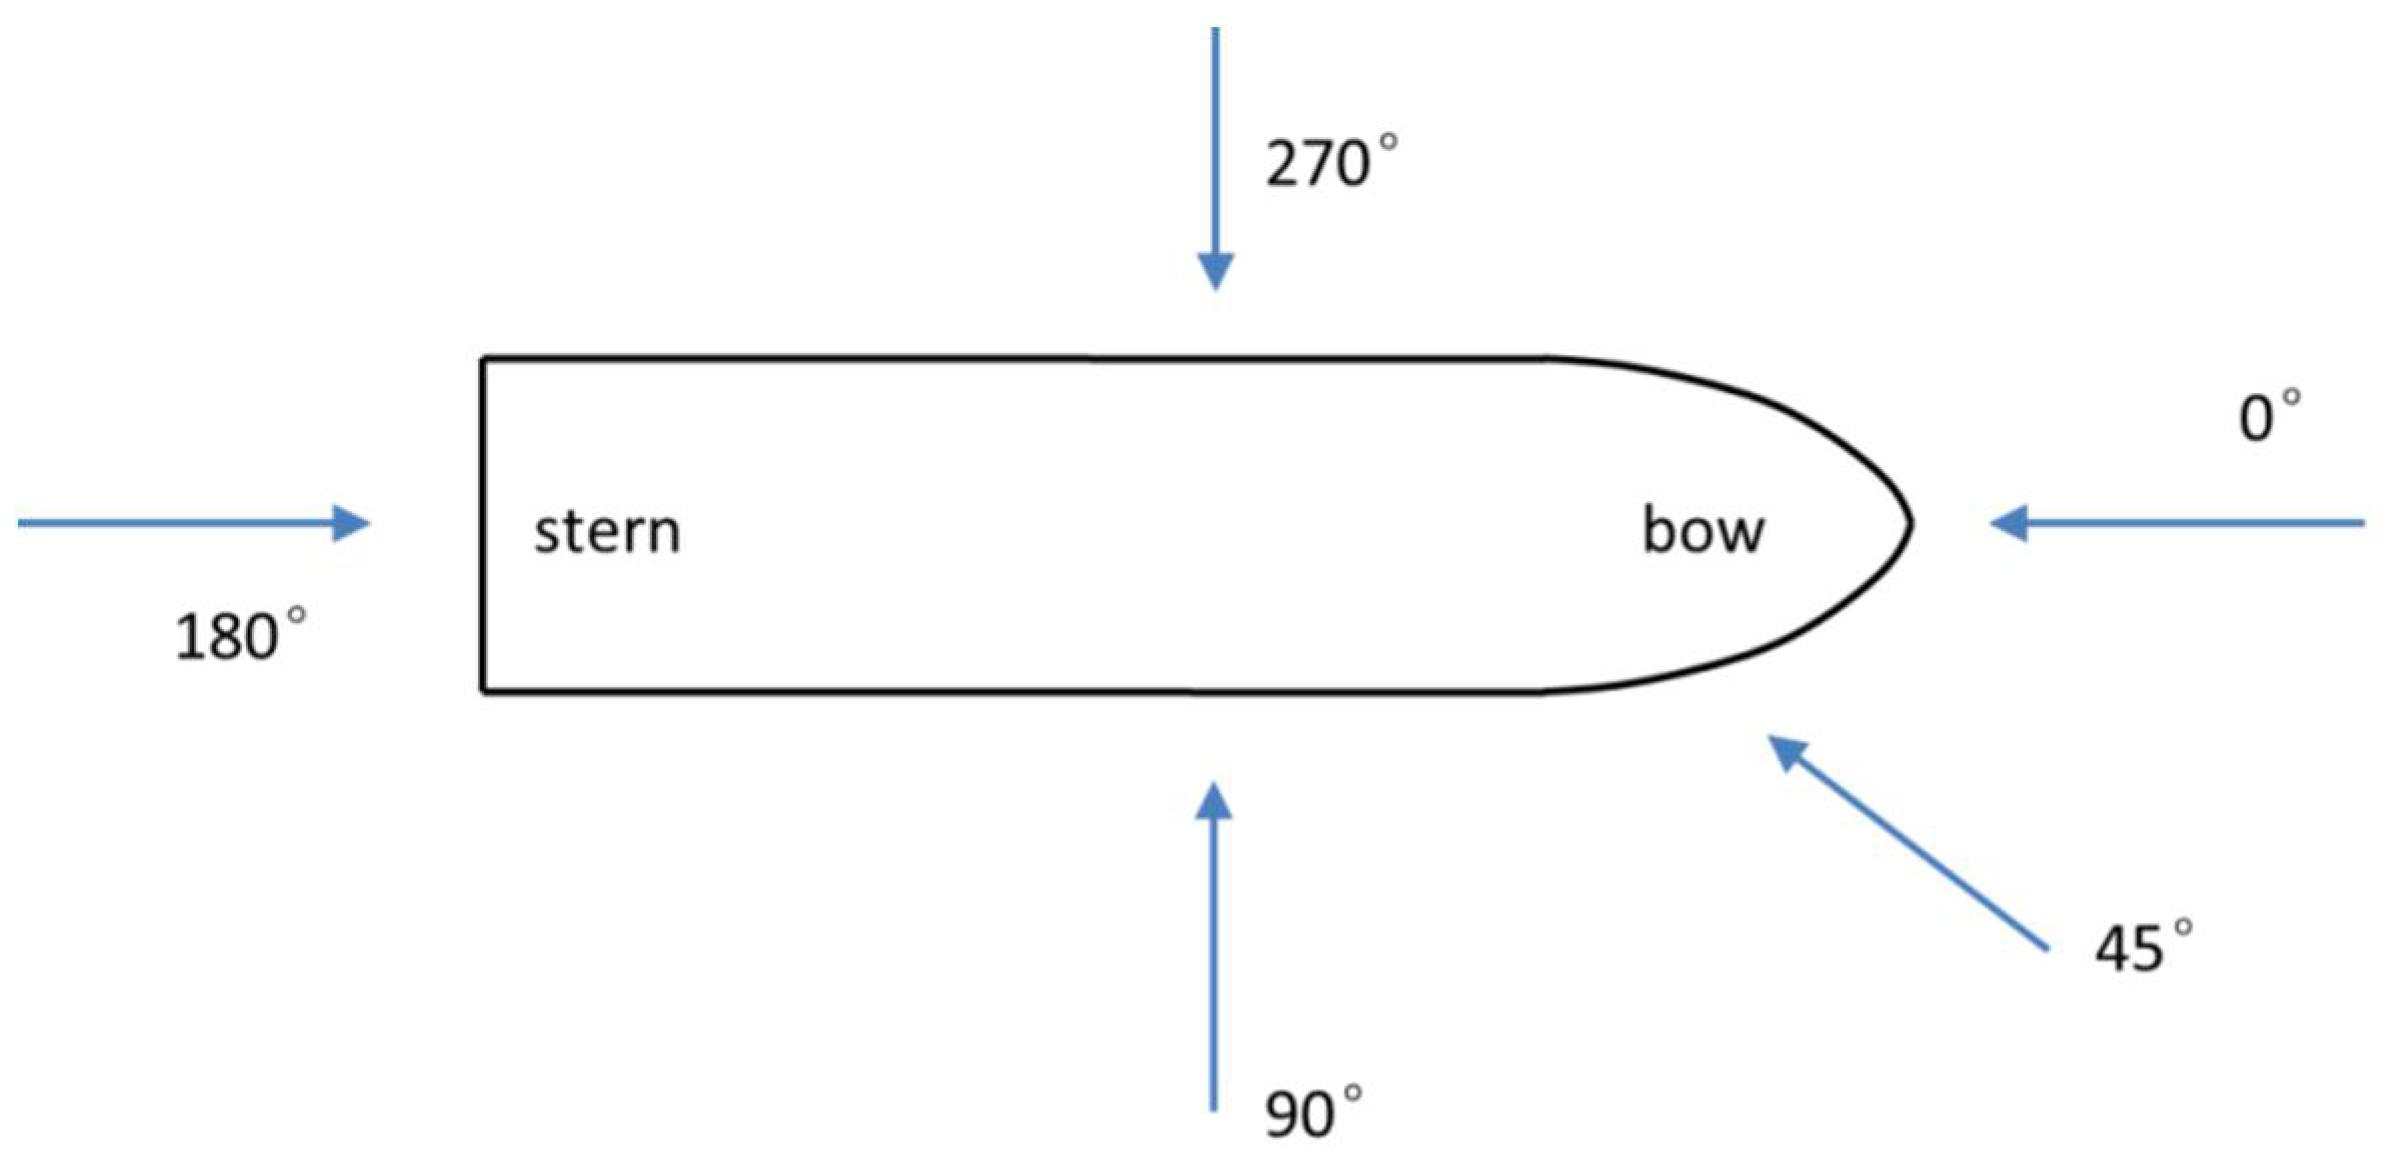
Another observation is that the fatigue damage is significant when the when the wave heading ranges from −60° to +60°.
(7)
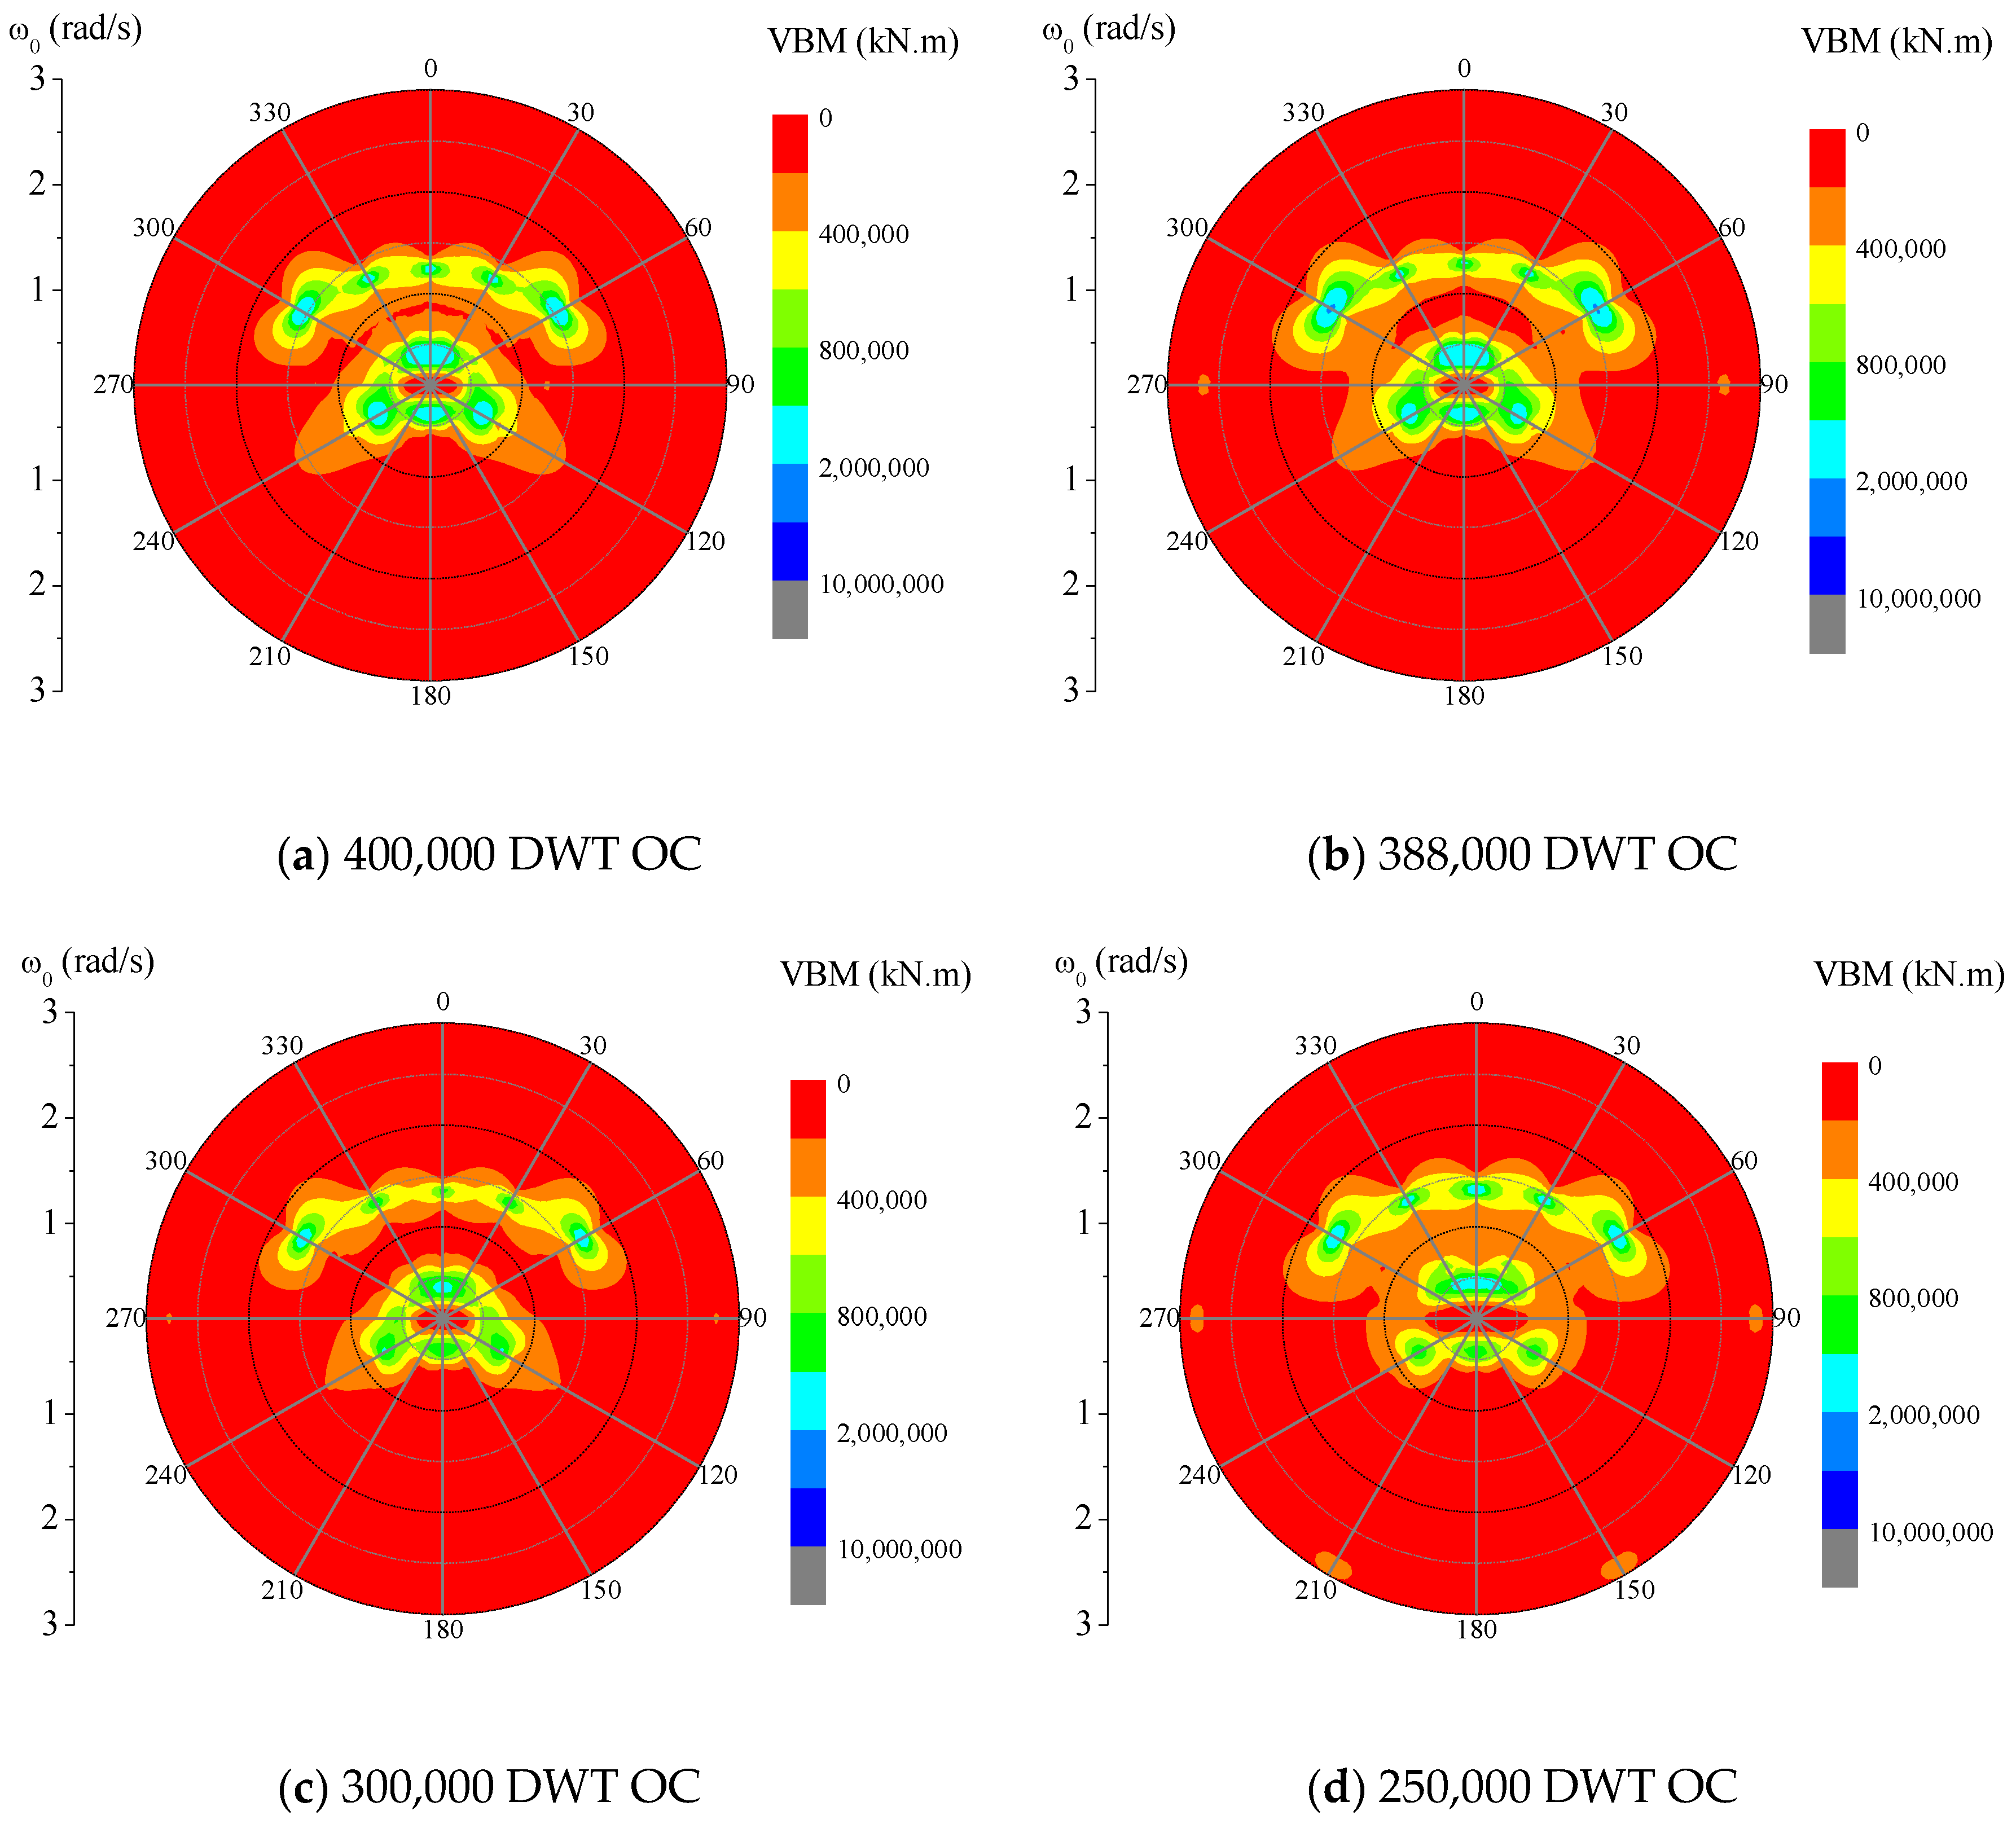
As for the loading condition, no distinct difference is observed in the effect of linear springing on the fatigue damage between the full loading and the ballast condition.

Author Contributions

All the authors contributed equally to bringing this paper to its present form. The study design was done by the first author, H.L., who also made significant contribution to the data analysis and data interpretation. The second author, D.W., performed a major part of the data analysis, and part of the writing. The third author, N.L., made an important contribution with data collection and data analysis. The forth and the fifth authors, X.-Q.Z. & M.C.O., made important contributions to the study design, composition, and revision.

Acknowledgments

The project was supported by the National Natural Science Foundation of China (51679049, 51761135013).

Conflicts of Interest

The authors declare no conflict of interest.

Appendix A

The dry mode is chosen as the generalized primary function for the modal analysis, which is done using the transfer matrix method, and the hull is represented by a Timoshenko girder of 20 sections. Figure A1 shows the first five orders of vertical deformation modes in full loading condition, i.e., 400,000 DWT OC.
Figure A1. Principal mode shapes of the 400,000 DWT OC in full loading condition.
Applsci 08 00763 g0a1
Theoretically, hull structures have an infinite number of vibration modes, however, it is common practice that only the lower order elastic modes are accounted for and superposed as they make most of the contribution to the structure response. In order to determine to which order the superposition can sufficiently account for the wave load response of the ship hull, the 1st to 5th orders of vertical mode are explored.
The wave-induced bending moment response is obtained for the 400,000 DWT OC in full loading condition advancing at 15 kn in head waves, and the response in each elastic mode is obtained and presented in Figure A2. It can be seen that the vertical bending moment response can be captured by the first three orders with satisfactory accuracy, and the contribution of higher orders to the accuracy is insignificant. Figure A3 shows the transfer function of the elastic principal coordinate for all the explored orders. It can also be seen that all the major principal coordinates of elastic mode accounting for most of the contribution can be obtained with the first three orders. Thus, only the first three orders are taken into account in the following analysis.
Figure A2. Vertical bending moment response at the midship section obtained with different numbers of elastic modes for the 400,000 DWT OC in full loading condition.
Applsci 08 00763 g0a2
Figure A3. The amplitude of the elastic principal coordinates of each order for the 400,000 DWT OC in full loading condition.
Applsci 08 00763 g0a3
In order to investigate the influence of the mesh refinement on the numerical accuracy, a convergence study is performed by discretizing the hull into a variety of numbers of panels, namely 1430, 3864, 6254 and 8002, as shown in Figure A4. Figure A5 shows the numerical results obtained with these meshes for the vertical bending moment response. It can be observed that, the influence of number of panels is small in the low frequency range, but significant on the results for the peak values of the vertical bending moment response especially around the resonance frequency.
Figure A4. Panel models of 400,000 DWT OC under full load condition.
Applsci 08 00763 g0a4
Figure A5. Vertical bending moment response obtained with different numbers of hydrodynamic panels 400,000 DWT OC under full load condition.
Applsci 08 00763 g0a5
The number of panels chosen, according to the convergence study of surface discretization, for calculating the wave load on each vessel is shown in Table A1.
Table A1. The panel number of different ships under different loading conditions.
250,000 DWT OC300,000 DWT OC388,000 DWT OC400,000 DWT OC
Full loading condition6960740078568002
Ballast condition6342685872327438

References

  1. Hirdaris, S.E.; Bakkers, N.; White, N.; Temarel, P. Service factor assessment of a great lakes bulk carrier incorporating the effects of hydroelasticity. Mar. Technol. 2009, 46, 116–121. [Google Scholar]
  2. Hu, J.J.; Wu, Y.S.; Tian, C.; Wang, X.L.; Zhang, F. Hydroelastic analysis and model tests on the structural responses and fatigue behaviours of an ultra-large ore carrier in waves. Proc. Inst. Mech. Eng. Part M J. Eng. Marit. Environ. 2012, 226, 135–155. [Google Scholar] [CrossRef]
  3. Kim, S.P.; Yu, H.C.; Hong, S.Y. Segmented model testing and numerical analysis of wave-induced extreme and springing loads on large container carriers. In Proceedings of the 20th International Offshore and Polar Engineering Conference, Beijing, China, 20–25 June 2010. [Google Scholar]
  4. Choi, J.H.; Jung, B.H.; Lee, Y.W.; Bigot, F.; Malenica, S.; Chung, Y.S. Evaluation of springing-induced hull girder loads for ultra large containership and ore carrier. In Proceedings of the 20th International Offshore and Polar Engineering Conference, Beijing, China, 20–25 June 2010. [Google Scholar]
  5. Storhaug, G.; Moan, T. Springing/whipping Response of a large Ocean-going Vessel Investigated by an Experimental Method. In Proceedings of the 26th International Conference on Offshore Mechanics and Arctic Engineering, San Diego, CA, USA, 10–15 June 2007. [Google Scholar]
  6. Storhaug, G.; Vidic-Perunovic, J.; Rüdinger, F.; Holtsmark, G.; Helmers, J.B. Springing/whipping response of a large ocean going vessel—A comparison between numerical simulations and full scale measurements. In Hydroelasticity in Marine Technology; Department of Engineering Science: Oxford, UK, 2003; pp. 117–131. [Google Scholar]
  7. Drummen, I.; Storhaug, G.; Moan, T. Experimental and numerical investigation of fatigue damage due to wave-induced vibrations in a container ship in head seas. J. Mar. Technol. 2008, 13, 428–445. [Google Scholar] [CrossRef]
  8. Moe, E.; Holtsmark, G.; Storhaug, G. Full scale measurements of the wave induced hull girder vibrations of an ore carrier trading in the North Atlantic. In Proceedings of the Conference on Design and Operation of Bulk Carriers, London, UK, 18–19 October 2005; Royal Institution of Naval Architects: London, UK, 2005. [Google Scholar]
  9. Wang, X.L.; Gu, X.K.; Hu, J.J.; Shen, J.W. Hull Structure Wave-Induced Vibration and the Fatigue Damage; China Ship Scientific Research Center Report; China Ship Scientific Research Center: Wuxi, China, 2012. [Google Scholar]
  10. Li, H.; Wang, D.; Zhou, C.M.; Zhang, K.H.; Ren, H.L. Springing Responses Analysis and Segmented Model Test on a 550,000 Dead Weight Tonnage Ore Carrier. J. Offshore Mech. Arct. Eng. 2018, 140, 041301. [Google Scholar] [CrossRef]
  11. Slocum, S.; Troesch, A.W. Nonlinear Ship Springing Experiments; Report No. 266; The University of Michigan, Department of Naval Architecture and Marine Engineering: Ann Arbor, MI, USA, 1983. [Google Scholar]
  12. Vidic-Perunovics, J.; Jensen, J.J. Non-linear springing excitation due to a bidirectional wave field. Mar. Struct. 2005, 18, 332–358. [Google Scholar] [CrossRef]
  13. Shao, Y.; Faltinsen, O.M. A numerical study of the second-order wave excitation of ship springing by a higher-order boundary element method. Int. J. Nav. Archit. Ocean Eng. 2014, 6, 1000–1013. [Google Scholar] [CrossRef]
  14. Bishop, R.E.D.; Price, W.G. Hydroelasticity of Ships; Cambridge University Press: Cambridge, UK, 1979; pp. 120–236. [Google Scholar]
  15. Salvensen, N.; Tuck, E.O.; Faltinsen, O. Ship motion and sea loads. Trans. SNAME 1970, 70, 250–287. [Google Scholar]
  16. Wu, Y.S. Hydroelasticity of Floating Bodies. Ph.D. Thesis, Brunel University, London, UK, 1984. [Google Scholar]
  17. Price, W.G.; Wu, Y.S. Structural responses of a SWATH or multi-hulled vessel traveling in waves. In Proceedings of the International Conference on SWATH Ships and Advanced Multi-hulled Vessels, London, UK, 17–19 April 1985; Royal Institution of Naval Architects: London, UK, 1985. [Google Scholar]
  18. Bishop, R.E.D.; Price, W.G.; Temarel, P.A. Hypothesis concerning the disastrous failure of the Onomichi—Maru. R. Inst. Nav. Archit. Trans. 1985, 127, 169–186. [Google Scholar]
  19. Bishop, R.E.D.; Price, W.G.; Temarel, P.A. Theory on the loss of MV Derbyshire. R. Inst. Nav. Archit. Trans. 1991, 133, 389–453. [Google Scholar]
  20. Senjanović, I.; Malenica, Š.; Tomašević, S. Investigation of ship hydroelasticity. Ocean Eng. 2008, 35, 523–535. [Google Scholar] [CrossRef]
  21. Adenya, C.A.; Ren, H.L.; Li, H.; Wang, D. Estimation of Springing Response for 550 000 DWT Ore Carrier. J. Mar. Sci. Appl. 2016, 15, 260–268. [Google Scholar] [CrossRef]
  22. Bishop, R.E.D.; Price, W.G.; Wu, Y.A. General Linear Hydroelasticity Theory of Floating Structures Moving in a Seaway. Philos. Trans. R. Soc. A Math. Phys. Eng. Sci. 1986, 316, 375–426. [Google Scholar] [CrossRef]
  23. Xia, J.Z.; Wu, Y.S. A general interface condition of fluid solid coupling problem. Ship Perform. Res. 1993, 2, 15–22. [Google Scholar]
  24. Miner, M.A. Cumulative Damage in Fatigue. J. Appl. Mech. 1945, 12, 159–164. [Google Scholar]
  25. Bureau Veritas. Spectral Fatigue Analysis Methodology for Ships and Offshore Units; Bureau Veritas: Neuilly-sur-Seine, France, 2008. [Google Scholar]
  26. Gu, X.K.; Moan, T. Long Term Fatigue Damage of Ship Structure under Non-Linear Wave Loads. J. Mar. Technol. 2002, 39, 85–104. [Google Scholar]
  27. Wirsching, P.H. Fatigue reliability for offshore Structures. J. Struct. Eng. 1984, 110, 2340–2355. [Google Scholar] [CrossRef]
  28. Jiao, G.; Moan, T. Probabilistic analysis of fatigue due to Gaussian load processes. Probab. Eng. Mech. 1990, 5, 76–83. [Google Scholar] [CrossRef]
  29. American Bureau of Shipping. Guidance Notes on Springing Assessment for Container Vessel; American Bureau of Shipping: Houston, TX, USA, 2014. [Google Scholar]
  30. American Bureau of Shipping. Guidance Notes on Whipping Assessment for Container Vessel; American Bureau of Shipping: Houston, TX, USA, 2014. [Google Scholar]
Figure 1. Stress spectrum of 400,000 DWT ore carriers (OC) ( T Z = 6.5 s, H S = 6.5 m, U = 11.25 kn, β = 0°).
Applsci 08 00763 g001
Figure 2. Stress spectrum of 400,000 DWT OC ( T Z = 5.5 s, H S = 3.5 m, U = 15 kn, β = 30°).
Applsci 08 00763 g002
Figure 3. Mass distribution and structural properties along the 400,000 DWT OC.
Applsci 08 00763 g003
Figure 4. The natural frequency versus the hull length in full loading condition.
Applsci 08 00763 g004
Figure 5. The damage ratio for upper deck longitudinals versus the hull length in full loading condition.
Applsci 08 00763 g005
Figure 6. Stress transfer functions for deck longitudinal with different structural damping ratios.
Applsci 08 00763 g006
Figure 7. Peak ratio of springing stress to low frequency induced stress.
Applsci 08 00763 g007
Figure 8. Fatigue damage ratio versus structural damping ratio.
Applsci 08 00763 g008
Figure 9. Fatigue damage difference in different sea states.
Applsci 08 00763 g009
Figure 10. Fatigue damage ratio in different sea states.
Applsci 08 00763 g010
Figure 11. The proportion of fatigue damage ratios in total damage at different navigational speeds.
Applsci 08 00763 g011
Figure 12. Definition of wave heading.
Applsci 08 00763 g012
Figure 13. Transfer function of vertical bending moment in full loading condition.
Applsci 08 00763 g013
Figure 14. Fatigue damages at different headings.
Applsci 08 00763 g014
Table 1. Principal particulars of the ultra large ore carriers.
250,000 DWT OC300,000 DWT OC388,000 DWT OC400,000 DWT OC
Length between perpendiculars LPP (m)319.5324.7345.6353
Beam B (m)57576565
Depth D (m)26.428.830.530.4
Displacement in full loading condition (tonnes)297,917340,772437,054.6450,851.3
Displacement in ballast condition(tonnes)159,512206,813259,082.7248,551.2
Table 2. The corresponding relationship between speed and sea state [29,30].
H S (m) U (kn)
0 < H S 6.0 100 % × V S
6.0 < H S 9.0 75 % × V S
9.0 < H S 12 50 % × V S
12 < H S 25 % × V S ( 5 kn )
Table 3. Fatigue damage to the deck longitudinals at midship.
250,000 DWT OC300,000 DWT OC388,000 DWT OC400,000 DWT OC
Fatigue damage due to wave frequency load ( D l )0.1970.0950.4220.489
Total fatigue damage including springing ( D T )0.2350.1090.4880.569
Fatigue damage ratio including springing ( λ )1.1931.1501.1551.163
Table 4. Fatigue damage to bottom longitudinals at midship.
250,000 DWT OC300,000 DWT OC388,000 DWT OC400,000 DWT OC
Fatigue damage due to wave frequency load ( D l )0.5450.170.2480.475
Total fatigue damage including springing ( D T )0.6450.2610.4070.851
Fatigue damage ratio including springing ( λ )1.1841.5341.6431.794
Table 5. The damage ratio of deck longitudinals at midship of the OCs under different loading conditions.
250,000 DWT OC300,000 DWT OC388,000 DWT OC400,000 DWT OC
Full loading condition1.1921.1431.1531.159
Ballast condition1.1961.1611.1571.167
Combined loading condition1.1931.1501.1551.163

