1. Introduction
Semi-active suspension systems have attracted the attention of many vehicle experts in the related research field because of their advantages such as no input energy and excellent comfort [
1,
2]. During the driving process, road conditions often change. For vehicles under different road conditions, the focuses of ride comfort and handling stability are different [
3,
4,
5]. The damping characteristics of semi-active suspensions should also be changed along with the road conditions [
6,
7].
The controllable damper is the key component of semi-active suspensions for a variety of vehicles [
8,
9]. Generally speaking, the existing controllable dampers include three types: the MR (magneto-rheological) damper [
10], the ER (electro-rheological) damper [
11], and the controllable hydraulic damper [
12]. The damping force of the MR damper can be adjusted and is easy to control. However, there are also some shortcomings for the MR damper. For example, it is currently too expensive. Moreover, the instability of the magneto-rheological fluid restricts the popularization of MR dampers [
13,
14]. Although many scholars have done many fruitful works on this problem [
15,
16,
17], it is difficult to achieve mass production for vehicles with MR dampers. The wide application of ER dampers depends on the research and breakthrough of ER fluid materials [
18,
19]. Compared with MR dampers, the application of ER dampers is even less in the vehicle market. Vehicles with ER dampers are still in the testing phase [
20,
21]. It can be seen that the existing semi-active suspensions with MR or ER dampers are very expensive and difficult to be popularized.
The hydraulic damper has become the most widely used in suspension systems of various vehicles [
22]. It has simple structure, reliable performance, and relatively low price. Thus, it is very popular with vehicle manufacturers. In recent years, scholars have paid more attention to it. Moreover, a broad variety of controllable hydraulic dampers were developed based on the traditional hydraulic damper. For all controllable hydraulic dampers, a fatal shortcoming exists. Their dynamic response is slower than that of MR dampers and ER dampers [
23]. Because of this shortcoming, the vibration isolation effect of the vehicle suspension with controllable hydraulic dampers is not ideal. The existing real-time control strategy, i.e., the skyhook control [
24], is not very applicable to controllable hydraulic dampers. Thus, in the previous work [
25], we developed an optimal damping ratio control method based on road statistical properties. Moreover, we validated its effectiveness. Because this method is essentially based on statistical theory, it does not need the rapid response characteristics of controllable hydraulic dampers. However, it needs the road condition information.
The existing road condition identification methods are hard to realize and the cost is relatively high, which has a certain effect on the application of semi-active suspensions. At present, related vehicle experts and scholars have carried out many works on the model and method of road identification. The existing identification methods of road conditions are mainly based on video cameras, acoustic sensing devices, and so on. Usually, they also need certain complex control algorithms. Their reliability, real-time, and implementation cost have some limits in application. The representative research works are as follows: Jokela et al. used stereo cameras to monitor road conditions [
26]; Nomura et al. used acoustic equipment to measure the tire noise and identified the road condition by a neural network [
27]; Alonso et al. proposed an identification method based on a noise sensor and the support vector machine technology [
28]; Paulo et al. comprehensively used probability statistics and neural network to identify road types [
29]; Brooks et al. identified the unpaved roads by remote sensing technologies [
30]; and Liu et al. monitored the road levels through the engine speed [
31]. These works play a role in promoting the realization of road identification technologies. However, at present, there are few studies focusing on road condition identification methods that are simple and reliable, and easy to implement at low cost.
To reduce the product cost of semi-active suspensions, this paper proposes a new hydraulic semi-active suspension system based on road statistical properties and creates a feasible identification method of road conditions. To verify the effectiveness of the identification method, a road test was carried out. The main contributions are as follows:
(1) A new hydraulic semi-active suspension based on road statistical properties was proposed and its working process was given in details.
(2) The road identification method for the new hydraulic semi-active suspension was created and validated by road test.
2. New Hydraulic Semi-Active Suspension
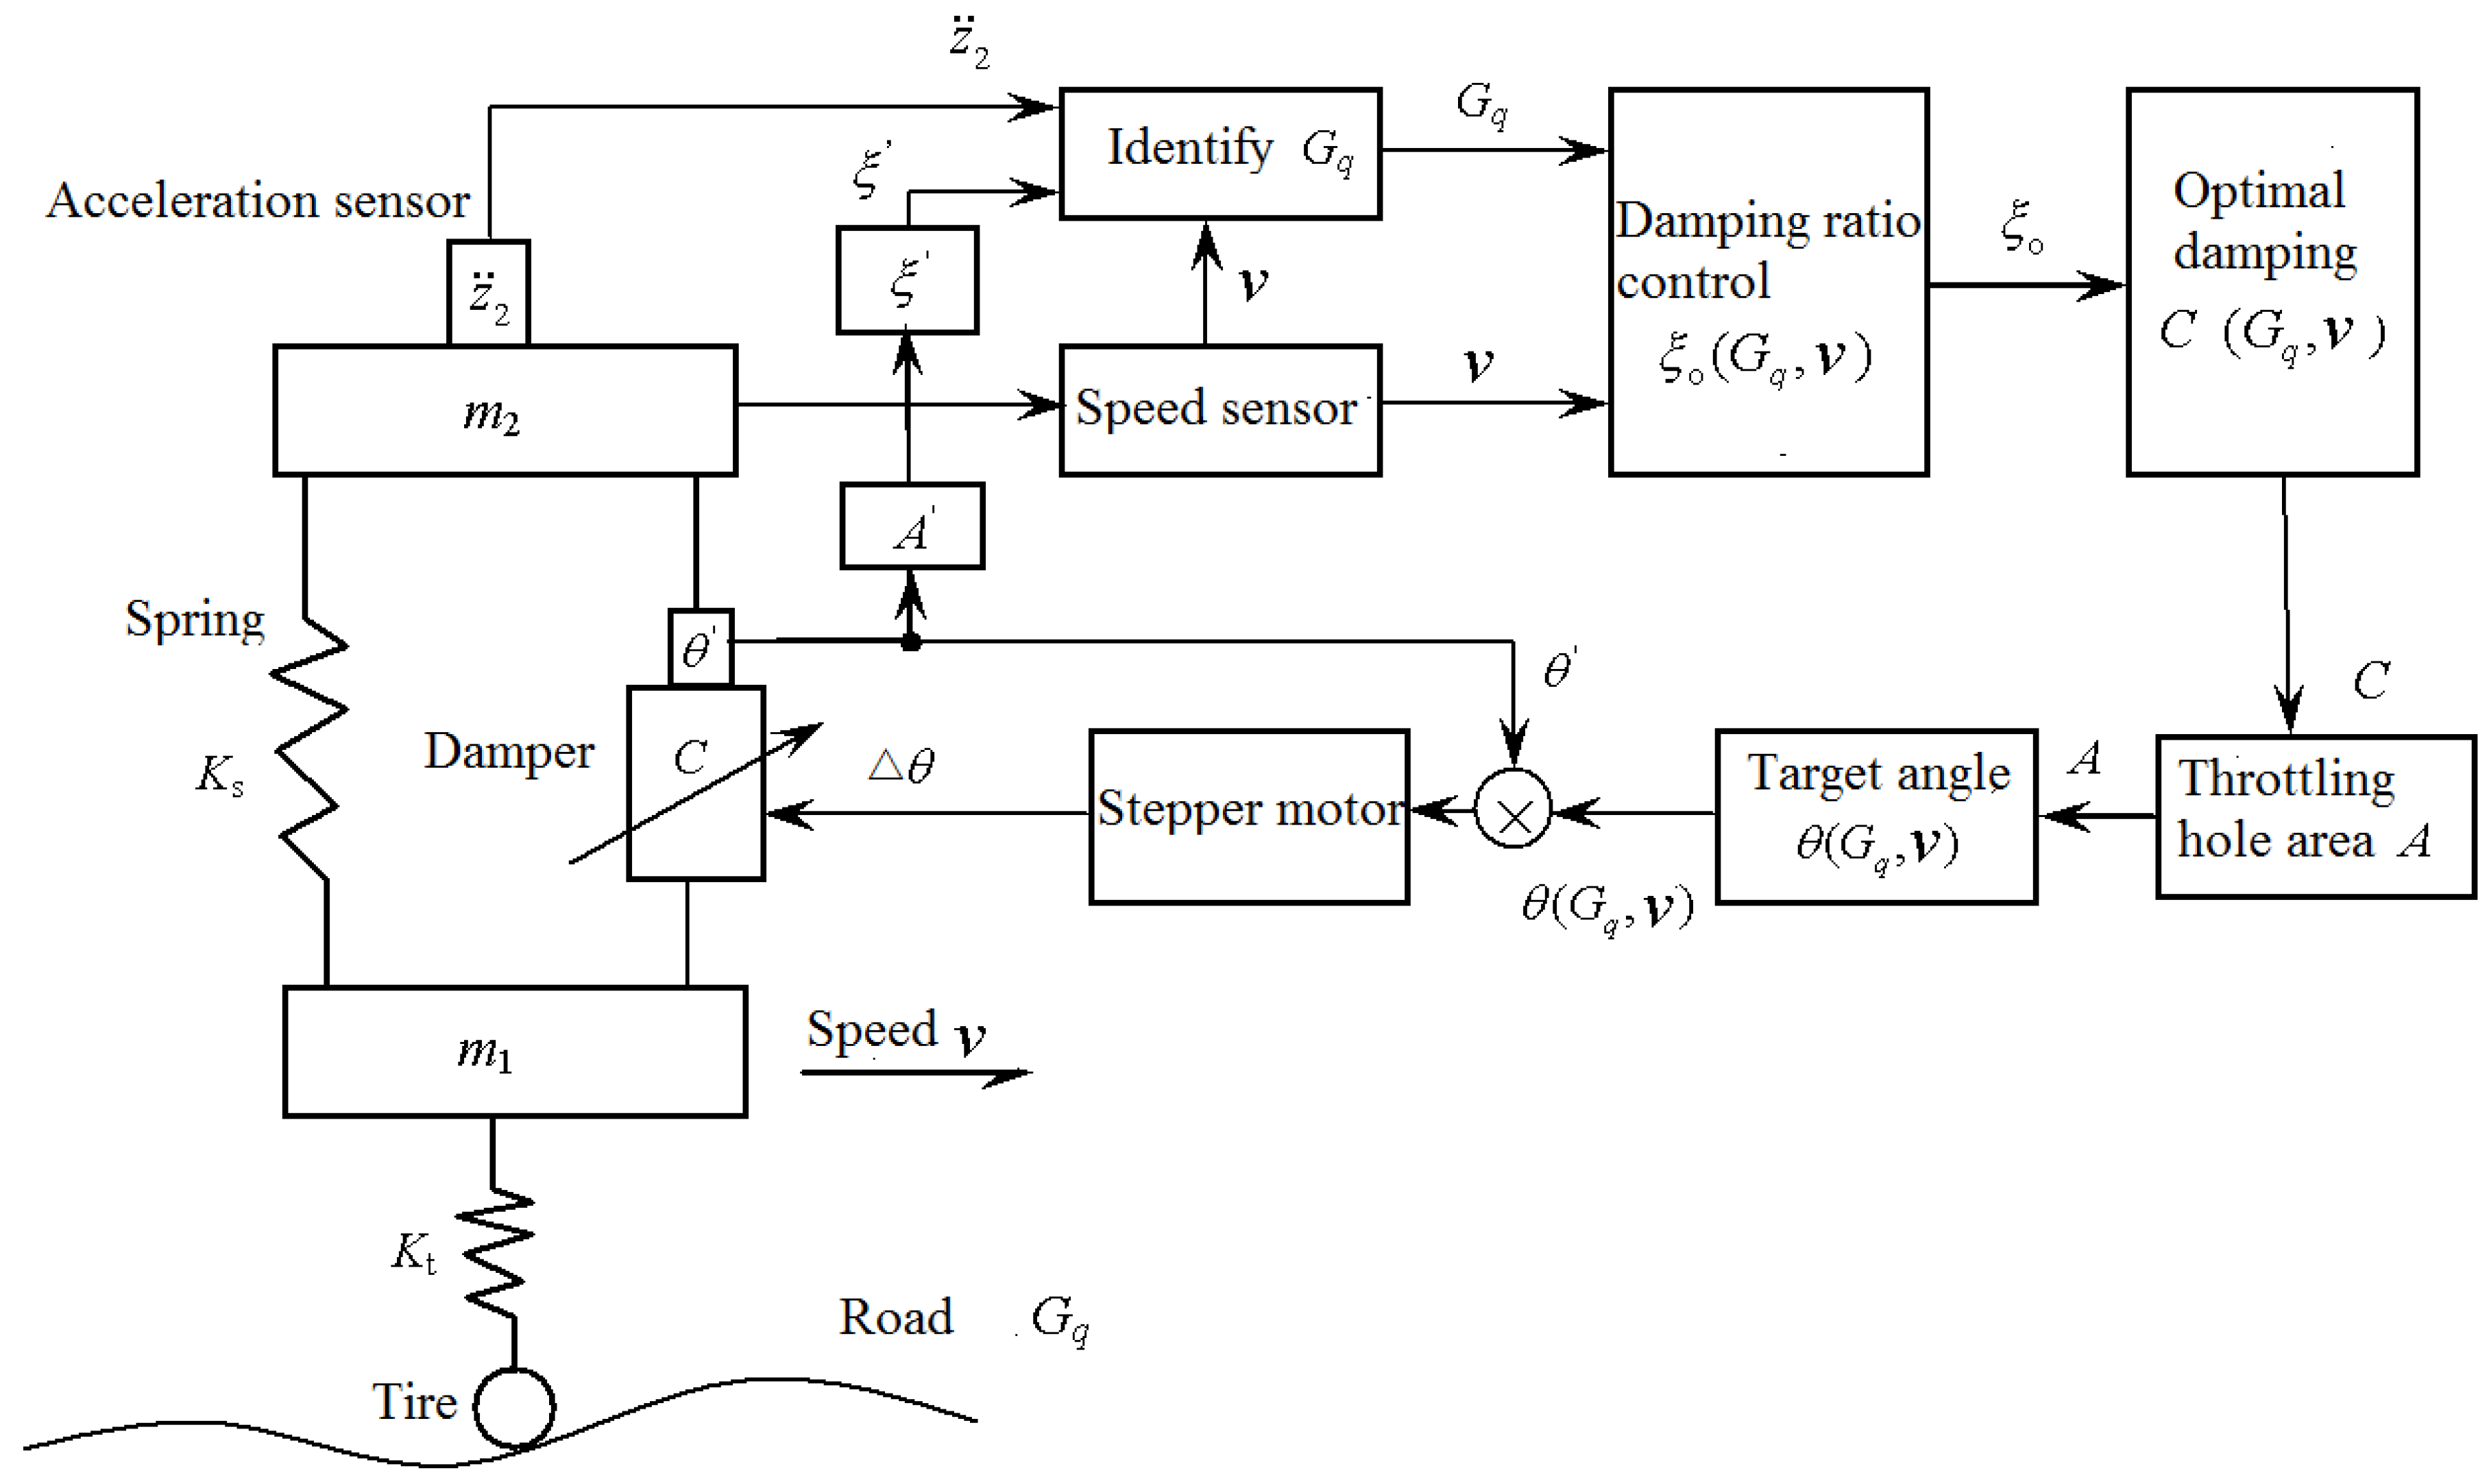
Many suspensions for vehicles are equipped with hydraulic dampers with adjustable damping characteristics, for example, setting up three grades: “soft”, “moderate”, and “hard”. They are usually called the shift-selected semi-active suspension system. Their use relies on the driver’s road perception during a period for vehicles under changing conditions. According to the perceived information of the road conditions, the driver chooses the reasonable position that he thinks. In essence, the driver’s road perception is mainly based on the statistical characteristics of road conditions. Thus, the basic assumption is that the road condition is constant during a limited period for the shift-selected semi-active suspension system. This paper adopts the assumption above, and then, proposes a novel hydraulic semi-active suspension system based on road statistical properties, as shown in
Figure 1.
In
Figure 1,
m2 and
m1 are sprung mass and unsprung mass, respectively;
Ks represents the spring stiffness of the suspension system;
Kt represents the tire vertical stiffness;
C represents the damping coefficient of the hydraulic damper;
q represents the road input;
Gq represents the PSD (power spectral density) of
q; and
z1 and
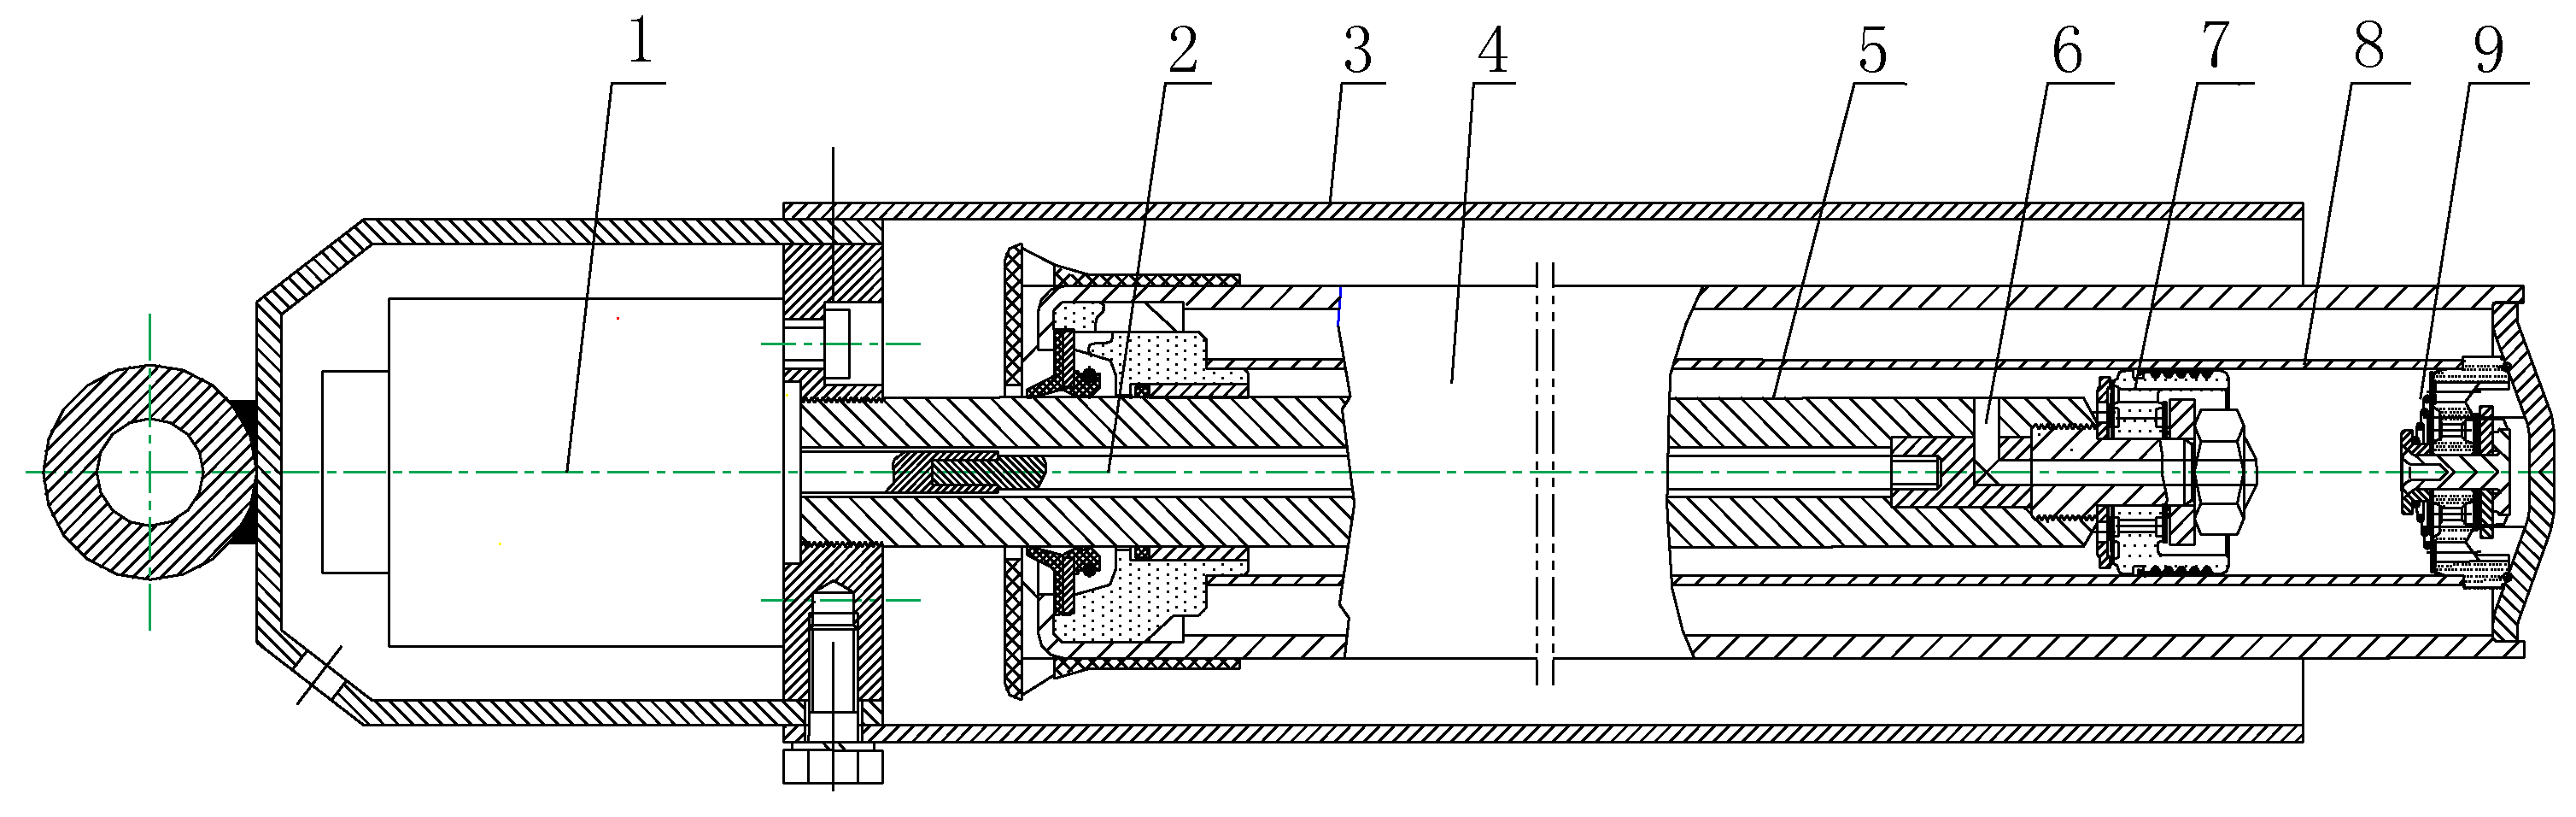
z2 are the vertical displacements of the wheel and the car body, respectively. The adopted controllable hydraulic damper is an important part of the semi-active suspension system, as shown in
Figure 2, including: (1) stepper motor; (2) core bar; (3) protective cover; (4) outer tube; (5) piston rod; (6) controllable throttle hole; (7) piston; (8) inner tube; and (9) valve seat.
The working process of the semi-active suspension system is as follows:
Step 1: Based on the measured vertical vibration acceleration of the body and the running speed v, the PSD Gq can be obtained by an identification method.
Step 2: According to and Gq, through a certain damping control method, the optimal damping ratio = (Gq, v) of the semi-active suspension system can be obtained under the current running condition.
Step 3: According to the relationship , the current optimal damping coefficient C = C(Gq, v) can be obtained.
Step 4: Based on the damper oil circuit, the relationship among the throttle hole area A, C(Gq, v), and the rotation angle θ of the stepper motor can be obtained, and then, θ = θ(Gq, v) can be calculated.
Step 5: According to θ(Gq, v) and the feedback signal measured by an angle sensor, the stepper motor rotates a certain angle △θ = θ(Gq, v) − to adjust the damper damping force.
For the working process, the road identification method in Step 1 is the key, which will be investigation in the following in details. In addition, the mentioned damping control method in Step 2 can be offline or online, for instance, the optimal damping ratio control strategy proposed in the previous work [
25]. Because the proposed suspension bases on the road statistical properties, the existing real-time control strategies [
32,
33] are not totally applicable to the proposed suspension.
3. Road Identification Method
3.1. Vehicle Vertical Acceleration Response
To create the road identification method for vehicles equipped with the proposed semi-active suspension system, the functional relationship among the vertical vibration acceleration of the body , the running speed v, the PSD Gq, the damping ratio , and other related parameters of vehicles needs to be deduced.
In
Figure 1, the motion equation of the vehicle with the proposed semi-active suspension system can be expressed as:
The Laplace transformation of Equation (1) can be expressed as:
The following auxiliary variables are introduced:
where
rk is the stiffness ratio,
rm is the mass ratio,
ω0 is the natural frequency of the car body,
λ is the frequency ratio, and
ξ is the damping ratio of the semi-active suspension system.
Substituting
into Equation (2), the frequency response function
between the vertical displacement
z2 of the car body and the road input
q can be obtained:
The frequency response function
of the vertical acceleration
of the body to the road excitation velocity
can be expressed as:
When the vehicle runs on roads with different grades, the input of the road surface spectrum can be regarded as white noise [
34], namely:
where
n0 is the reference space frequency,
, and
f =
ω/2π.
According to the vehicle random vibration theory, the mean square value of the car body vertical acceleration can be expressed as
Substituting Equations (3)–(5) into Equation (6), and using the Residue theorem, Equation (6) can be further expressed as
Equation (7) indicates that the RMS (root mean square) value of the car body vertical acceleration is related to v, Gq(n0), ω0, rk, rm, and ξ. In other words, the functional relationship among the current road condition, the vehicle response, and the vehicle parameters can be established by Equation (7). Thus, Equation (7) is the basis for establishing the road identification method.
3.2. Road Identification Model
According to Equation (7), the PSD
Gq(
n0) of the road input
q can be obtained:
In Equation (8), the running speed
v can be measured by a speed sensor; the car body vertical acceleration
can be measured by an accelerometer, and then the RMS acceleration
can be obtained by calculating
in a short time segment. Moreover, the current damping ratio
ξ’ can be obtained according to
ξ’ =
ξ’(
θ’), where the feedback signal
θ’ can be measured by an angle sensor. The relationship
ξ’ =
ξ’(
θ’) is deduced in
Section 3.3.
The analysis results show that using the vehicle parameters ω0, rk, rm, the speed signal v, the stepper motor feedback signal θ’, and the body vertical acceleration signal , the PSD Gq(n0) for the vehicle under current running condition can be calculated using Equation (8). Thus, the current running condition can be identified based on Equation (8).
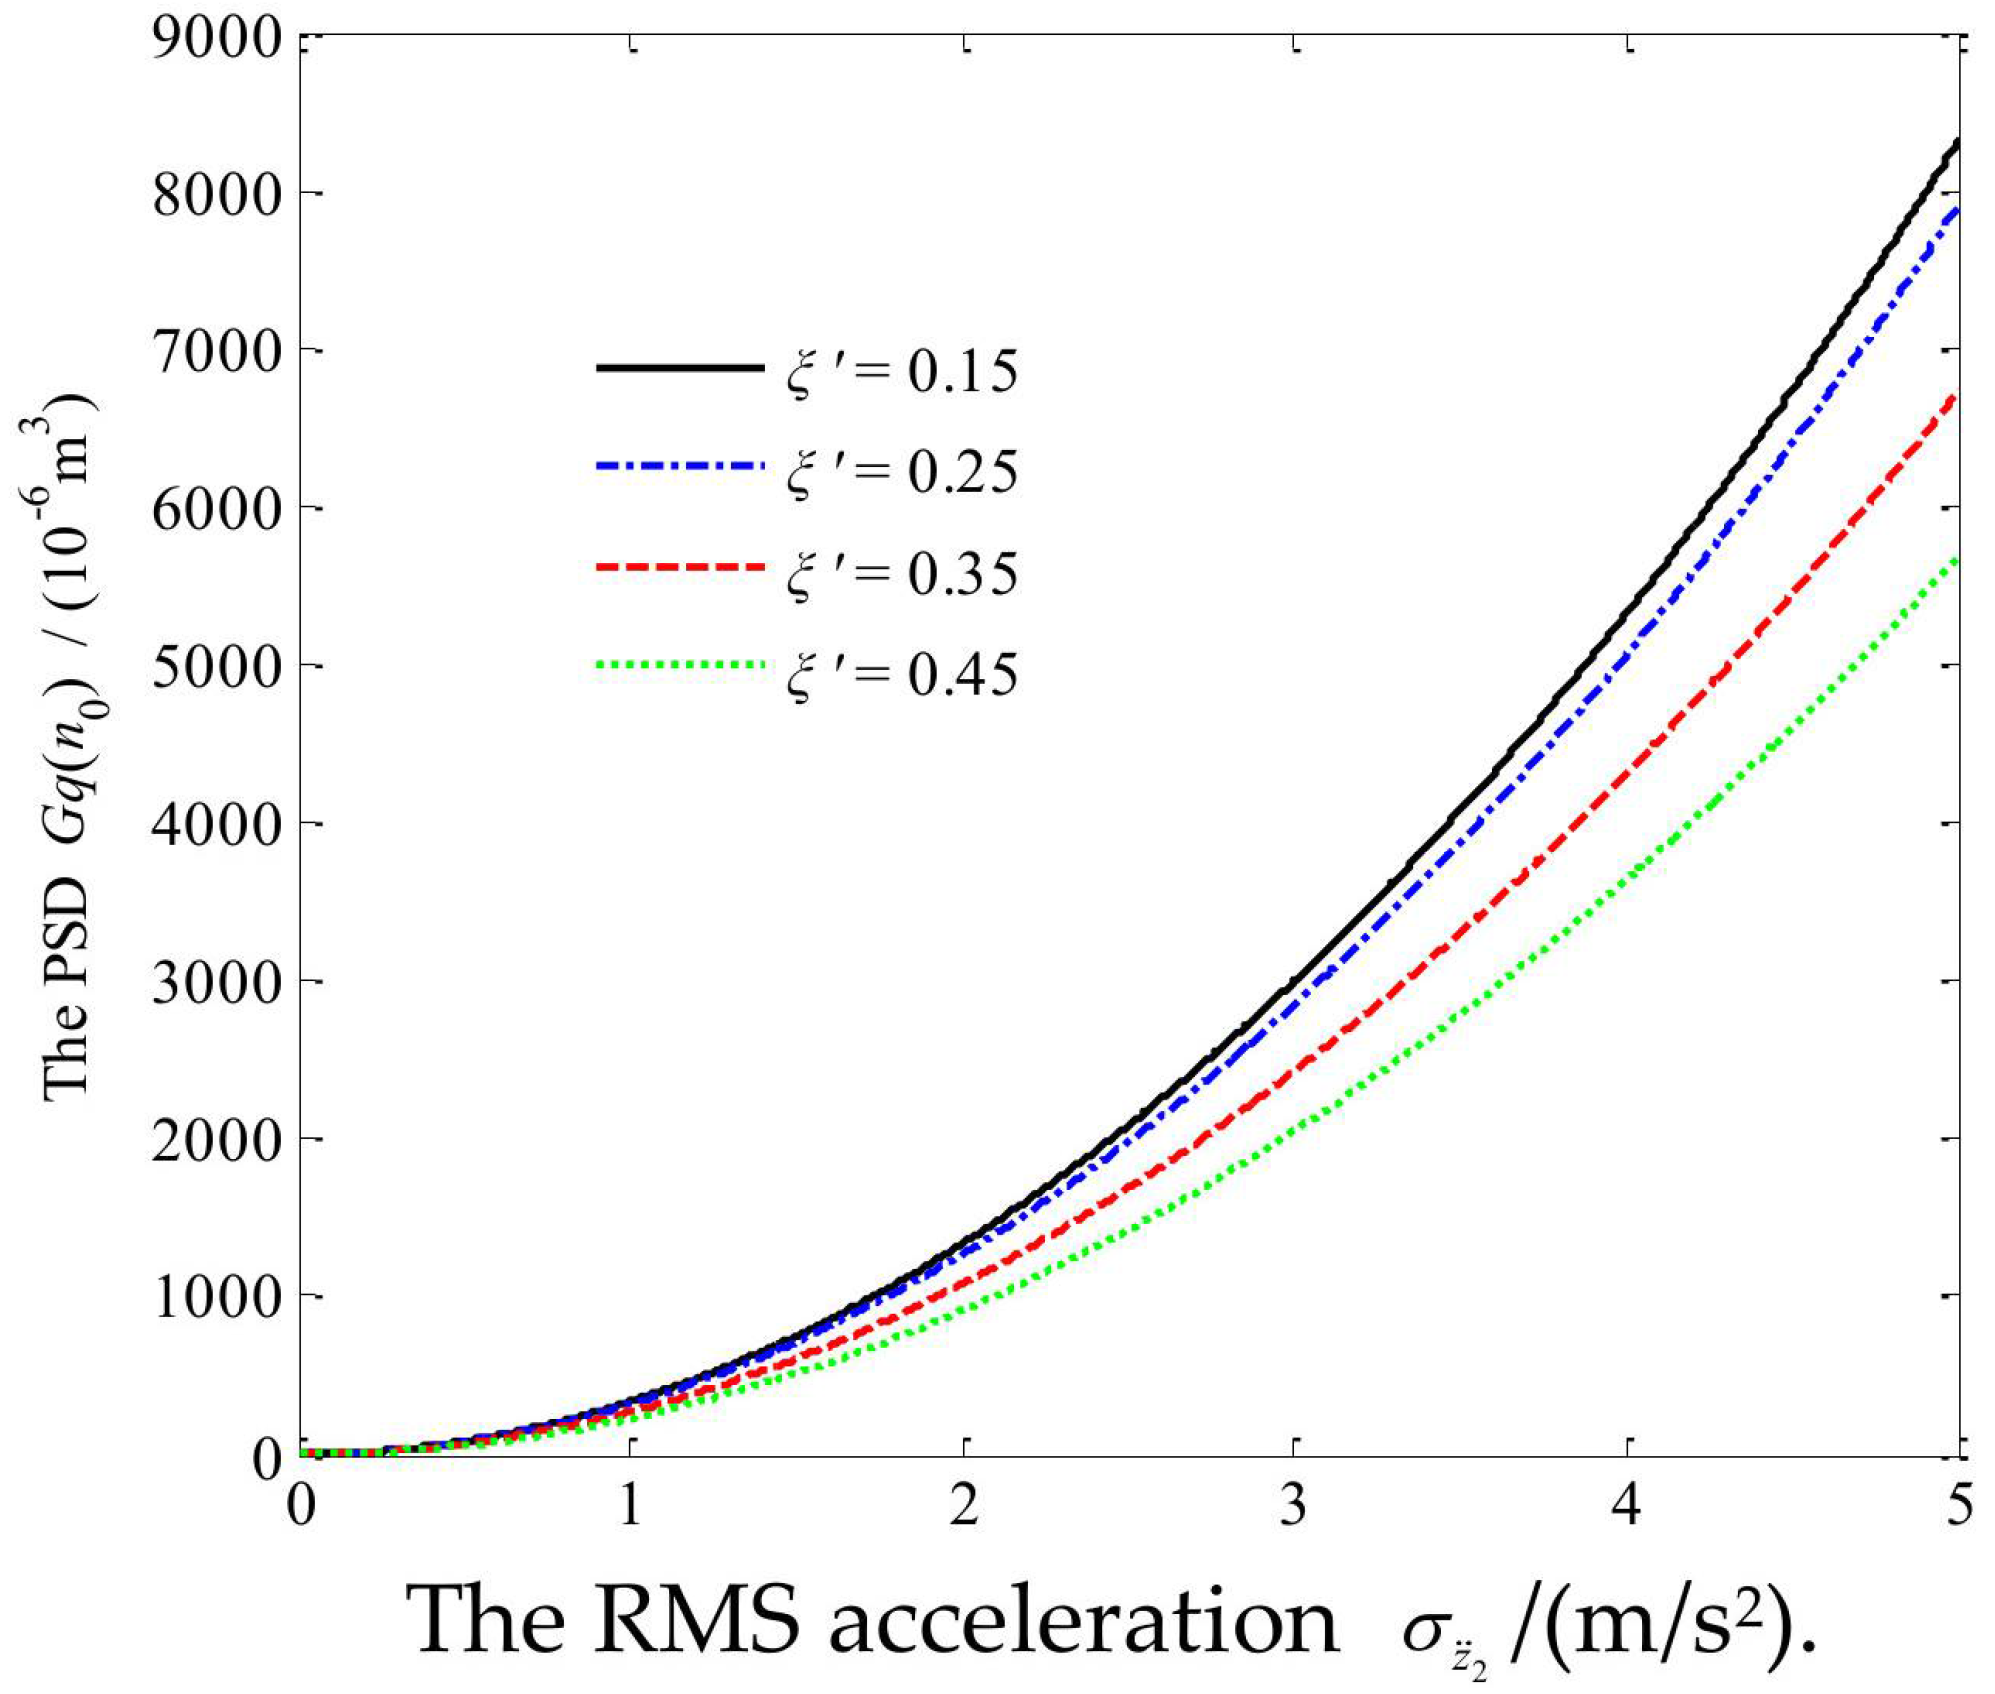
For example, the parameters of a car are as follows:
m2 = 301.6 kg,
m1 = 35 kg,
Ks = 19,300 N/m, and
Kt = 189 kN/m. When the car runs under different road conditions with
v = 60 km/h, the current damping ratio
ξ’ equals 0.15, 0.25, 0.35, and 0.45, respectively. The curve of the PSD
Gq(
n0) vs. the RMS acceleration
can be obtained, as shown in
Figure 3.
3.3. Acquisition Method of the Current Damping Ratio ξ’
According to Equation (8), it can be seen that, to accurately identify the current road conditions, the relationship ξ’ = ξ’(θ’) between the current damping ratio ξ’ and the feedback signal θ’ must be established.
According to the structure of the controllable hydraulic damper shown in
Figure 2, the throttling hole area
A’ can be expressed as [
35]
where
r is the radius of the orifice hole and
R is the outer radius of the rotary shaft.
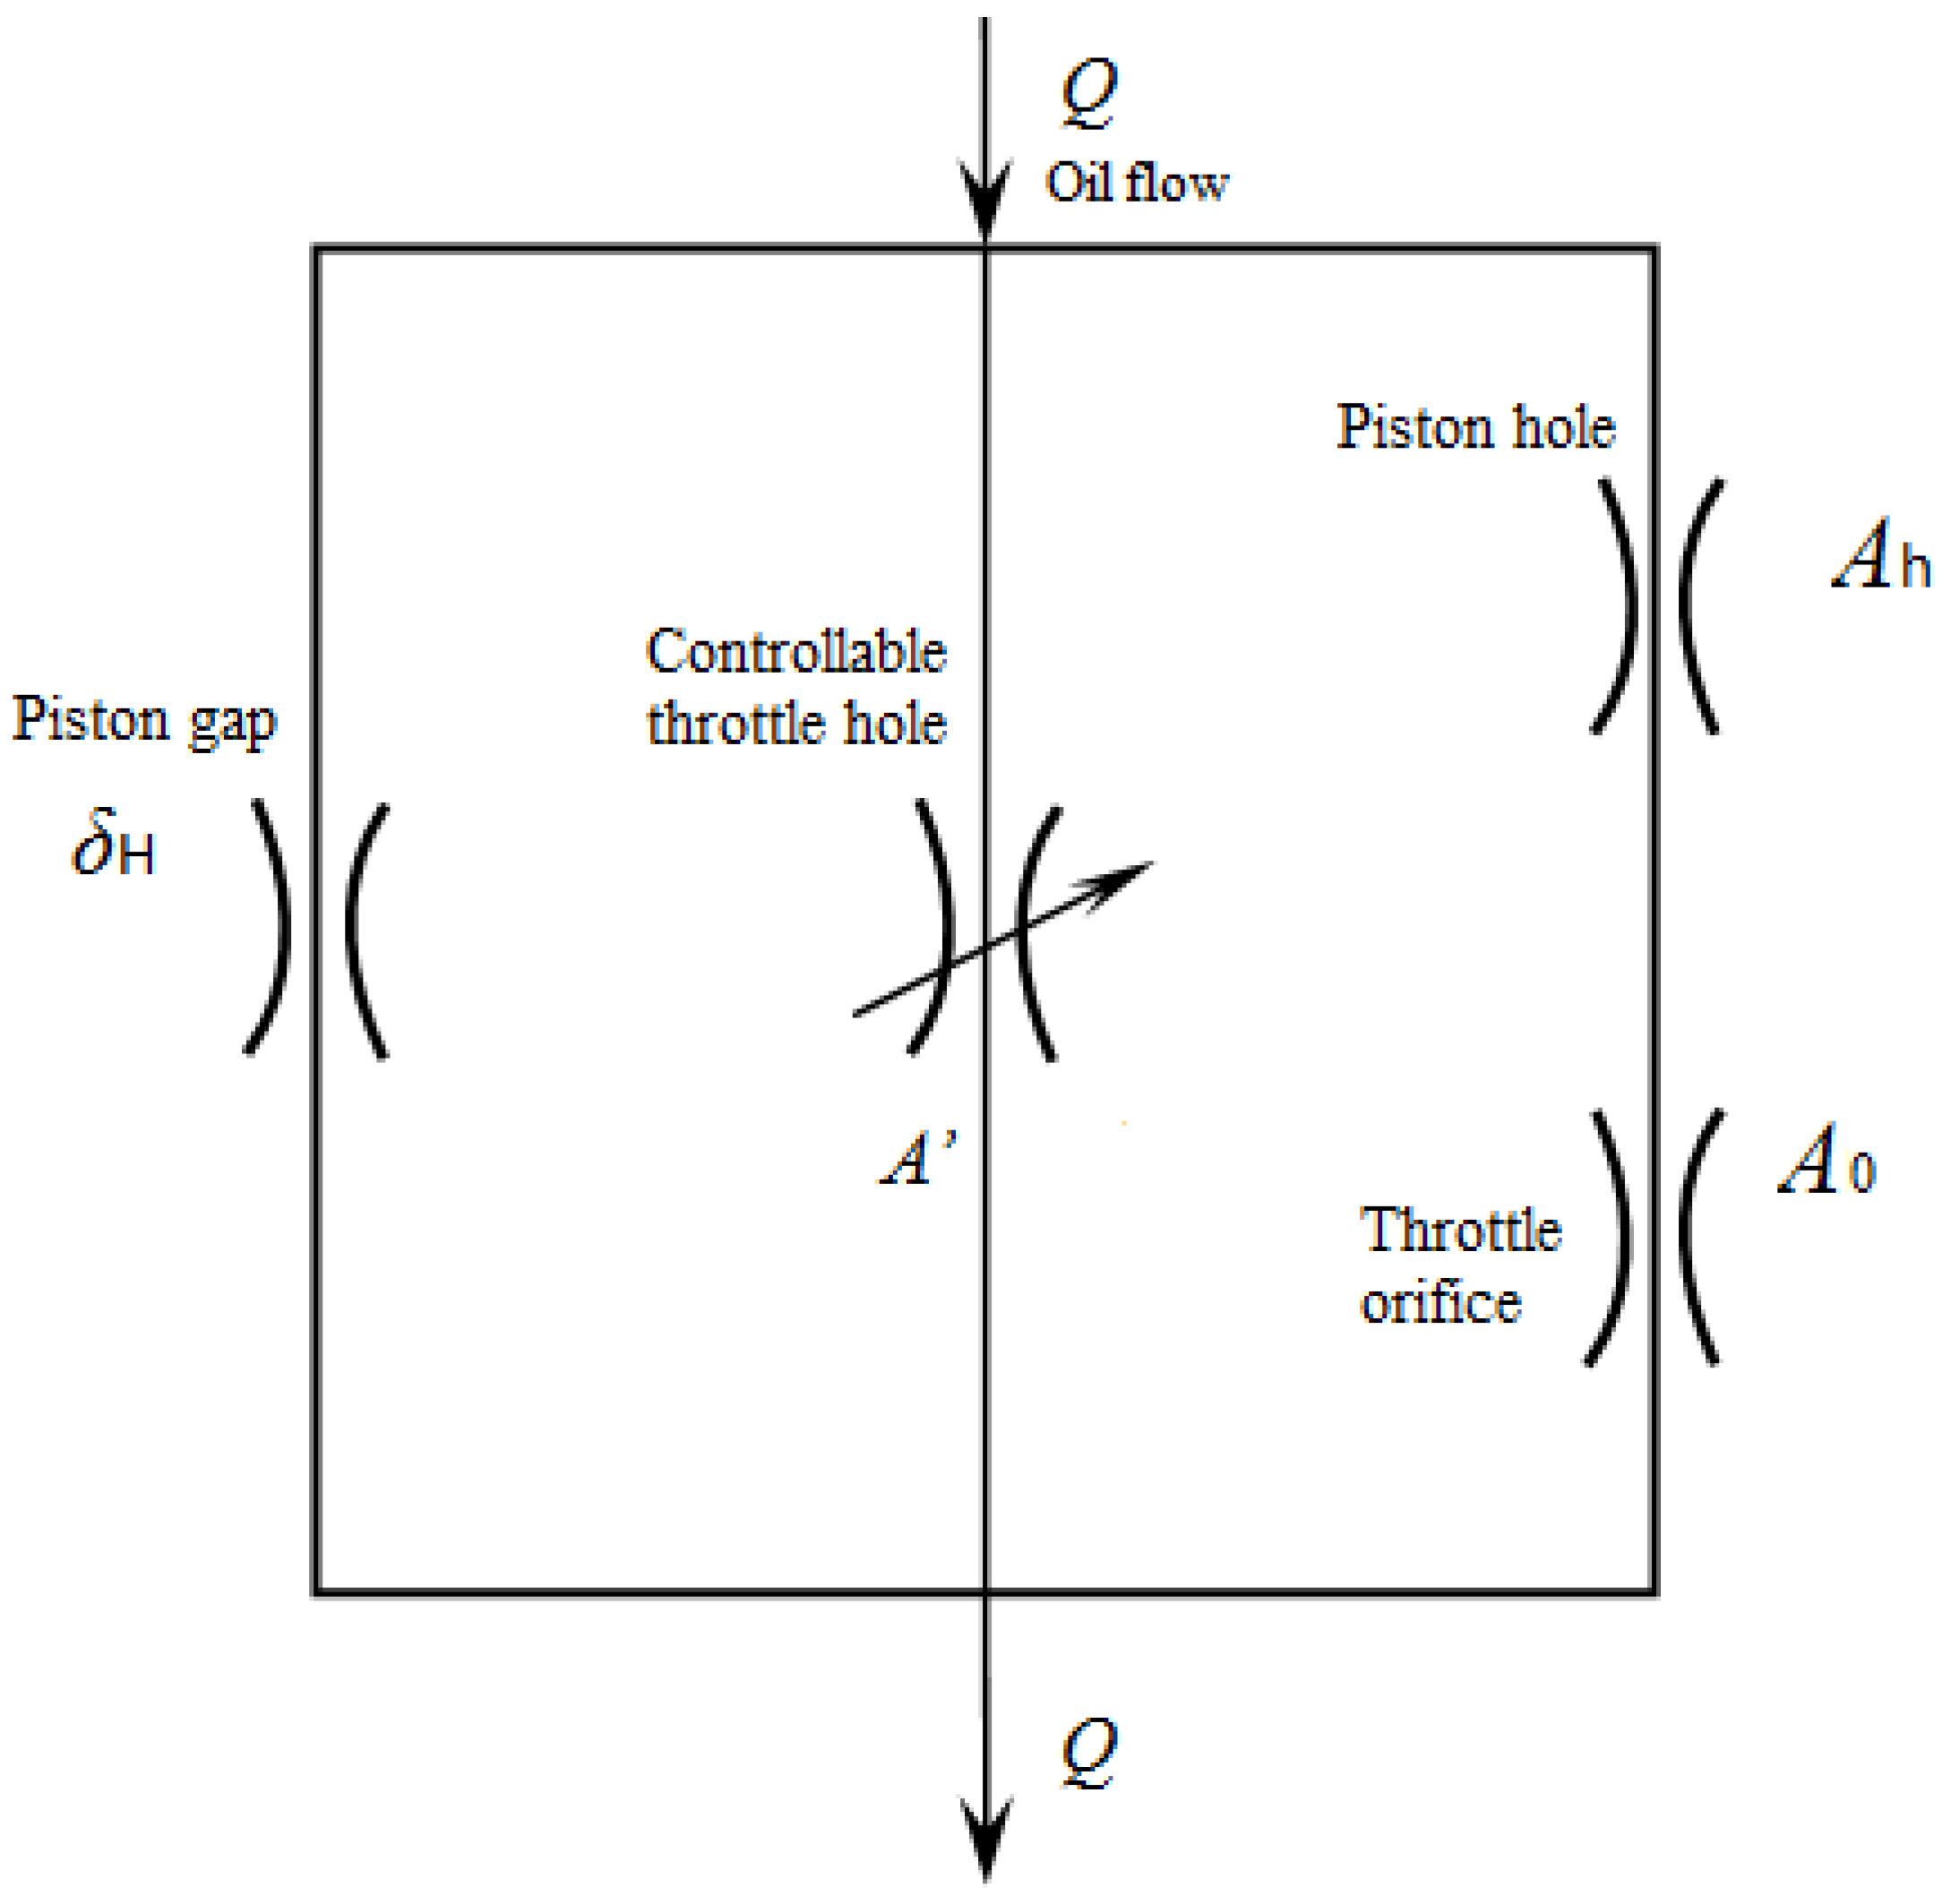
The oil path of the damper recovery valve is shown in
Figure 4. When the oil flows through the throttle orifice, the piston hole, the piston gap, and the controllable throttle hole, the damping force is produced.
In
Figure 4, the piston hole and the throttle orifice are in series; moreover, the whole of them is in parallel with the piston gap and the controllable throttle hole. Thus, the throttle pressure
p0 of the throttle orifice can be expressed as [
35]
where
,
is the throttle orifice area,
is the flow coefficient of the throttle orifice,
is the oil density,
is the number of piston holes,
is the piston hole diameter,
is the equivalent length of the piston hole.
According to the oil continuity theorem, it can be obtained [
35]
where
is the flow coefficient of the controllable throttle hole,
is the inner diameter of the damper cylinder,
is the length of the piston gap,
is the mean value of the piston gap,
is the piston eccentricity,
is the oil kinetic viscosity,
is the throttle pressure of the piston gap, and
V is the working velocity of the damper.
Substituting Equation (10) into Equation (11) obtains the following:
where
,
,
, and
.
Solving Equation (12),
pH can be obtained. According to the calculated
pH, the current damping coefficient
C can be obtained as
where
Sr is the annular area between the piston cylinder and the piston rod.
According to the damping coefficient C, the damper installation lever ratio i, the installation angle α, the sprung mass m2, and the suspension stiffness Ks, the current damping ratio of the semi-active suspension system can be obtained as
From the derivation process of Equation (14), it can be seen that
ξ’ is related to
A’, thus
ξ’ =
ξ’(
A’). According to Equation (9),
A’ =
A’(
θ’). Thus,
ξ’ can be expressed as the function of
θ’, namely:
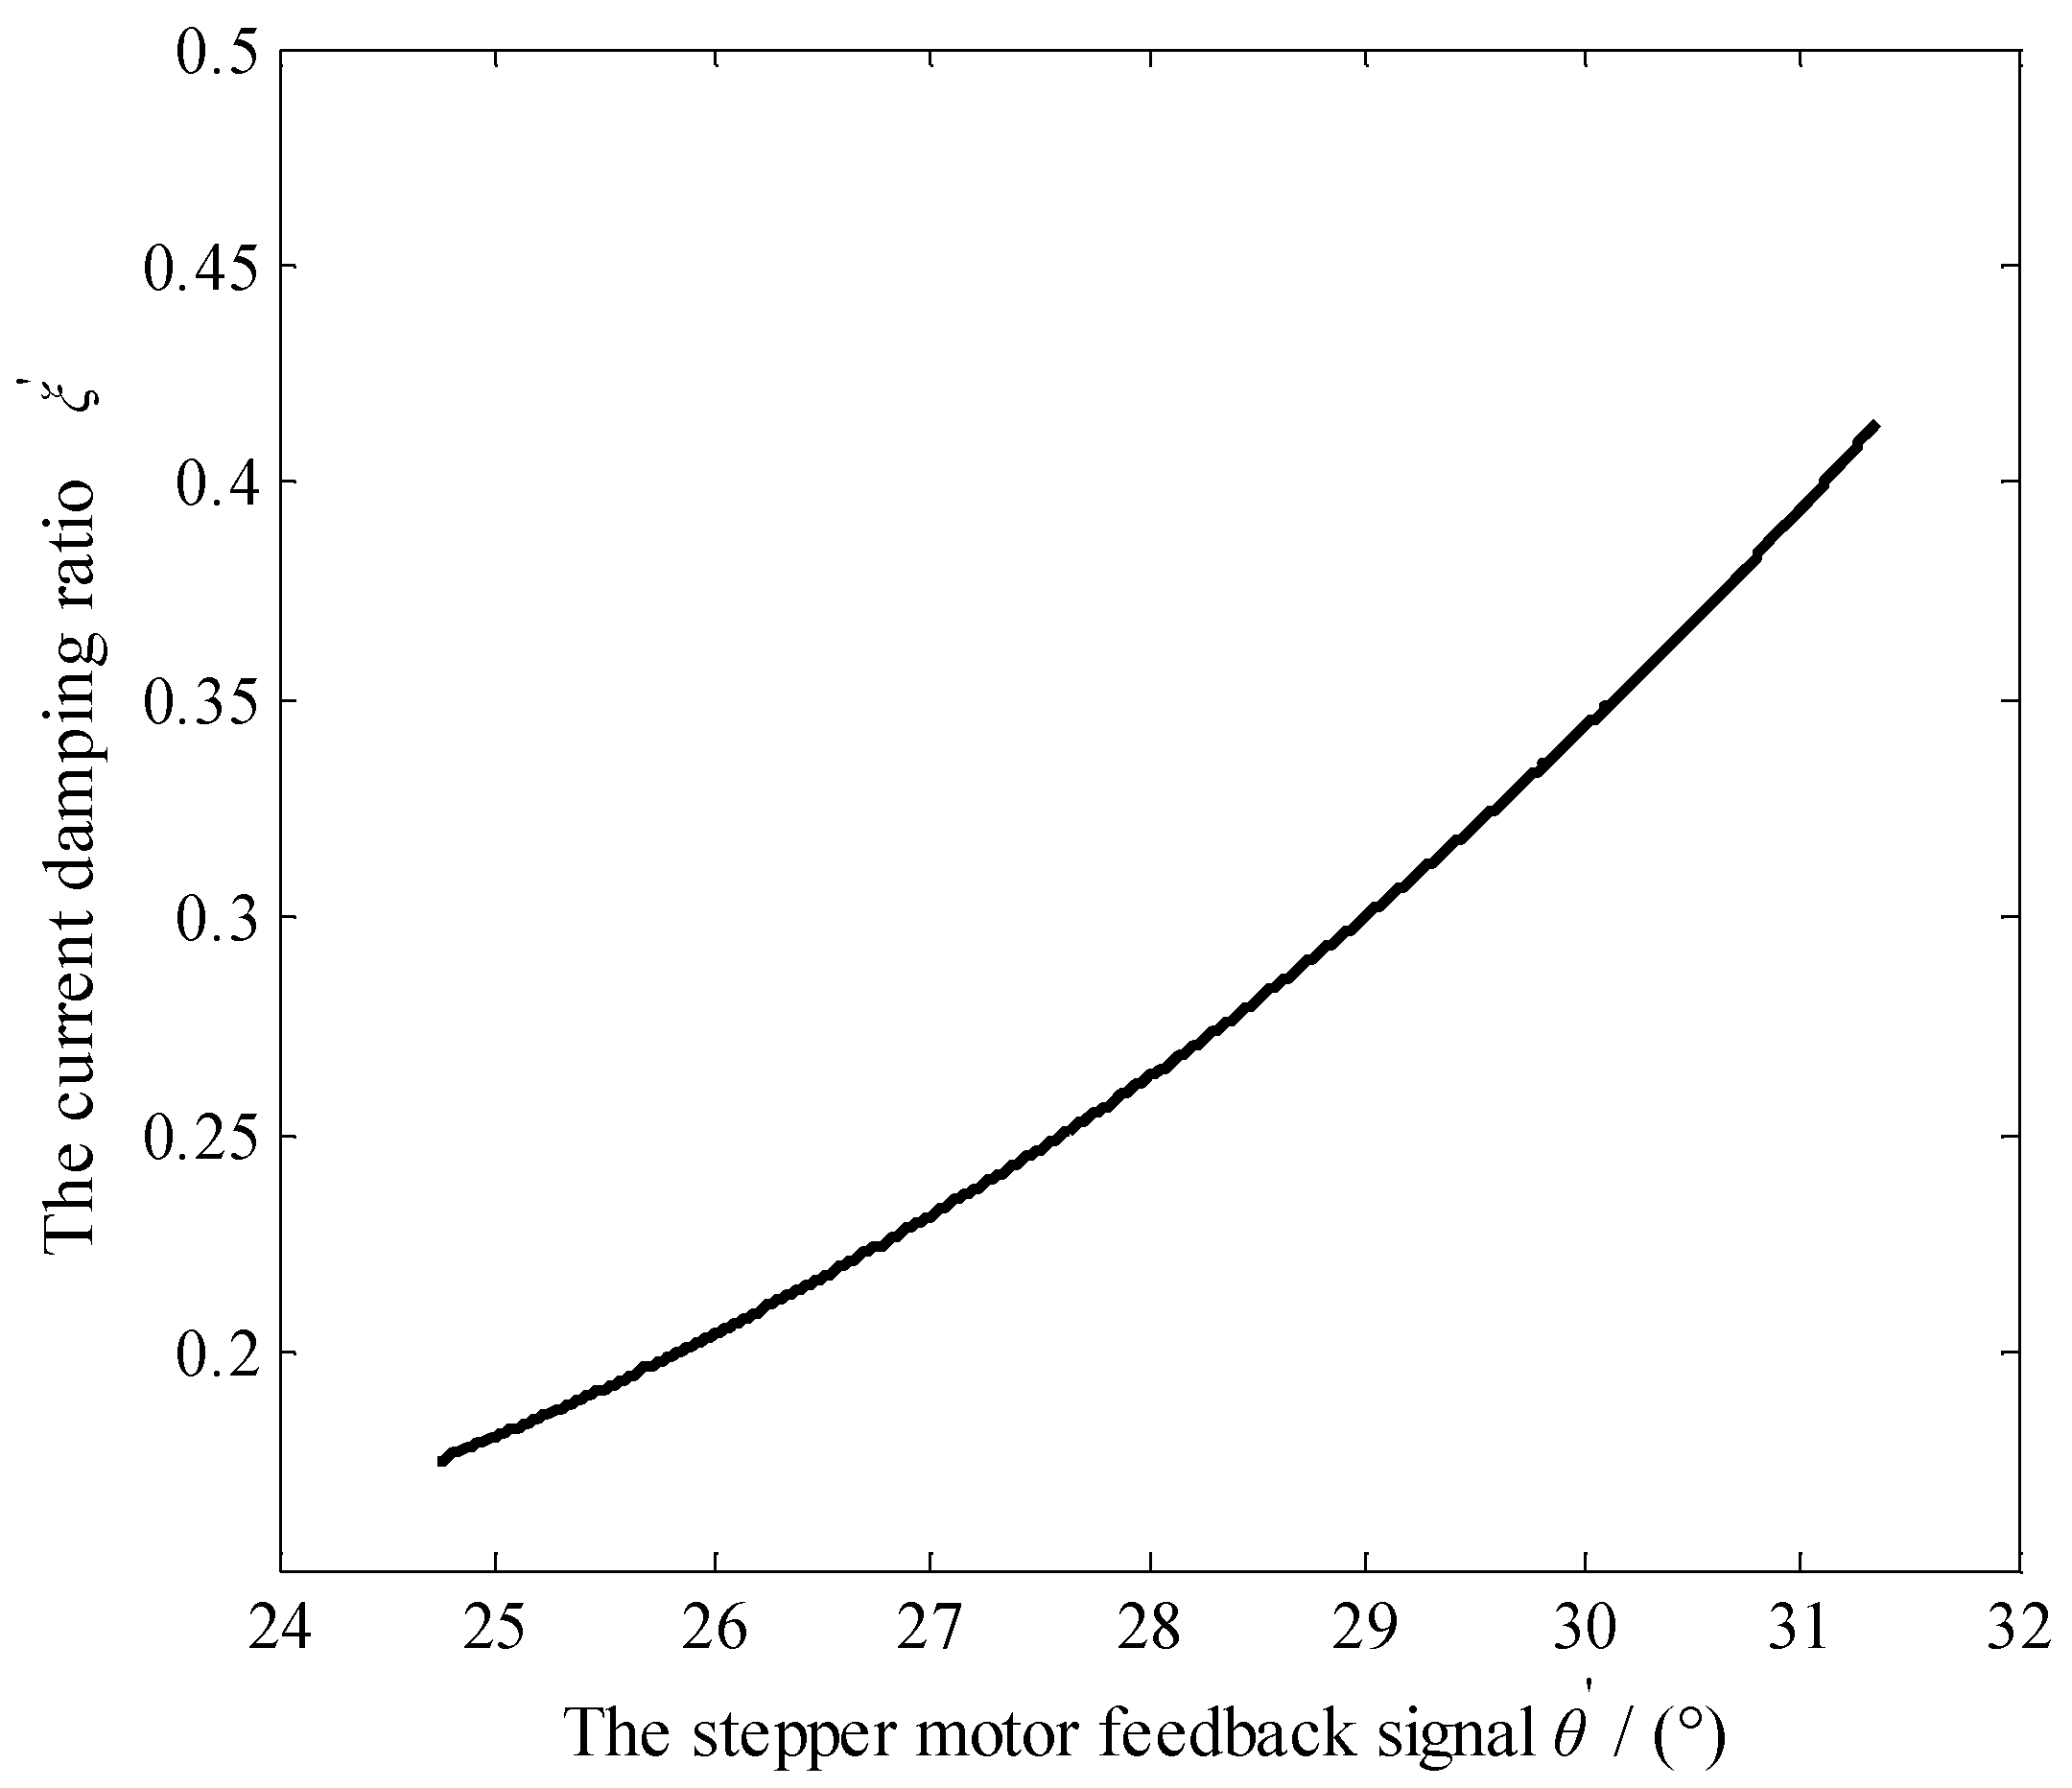
According to Equation (15), the current damping ratio
ξ’ can be acquired based on the feedback signal
θ’. For example, the radius of the orifice hole
r = 1.0 mm, the outer radius of the rotary shaft
R = 4.0 mm, the curve of the current damping ratio
ξ’ vs. the stepper motor feedback signal
θ’ can be depicted in
Figure 5.
4. Test Verification
To verify the effectiveness of the established road identification method, the road test verification should be carried out. There will be some risks if the proposed semi-active suspension system is directly developed and the road test is done based on the system. Therefore, this study carried out the road test, adopting the method of installing different linear damping dampers for the passive suspension system of a test vehicle, instead of the proposed semi-active suspension system.
4.1. Vehicle Parameters and Their Acquisition
The parameters of the test vehicle are as follows: Long × Wide × High (4501 mm × 1704 mm × 1469 mm), the wheelbase 2604 mm, the curb weight 1115 kg, the damper installation angle α = 3.5° for the front Mcpherson suspension, the damper installation lever ratio i = 0.84, the sprung mass m2 = 301.6 kg, the unsprung mass and m1 = 30.4 kg, the spring stiffness of the suspension system Ks = 19.3 kN/m, the tire vertical stiffness Kt = 189 kN/m.
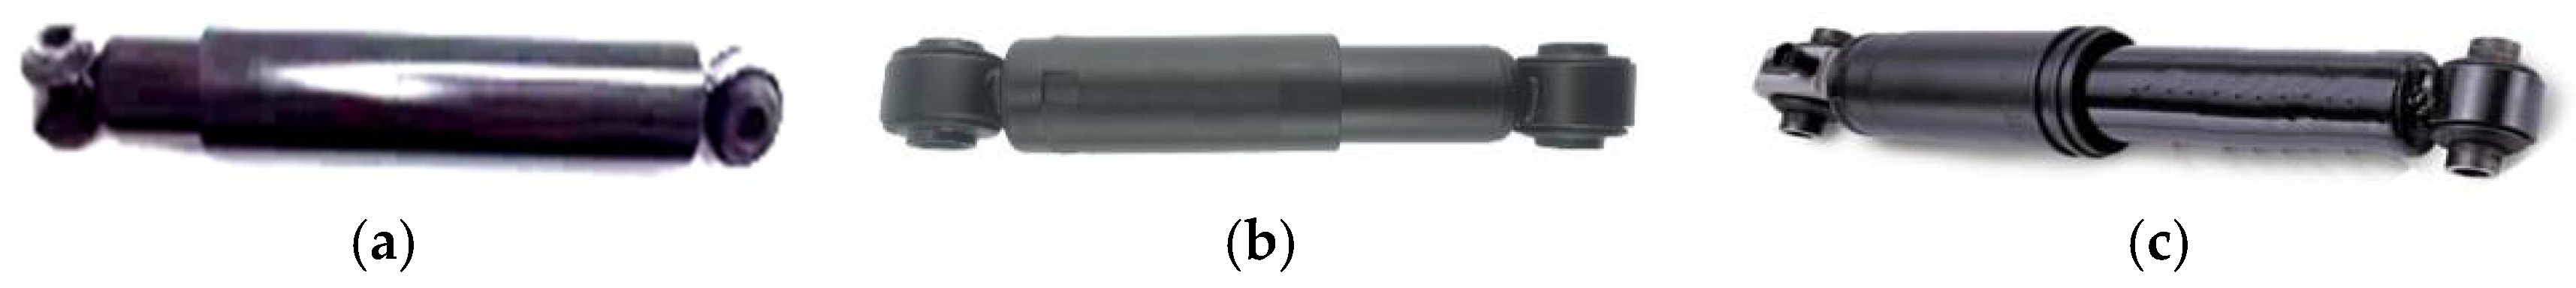
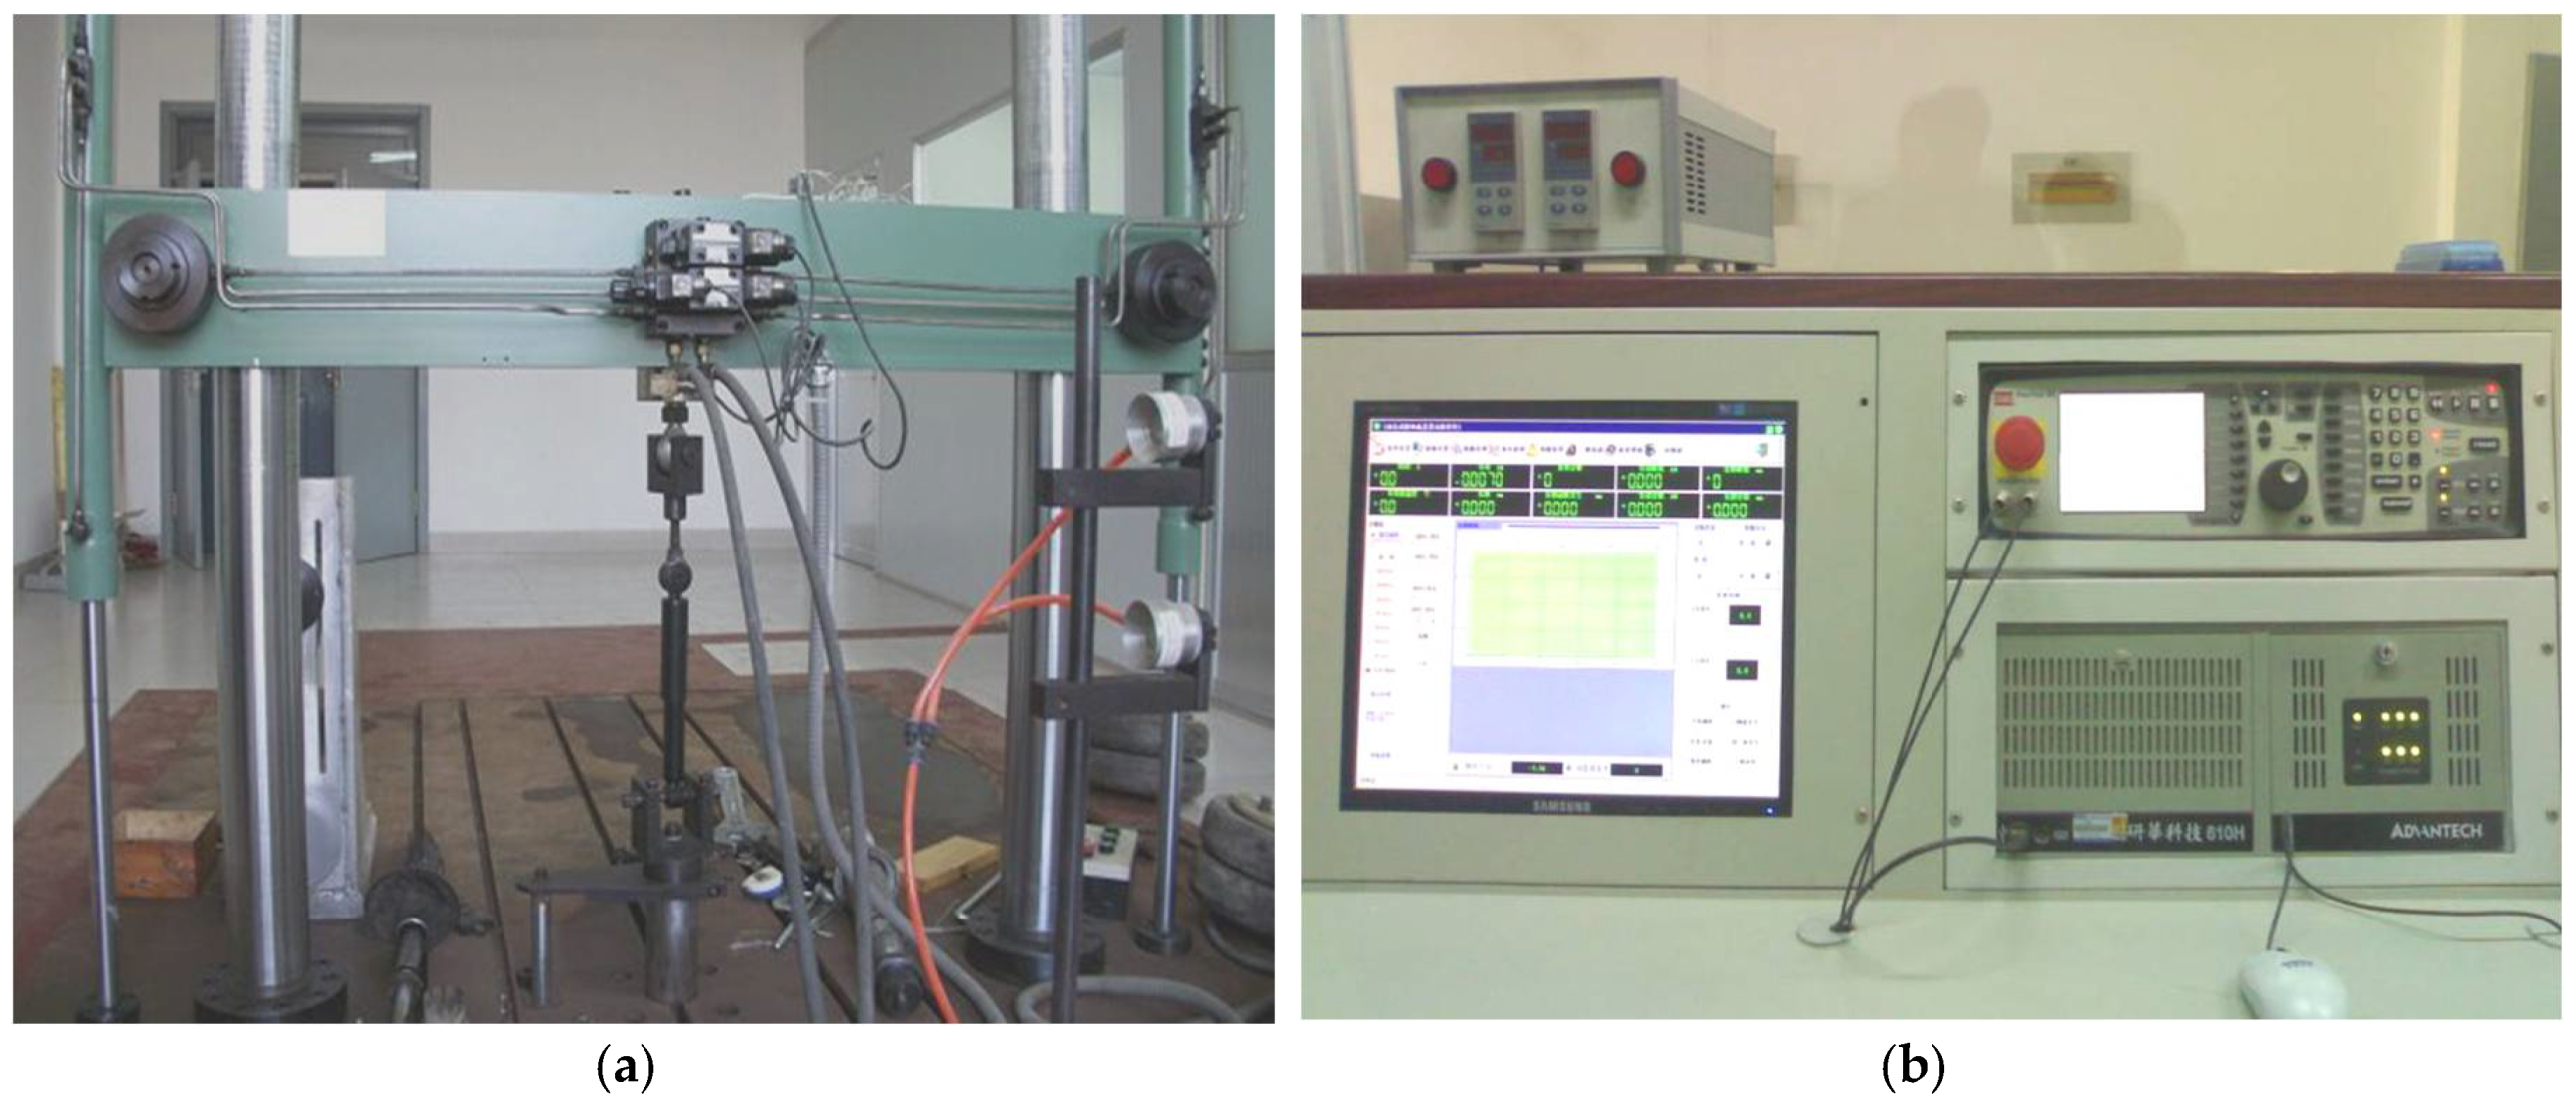
To realize three kinds of passive suspension systems with different linear damping coefficients, three hydraulic dampers on the market were selected (see
Figure 6). As shown in
Figure 7a, using the ZJS-30 hydraulic test bench produced by Changchun Test Machine Research Institute, the damping characteristic tests of the three linear damping dampers were carried out to get their damping coefficients. The master computer is shown in
Figure 7b. Using the bench test, a sine wave excitation with the amplitude 30 mm and the frequency 1.0 Hz was exerted on each damper. At the same time, the damper damping force was measured by a NS-WL1 tension–compression sensor produced by Tianmu Automation Instrument Co. Ltd. (Shanghai, China). The damper displacement was measured by a SDVG20 displacement sensor produced by Shenzhen City Technology Co. Ltd. (Shenzhen, China). The master computer automatically put out the values of the damping force
Fc under different relative velocities, as shown in
Table 1. Based on the measurement data in
Table 1, the calculated damping coefficients of the tested dampers are 1032 Ns/m, 1806 Ns/m, and 2613 Ns/m, respectively.
4.2. Road Test
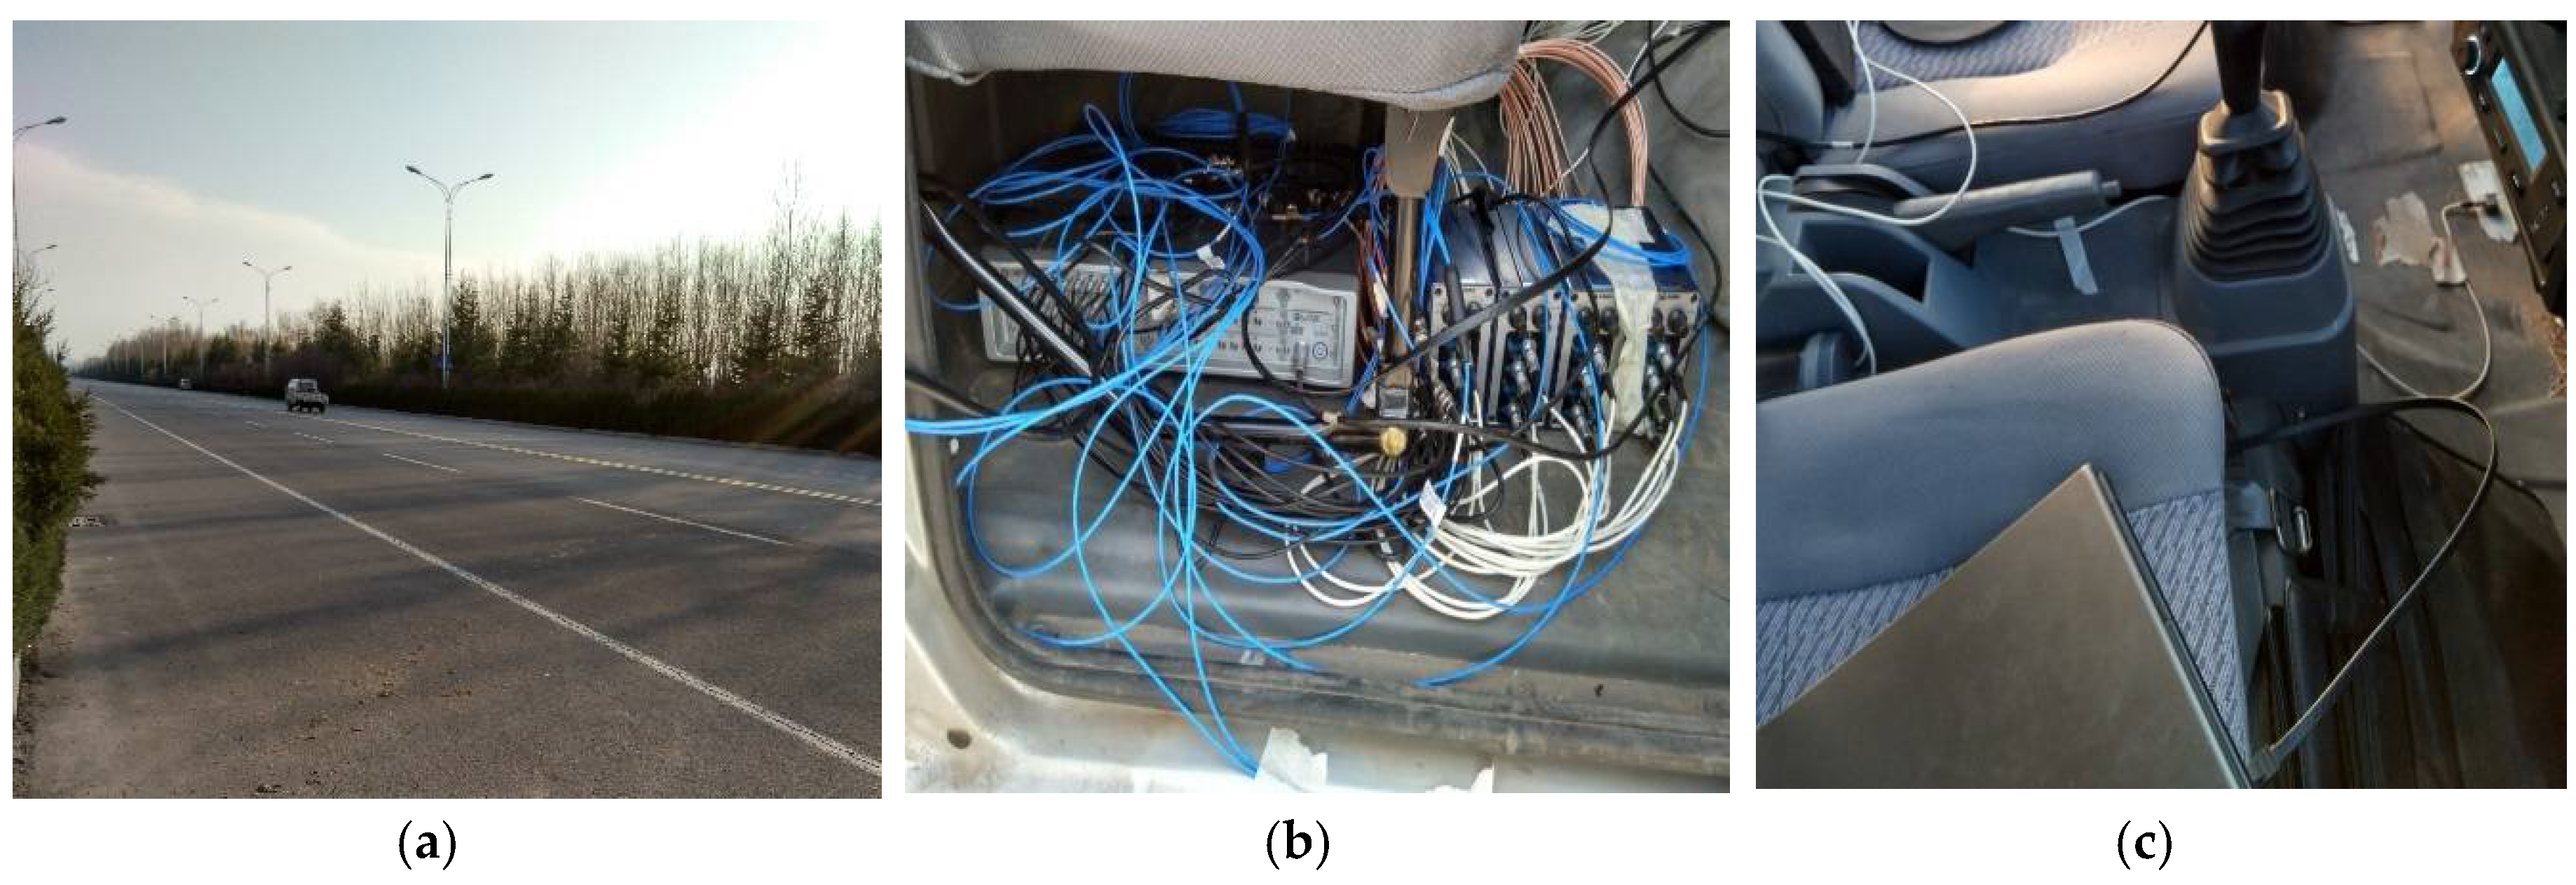
The road test was conducted in the automobile test field of Foton Automobile Co., Ltd. (Weifang, China), and the neighboring highway, as shown in
Figure 8a. The test equipment is LMS Test.Lab (LMS Company, Leuven, Belgium), as shown in
Figure 8b. The sample frequency was set as 512 Hz. Before the test, a Lance LC0173 acceleration sensor (Lance Techonogies Inc., Copley, OH, USA) was installed on the cab floor near the front suspension spring of the test vehicle, as shown in
Figure 8c. The trial road sections were selected as the highway, the cement road, and the sand road. Their lengths are 460.0 m, 615.0 m, and 1075.0 m, respectively. According to their PSD
Gq(
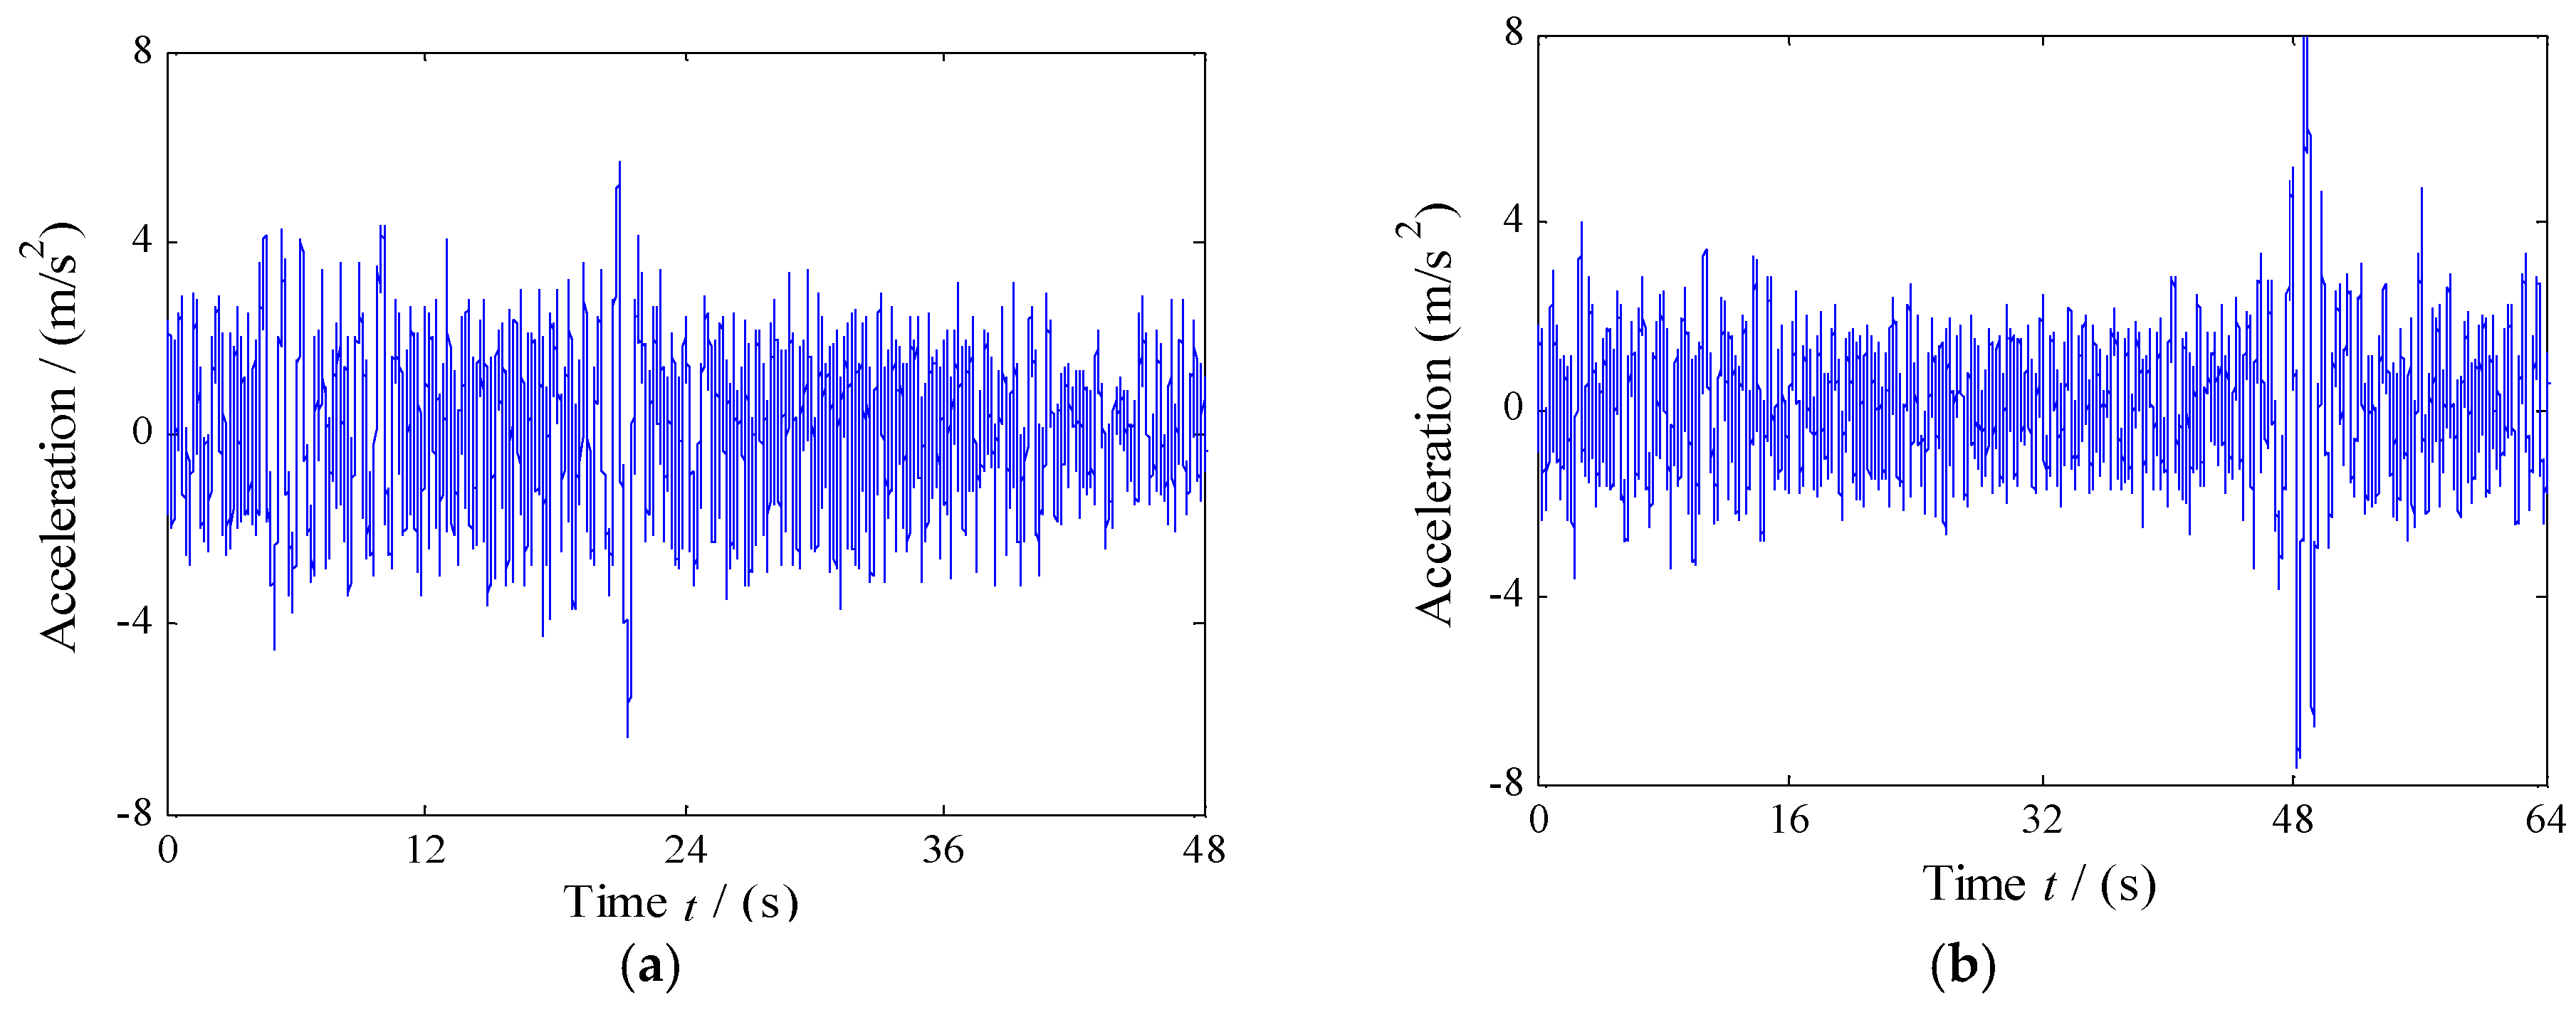
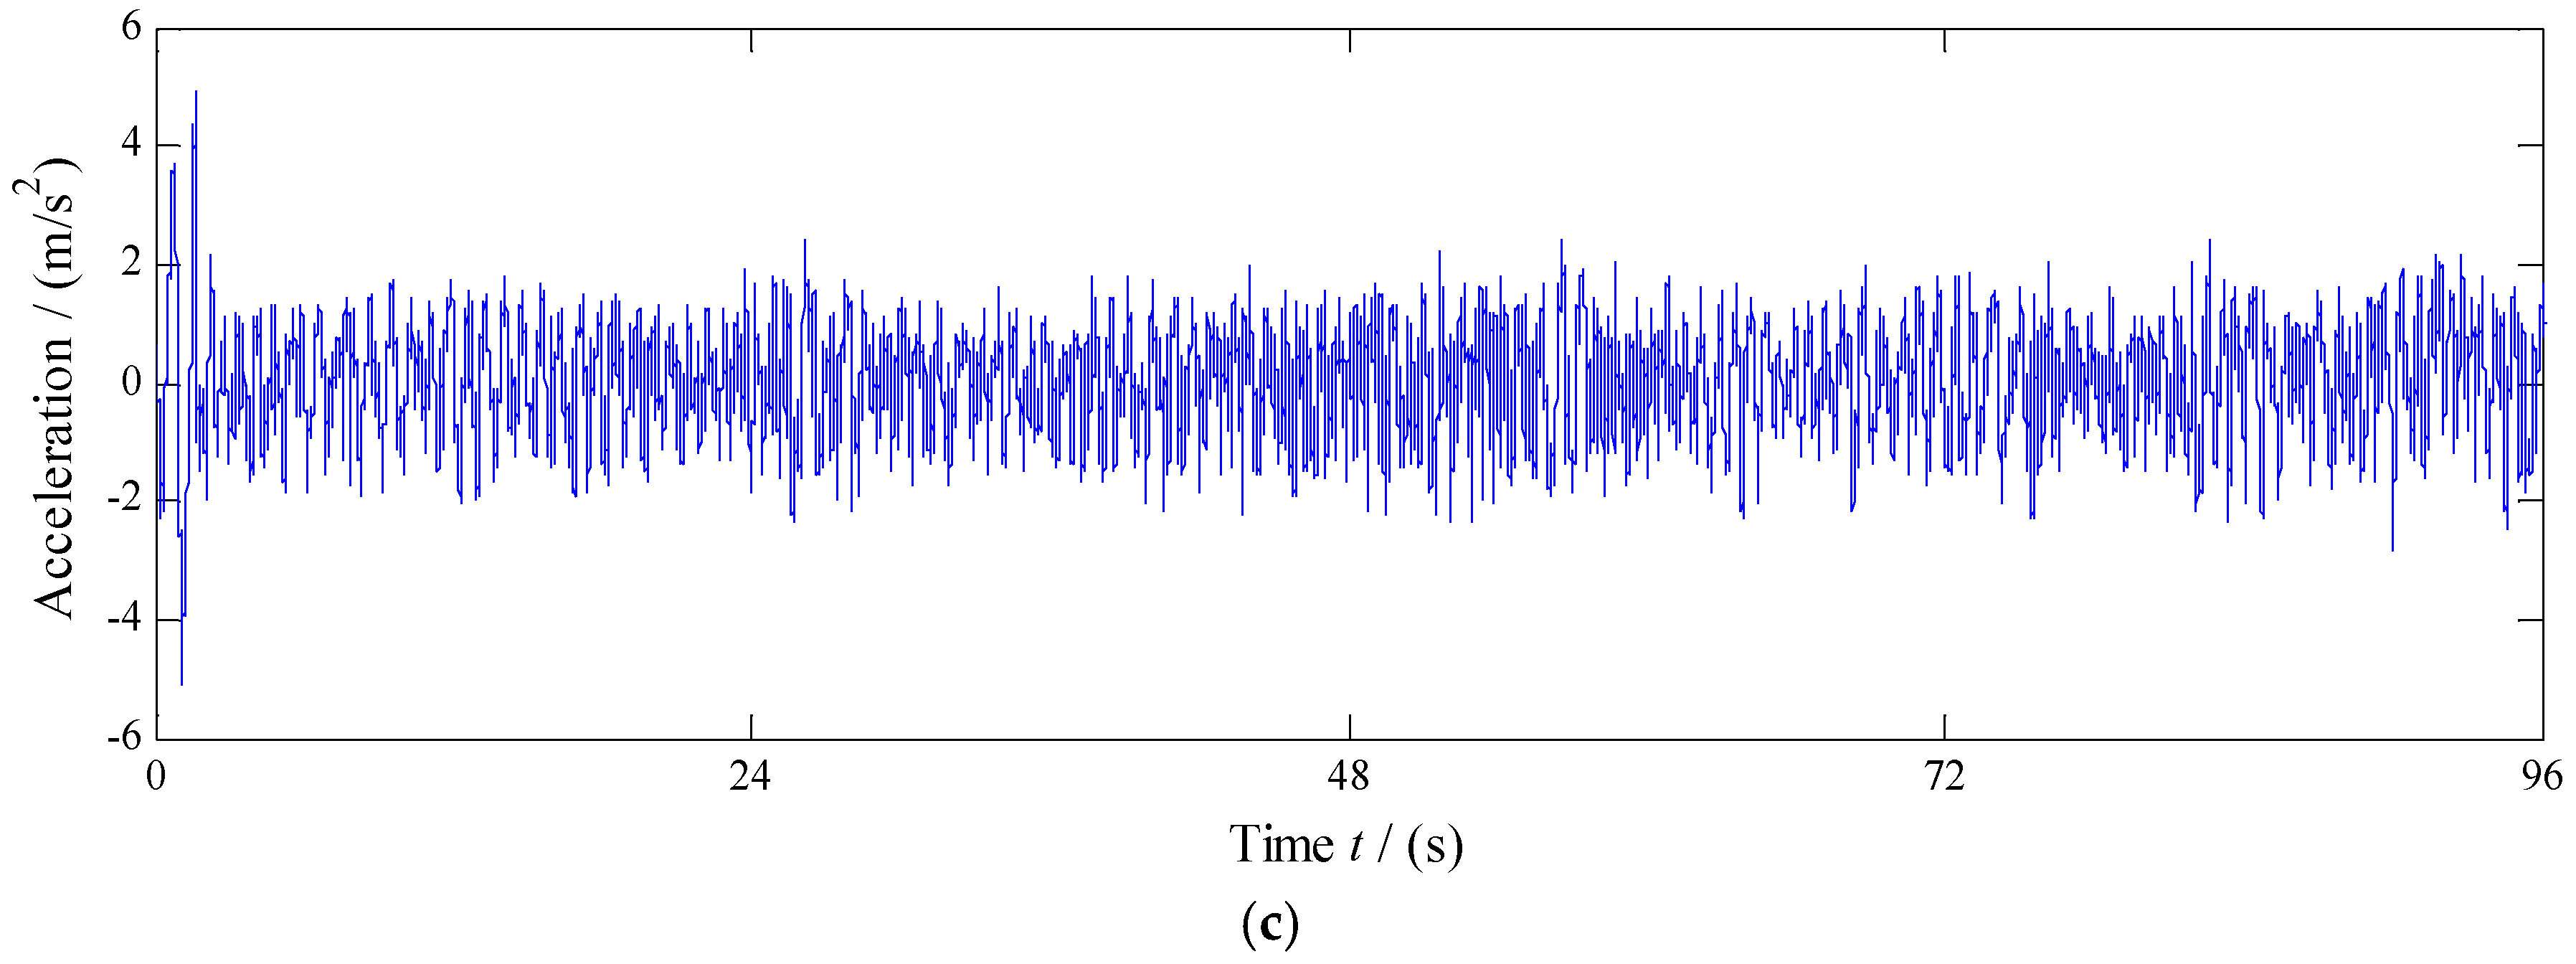
n0) values provided by the database of the automobile test field, their road grades belong to A, B, and C, respectively. When the front suspension was equipped with different dampers, the acceleration signals were measured for the test vehicle at 40 km/h, 60 km/h, and 80 km/h on each trial road, respectively. The test was repeated three times. The measured cab floor vertical acceleration signals under the sand road are shown in
Figure 9. Owing to the similarity of the measured signals, the measured signals under the cement road and the highway are not provided.
4.3. Results Analysis
4.3.1. Identification Results and Verification
According to the measured acceleration signals and the test vehicle parameters, the PSD
Gq(
n0) values are identified using Formula (8). The results are shown in
Table 2.
In
Table 2, all identified values of the PSD
Gq(
n0) for the three trial road sections fall within their own real ranges provided by the database of the automobile test field. Moreover, for each trial road section, the identification results at different dampers and different speeds are very close. According to the identification results, the road grades can be divided into classes A, B, and C, respectively, which are in accordance with the results provided by the database of the automobile test field. The test results show that the road condition identification method is feasible and it can effectively identify the actual road grades.
4.3.2. Influence Factor Analysis of Identification Results
The Influence of the Acceleration Signal Length
The road identification method proposed is based on Formula (8). It is assumed that the road input is regarded as white noise, but the actual pavement is not. Theoretically, many samples are needed when the RMS acceleration is calculated. That is, longer times result in predicted PSD Gq(n0) values closer to the actual road surface. However, it cannot be infinitely long in the practical application. According to the experimental results, the PSD Gq(n0) value of the highway can be effectively identified by using the length 41.4 s of the acceleration signal for v = 40 km/h. Moreover, taking 20.7 s is enough for v = 80 km/h. According to the experiment results, the effective perception of road conditions can be realized within 1.0 min at the speed of 40–100 km/h on the highway. In the actual running process, the road grade is basically unchanged for a period. Therefore, it can meet the requirements of practical applications using 20 s as the identification interval. To further analyze the influence of the acceleration signal length, the PSD Gq(n0) values of the highway for the three runs for v = 80 km/h were identified using 10 s, respectively. The identified results are 5.9, 6.2, and 6.1 × 10⁻⁶ m3, respectively. The identified values are smaller than those identified using 20 s. The longer the acceleration signal length is, the more effectively the low-frequency excitation components of the road surface can be reflected. Thus, the cause may be that the contribution of the low frequency excitations cannot be totally contained.
The Influence of the Running Speed Change
According to Equation (7), when the vertical acceleration is measured, the cars need to run at a constant speed for a period, but the running speed is fluctuating for the actual car in operation. In most cases, it is basically fluctuating within a constant velocity range. According to Formula (8), the PSD Gq(n0) is inversely proportional to the running speed v. If the vehicle speed fluctuates ±5% within a period, the identification result fluctuates 5%. The proposed method of the road identification is based on road statistical characteristics. The slight fluctuation of the running speed v has little effect on the statistical characteristics of road conditions.
5. Conclusions
To reduce the product cost and promote the industrialization progress of semi-active suspensions, this paper proposes a new hydraulic semi-active suspension system based on road statistical properties and creates a feasible identification method of road conditions. To verify the effectiveness of the identification method, a road test was carried out. The main research results are as follows:
(1) The basic assumption is that the PSD Gq(n0) is constant during a limited period for the proposed semi-active suspension system. The test results show that the assumption is reasonable.
(2) To identify the PSD Gq(n0), the road identification method needs an accelerometer, an angle sensor, and a speed sensor. The angle sensor is used to measure the feedback signal θ’ of the stepper motor.
(3) The relationship ξ’ = ξ’(θ’) between the current damping ratio ξ’ and the feedback signal θ’ can be established based on the oil path of the damper.
(4) The test results show that the identification method is feasible and it can effectively identify the actual road grades. It can meet the requirements of practical applications using 20 s as the identification interval. The slight fluctuation of the running speed v has little effect on the PSD Gq(n0).
At present, the prices of MR dampers produced by LORD Corporation of USA are above 1000 dollars. For example, one RD-1005-3 MR damper costs about 1200 dollars. The controllable hydraulic damper in this study can be reformed from the traditional hydraulic damper. Its production cost is about 100–200 dollars. Thus, the proposed semi-active suspension can significantly reduce the production cost of semi-active suspensions. The proposed semi-active suspension has a good prospect in vehicles. Its prototype production and performance validation will be investigated. The proposed semi-active suspension and its feasible identification method of road conditions provide a useful reference for the development of semi-active suspension systems.
6. Patents
The authors have received a patent of invention: an identification method of the vehicle driving condition based on damper damping, ZL201710245640.X, in China.


