Article

Real-Time Estimation for Cutting Tool Wear Based on Modal Analysis of Monitored Signals

1
School of Reliability and Systems Engineering, Beihang University, Beijing 100191, China
2
School of Mechanical Engineering and Automation, Beihang University, Beijing 100191, China
*
Author to whom correspondence should be addressed.
Appl. Sci. 2018, 8(5), 708; https://doi.org/10.3390/app8050708
Submission received: 23 March 2018 / Revised: 27 April 2018 / Accepted: 27 April 2018 / Published: 3 May 2018
(This article belongs to the Section Mechanical Engineering)

Abstract

:
There is a growing body of literature that recognizes the importance of product safety and the quality problems during processing. The working status of cutting tools may lead to project delay and cost overrun if broken down accidentally, and tool wear is crucial to processing precision in mechanical manufacturing, therefore, this study contributes to this growing area of research by monitoring condition and estimating wear. In this research, an effective method for tool wear estimation was constructed, in which, the signal features of machining process were extracted by ensemble empirical mode decomposition (EEMD) and were used to estimate the tool wear. Based on signal analysis, vibration signals that had better linear relationship with tool wearing process were decomposed, then the intrinsic mode functions (IMFs), frequency spectrums of IMFs and the features relating to amplitude changes of frequency spectrum were obtained. The trend that tool wear changes with the features was fitted by Gaussian fitting function to estimate the tool wear. Experimental investigation was used to verify the effectiveness of this method and the results illustrated the correlation between tool wear and the modal features of monitored signals.

1. Introduction

Performance degradation assessment for mechanical equipment is of importance in condition-based maintenance to lower cost, improve reliability, and reduce maintenance cost, thus, it becomes an important research area for machine fault diagnosis and reliability analysis [1,2]. Cutting tools are one of the most important elements during machining, which have a close relationship with product precision [3]. Their reliability influences the total manufacturing effectiveness and stability of machine tools. In most circumstances, wear degradation is the main failure for tool and will lead to the waste of product and time, as well, tool condition is closely related to machine’s efficiency and productivity, therefore, tool condition monitoring is important. How to estimate tool wear life is also beneficial as it is helpful for predictive maintenance.
As an important concern during processing, a number of studies are being done by many researchers for tool wear. Traditional prediction and estimation approaches of tool wear are based on statistical analysis from a huge amount of historical experiment data [4], among which statistical distribution models have been used in this area, such as exponential distribution and Weibull distribution [1,2]. This kind of method depends on plentiful historical data from related equipment. Therefore, further investigation combining monitored signals and physical modes should be carried out. The key information of tool conditions can be determined from monitored data in machining. Most studies on tool wear have been carried out in tool wear compensation method for precision tuning and providing a reference for extended tool life and good surface quality [5,6,7]. Some signal processing methods, such as wavelet packet decomposition and neural network, have been used to extract features from cutting force signals, AE signals, and vibration signals produced in mechanical manufacturing for tool state prediction [3,4,8]. Tool-wear prediction and monitoring also can improve the controlling of high-speed machining processes [9]. Most of the researches have focused on the qualitative analysis of cutting tool state, but performance degradation data of cutting tools is also meaningful in the process. EEMD is an algorithm to decompose signals, which utilizes the white noise could provide uniformly distributed scale in time-frequency space. It was mainly applied in the medical field initially. In recent years, researchers have applied EEMD to machine fault analysis and diagnosis more. The vibration signals measured from rotating machinery usually are complex, non-stationary, and nonlinear. Especially, the useful multi-fault features are too weak to be identified at the early stage [10,11]. H. Jiang [12] combined EEMD and multiwavelet packet for optimizing mechanical fault diagnosis method. Y. Lei [13] also presented a diagnosis method for fault diagnosis of rotating machinery and improving Hilbert–Huang transform (HHT) based on EEMD and sensitive IMFs. Empirical mode decomposition (EMD) can be applied to modal analysis method [14], but there is a serious mode mixing phenomenon in EMD. EEMD, compared with EMD, has greater capacity in modal analysis for fault diagnosis and estimation. In this research, a novel method for tool wear estimation is developed by combining tool wear and monitored signals analysis based on modal analysis. Ensemble empirical mode decomposition (EEMD) for monitored signals is taken advantage of to extract the related features for tool wear analysis. An experiment data set of tool condition is used to verify the effectiveness of this method. The results show that this method can benefit to the tool wear estimation. This paper is structured as follows. The ‘Algorithm Theory and Method’ section introduces some algorithms of this method and the flow path in detail. The ‘Experimental Study’ section presents tool milling experiment, provides the data set, and analyzes the signals by using this method. The ‘Method Validation and Application’ section uses experimental data to verify the method. In this section, the feasibility and practicability of this method are proved. Concluding remarks are given in the “Conclusion” section.

2. Algorithm Theory and Method

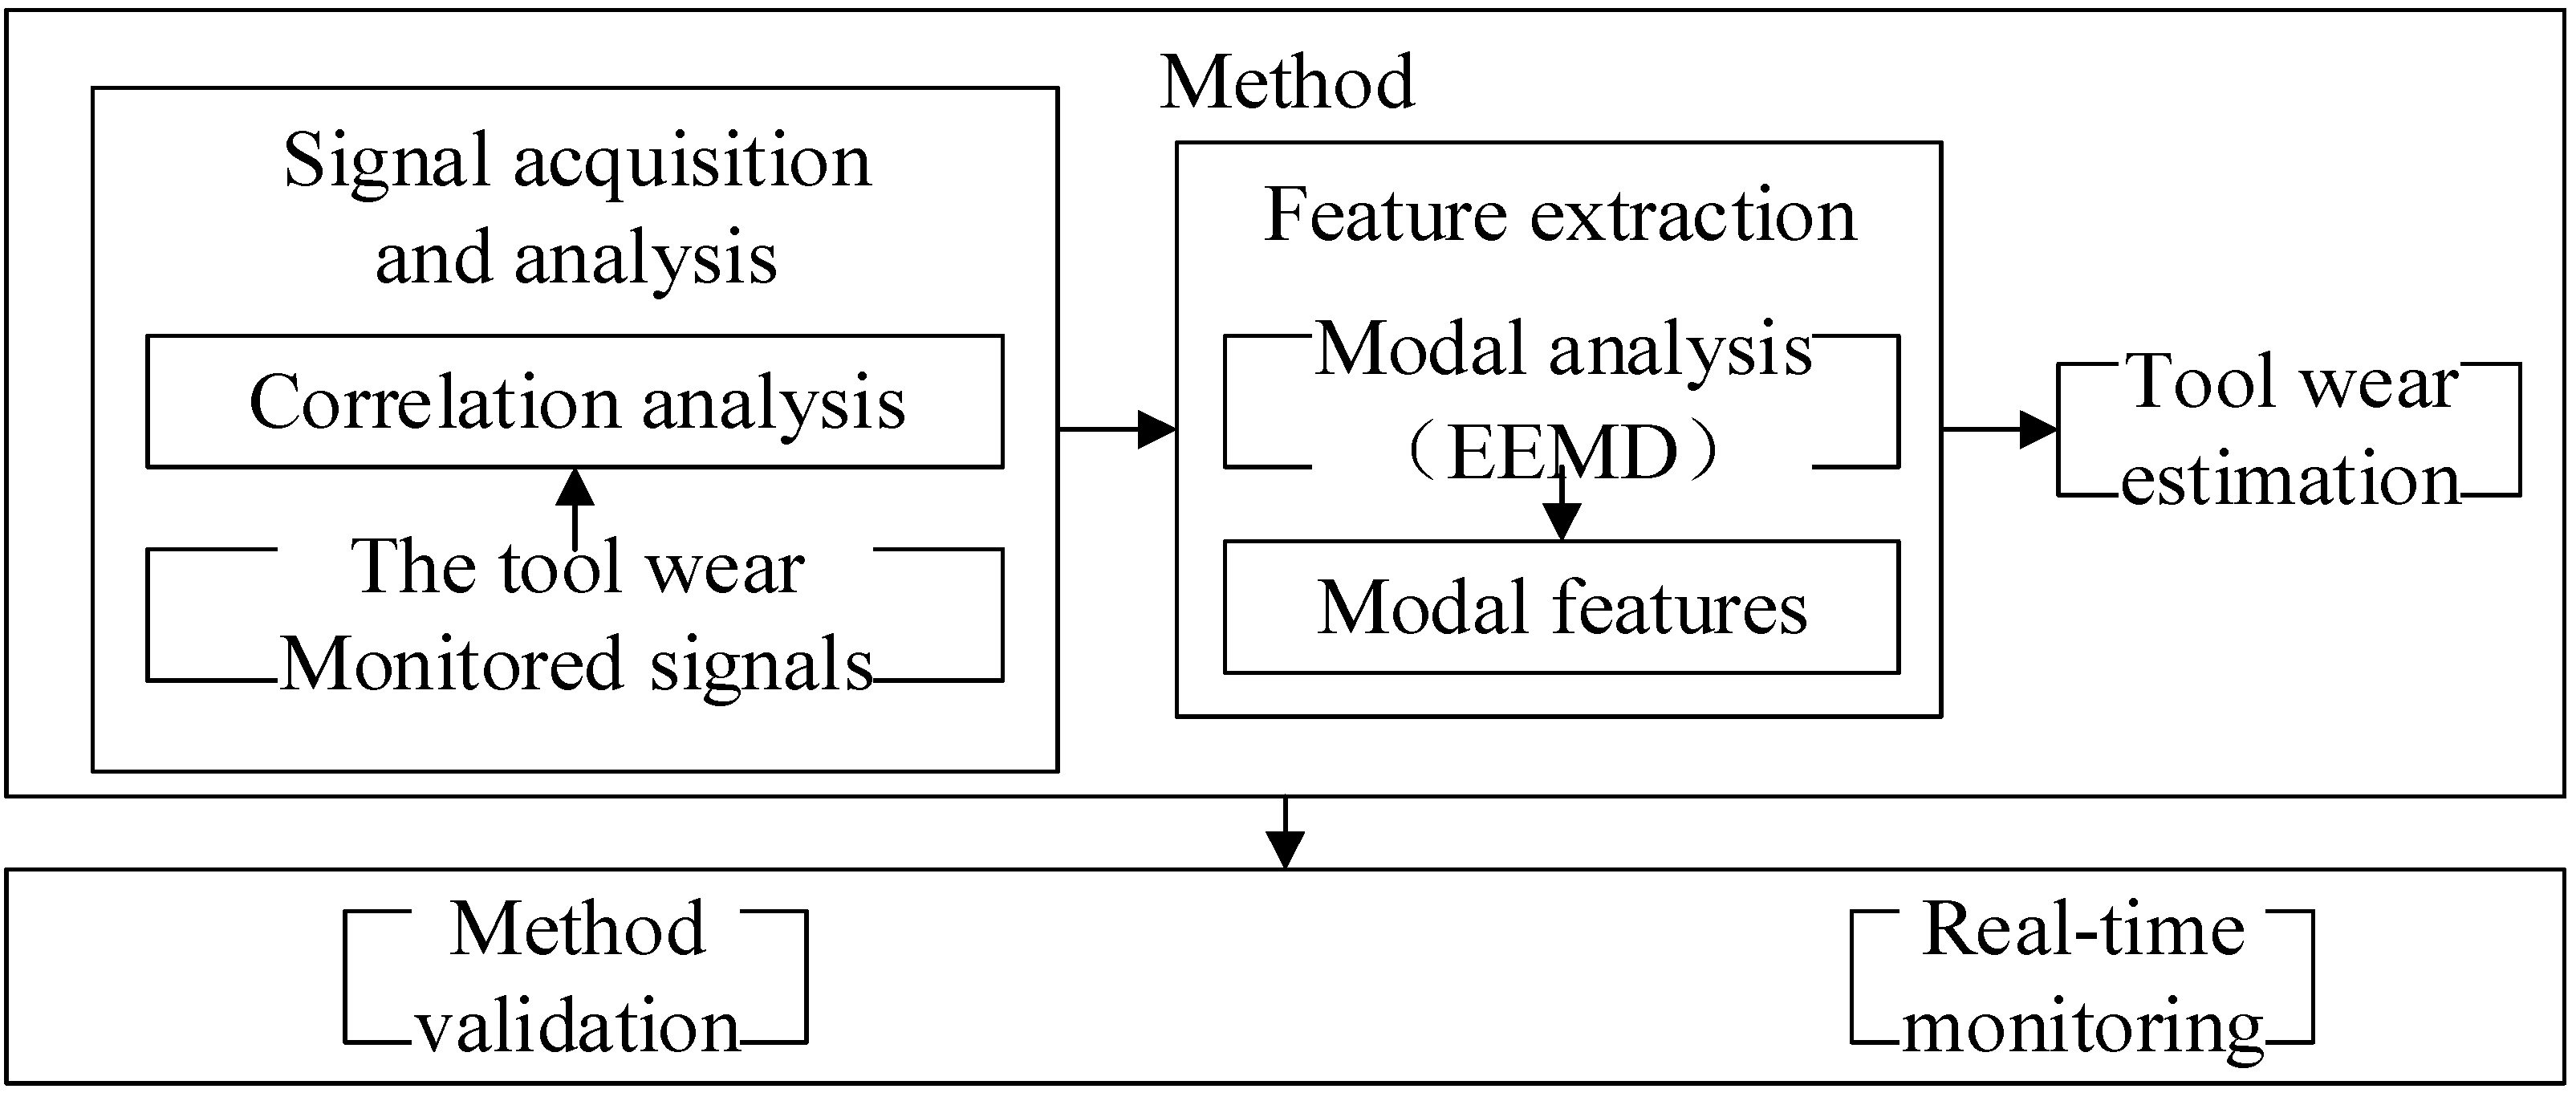
2.1. Method Flowchart

In this paper, the modal features of monitored signals are extracted by EEMD and the trend fitting of the features is applied to real-time estimation of tool wear. The process of method is shown in Figure 1.
There are mainly three parts, i.e., signal acquisition and analysis, feature extraction of monitored signals, and tool wear estimation. The first part is signal acquisition and analysis, here the milling parameters and the processing conditions are known to collect process signals, and the monitored signals that reflect the inherent modal information are selected in the milling process and calculated the correlation coefficients with the tool wear. The second part is feature extraction of selected signals. Monitored signals are collected in the milling process, and the modal features of monitored signals are extracted by EEMD. The third part is tool wear estimation, i.e., the characteristics of monitored signals are analyzed based on feature extraction to estimate the tool wear. The modal information of the monitored signals with different inherent frequency is selected as the input variables for trend fitting, and method tests and contrasts are executed. In the end, an example for tool analysis is investigated in this research to verify the effectiveness of the method and the estimation results can be shown in real time.

2.2. Monitored Signals and Tool Wear

Signal monitoring is of vital importance in order to estimate tool wear. The researches need to get sufficient monitoring information of tool condition. Cutting force can be used on condition estimation [15,16] as it is directly related to wearing process, meanwhile, some researchers payed more attention on vibration signals to estimate tool wear [17,18]. The precision of tool wear that obtained through directly measuring tool is high but affects the production, and it is also not easy to implement the on-the-fly measurement of tool wear in the actual production. Therefore, research on indirect measuring methods is necessary, and tool wear is analyzed by measuring its relationship for milling force, vibration signals, AE signals, etc. To determine the best information for tool condition analysis, investigation is conducted to obtain the related parameters for condition analysis. Correlation analysis is investigated to observe whether there is some kind of interdependent relationship between these signals and tool wear.
If X is a random variable, E(X) is the expectation of X and E { [ X E ( X ) ] 2 } } is exist, E { [ X E ( X ) ] 2 } will be called the variance of X, marked as D ( X ) . E { [ X E ( X ) ] [ Y E ( Y ) ] } is called the covariance of the random variable X and Y, marked as Cov ( X , Y ) . The correlation coefficient ρ x y of X and Y is defined as:
ρ x y = Cov ( X , Y ) D ( X ) D ( Y )
In which, D(X) is the variance of X and D(Y) is the variance of Y.
The linear function a + b X of X is used to approximate Y, and the mean square error e is used to measure the degree of goodness of Y.
e = E [ ( Y ( a + b X ) ) 2 ] = E ( Y 2 ) + b 2 E ( X 2 ) + a 2 2 b E ( X Y ) + 2 a b E ( X ) 2 a E ( Y )  
The smaller the value of e is, the greater the approximate degree of   a + b X and Y is. Find the partial derivatives of e about a and b and make them equal to zero.
{ e a = 2 a + 2 b E ( X ) 2 E ( Y ) = 0 e b = 2 b E ( X 2 ) 2 E ( X Y ) + 2 a E ( X ) = 0
The solutions as follows:
b 0 = Cov ( X , Y ) D ( X )
a 0 = E ( Y ) b 0 E ( X ) = E ( Y ) E ( X ) Cov ( X , Y ) D ( X )
a 0 and b 0 will be substituted into (6):
minE [ ( Y ( a + b x ) ) 2 ] = E [ ( Y ( a 0 + b 0 X ) ) 2 ] = ( 1 ρ x y 2 ) D ( Y )
It can be seen from the Formula (6) that   ρ x y 1 , and ρ x y can show the linearity between X and Y. When ρ x y is large, the correlation degree between X and Y is better; when ρ x y is small, it shows that the correlation degree between X and Y is poor; when ρ x y = 1 , there is a linear relationship between X and Y; when   ρ x y = 0 , it is said that X and Y are not related.
The monitored signals showing the high correlation with tool wear are chosen to extract features.

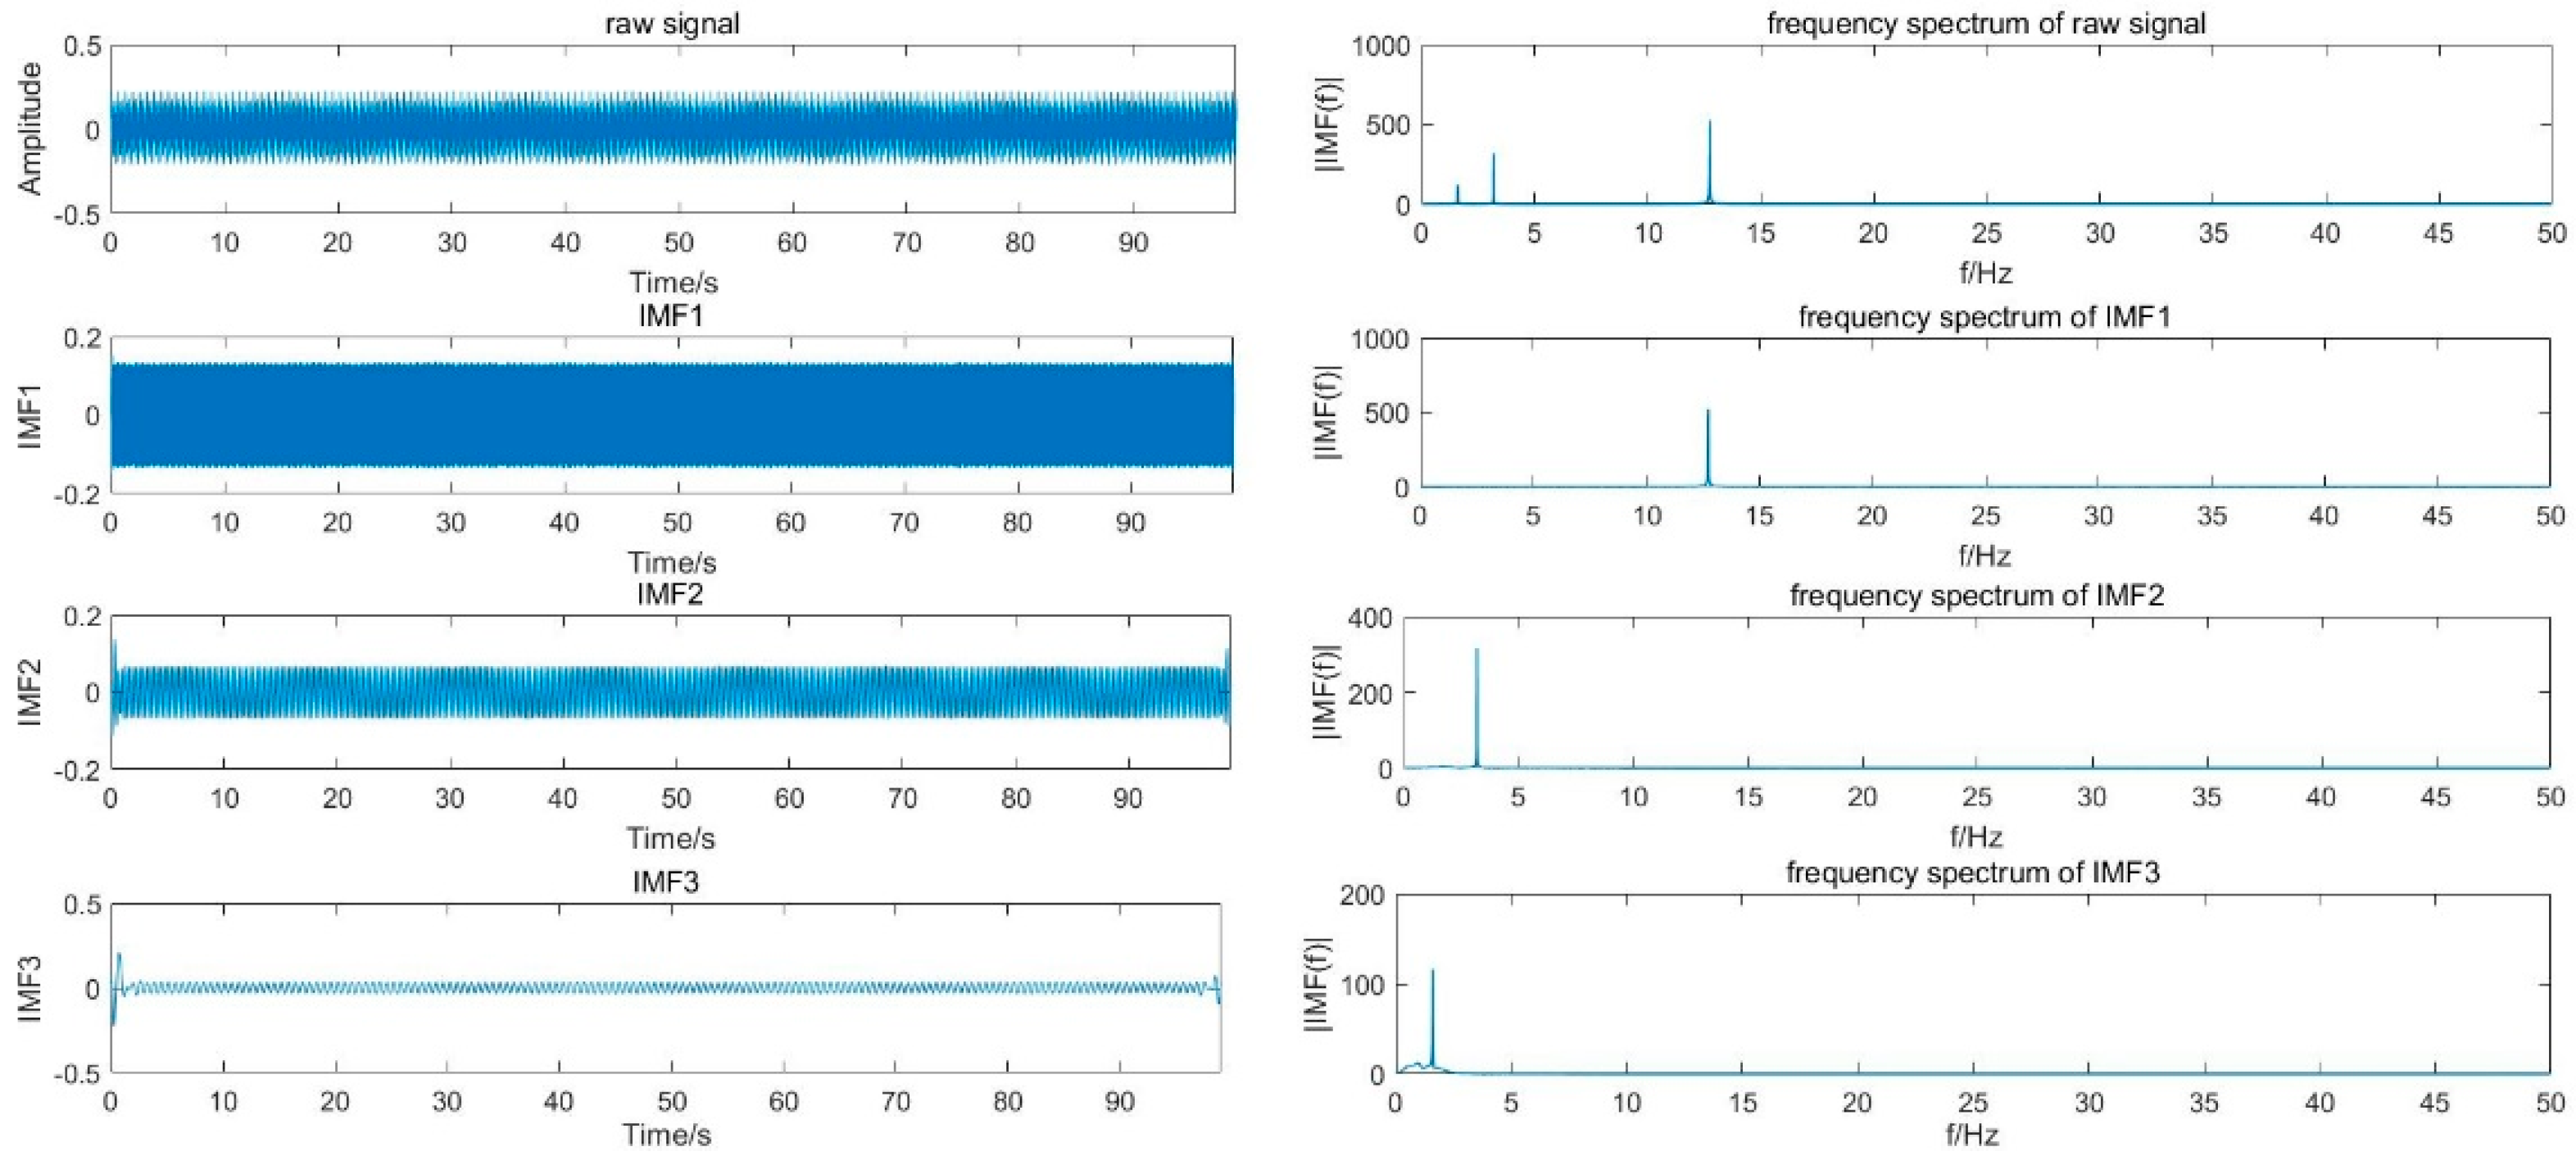
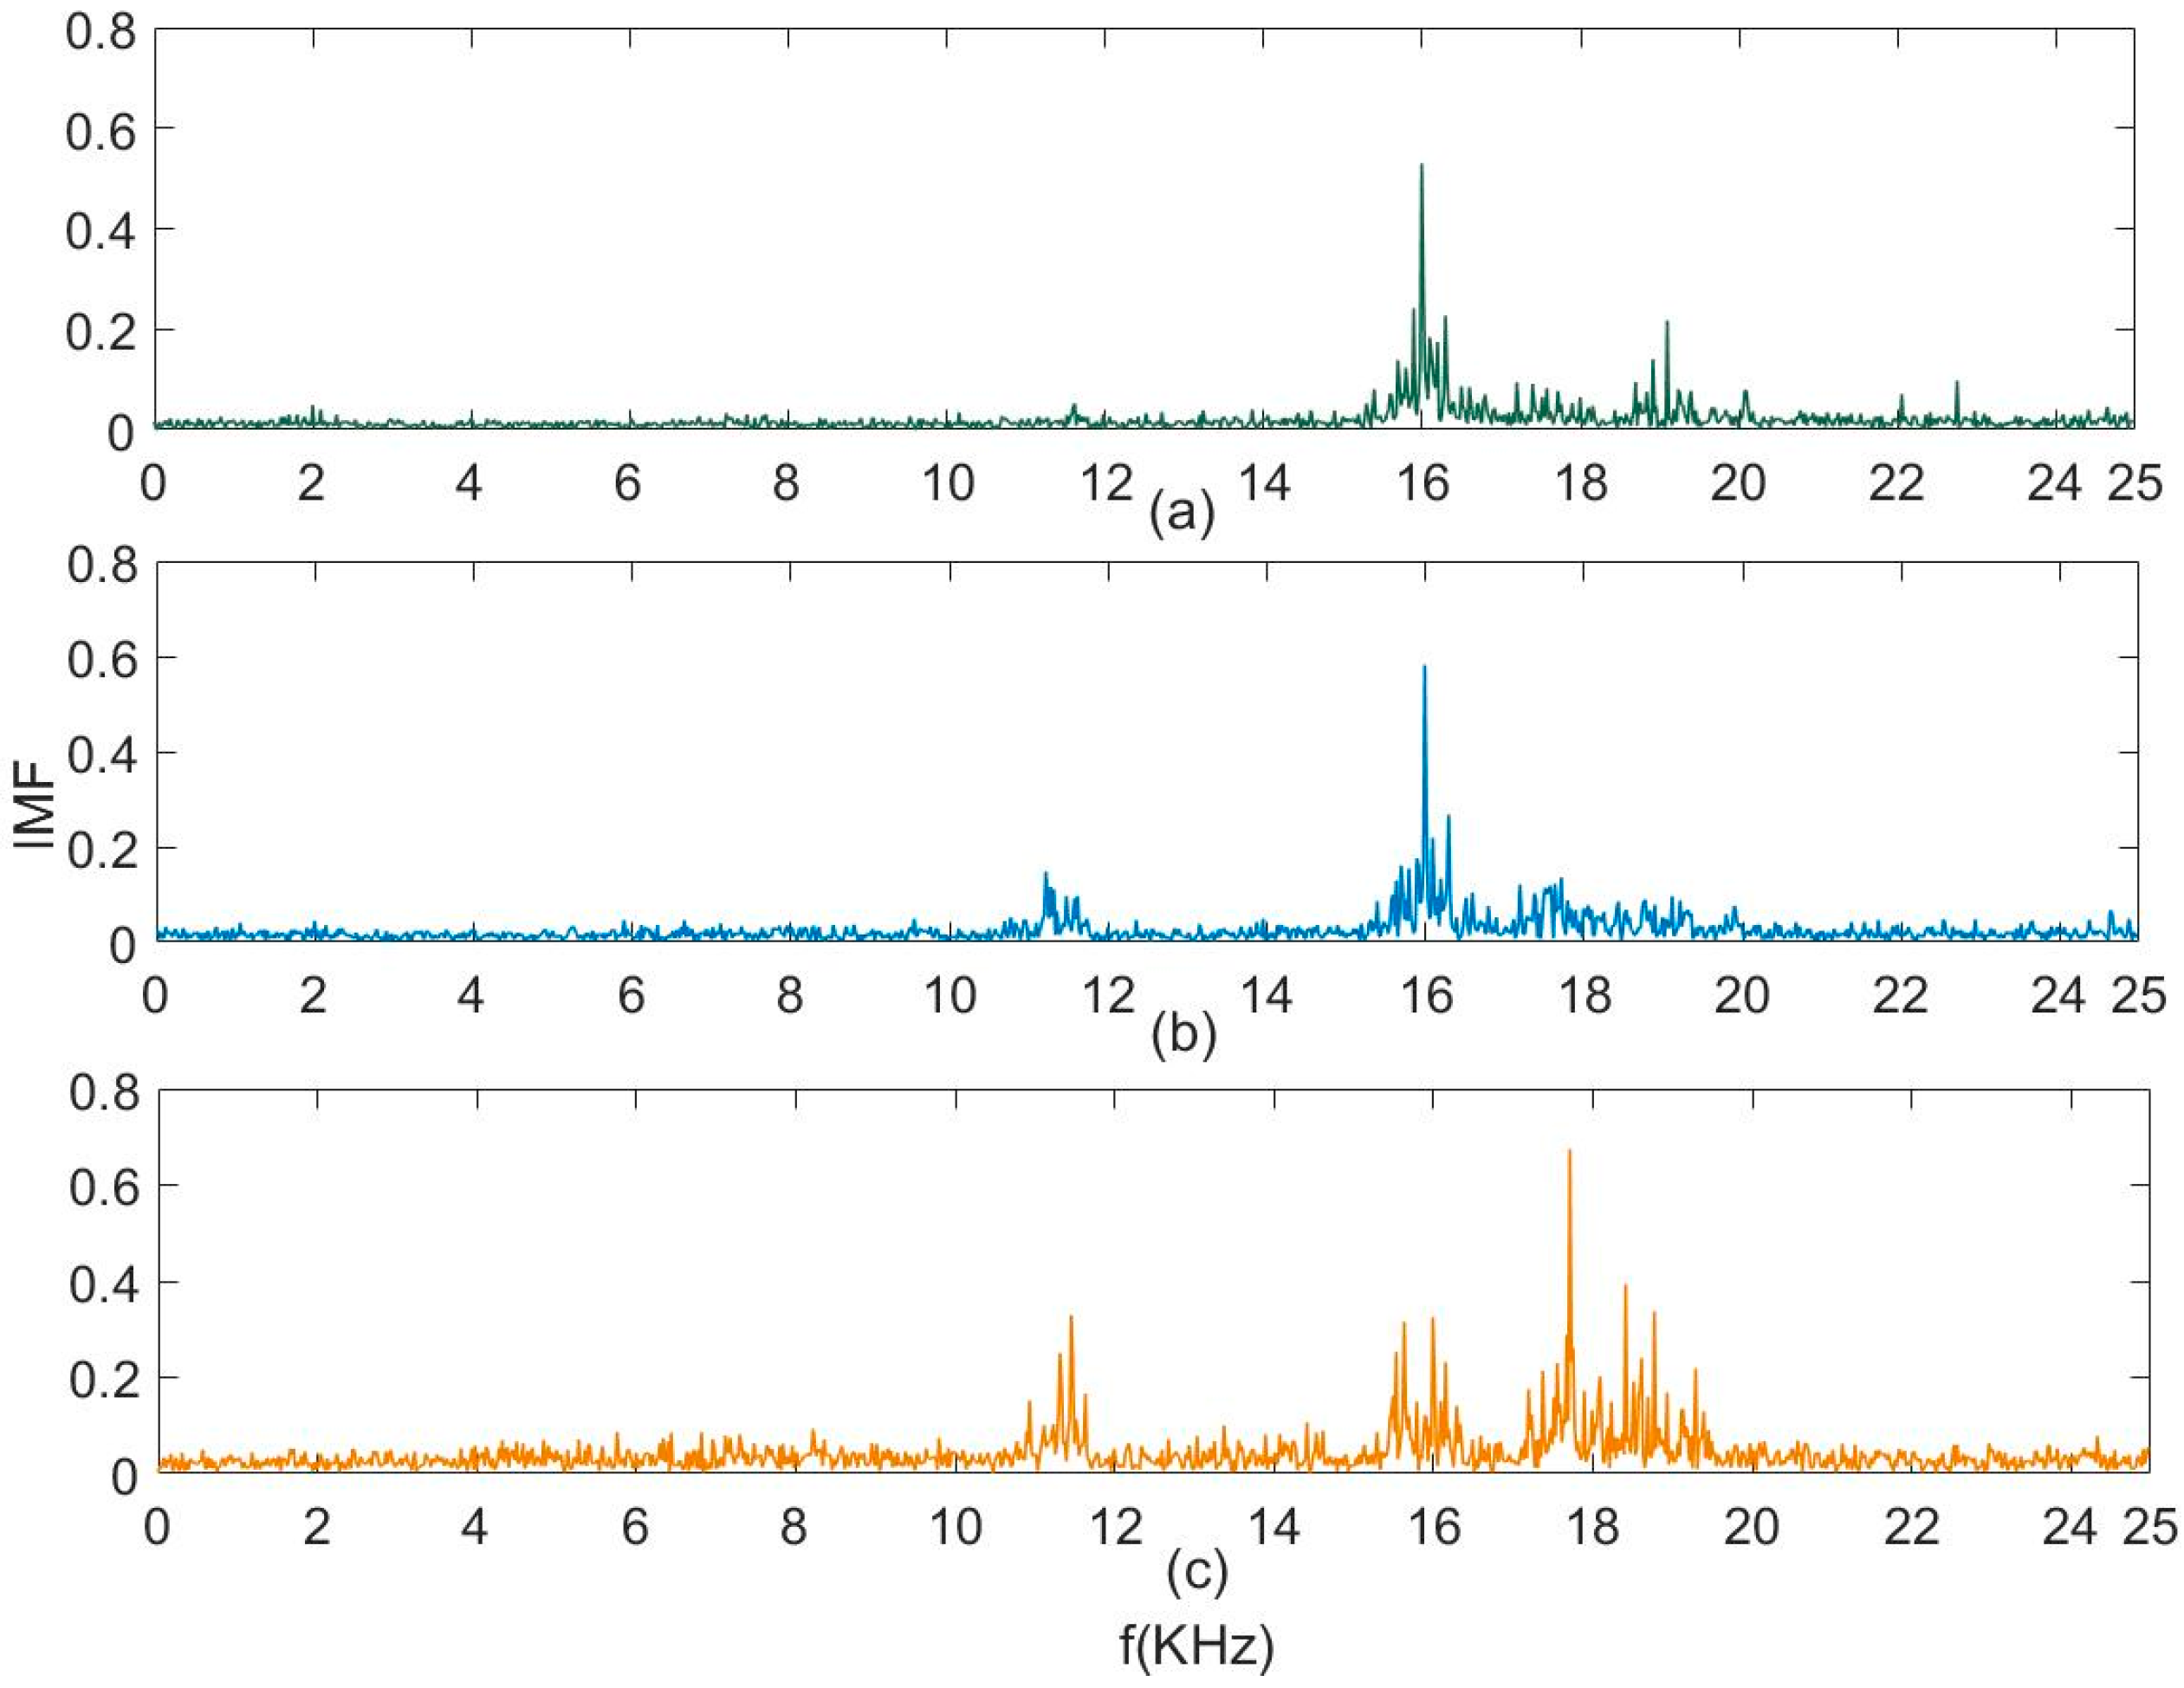
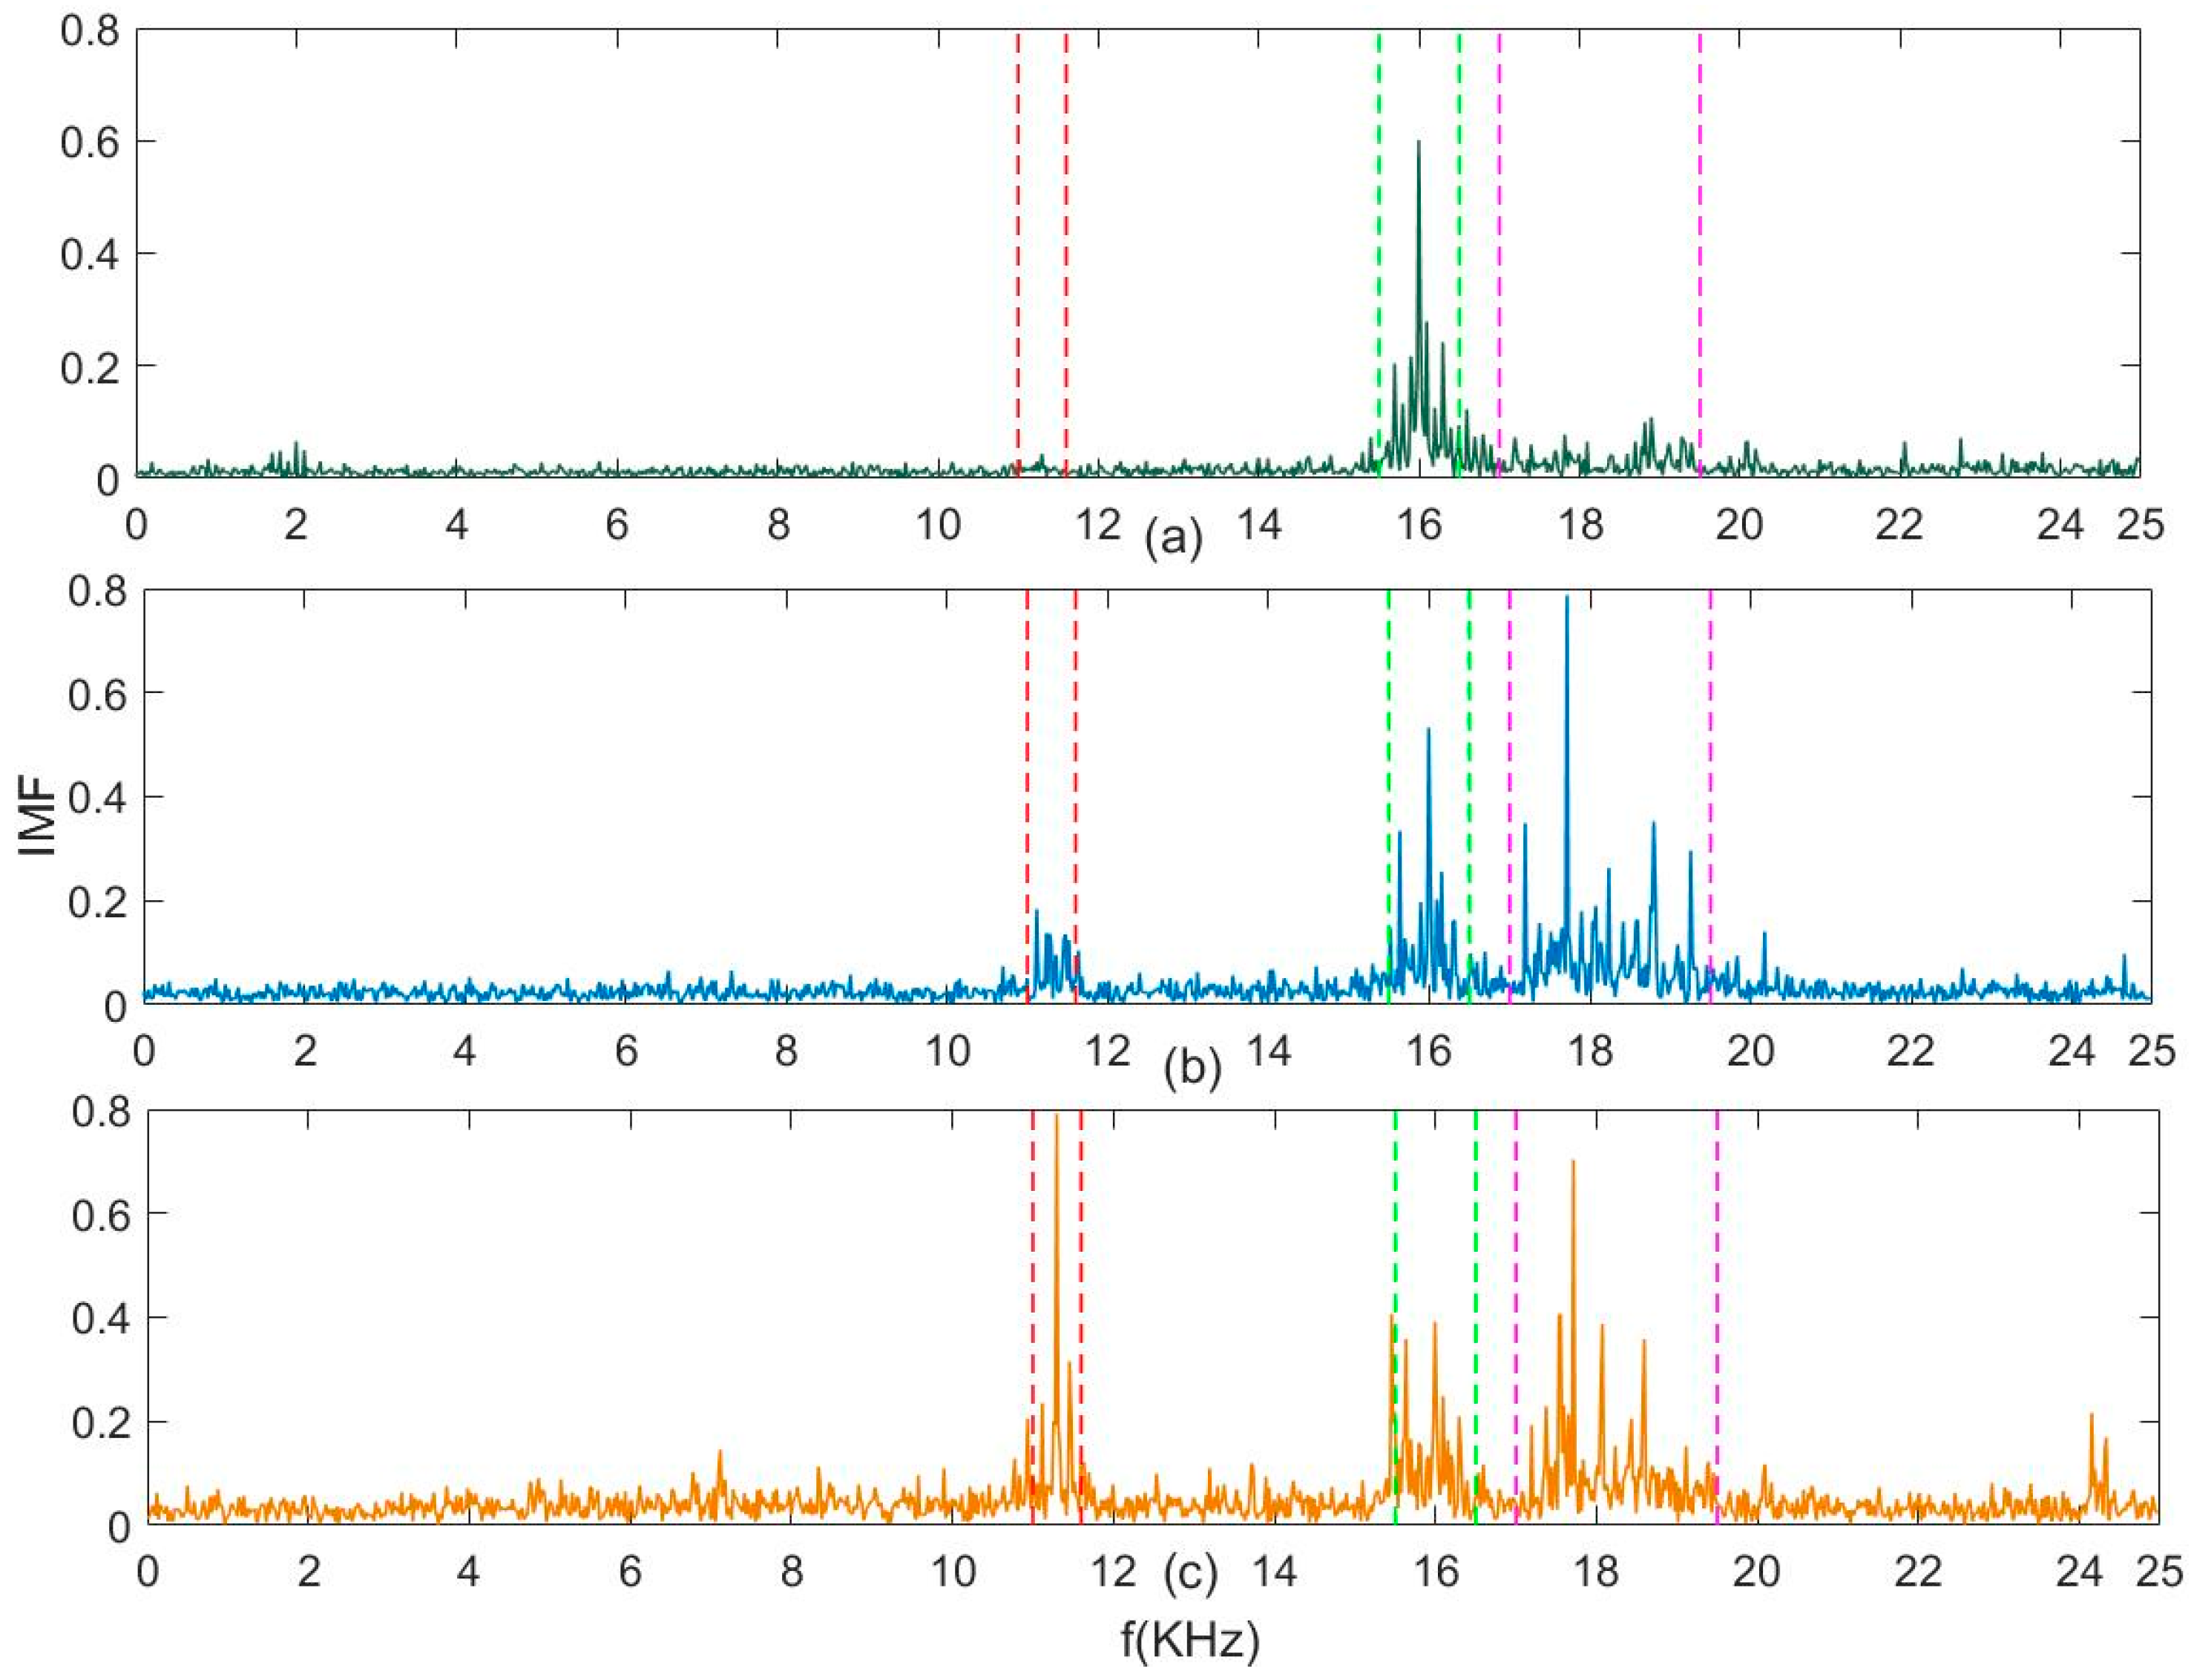
2.3. Modal Feature Extraction Based on Empirical Mode Decomposition (EEMD)

Feature extraction is a key step in signal processing. Monitored signals mix multiple modes and contain a lot of invalid information. In order to better solve the mode mixing problem, EEMD is chosen to decompose the monitored signals, which utilizes the white noise could provide uniformly distributed scale in time-frequency space. It is widely used in all kinds of signal analysis fields. EEMD was presented to utilize the full advantage of the statistical characteristics of white noise to perturb the signal in its true solution neighborhood, and to cancel itself out after serving its purpose by WU [19]. EEMD can reduce the mode mixing to some extent depending on the parameters adopted in the EEMD algorithm [11]. In current studies on EEMD, the parameters are generally selected artificially and subjectively.
The proposed ensemble empirical mode decomposition is developed as follows:
  • Step 1: add a white noise series   n m ( t )   to the targeted data.
    x m ( t ) = x ( t ) + n m ( t )
  • Step 2: decompose the data with added white noise into intrinsic mode function (IMF).
  • Step 3: repeat step 1 and step 2 again and again, but with different white noise series each time.
  • Step 4: obtain the ensemble means of corresponding IMFs of the decompositions as the final result.
    I M F i = 1 M m = 1 M a i , m             i = 1 , 2 , , I               m = 1 , 2 , , M
M is the number of computing average.
Then x ( t )   can be obtained:
x ( t ) = n = 1 N y n ( t ) + r n
The effects of the decomposition using the EEMD are that the added white noise series cancel each other, and the mean IMFs stay within the natural dyadic filter windows, significantly reducing the chance of mode mixing and preserving the dyadic property.
Figure 2 shows a time-dependent trend chart and frequency spectrum for raw signal y, and time-dependent chart and frequency spectrums IMFs of signal y decomposed by EEMD at some points are also presented in Figure 2. Signal y can be obtained by formula below.
y = 2 × sin ( 20 × t ) + 4 × sin ( 80 × t ) sin ( 10 × t )
As shown in Figure 2, the signal is decomposed into IMFs by analyzing modes, and the frequency spectrums present the amplitude changes of different modes. Different frequency components are separated, so smaller frequency peaks in the raw signal are enlarged in figure above by decomposing. By decomposing the monitored signals, the mode information is more plentiful and modal features are more distinct. Feature extraction can use statistical methods to reduce dimension.

2.4. Curve Fitting of Tool Wear

Different distributions as the alternatives are chosen to match the relation between the feature value and tool wear. Linear, exponential, and Gaussian distribution as the alternatives are chosen to calculate the parameters of distribution in this paper. More different distributions will be discussed in the future depending on the feature extracted.
Linear distribution can be expressed by Equation (11).
f L i n e a r ( x ) = a x + b
Exponential distribution can be expressed by Equation (12).
f E x p o n e n t ( x ) = a · e b x
Gaussian distribution can be expressed by Equation (13).
f G u a s s i a n ( x ) = a · e ( ( x b c ) 2 )
where a, b, and c are estimators of the distribution parameters and can be calculated using MATLAB based on the relation between the features extracted and the tool wear curve. To compare fitting results of different distributions, so goodness of fit is evaluated by root mean square error (RMSE).
R M S E = n = 1 N d i ( n ) 2 N
Here, N is the number of fitting points and d i ( n ) is deviation value between actual value and estimation value at nth point. A small RMSE that means the tool wear curve fits the distribution, correspondingly. The larger RMSE is, the worse the effect of the fitting is.

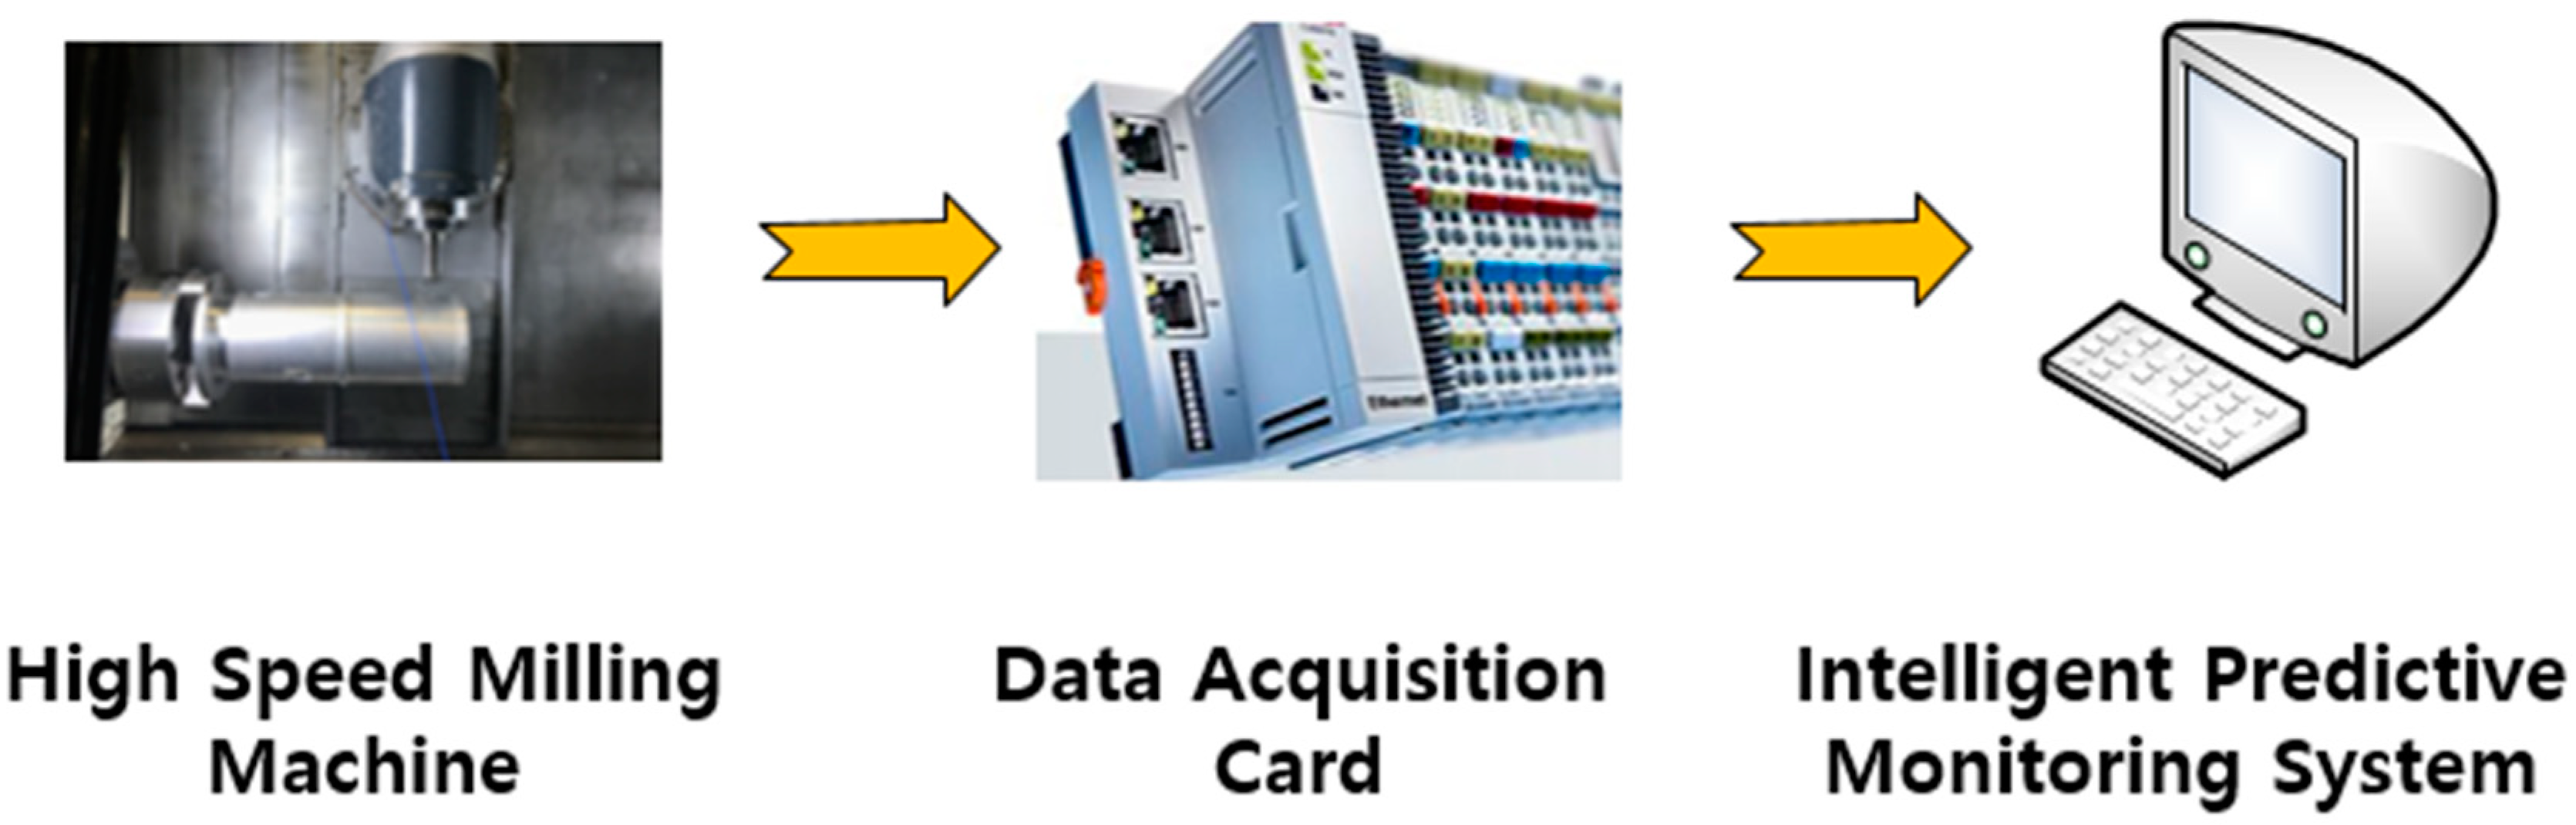
3. Experimental Study

3.1. Milling Experiments

Milling experimental data come from Li’s team of Singapore Institute of Manufacturing Technology [3]. The data set contains tool wear, cutting force, AE signals and vibration signals. The milling experiment scheme is introduced in this section. Milling experimental data come from Li’s team of Singapore Institute of Manufacturing Technology [3]. A high speed computer numerical control (CNC) machine, whose spindle speed up to 42,000 rpm, was selected to achieve the experiment. The workpieces, whose material used in the milling experiment was stainless steel, were cut off from original stock and their surfaces were prepared through face milling to get rid of the original skin layer containing hard particles. Three piezo accelerometers were mounted on the workpiece to measure the machine tool vibrations of cutting process in X, Y, Z direction respectively. The outputs of these sensors were conditioned through corresponding signal conditioning accessories such as charge amplifiers or couplers. The voltage signals were captured by a NI DAQ PCI 1200 board with 12 KHz frequency. The DAQ board generates 16-bit digitized data and directly streamed to a hard disk of an Intel Core 2 Quad 2.66 GHz based industrial PC with 8 GB RAM.
The acquisition and installation of cutting vibration and schematic diagram for the experiment are shown in Figure 3. The machining tests were carried out with cutting speeds 4.7 m/min and spindle speed 23,600 rpm. In the experiment, tool life-cycle experiments were made by inspecting the tool wear. The cutter’s wear was measured after a complete cutting distance using a LEICA MZ12 microscopy system (Leica Microsystems, Wetzlar, Germany). In order to reduce the influence of other factors on the vibration signals, the same cutting parameters were selected in the experiments of three tools. Experimental data was acquired at 50 KHz/channel. Experiments data set contains three groups tool and 315 times milling experiments a group, and each experiment include vibration signals in X, Y, Z dimensions; cutting force signals in X, Y, Z dimensions; and AE signals. Among the data set, two groups are chosen as training set that used for learning, and one group is chosen as test set that used only to assess the performance.

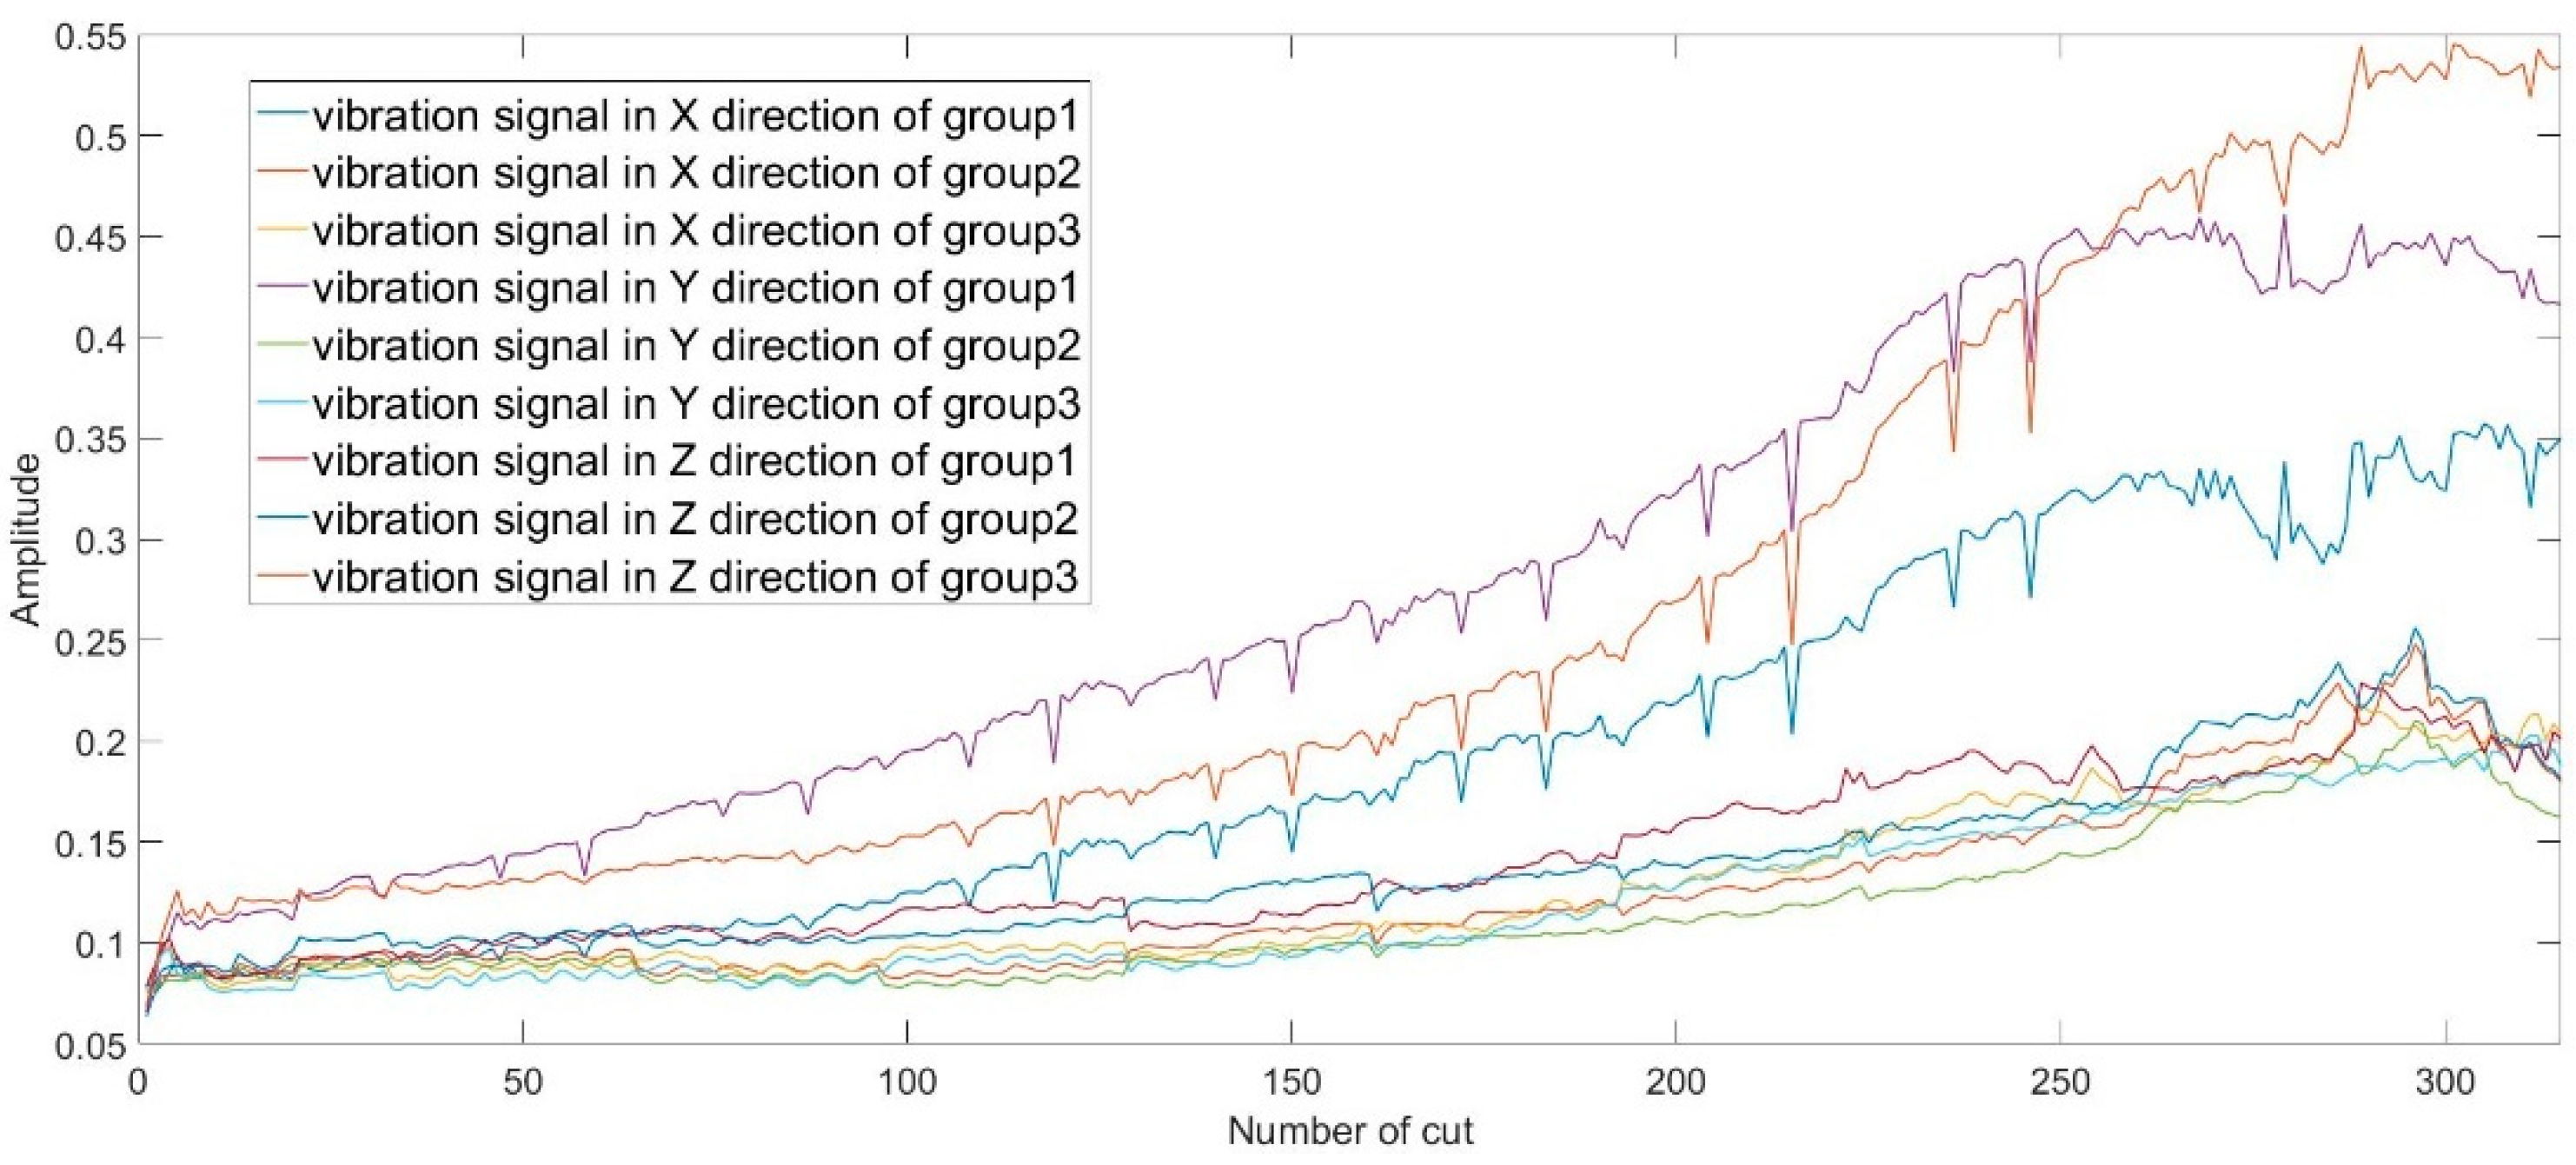
3.2. Correlation Analysis of Signals

To achieve modal analysis based on inherent modal information preferably, vibration signals, displacement signals and speed signals that are related to modal information always are selected. In this paper, thinking about modal analysis, we chose vibration signals to decompose and extract features. Figure 4 shows root mean square (RMS) of vibration signals in X, Y, Z directions of three groups tool in the milling process respectively.
The graph shows that these has been a marked increase in the amplitude of vibration signals with time, in spite of the fluctuations. Through calculating the correlation coefficient for effective value of the signals and the tool wear, the results are shown in Table 1. It can be concluded that the characteristics of vibration signals have better relationship with the tool wear. Based on the results, it can be proposed that, as for the method to monitor the performance degradation of tool in the milling process, the vibration signals and tool degradation monitored show the consistent and high correlation. Meanwhile, vibration signals are easy to get in the processing Thus, thinking about data size and correlation coefficients, vibration signals in X direction are used as an indicator to recognize tool wear in this paper.

3.3. Feature Extraction of Test Data

A cutting test is one of the frequently used methods to monitor tool condition in the milling process. With the increase of tool wear, the cutting edge is passive and inevitably leads to the change of cutting vibration. As there are many reasons affecting the milling process, the milling vibration is not stable especially with wearing condition increment, but both of them have a larger correlation.
In many components of cutting vibration, the influence of tool wear on the vibration is obvious. Anyhow, the cutting vibration increases with cutting tool wear despite some fluctuation. It is mainly related to some factors such as material properties, built-up edge, and measurement error that accumulate in the cutting process. However, the influence on the overall upward trend of cutting vibration is small.
By analyzing vibration signals of training set in the milling process, we find that its amplitude increases with wearing stage, which can be used as a characteristic for tool condition analysis. Decomposing signals and obtaining IMFs, we plotted the frequency spectrums of IMFs. What is interesting in these frequency spectrums of the first IMF, called IMF1, is the phenomenal change of amplitude in three frequency bands at the different stage. It is obvious that frequency amplitude increases with wearing stage as the tool is not sharp between 11.2 KHz and 11.4 KHz approximately. The peak located at 16 KHz is always existed and the peak between 17 KHz and 19 KHz is in the middle and late processing. Figure 5 shows frequency domain analysis for the first IMF of cutting vibration in different tool stages. Figure 5a is the cutting vibration in X direction at the initial stage. Figure 5b is cutting vibration in X direction at the middle stage. Figure 5c is cutting vibration in X direction at the late stage. A possible explanation for the trend may be that the tool wear changes its natural mode of vibration in the first intrinsic mode function between 11.2 KHz and 11.4 KHz, so amplitude varies with the tool wear. The peak located at 16 KHz, is probably related to resonant frequency of sensor, so there is no significant change in amplitude. The peak between 17 KHz and 19 KHz may be related to the different stages of tool wear. It can be seen from the frequency spectrum that the energy between 11.2 KHz and 11.4 KHz is distributed at the early stage of tool cutting with less amplitude, while the energy widely concentrates in between 11.2 KHz and 11.4 KHz at the late stage with more amplitude, therefore the frequency band is extracted to estimate tool wear. In future work, studies about other frequency bands will be considered.
To show the feature trend with the number of milling significantly, feature value Gn is introduced in this paper, that can be calculated using
G n ( j ) = f = 11.2   K H z f = 11.4   K H z A j ( f )       j = 1 , 2 , , P
where j is the number of cut, and P = 315 in Figure 6. A j ( f ) shows the frequency spectrum amplitude of IMF1 decomposed from vibration signals at the jth milling in f Hz. The results obtained from preliminary calculation of Gn in the milling process are shown in Figure 6. In spite of the fluctuations in the amplitude, the amplitude of Gn is expected to continue increasing with time in the milling process, and the results of the correlational analysis between Gn and the tool wear show that there is a high correlation between the feature value and the tool wear.

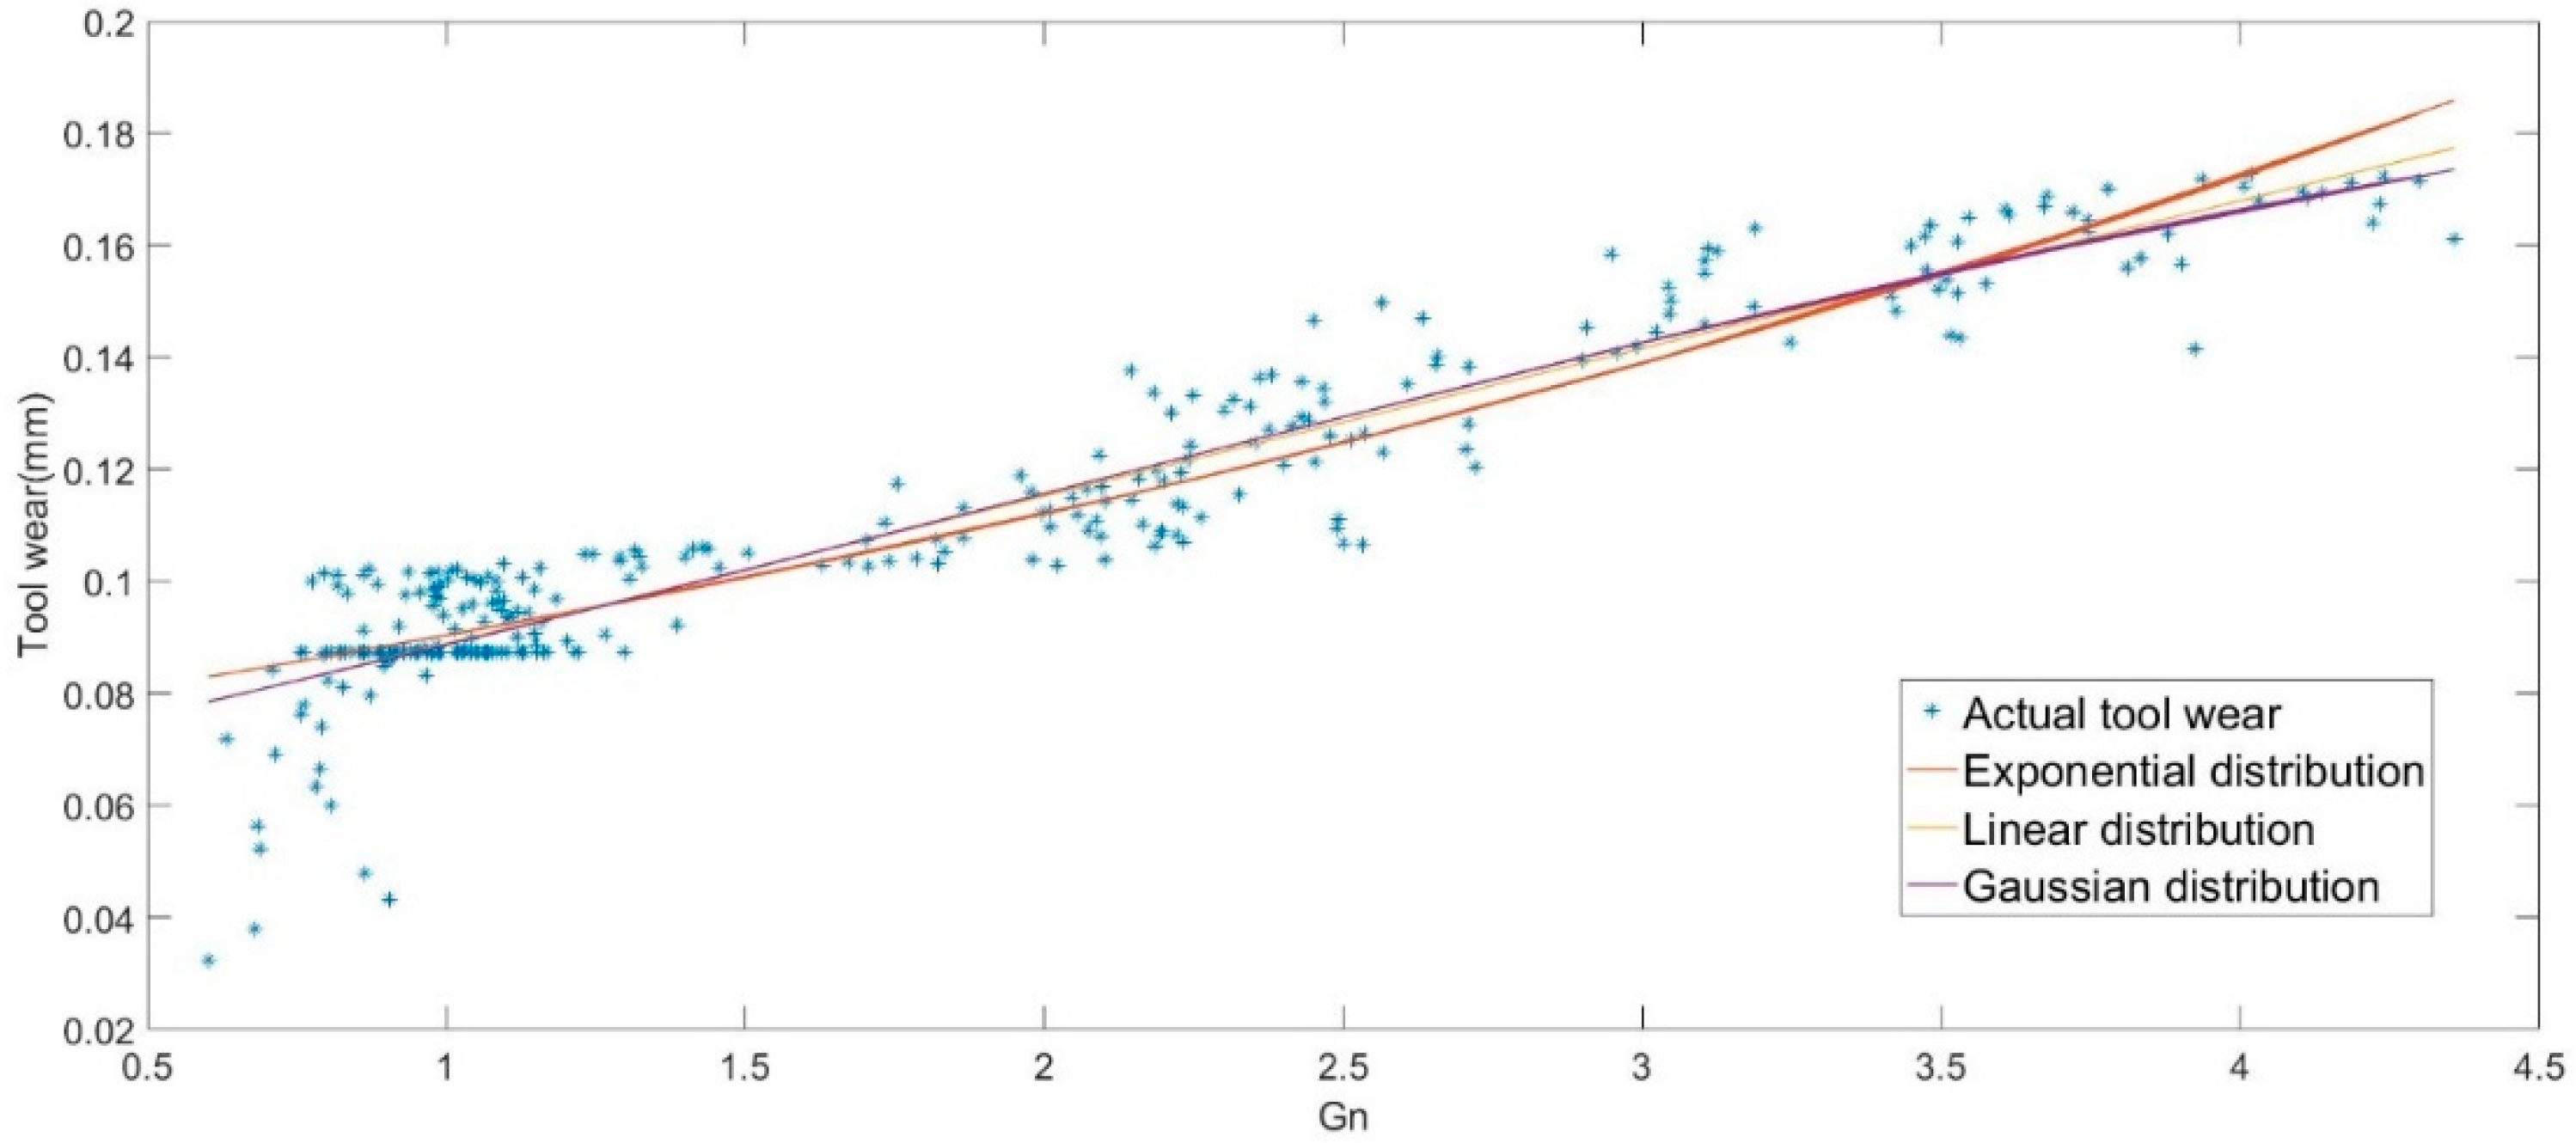
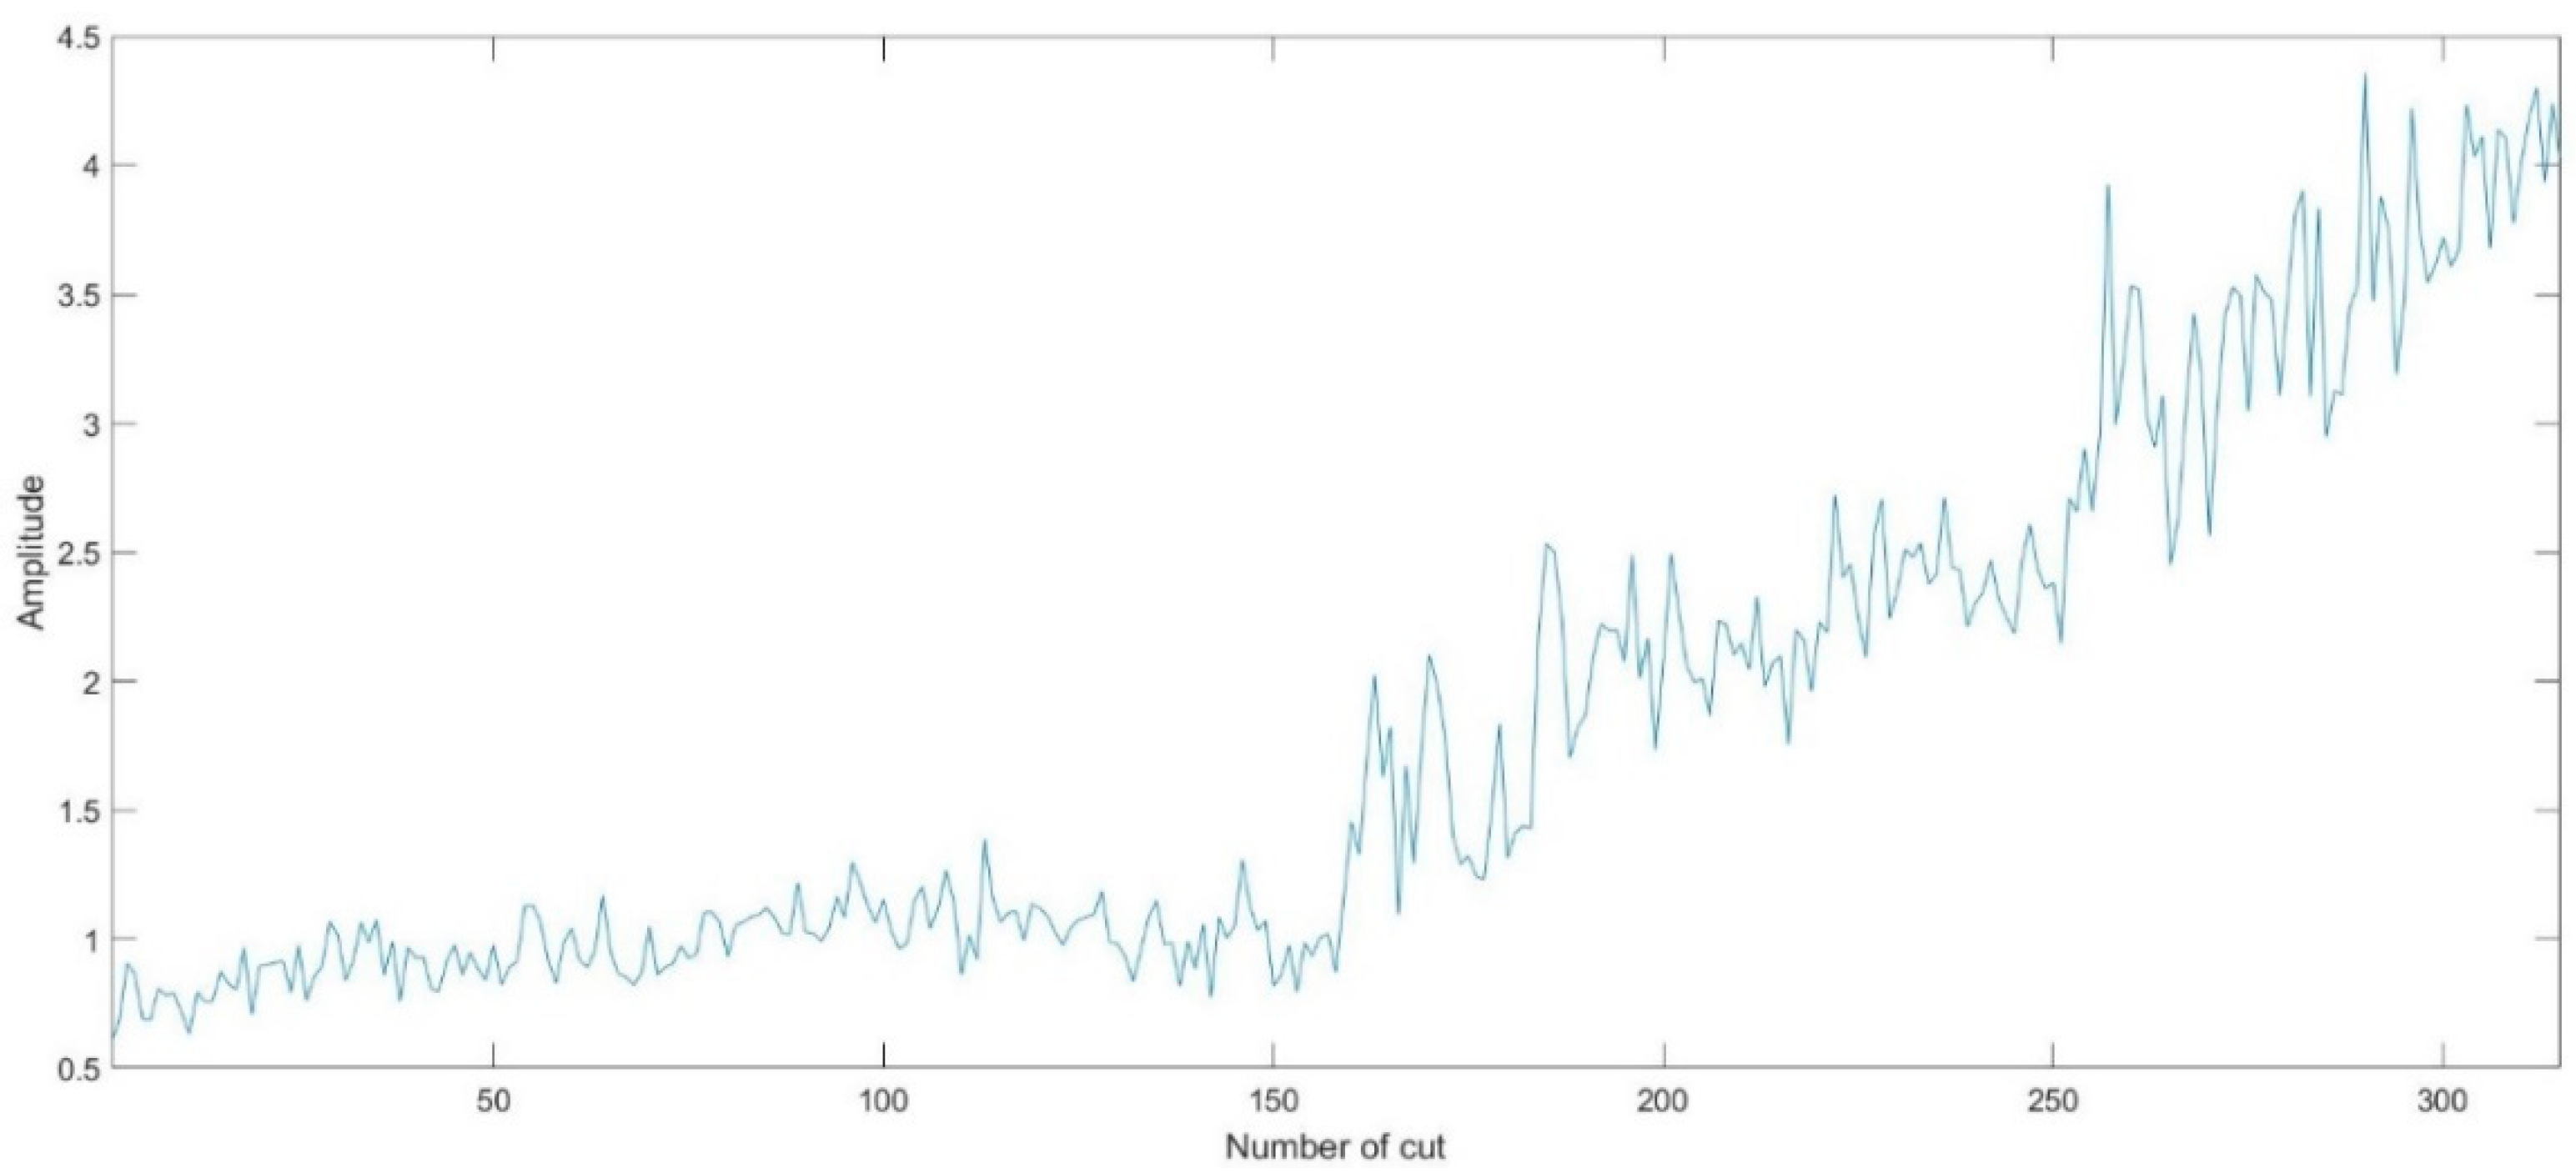
3.4. Tool Wear Distribution Fitting and Parameters Calculation

Linear, exponential, and Gaussian distribution as the alternatives are chosen to calculate the parameters of distribution depending on the distribution between the feature value and the tool wear. Table 2 is the parameter a, b, and c calculated of these distribution, and root mean square error (RMSE) is also shown in table below. RMSE of the table below illustrates that Gaussian distribution provides the best fit to describe the tendency of tool wear.
As shown in Figure 7, linear distribution fitting curve, exponential distribution fitting curve, and Gaussian distribution fitting curve are compared with actual tool wear depending on these parameters calculated in Table 2. Figure 7 presents that the three distributions are similar in accuracy and all fit well, which indicates that the wear is related to the feature value. According to the Figure 7 and Table 2, Gaussian distribution is selected as the fitting distribution.

4. Method Validation and Application

4.1. Validity of Tool Wear Estimation

Tool wear estimation is mainly based on the modal features of vibration signals in this work as the cutting vibration is highly sensitive to tool wear and can be measured with fairly good accuracy. The first step is to filter out the noise and remove non-cutting signals using EEMD. Then the main features were identified and captured from the vibration signals using statistical methods.
Regardless of the emergency, tool wear should be a degradation process, similar to the wear process of most of mechanical part, and is an irreversible process. The actual degradation process of tool should be a monotonous process, and difficult to be obtained in the actual production, so the tool degradation process can be observed only through indirect methods. According to the method in the ‘Feature Extraction of Test Data’ section, vibration signals of test set are processed. Figure 8, shows the frequency spectrum of vibration signal IMF1 at different times of a milling experiment.
The feature value, Gn, can be calculated by the similar formula in Section 3.2 and the results are shown in Table 3.
The number of milling can be converted to the time according to the milling experiment scheme. So the estimated tool wear and the actual tool wear are calculated and compared in Table 4, simultaneously, to get the accuracy of the results, absolute error is also calculated and shown in table below.
These calculated results in table above suggest that the method can be used to estimate tool wear. In addition, Equation (11) can be optimized to improve accuracy, which will be researched in future work.

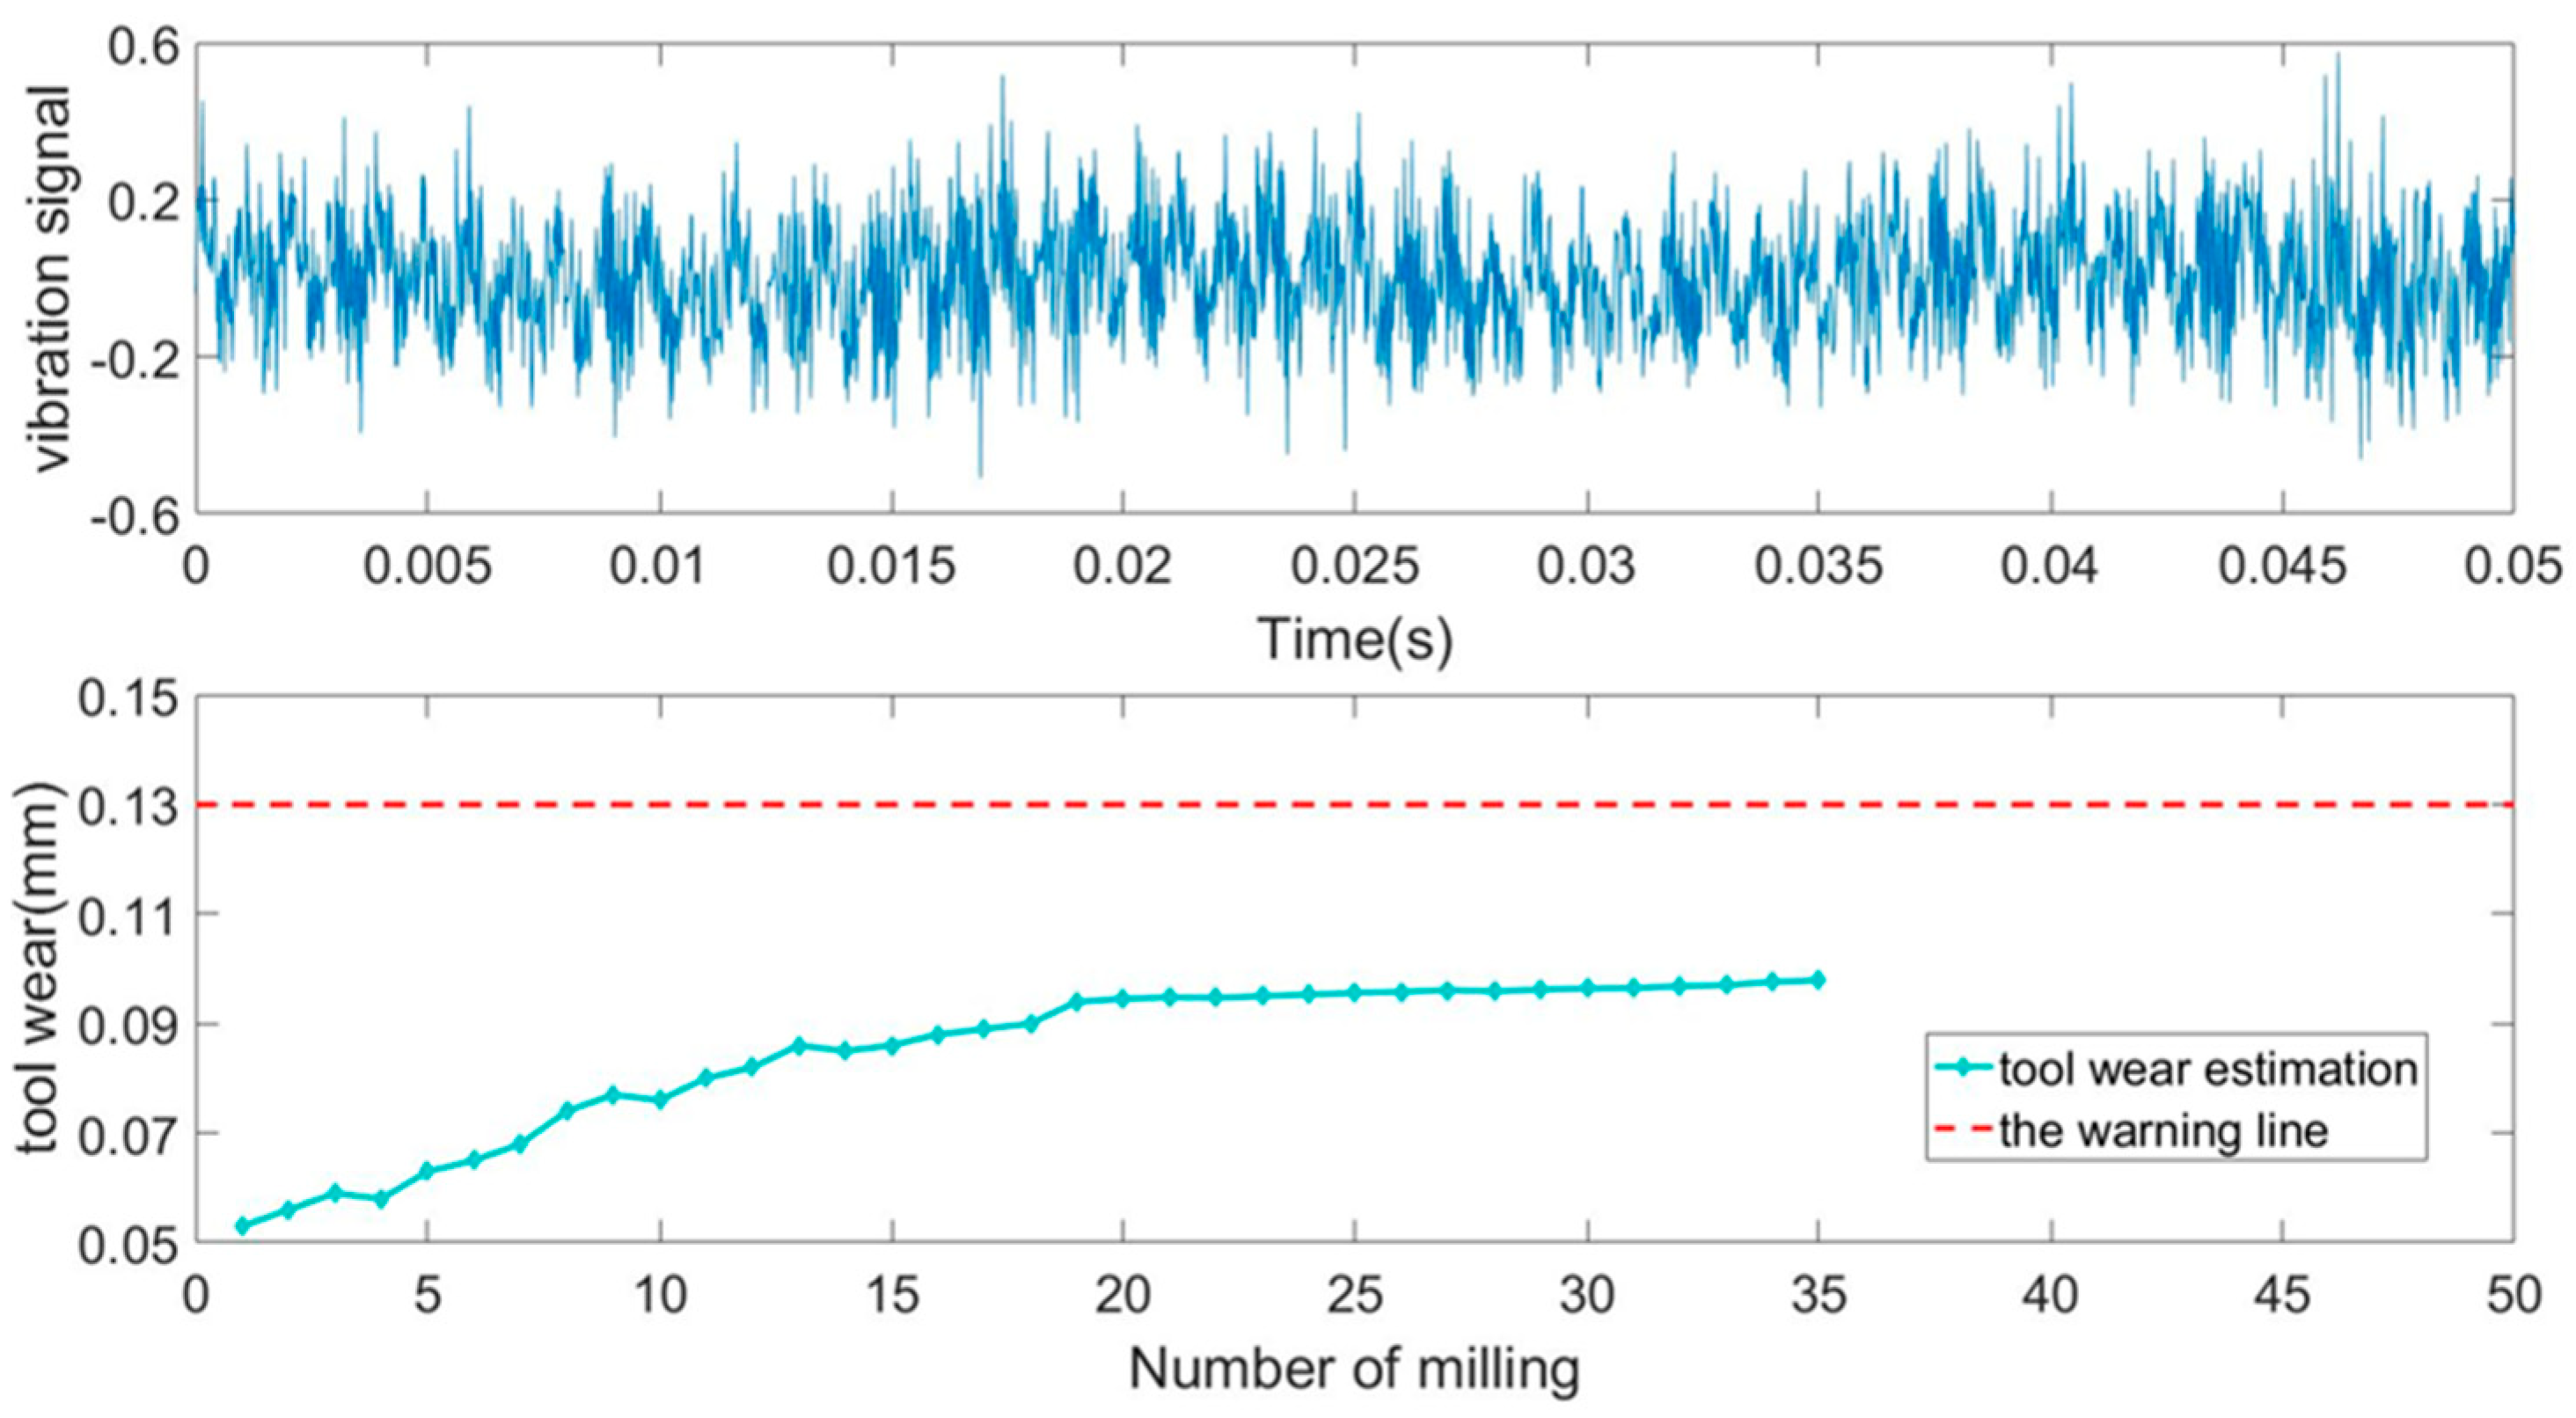
4.2. Tool Wear Real-Time Estimation and Early Warning

It is very important to identify tool wear and forecast tool failure in the milling process by monitored signals. To achieve this goal, the method is realized in MATLAB and the calculated results can be shown in time, from which tool condition monitoring and tool wear estimation can display concurrently As shown in Figure 9, real-time monitoring signals are displayed once per 0.05 s and tool wear estimation is updated a point after a milling, which is designed for about 4 s. Tool wear estimation can be calculated and shown timely during the milling process, which is a useful application in modern manufacturing industry. The warning line that is regarded as the maximum tool wear can be set according to actual processing requirements. In Figure 9, 0.13 mm is chosen as the safety tool wear line.
The figure is a screenshot of the dynamic display and tool wear estimation can be updated in real time according to machining signals.

5. Conclusions

Tool wear estimation is studied in this paper based on the modal analysis and curve fitting. An algorithm is developed for real-time estimation of tool wear through monitoring and decomposing sensor signals. The vibration signals have a larger correlation with tool wear, and under the condition that the actual vibration signals are easy to obtain, so the estimation method based on vibration signals is more practical. EEMD can decompose signals to multiple modes and reduce the mode mixing problem, which helps to improve the accuracy in estimation by feature extraction. The Gaussian fitting function provides the best fit to describe the trend that the tool wear changes with the features, and root mean square error (RMSE) is only 0.0093. The viability of the method is tested with the tool milling experiments and absolute error is controlled within 0.025 mm. In further work, the method can be used to real-time estimate tool wear. The paper contributes in a modal way to our understanding of tool wear and provides a basis for wear estimation of tool by modal analysis. Notwithstanding the relatively limited sample, this work offers valuable insights into the works for tool wear, and the tool modal can be illustrated through the physical mechanism. The issue of the tool modes is an intriguing one which could be usefully explored and applied in manufacturing industry in further research.

Author Contributions

Y.C. devised and validated the model; W.D. conceived and designed the signal processing methods; Y.Z. and M.W. analyzed the data. Z.L. contributed to optimizing the programming.

Acknowledgments

This work was supported by National Science and Technology Major Project, China (No.2017ZX04008001), and National Defense Fundamental Research Foundation, China (No. JCKY2016601C006).

Conflicts of Interest

The authors declare no conflict of interest.

References

  1. Wang, Y.; Jia, Y.; Yu, J.; Zheng, Y.; Yi, S. Failure probabilistic model of CNC lathes. Reliab. Eng. Syst. Saf. 1999, 65, 307–314. [Google Scholar] [CrossRef]
  2. Dai, Y.; Zhou, Y.F.; Jia, Y.Z. Distribution of time between failures of machining center based on type I censored data. Reliab. Eng. Syst. Saf. 2003, 79, 377–379. [Google Scholar] [CrossRef]
  3. Li, X.; Lim, B.S.; Zhou, J.H.; Huang, S.; Phua, S.J.; Shaw, K.C.; Er, M.J. Fuzzy neural network modelling for tool wear estimation in dry milling operation. In Proceedings of the Annual Conference of the Prognostics and Health Management Society, San Diego, CA, USA, 27 September–1 October 2009; pp. 1–11. [Google Scholar]
  4. Li, H.; Wang, Y.; Zhao, P.; Zhang, X.; Zhou, P. Cutting tool operational reliability prediction based on acoustic emission and logistic regression model. J. Intell. Manuf. 2015, 26, 923–931. [Google Scholar] [CrossRef]
  5. Wang, S.M.; Chen, Y.S.; Lee, C.Y.; Yeh, C.C.; Wang, C.C. Methods of In-Process On-Machine Auto-Inspection of Dimensional Error and Auto-Compensation of Tool Wear for Precision Turning. Appl. Sci. 2016, 6, 107. [Google Scholar] [CrossRef]
  6. Liu, G.; Chen, H.; Huang, Z.; Gao, F.; Chen, T. Surface Quality of Staggered PCD End Mill in Milling of Carbon Fiber Reinforced Plastics. Appl. Sci. 2017, 7, 199. [Google Scholar] [CrossRef]
  7. Kilickap, E.; Yardimeden, A.; Çelik, Y.H. Mathematical Modelling and Optimization of Cutting Force, Tool Wear and Surface Roughness by Using Artificial Neural Network and Response Surface Methodology in Milling of Ti-6242S. Appl. Sci. 2017, 7, 1064. [Google Scholar] [CrossRef]
  8. Caggiano, A. Tool Wear Prediction in Ti-6Al-4V Machining through Multiple Sensor Monitoring and PCA Features Pattern Recognition. Sensors 2018, 18, 823. [Google Scholar] [CrossRef] [PubMed]
  9. Rock, M.; Chen, J.; Tin, M. A Comprehensive Study on Tool-Wear Monitoring in High-Speed Machining Process by Using Multi-Sensor Operation. In Proceedings of the International Conference on Machining and Machinability of Materials, Venice, Italy, 8–9 August 2016. [Google Scholar]
  10. Cong, Y.; Lian, Y.; Guo, Y. Research on the Signal Processing Method for Balancing Measurement System Based on EEMD. In Proceedings of the 2015 8th International Symposium on Computational Intelligence and Design (ISCID), Hangzhou, China, 12–13 December 2015; pp. 418–421. [Google Scholar] [CrossRef]
  11. Lei, Y.; Kong, D.; Naipeng, L.I.; Lin, J. Adaptive Ensemble Empirical Mode Decomposition and Its Application to Fault Detection of Planetary Gearboxes. J. Mech. Eng. 2014, 50, 64. [Google Scholar] [CrossRef]
  12. Jiang, H.; Li, C.; Li, H. An improved EEMD with multiwavelet packet for rotating machinery multi-fault diagnosis. Mech. Syst. Signal Process. 2013, 36, 225–239. [Google Scholar] [CrossRef]
  13. Lei, Y.; Zuo, M.J. Fault diagnosis of rotating machinery using an improved HHT based on EEMD and sensitive IMFs. Meas. Sci. Technol. 2009, 20, 125701. [Google Scholar] [CrossRef]
  14. Li, T.; Zhang, F.; Jiang, J. Structural modal parameters indentification method based on hilbert-huang transform and independent component technique. Foreign Electron. Meas. Technol. 2014, 3, 42–45. [Google Scholar]
  15. Huang, S.N.; Tan, K.K.; Wong, Y.S.; Silva, C.W.D.; Goh, H.L.; Tan, W.W. Tool wear detection and fault diagnosis based on cutting force monitoring. Int. J. Mach. Tools Manuf. 2007, 47, 444–451. [Google Scholar] [CrossRef]
  16. Sharma, V.S.; Sharma, S.K.; Sharma, A.K. Cutting tool wear estimation for turning. J. Intell. Manuf. 2008, 19, 99–108. [Google Scholar] [CrossRef]
  17. Alonso, F.J.; Salgado, D.R. Analysis of the structure of vibration signals for tool wear detection. Mech. Syst. Signal Process. 2008, 22, 735–748. [Google Scholar] [CrossRef]
  18. Snr, D.E.D. The Correlation of Vibration Signal Features to Cutting Tool Wear in a Metal Turning Operation. Int. J. Adv. Manuf. Technol. 2002, 19, 705–713. [Google Scholar]
  19. Wu, Z.; Huang, N.E. Ensemble Empirical mode decomposition: A noise-assisted data analysis method. Adv. Adapt. Data Anal. 2009, 1, 1–41. [Google Scholar] [CrossRef]
Figure 1. The flowchart of the method.
Applsci 08 00708 g001
Figure 2. Time-dependent chart and frequency spectrums of vibration signals and intrinsic mode functions (IMFs) by ensemble empirical mode decomposition (EEMD).
Applsci 08 00708 g002
Figure 3. Tool conditions monitoring in high speed milling process.
Applsci 08 00708 g003
Figure 4. Vibration signals of tool in the milling process.
Applsci 08 00708 g004
Figure 5. The first IMF frequency spectrum of vibration signals at the different stage. (a) The first IMF frequency spectrum of vibration signals at the initial stage; (b) The first IMF frequency spectrum of vibration signals at the middle stage; (c) The first IMF frequency spectrum of vibration signals at the late stage.
Applsci 08 00708 g005
Figure 6. Time-dependent trend chart for Gn of vibration signals in the milling process.
Applsci 08 00708 g006
Figure 7. The tool wear fitting distribution figure.
Applsci 08 00708 g007
Figure 8. Frequency spectrum of vibration signal IMF1 at different times of milling experiment. (a) Frequency spectrum of vibration signal IMF1 at 85th milling experiment; (b) Frequency spectrum of vibration signal IMF1 at 185th milling experiment; (c) Frequency spectrum of vibration signal IMF1 at 285th milling experiment.
Applsci 08 00708 g008
Figure 9. The tool wear real-time monitoring graph.
Applsci 08 00708 g009
Table 1. Correlation coefficients for vibration with tool wear.
GroupsIn X DirectionIn Y DirectionIn Z Direction
10.96050.95740.9337
20.93280.92780.9467
30.93700.94060.9220
Table 2. Estimated parameters of distribution.
DistributionLinearExponentialGaussian
a0.026350.072890.192
b0.062550.21486.261
c--5.985
root mean square error (RMSE)0.00940.00990.0093
Table 3. Gn value of in the milling.
Number of Cut85185285
Gn1.12102.53292.9481
Table 4. Comparison of estimated and actual tool wear.
Time (s)Estimated Tool Wear (mm)Actual Tool Wear (mm)Absolute Error (mm)
3760.09180.08740.0044
8160.13030.10650.0238
12560.14130.15830.017

