Article

Experimental Analysis on Pre-Stress Friction Loss of Crushed Limestone Sand Concrete Beams

School of Civil Engineering and Mechanics, Huazhong University of Science and Technology, Wuhan 430074, China
*
Author to whom correspondence should be addressed.
Appl. Sci. 2018, 8(5), 683; https://doi.org/10.3390/app8050683
Submission received: 21 March 2018 / Revised: 19 April 2018 / Accepted: 19 April 2018 / Published: 27 April 2018

Abstract

:
This paper presents an experimental research work that evaluates the pre-stress loss caused by friction in crushed limestone sand (CLS) concrete members with post-tensioning. A total of 26 full-scale pre-stressed concrete beams were constructed and tested for the friction loss experiment. The considered variables mainly included the duct-forming materials, wires of tendons and arrangement of ducts. The tensile forces at both active and passive ends of specimen were recorded by steps, and then the pre-stress friction loss for each case was calculated. The result shows that the proportion of pre-stress friction loss in specimen with multi-wire tendons is in the range of 10–40%, with the trend first increasing before decreasing. The pre-stress friction loss in specimen with curve duct accounts for 10–30%. The pressure on the curved part definitely increases the friction when compared with the straight duct. The pre-stress friction loss in specimen with rubber hose reaches nearly 40%, which is larger than the metal bellow and plastic bellow. The suggested values for each case are proposed for a deviation coefficient κ of 0.0017–0.007 and a friction coefficient μ of 0.108–0.858. This can provide reliable theoretical support for the design and construction.

Graphical Abstract

1. Introduction

Recently, manufactured sand has been deemed to be a suitable alternative to river sand for the application and substitution of concrete aggregate [1,2]. The crushed limestone sand is generally more angular, has rougher surface texture and larger amounts of fine sand. Compared with normal concrete, CLS concrete has high elastic modulus, strength and mechanical behavior [2]. Because of the advantages above, crushed limestone sand (CLS) concrete is widely used in pre-stressed structures [3,4].
The design for pre-stressed structures involves consideration of the effective force at each stage of loading, together with material properties and individual circumstances. Existing empirical formulas are employed to estimate pre-stress loss caused by elastic shortening, creep, shrinkage, friction, relaxation of the pre-stressed tendon and temperature [5,6,7,8,9]. Numerous factors influence the pre-stress loss of CLS concrete, including the type of cement, aggregates used, the mix of concrete, etc. CLS concrete with large elastic modulus is sensitive to the increase in concrete age, and the creep and shrinkage is more obvious than normal concrete [2]. When compared with long-term pre-stress loss [5,6,7,8], the instantaneous loss caused by friction also significantly affects the initial pre-stress force of the tendon [10,11,12,13,14,15]. The effective force inevitably decreases due to the friction loss between the pre-stressing tendon and duct [10]. Nowadays, extensive laboratory tests on pre-stress friction loss have been carried out. The Anchorage-Measurement-Access (AMA) system is the main experimental idea proposed for estimating the pre-stress friction loss [16]. Two full-scale pre-stressed concrete girders were constructed [17] and the influence at various pre-stress levels was discussed. The actual friction loss measured at low pre-stress levels was larger than the theoretical results, with the two eventually converging as the pre-stress level increased. The average pre-stress friction loss accounted for 10–20% of the initial tensile stress. Local bending of tendons at the continuous joint of pre-stress concrete girders may develop eccentricity, which leads to friction loss [18,19]. As the eccentricity increased, a pre-stress friction loss of 2.5% occurred. During experimental measurement and practical monitoring, the friction loss was shown to contribute a certain proportion of the tension control stress [20,21,22,23]. Therefore, the relevant estimation and calculation method had been explored and improved. Zhang et al. analyzed the relationship between the friction torque and tangent angle of curved duct under different tension levels, before effective formulas were derived to consider friction loss [24]. Guo simulated the space curve tendon means of the iterative method and proposed key parameters to predict the friction loss [25]. Wu et al. described the interactions between the tendon and concrete by the finite-element method, before establishing the numerical procedure to represent the friction and bond at the interface [26].
The friction loss is considered in two parts: the length effect and curvature effect. The deviation coefficient κ and friction coefficient μ are provided in current specifications for these effects [27]. These coefficients are determined by concrete properties, duct straightness and surface of tendon and its surrounding material. However, the properties of CLS concrete differ in elastic modulus, strength and surface texture [28,29]. Moreover, current on-site construction technique has been rapidly improved to strictly control duct straightness. At the same time, various duct-forming materials are utilized to satisfy requirement in engineering. There have been great differences between the friction loss predicted by specifications and measured values in some cases. The definition of friction loss should be dependent on specific conditions. Thus, the suggested values are not suitable for evaluating the pre-stress friction loss of CLS concrete. With the application of manufactured sand concrete in pre-stressed structures, a systematic study of the pre-stress friction loss is highly necessary.
In this paper, to accurately calculate the pre-stress friction loss in CLS concrete members with post-tensioning, 26 full-scale pre-stressed concrete beams were constructed based on two bridge projects. The tensile forces were applied and recorded through a loading and measuring system, then the pre-stress friction loss at each stress degree was calculated. Investigations have been carefully carried out to measure the effect of a variety of parameters, such as the duct-forming material (rubber hose, metal bellow and plastic bellow), wires of tendons (single-wire and multi-wire) and arrangement of ducts (straight and curve duct). The results show that the friction is influenced by multiple variables, with the pre-stress friction loss in each case having been compared. The deviation coefficient κ and friction coefficient μ are modified and proposed for the CLS concrete member with post-tensioning, which can provide theoretical support and suggestions for actual projects.

2. Experimental Program

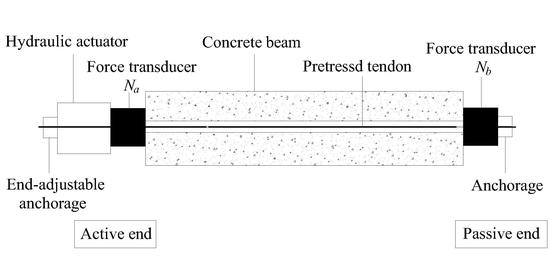
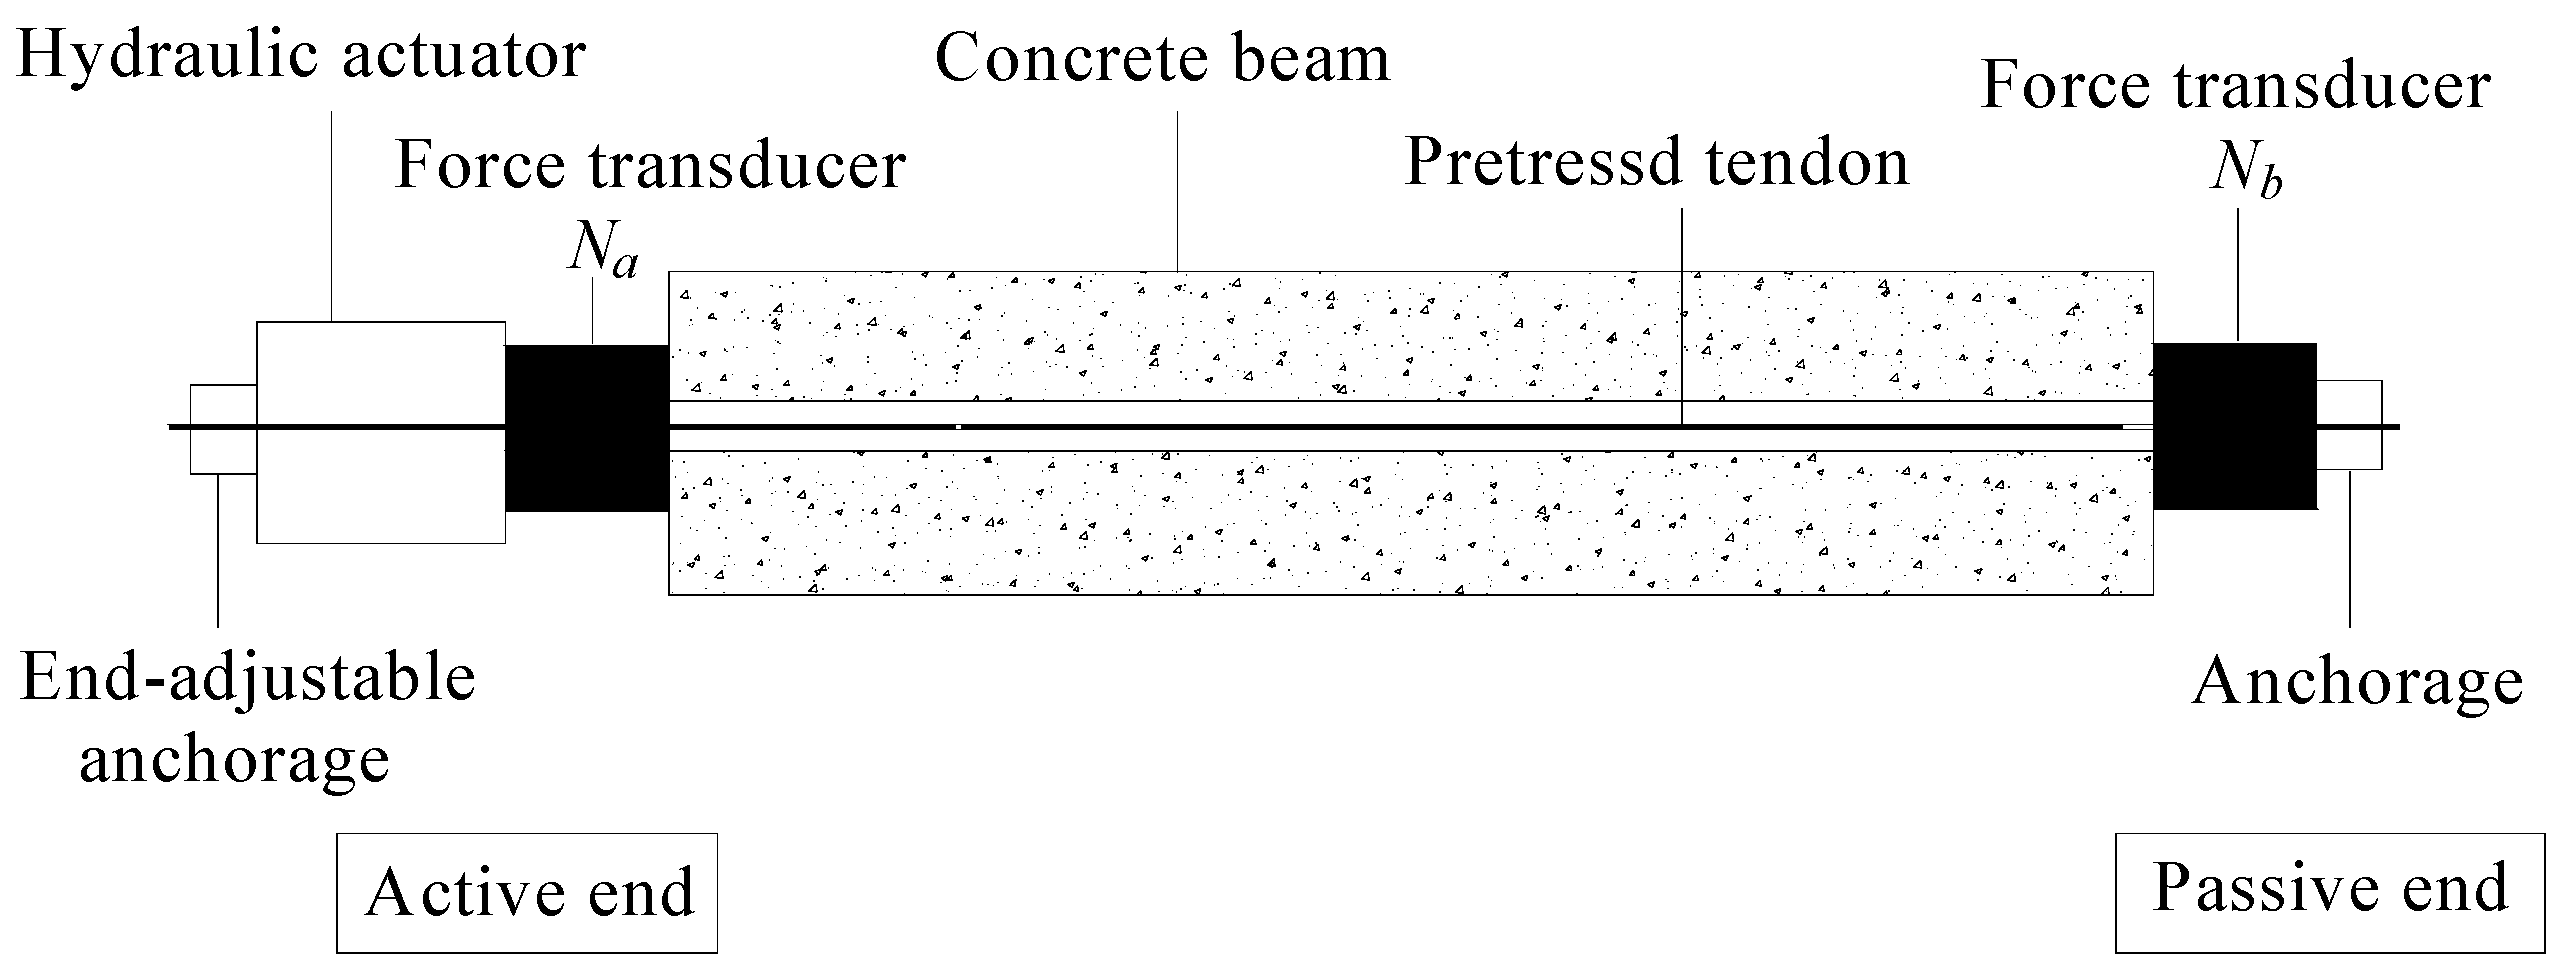
2.1. Theoretical Basis

Friction loss is conveniently considered in terms of the effect of length and curvature [27]. As shown in Figure 1, the pre-stressed tendons are first discrete, but they rearrange and squeeze against each other after tensioning. Consequently, certain friction occurs, which may resist the control stress. Furthermore, as shown in Figure 2, the location of tendon changes after tensioning. The effective length tends to be short and the local deviation cannot be ignored. Thus, the effective force should exclude the pre-stress loss caused by the friction and length deviation.
According to the Code for Design of Concrete Structures of China (GB50010-2010), the pre-stress loss caused by the first source is defined in Equations (1) and (2):
σ l 2 = σ con ( 1 1 e κ x + μ θ )
θ = α 2 + ϕ 2
where σl2 is pre-stress loss due to friction; κ is the influence coefficient of the frictional resistance caused by local deviation in unit length of the duct; μ is friction coefficient between the pre-stressed tendons and duct wall; σcon is the control stress under anchor; x is the projected length of duct; θ is the angle between the active end and tangent of duct; α is the angle between the tendon and the vertical axis; and φ is the angle between the tendon and the horizontal axis.
For straight steel tendons, θ can be regarded as 0 and κ is calculated as:
κ = ln ( 1 σ l 2 σ con ) x
Once κ is obtained, the μ for curve steel tendons is calculated as Equation (4):
μ = [ κ x + ln ( 1 σ l 2 σ con ) ] θ
The principle of least square method is adopted to reduce the errors and Equation (1) can be described as:
κ x + μ θ ln ( σ con σ con σ l 2 ) = 0
Therefore, the κ and μ can be obtained by at least two groups of data, while the certain error Δi of i-th pre-stressed tendon can be calculated according to Equation (6). Based on the maximum principle of the least square method, the sum of squares of Δi can be described as Equations (7) and (8):
ε = ln ( σ con σ con σ l 2 ) ,
κ x i + μ θ i ε i = Δ i
Ω = i = 1 n Δ i 2 = i = 1 n ( κ x i + μ θ i ε i ) 2
The error takes the minimum value when the partial derivatives are 0:
Ω μ = 0 Ω κ = 0
The equations for κ and μ are described as:
{ μ i = 1 n θ i 2 + κ i = 1 n θ i l i = i = 1 n ε i θ i μ i = 1 n l i θ i + κ i = 1 n l i 2 = i = 1 n ε i l i
where n is the quantity of ducts.
Thus, the κ and μ are precisely calculated after the data of li and εi are measured. The current specifications provide the suggested value of κ and μ for normal concrete as shown in Table 1 and Table 2 [20]. These codes indicate that the coefficients depend on tendon type and duct material.

2.2. Material Properties

This experimental research work is based on the projects of Malinghe Bridge and Wujiang Bridge in Guizhou Province, China. The CLS with a fineness modulus of 3.3 incorporated with 12.3% limestone dust (finer than 75 microns) was obtained from local production. The coarse aggregate contains crushed limestone with 5–31.5 mm of continuous gradation. According to GB50010-2010, the concrete is designed at a grade of C50 and the mix proportions are shown in Table 3. Three concrete cubes (150 mm × 150 mm × 150 mm) were tested at 28 days. The average compressive strength and elastic modulus was 58.6 MPa and 4.52 × 10⁴ MPa, respectively. The 7Φ5 low relaxation pre-stressed tendon is used in specimens, the standard strength is fpk = 1860 MPa and the non-pre-stressed bars have a grade of HRB335.

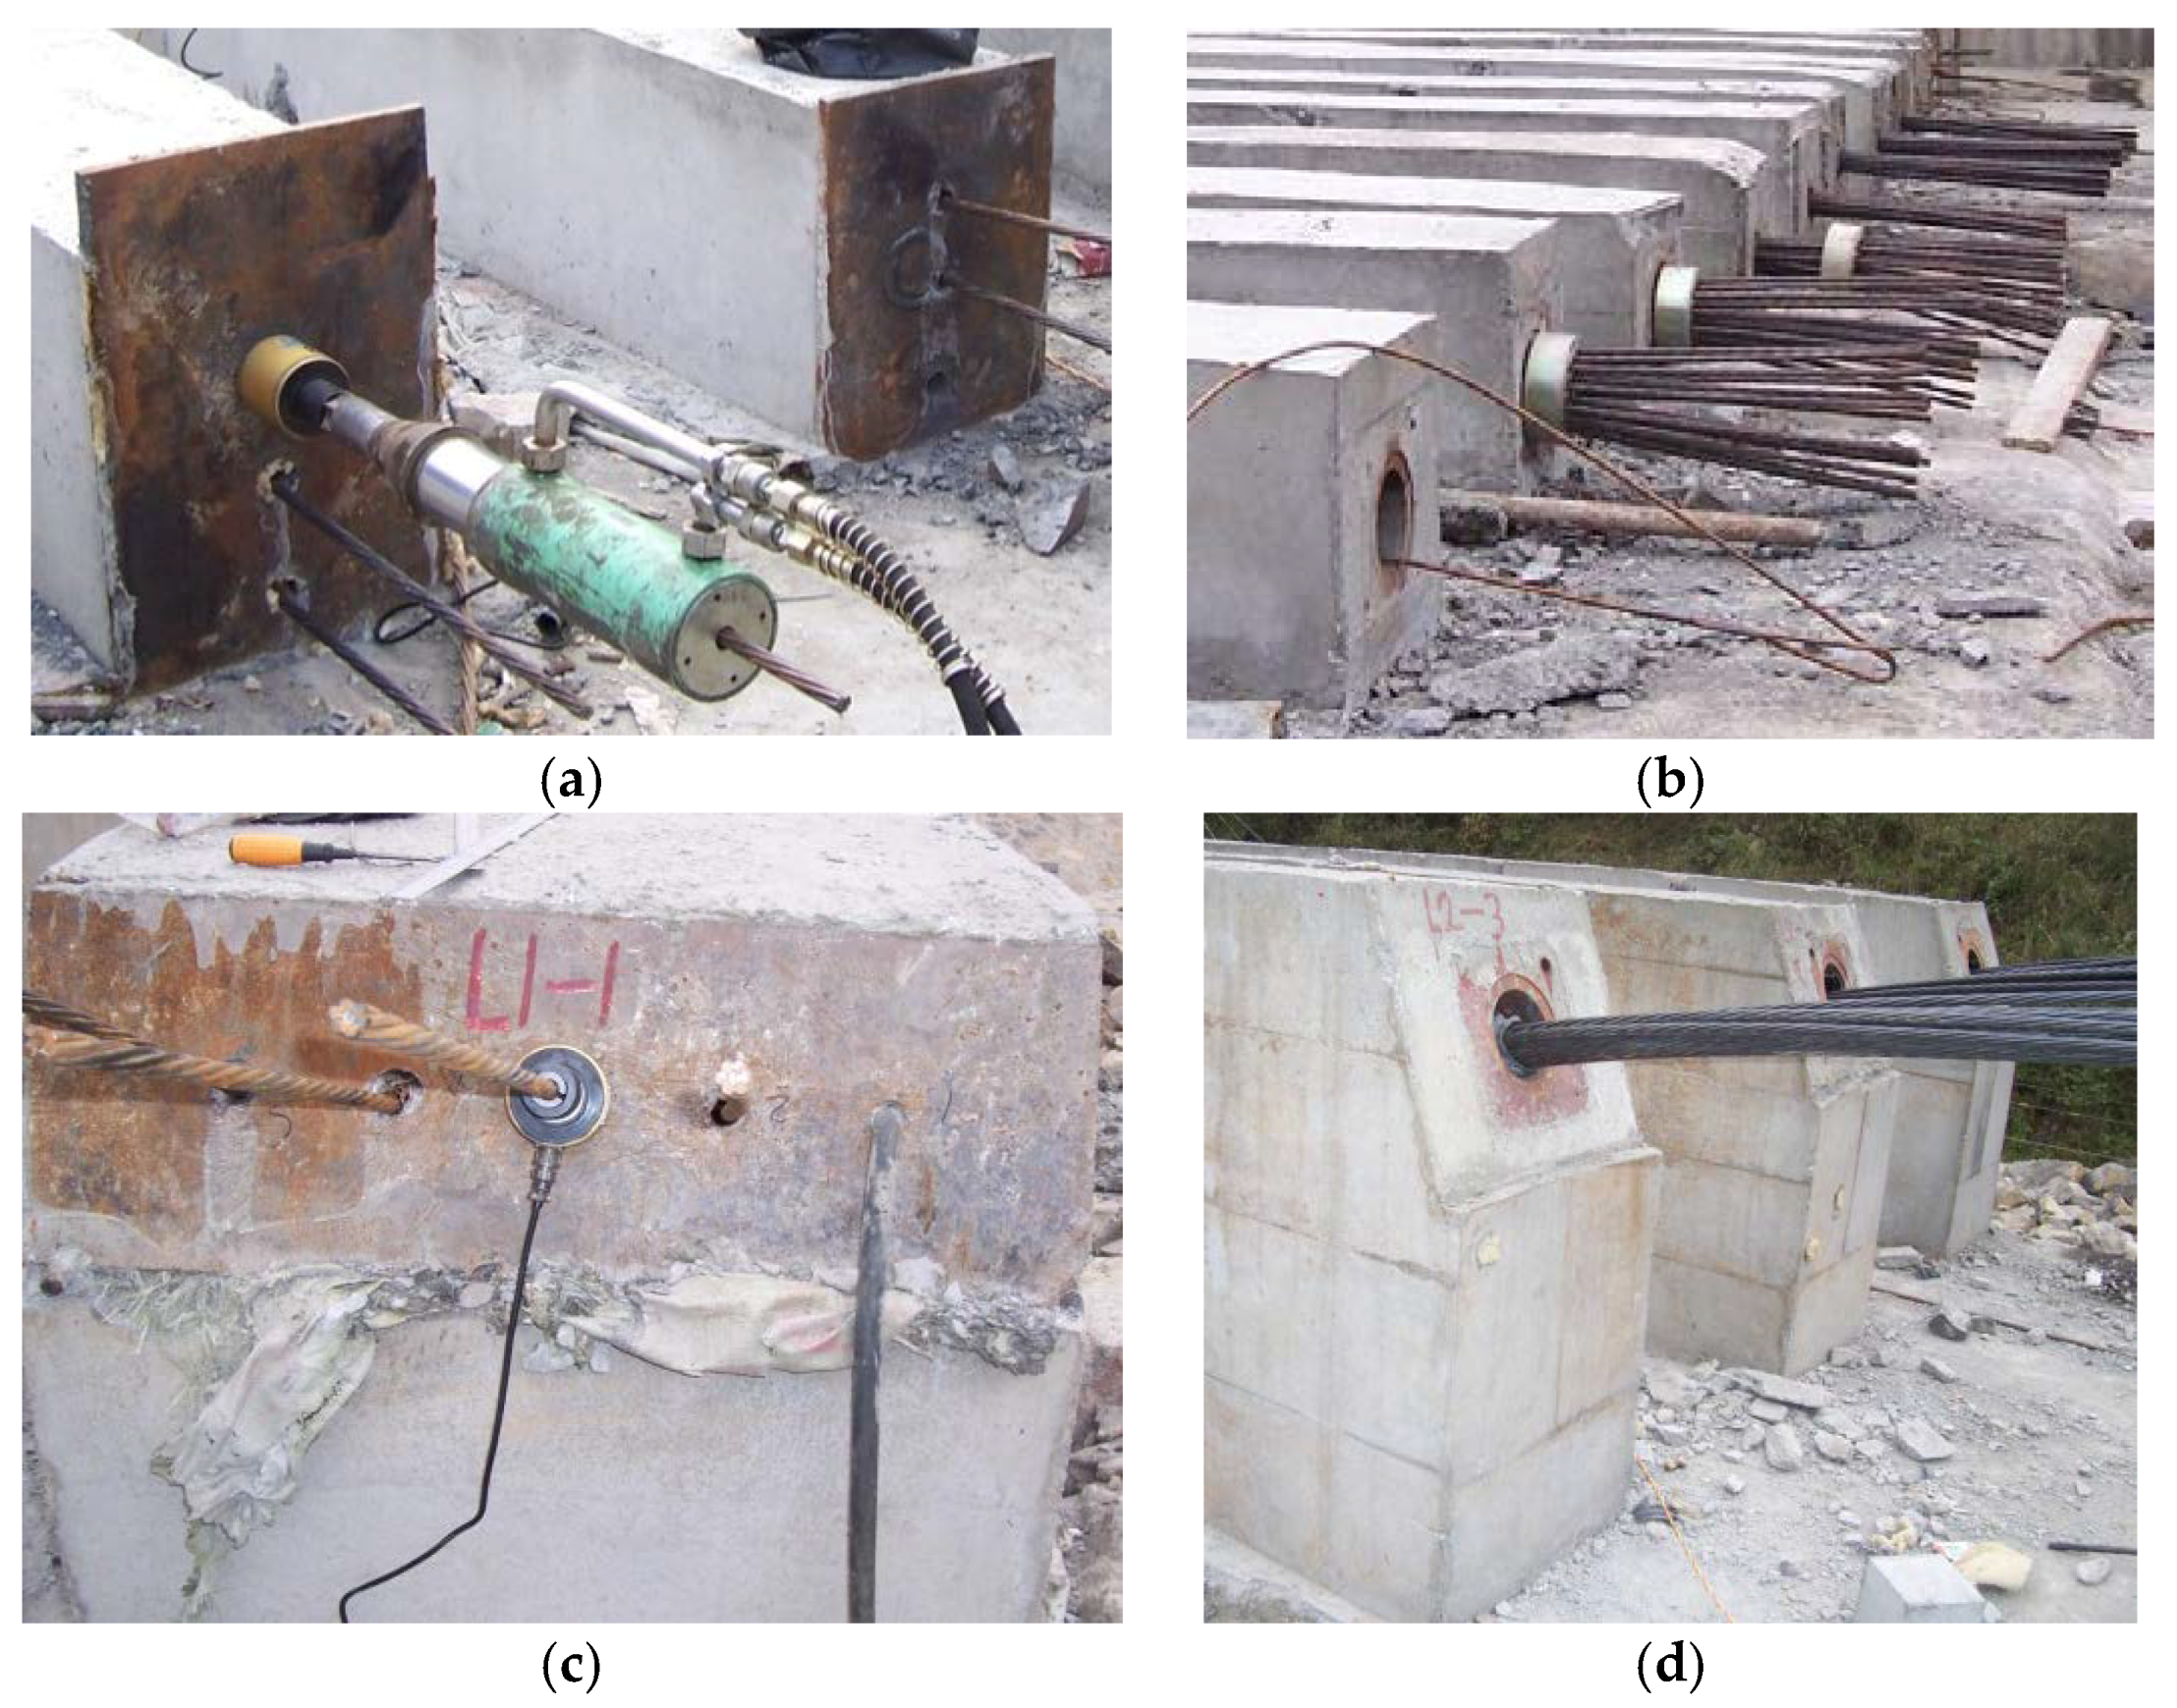
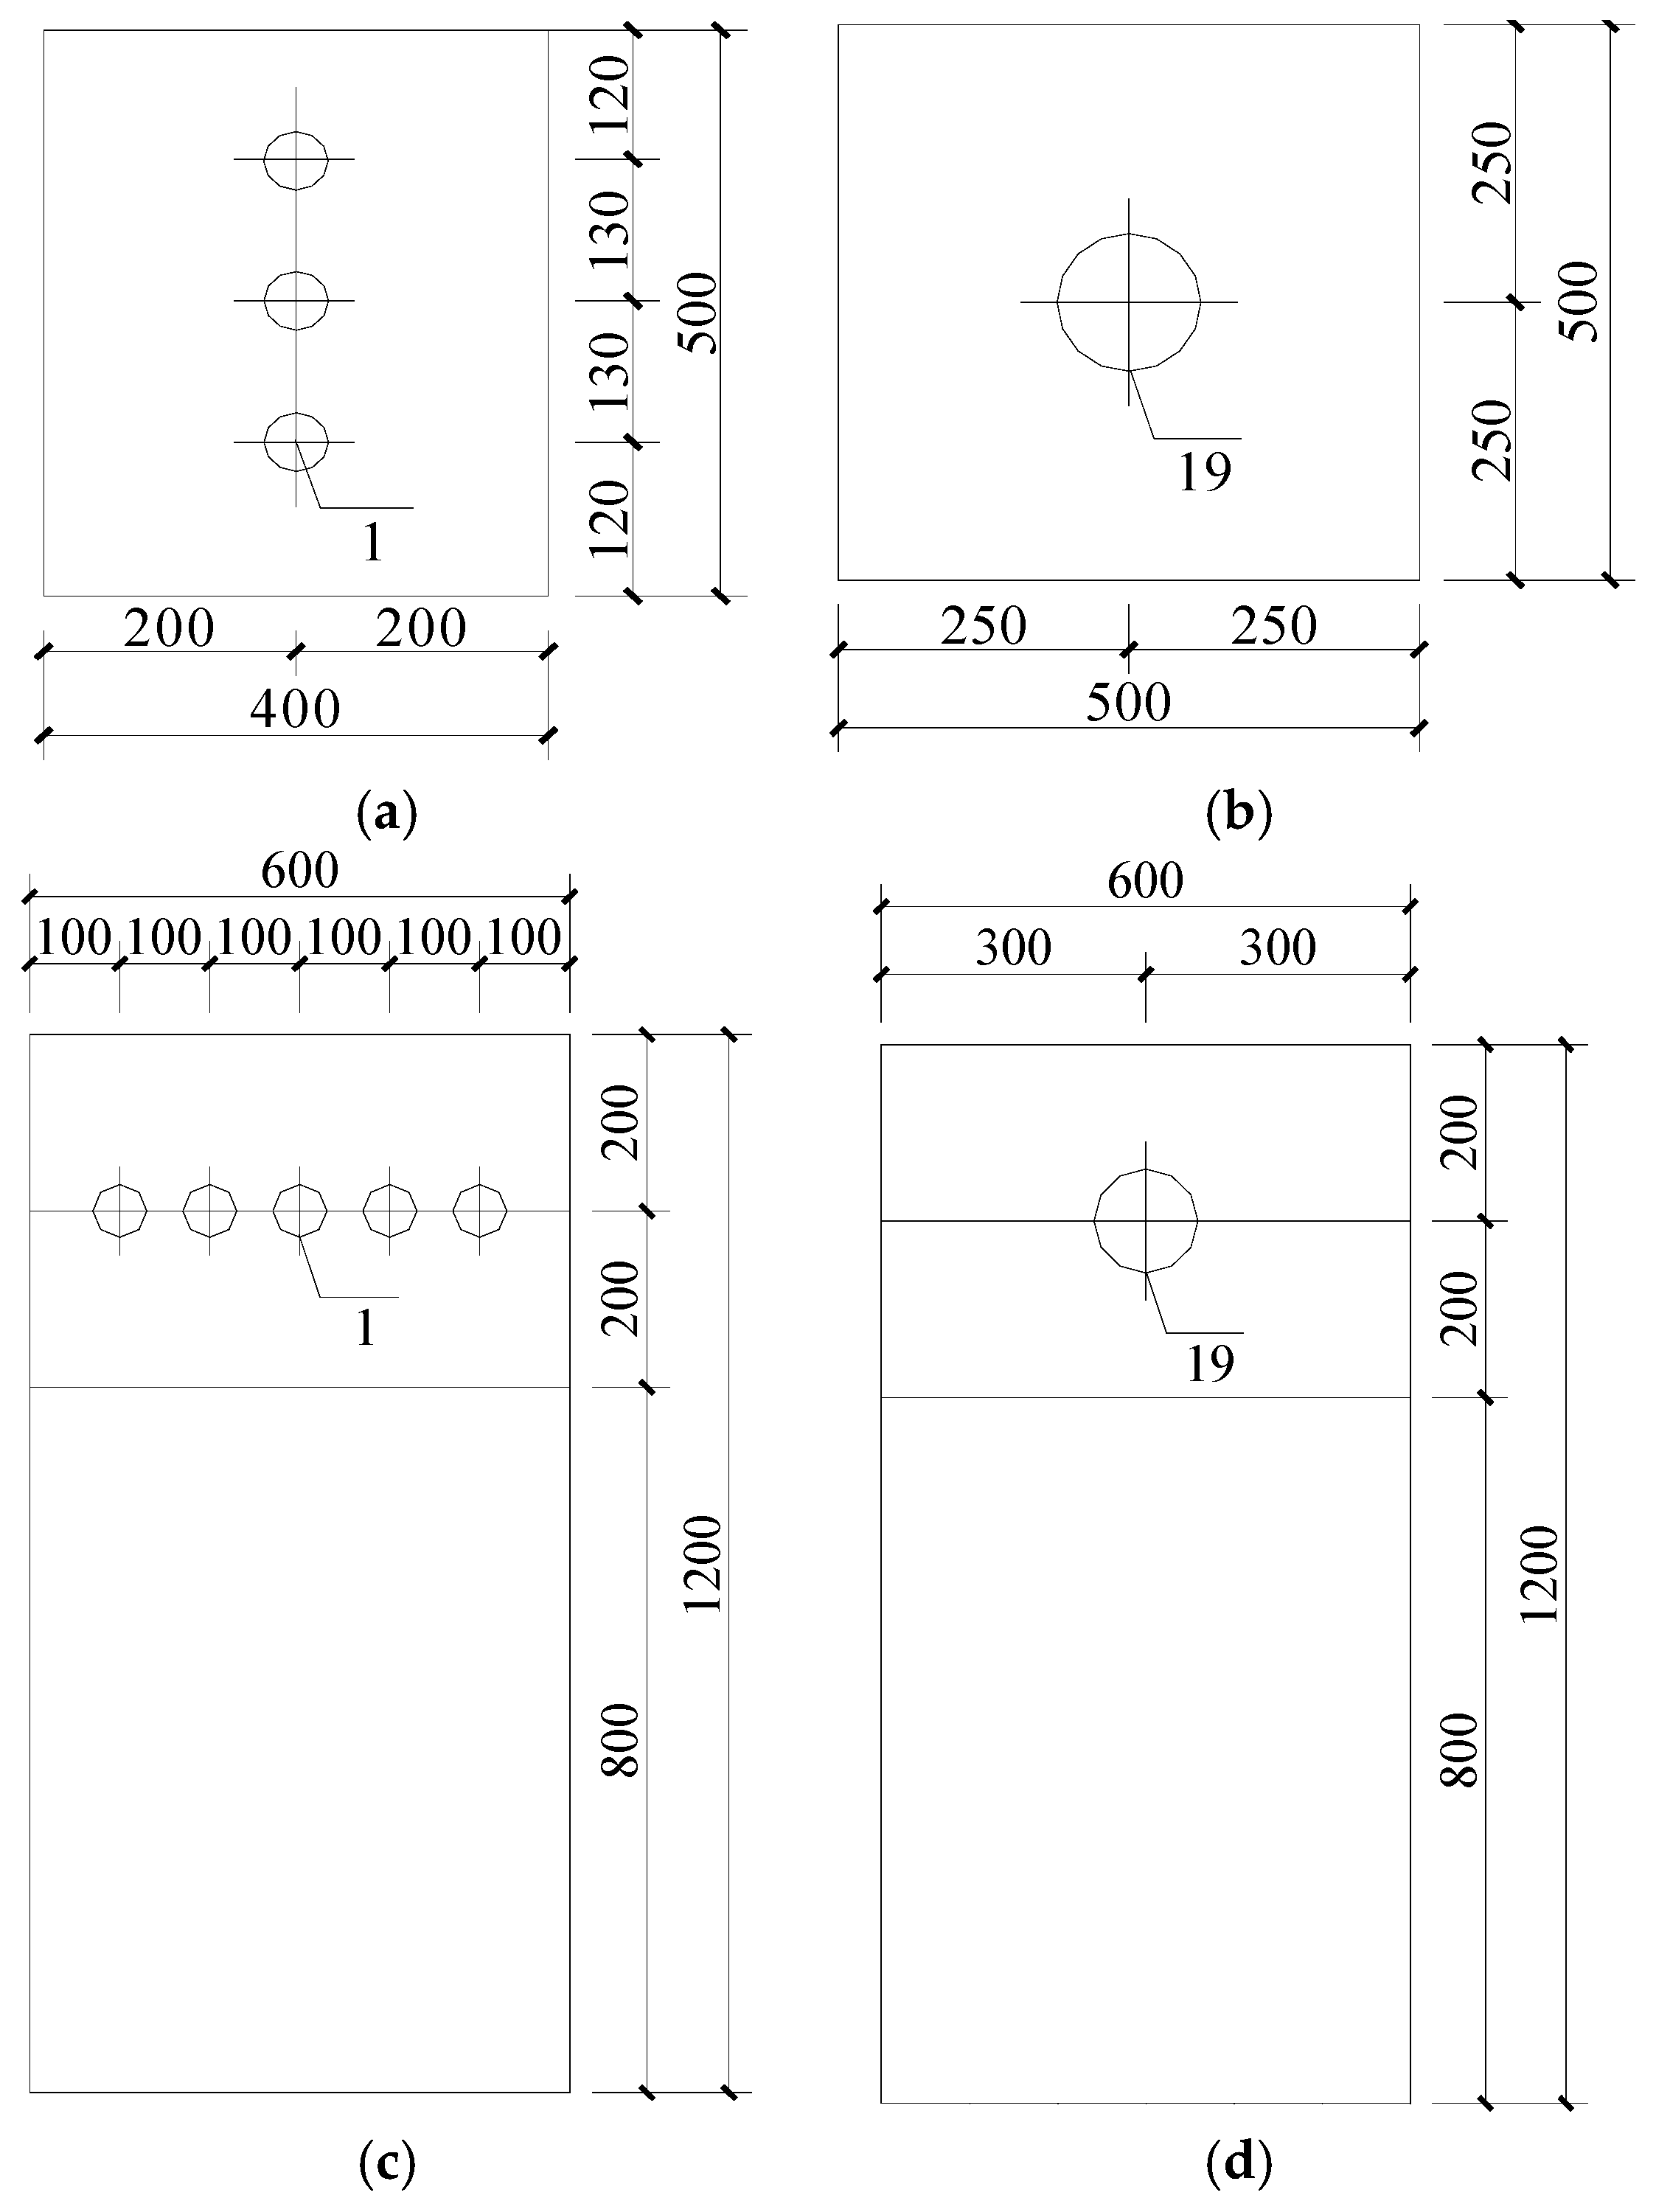
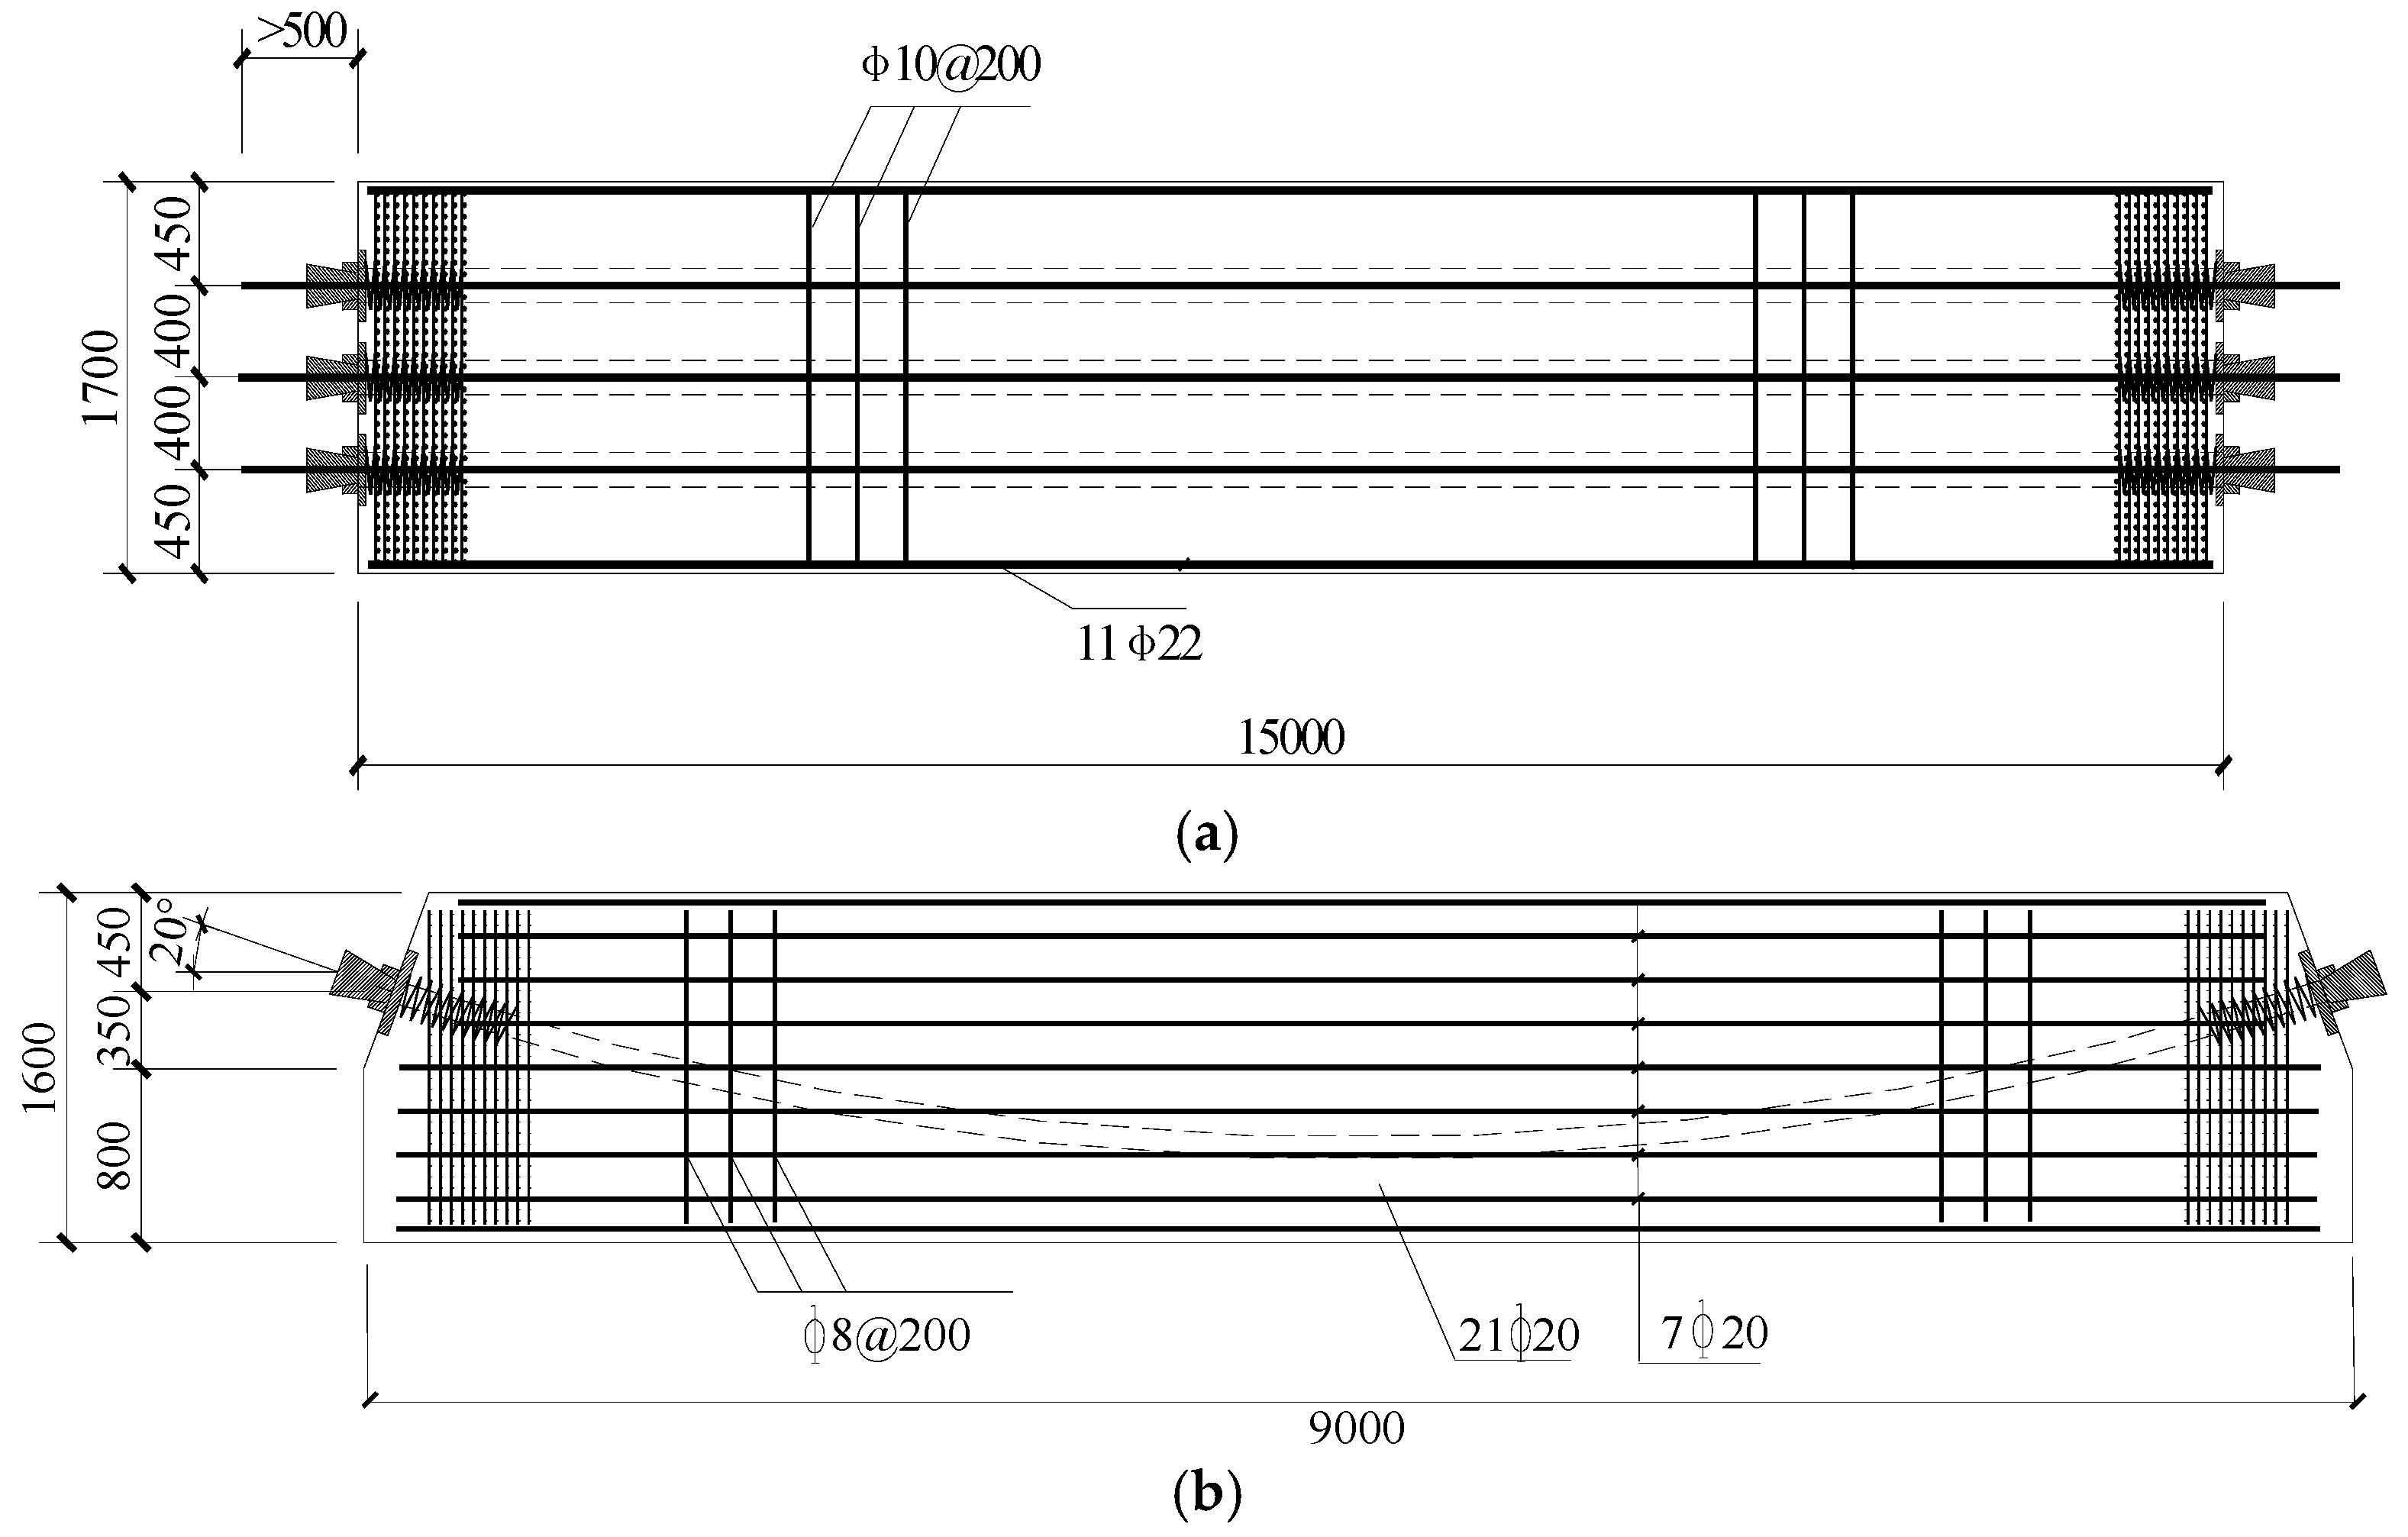
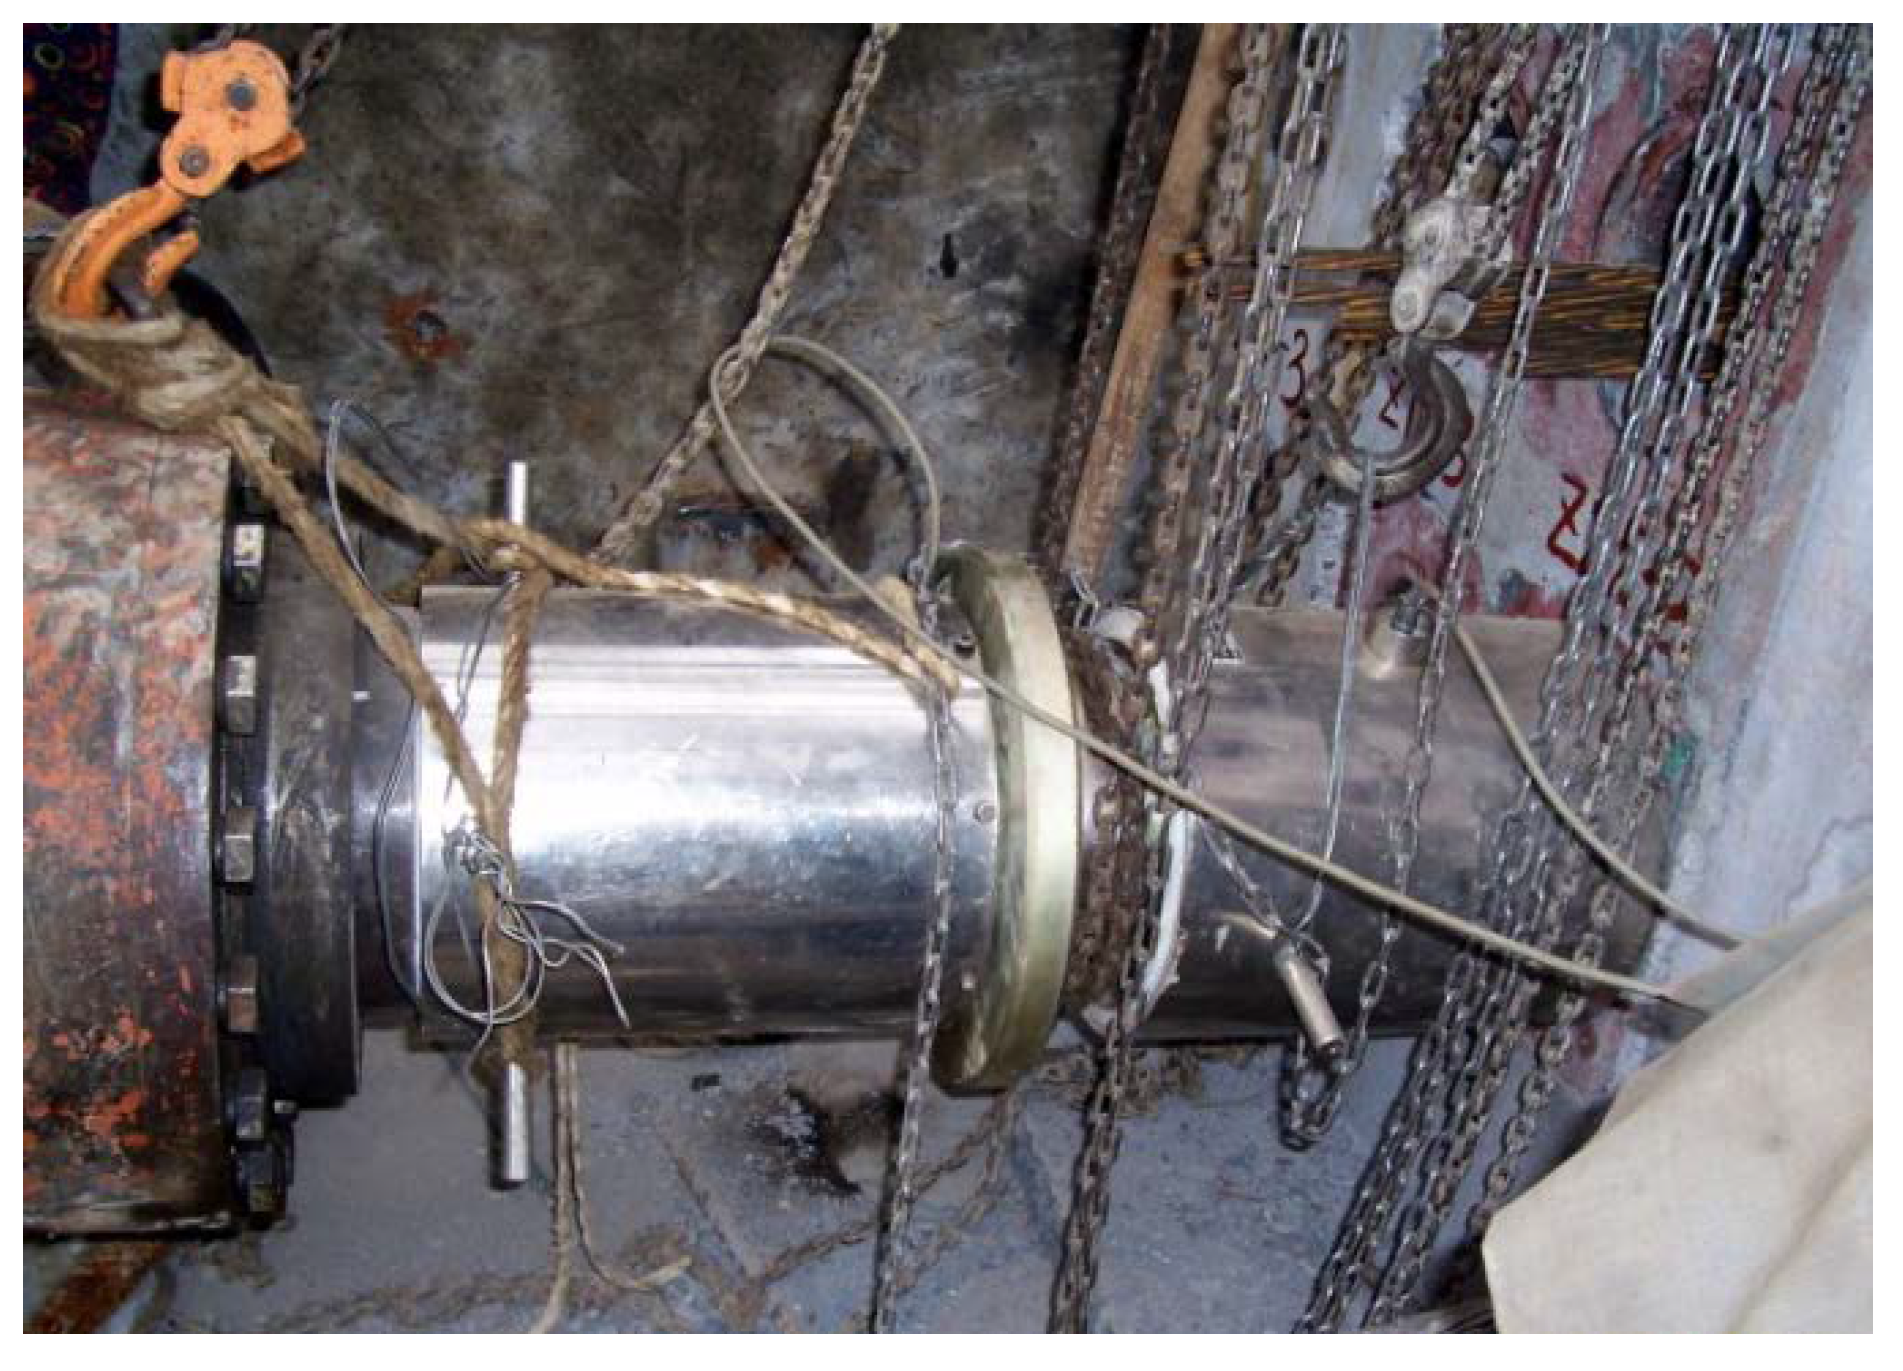
2.3. Specimen Fabrication and Testing Technique

An experiment on pre-stress friction loss in CLS concrete members with post-tensioning was conducted to investigate the following variables:
(1) The number of tendons: The number of tendons is calculated by the required equivalent load [27]. In large bridge engineering, the number of tendons in one duct is usually more than 10 wires. The interactive extrusion may cause certain friction between one tendon and another. With an increase in the number of tendons, the inner friction is more obvious. As a contrast, the single-wire is necessary.
(2) The arrangement of ducts: The straight duct cannot be perfectly linear due to small wobbles in the construction process, and tendons in the curve duct will produce a large normal pressure. Both two cases will lead to additional friction. First, κ is solved by Equation (3) in straight duct (θ = 0). Then, μ is calculated by Equation (4) based on the obtained κ. Thus, specimens with both straight and curve ducts are necessary.
(3) The duct-forming material: The rubber hose, metal bellow and plastic bellow are widely used for the duct in pre-stress engineering nowadays. The friction is directly determined by the smoothness of contact surface. Moreover, the amplitude of wobbles relies on the stiffness of duct material, so the pre-stress friction loss can obviously differ due to the duct-forming material properties.
The variables above are critical in influencing the friction loss. In this work, a series of full-scale pre-stressed concrete beams for post-tensioning were designed, including the three parameters above (Table 4). Based on the project of Malinghe Bridge, 3 concrete beams with a total of 30 ducts were constructed, which is shown in Figure 3 and Figure 4. Based on the project of Wujiang Bridge, 23 concrete beams with a total of 37 ducts were also constructed, which is shown in Figure 5 and Figure 6. Thus, at least 3 ducts are prepared for each case to ensure that the measured data are adequate and effective. It should be mentioned that the length of the specimen with a straight duct in the Malinghe Bridge project is shorter due to the limitations of local conditions.
Figure 7 shows the dimensions of specimens in Figure 4a,c (θ = 20°), and the reinforcement arrangements of other specimens are similar. Due to limitations of project, the cross-section of specimens is not unified. However, the friction loss mainly occurs along the length and there are no y-axis loss concerns. The non-prestressed bars are used to support the specimen and to prevent partial crushing at two ends, it hardly affects the pre-stress friction loss. Figure 8 shows the metal bellow and plastic bellow, and the rubber hose can be seen in Figure 6c.
Figure 9 shows the loading and measuring system. A hydraulic actuator with an end-adjustable anchorage device was installed at active end. Two force transducers were installed at both ends of the specimen. One was used to control the force from the hydraulic actuator and the other was used to record the force excluding the friction, which was then used to calculate σl2. The data acquisition system was connected to the force transducers, and the data can be directly recorded. The loading device is shown in Figure 10 with a control stress (σcon) of 0.75 fpk and the load is applied by steps. Six steps were set up, including 10%, 30%, 60%, 80%, 90% and 100% of σcon. At each level, the load was maintained for two minutes, before the values were recorded. It should be noticed that the elastic shortening is usually accompanied by the tensioning process [30]. However, for post-tensioning member, the concrete shortens as that tendon is jacked against the concrete. Since the force in the tendon is measured after the elastic shortening have taken place, so no loss in pre-stress due to that shortening need to be accounted for [27].

3. Test Result and Analysis

3.1. Measured Pre-Stress Loss

Based on the project of Malinghe Bridge, the forces of active and passive ends at different stress degrees were measured and the εi is calculated by Equations (6)–(8), as shown in Figure 11. According to the theoretical basis above, there is a positive correlation between εi and the pre-stress friction loss σl2. The standard deviation of εi in Figure 11 is 0.0311, 0.0253, 0.0646, 0.0118 and 0.0267. Despite certain discreteness, the pre-stress friction loss at each stress degree is generally stable. It should be mentioned that certain friction occurs in the 19-wire straight tendons during construction and installation, so the pre-stress friction loss at a low stress level is larger in Figure 11d. In most cases, the pre-stress friction loss in specimens with curve duct is relatively larger than that in straight duct.
Table 5 shows that pre-stress friction loss directly increases in each duct. The large normal pressure on the curved part increases the additional friction. The pre-stress friction loss is in the range of 2–10% in straight duct and 8–20% in curve duct.
As the number of tendons increases, the proportion of pre-stress friction loss first increases, but it subsequently decreases because that the increasing trend of total initial tension have exceeded the friction loss. The pre-stress loss is generally 4–16% in single-wire specimens, while 10–40% in multi-wire specimens. This illustrates that both duct arrangement and number of tendons have a great influence on pre-stress friction loss. The average value in each case is shown in Figure 12.
Based on the project of Wujiang Bridge, the εi at different stress degree is calculated as shown in Figure 13. The standard deviation of εi in Figure 13a–c is 0.2046, 0.1224 and 0.0477, indicating that pre-stress loss in metal bellow and plastic bellow is small and stable. The pre-stress friction loss for each case is shown in Table 6. The value in specimen with rubber hose is the largest and nearly reaches 40%, as shown in Figure 14. Mainly due to being flexible, the rubber hose can easily become deformed during construction and concrete pouring. The metal bellow and plastic bellow have a relatively larger stiffness and smoother contact surface, allowing for the quality and precision to be strictly controlled. The duct-forming materials also significantly influence the friction loss.

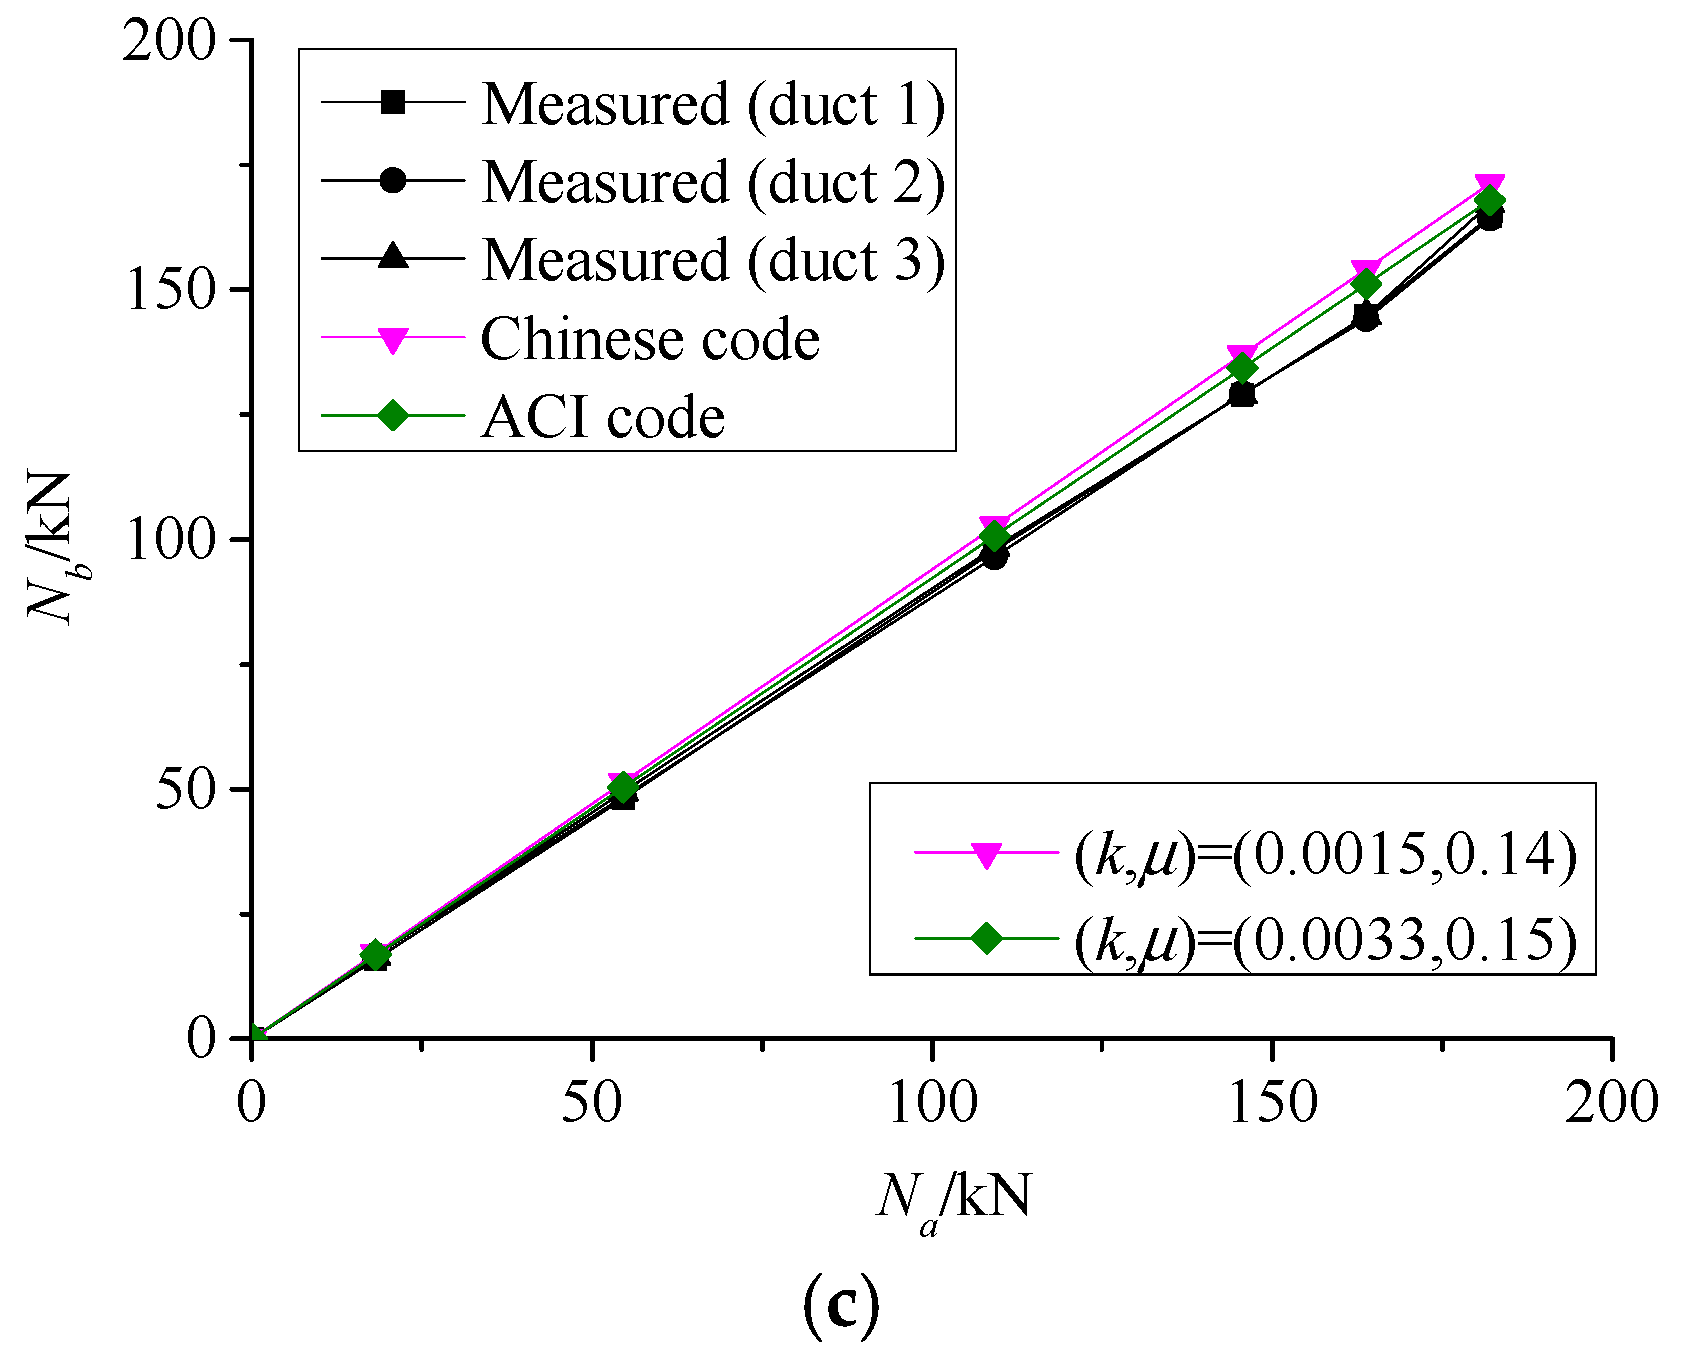
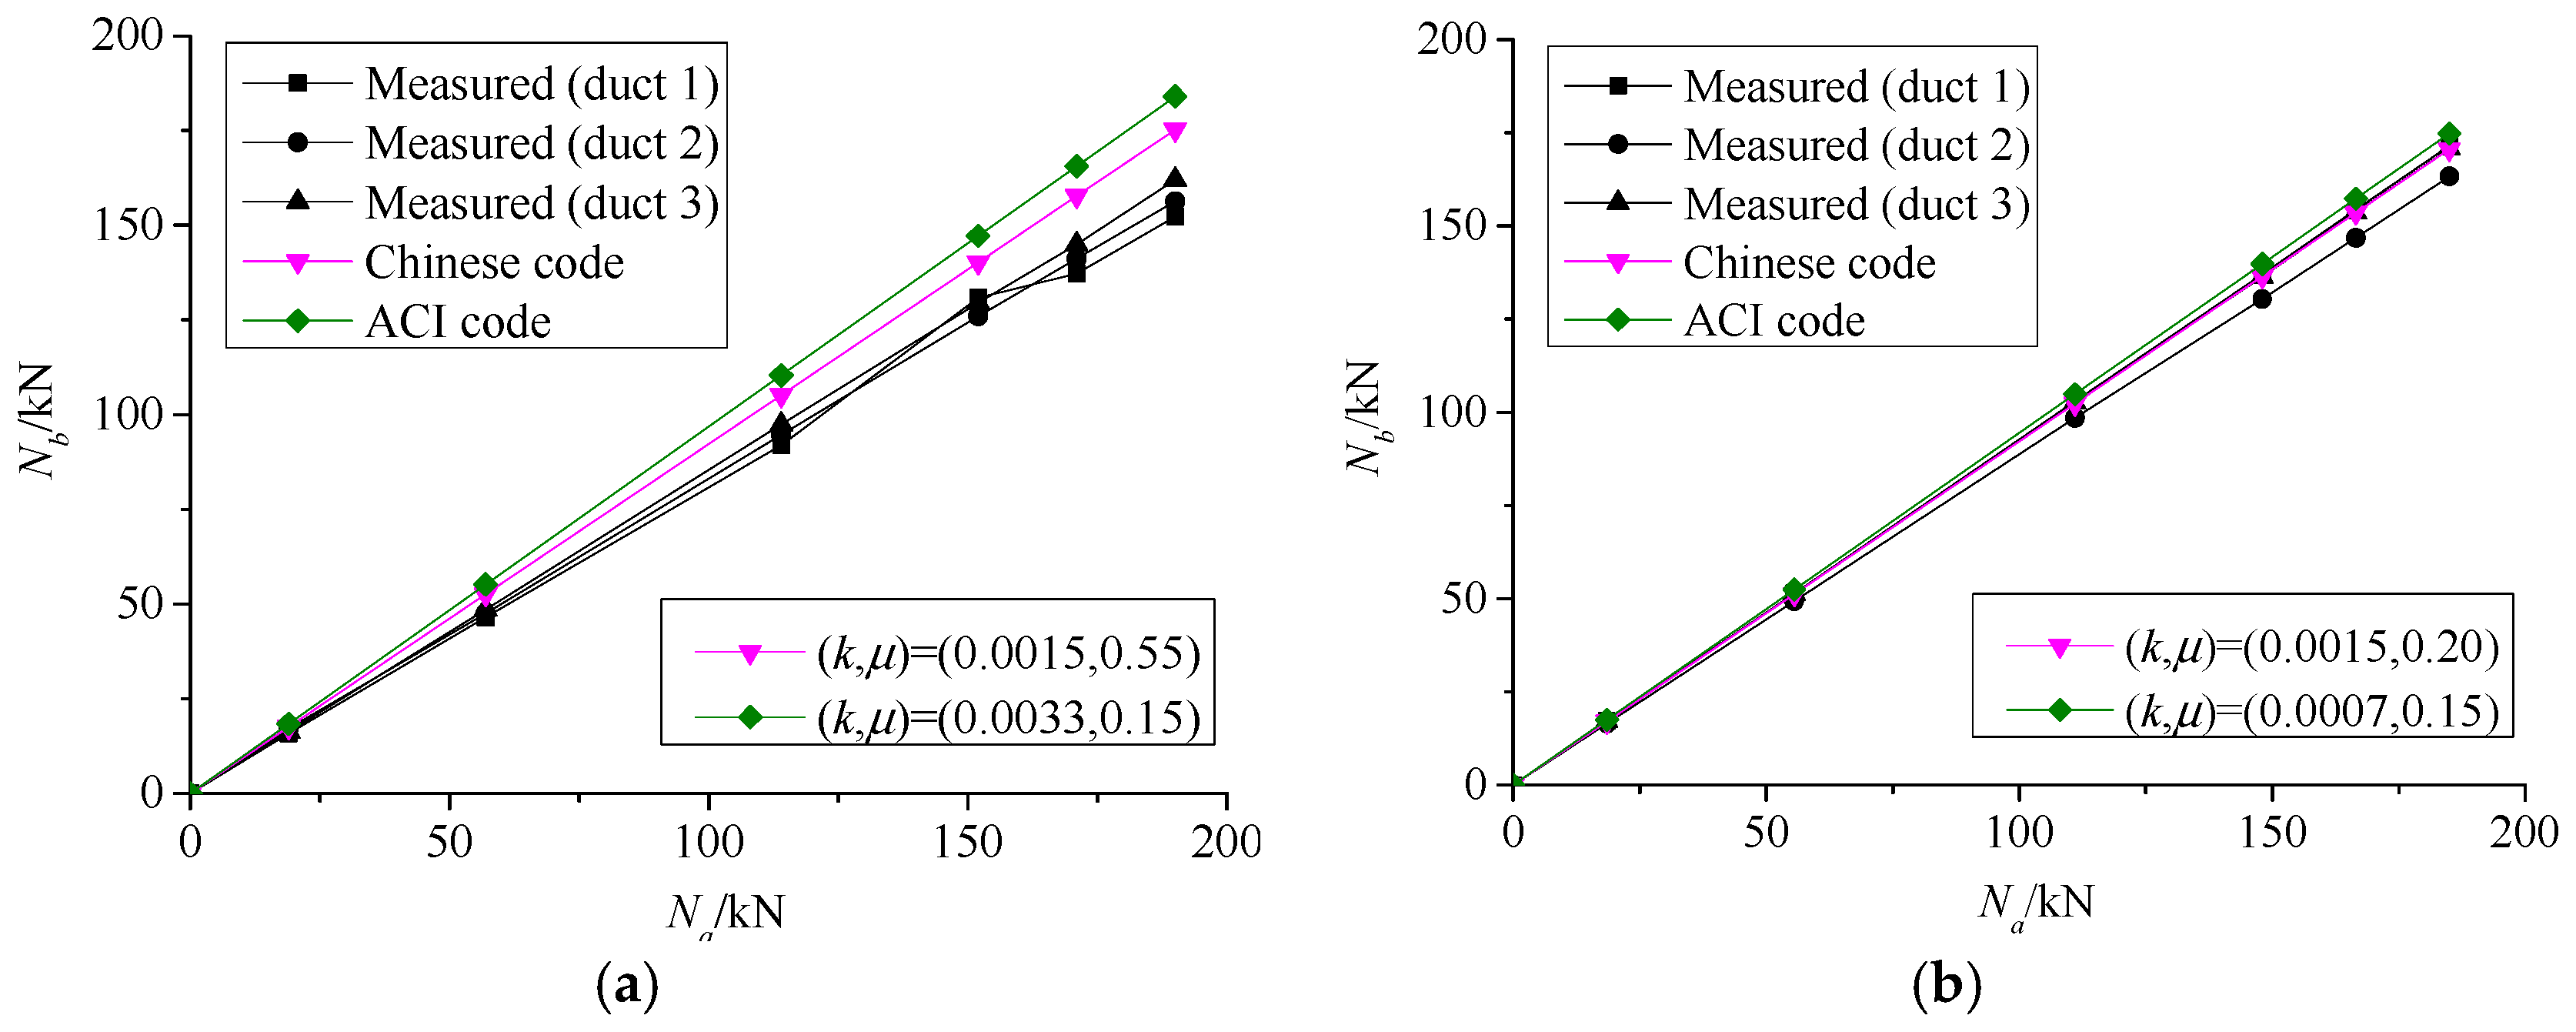
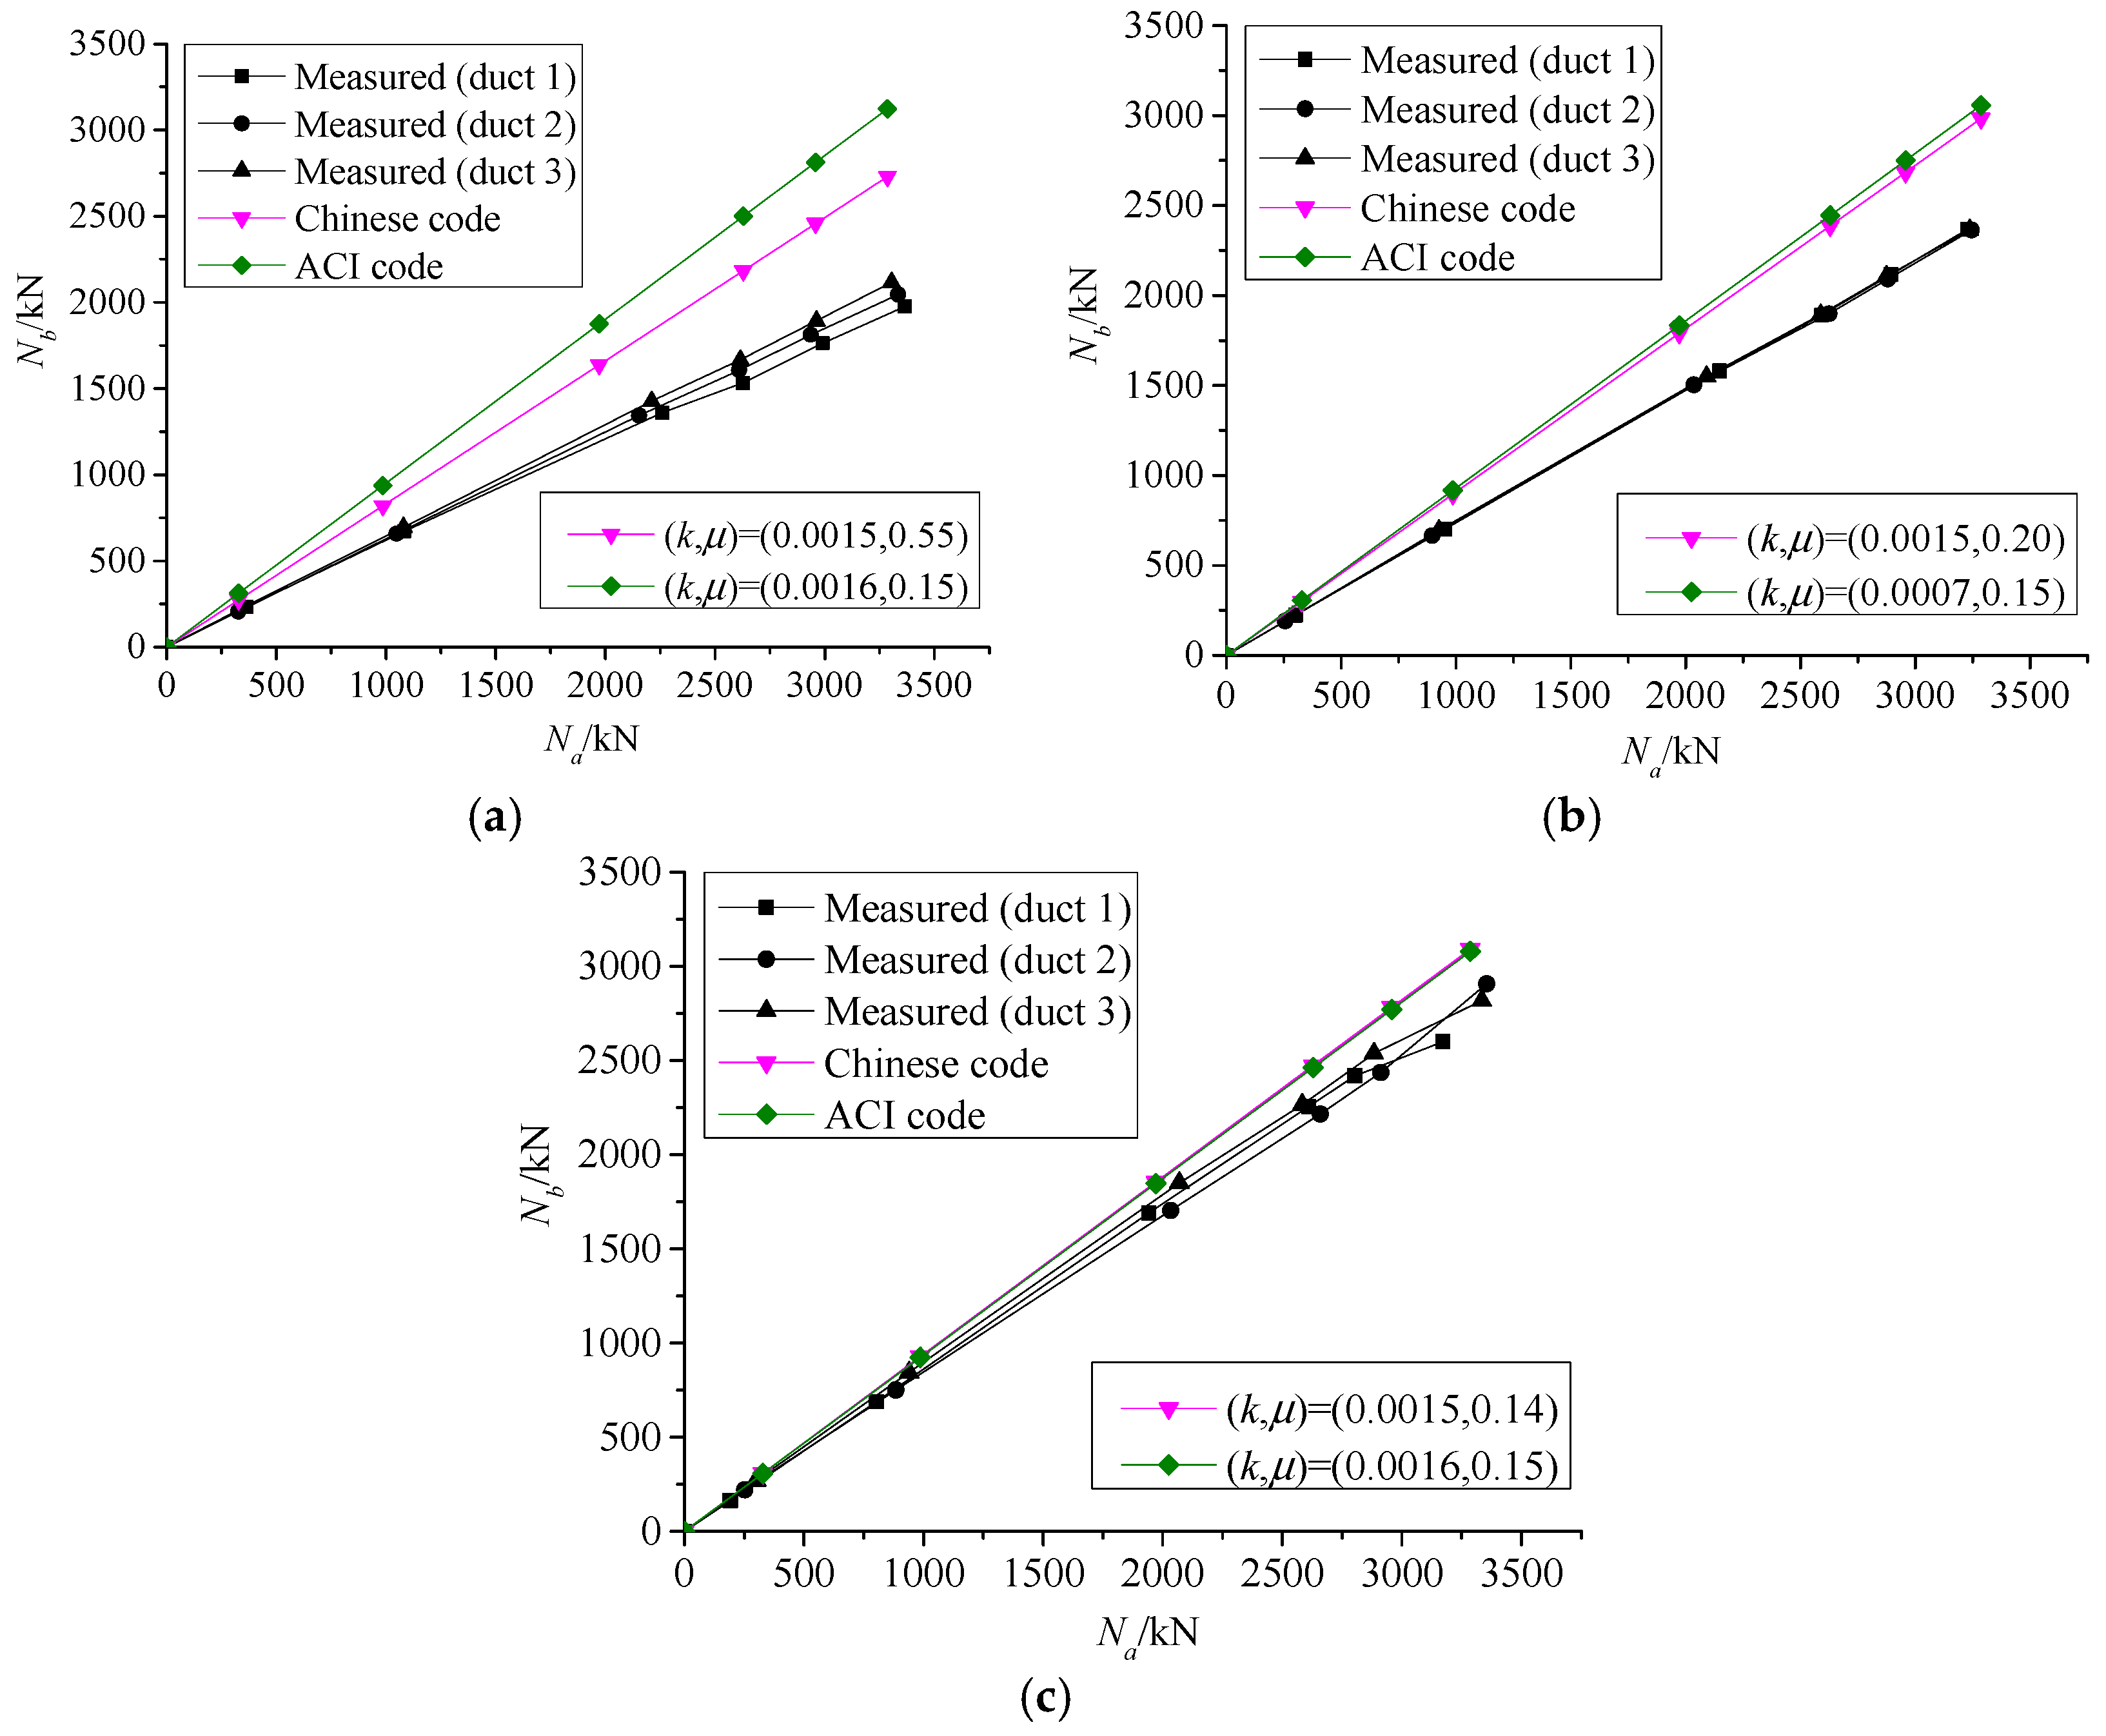
3.2. Comparison of Theoretical and Measured Pre-Stress Forces

Figure 15 and Figure 16 show the comparison between the measured values and theoretical values predicted by the Chinese and ACI codes. In the specimen with single-wire, the predicted values for metal bellow and plastic bellow are accurate, but prediction is overestimated for the specimen with rubber hose. The actual pre-stress force only accounts for 85.26% (predicted by Chinese code) and 89.60% (predicted by ACI code). In the specimen with 19 wires, the predicted values are obviously larger. In particular, the measured values account for 74.93% (predicted by Chinese code) and 65.49% (predicted by ACI code). It can be seen that the coefficients are improperly selected for evaluating pre-stress friction loss, especially in the case of different duct materials.
Generally, the pre-stress friction loss of each case is measured through a series of experiments. The variables (duct-forming material, wires of tendons and arrangement of duct) are proven to significantly affect the friction loss. The friction loss ranges 4–16% in with single-wire, and 10–40% in multi-wire. Friction between the tendons is the main factor. Due to pressure on the curved part, the friction loss in curved duct (10–30%) is surely larger than straight duct (10–20%). As for the difference in smoothness of contact surface and material stiffness, friction loss in rubber hose is the largest (nearly 40%). Thus, the source of pre-stress friction loss is clearly defined, and it can be controlled by aiming at the above factors.
The suggested values for κ and μ based on two projects were calculated, as shown in Figure 17 and Figure 18. The generally suitable values for the crushed limestone sand (CLS) concrete members with post-tensioning are given in Table 7. When compared with Table 1 and Table 2, these values are prepared for each case. The coefficients are generally larger and more accurate than that of the codes. This may provide a necessary reference for the construction of pre-stressed structures with CLS concrete.

4. Conclusions

The pre-stress friction loss in the crushed limestone sand (CLS) concrete with post-tensioning was investigated and discussed in the present study. Several parameters were considered, including the number of tendons, arrangement of ducts and the duct-forming material. The following conclusions can be drawn:
(1)
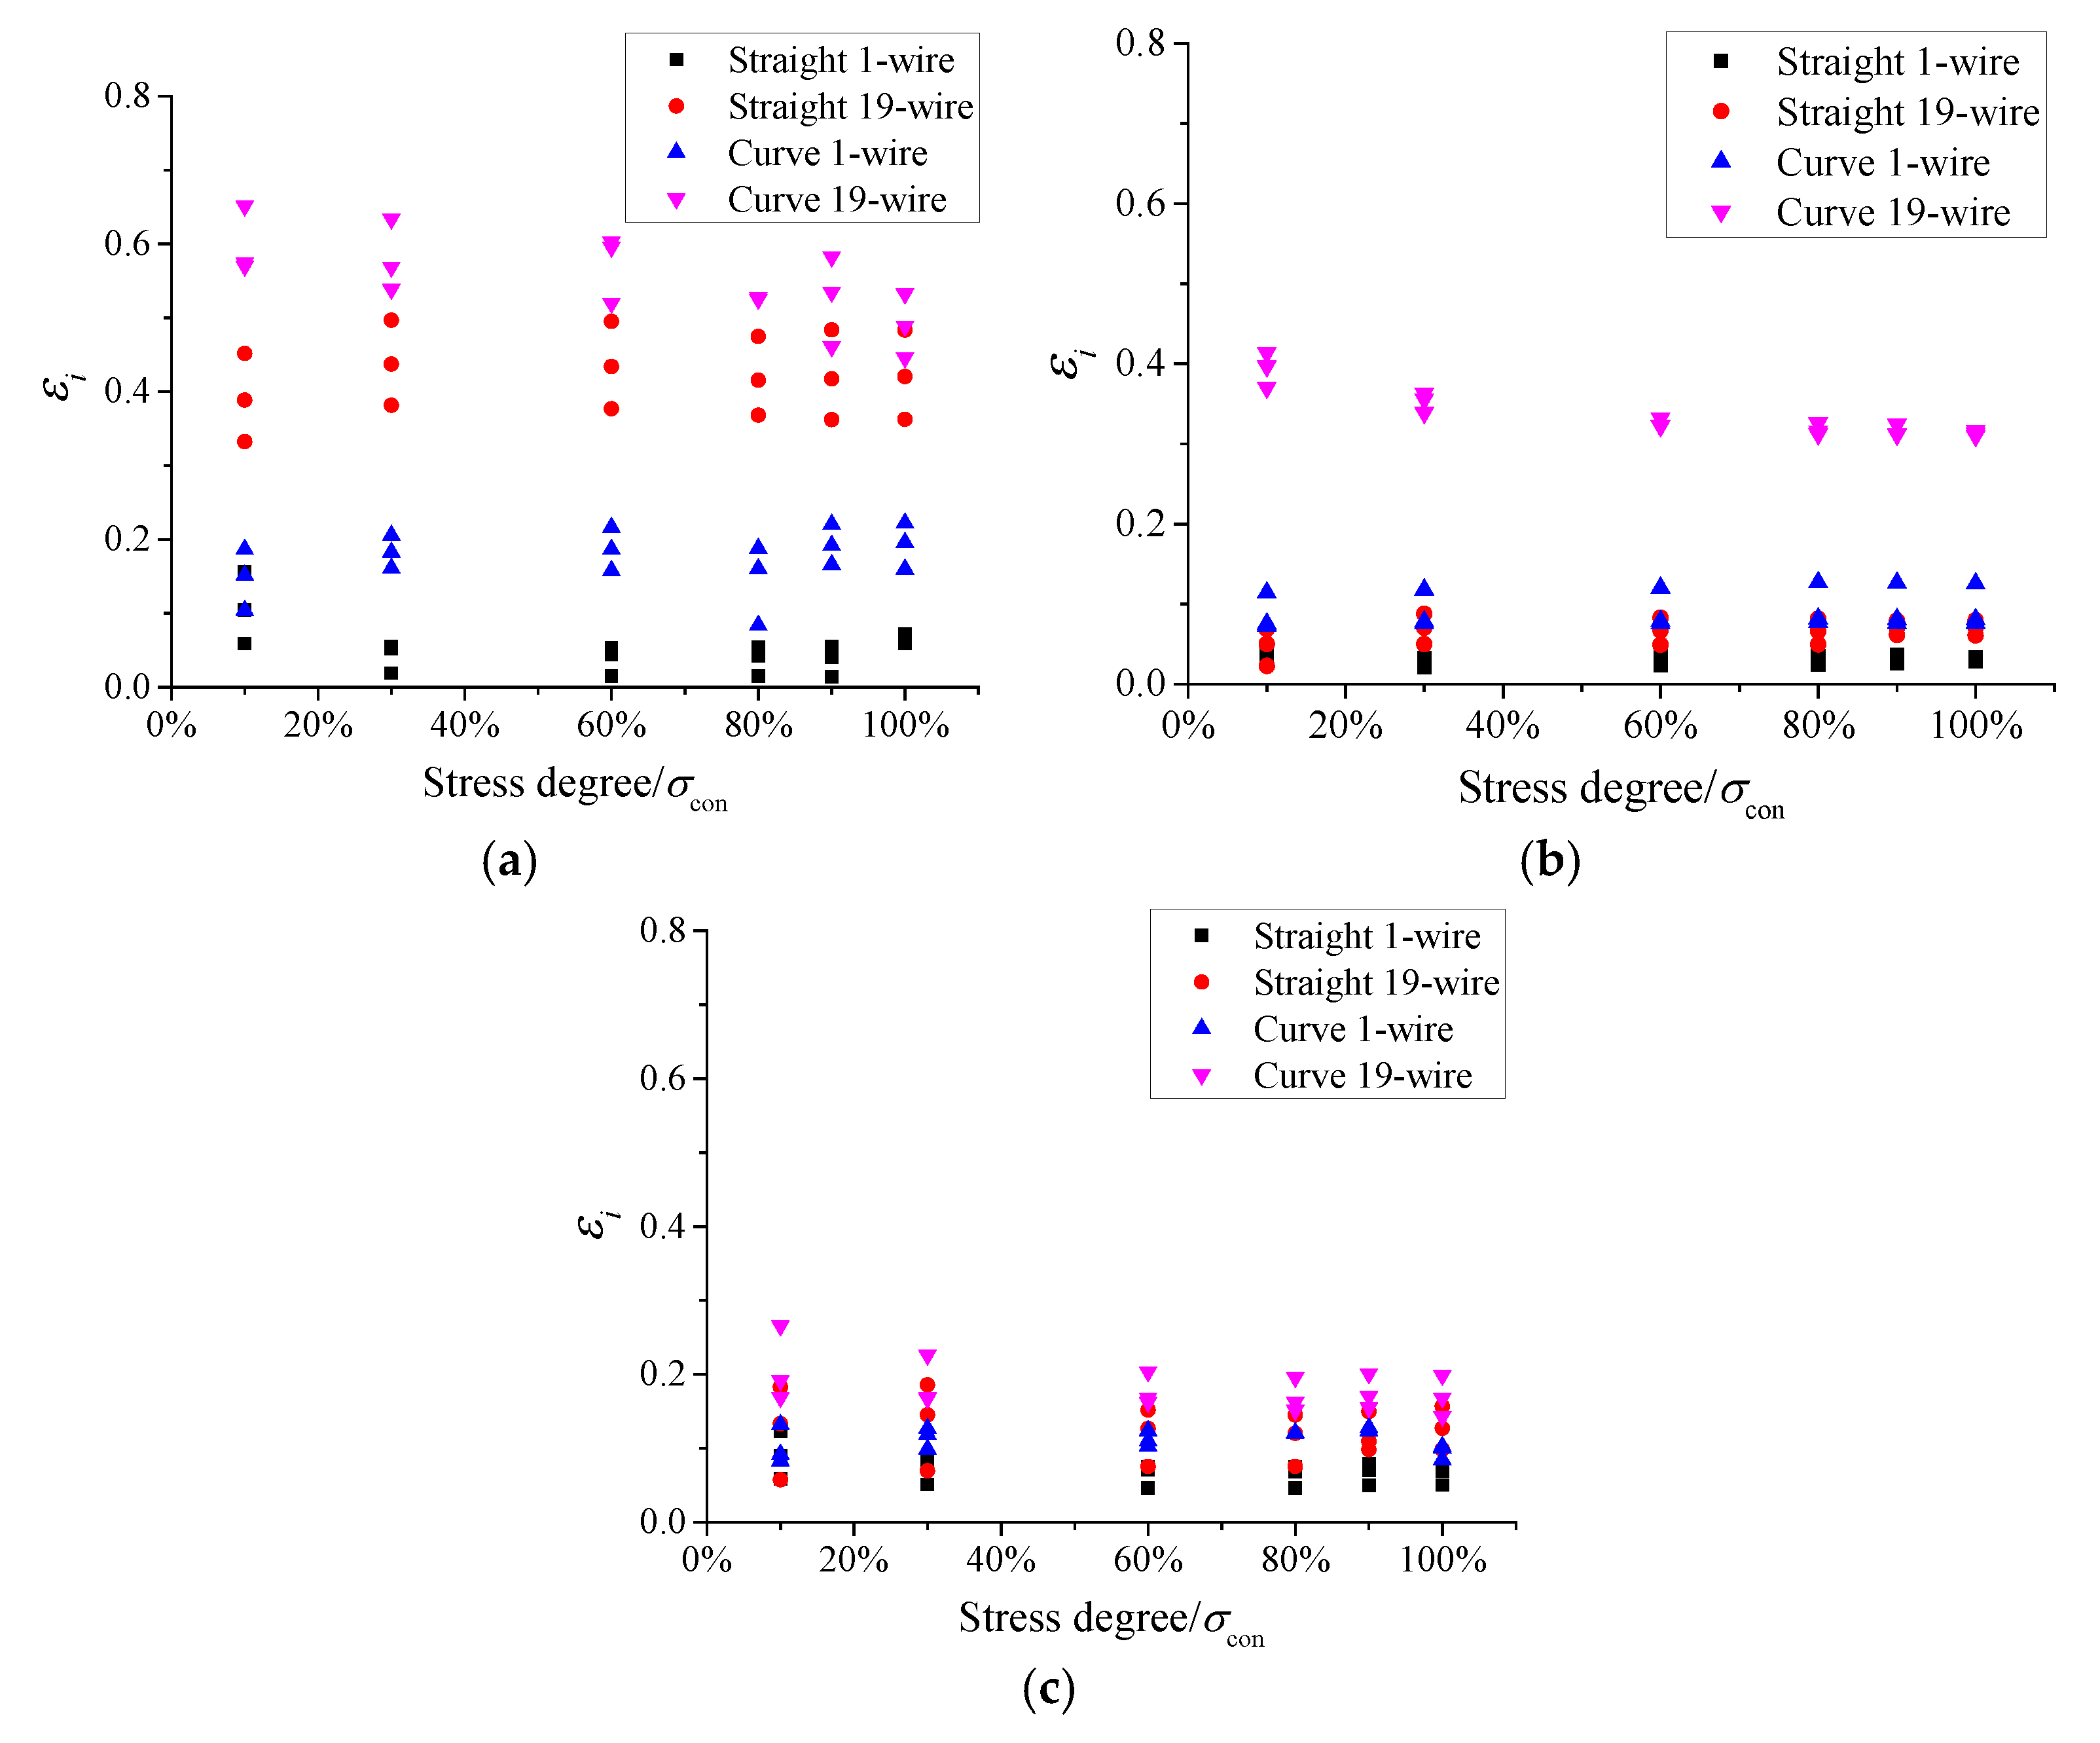
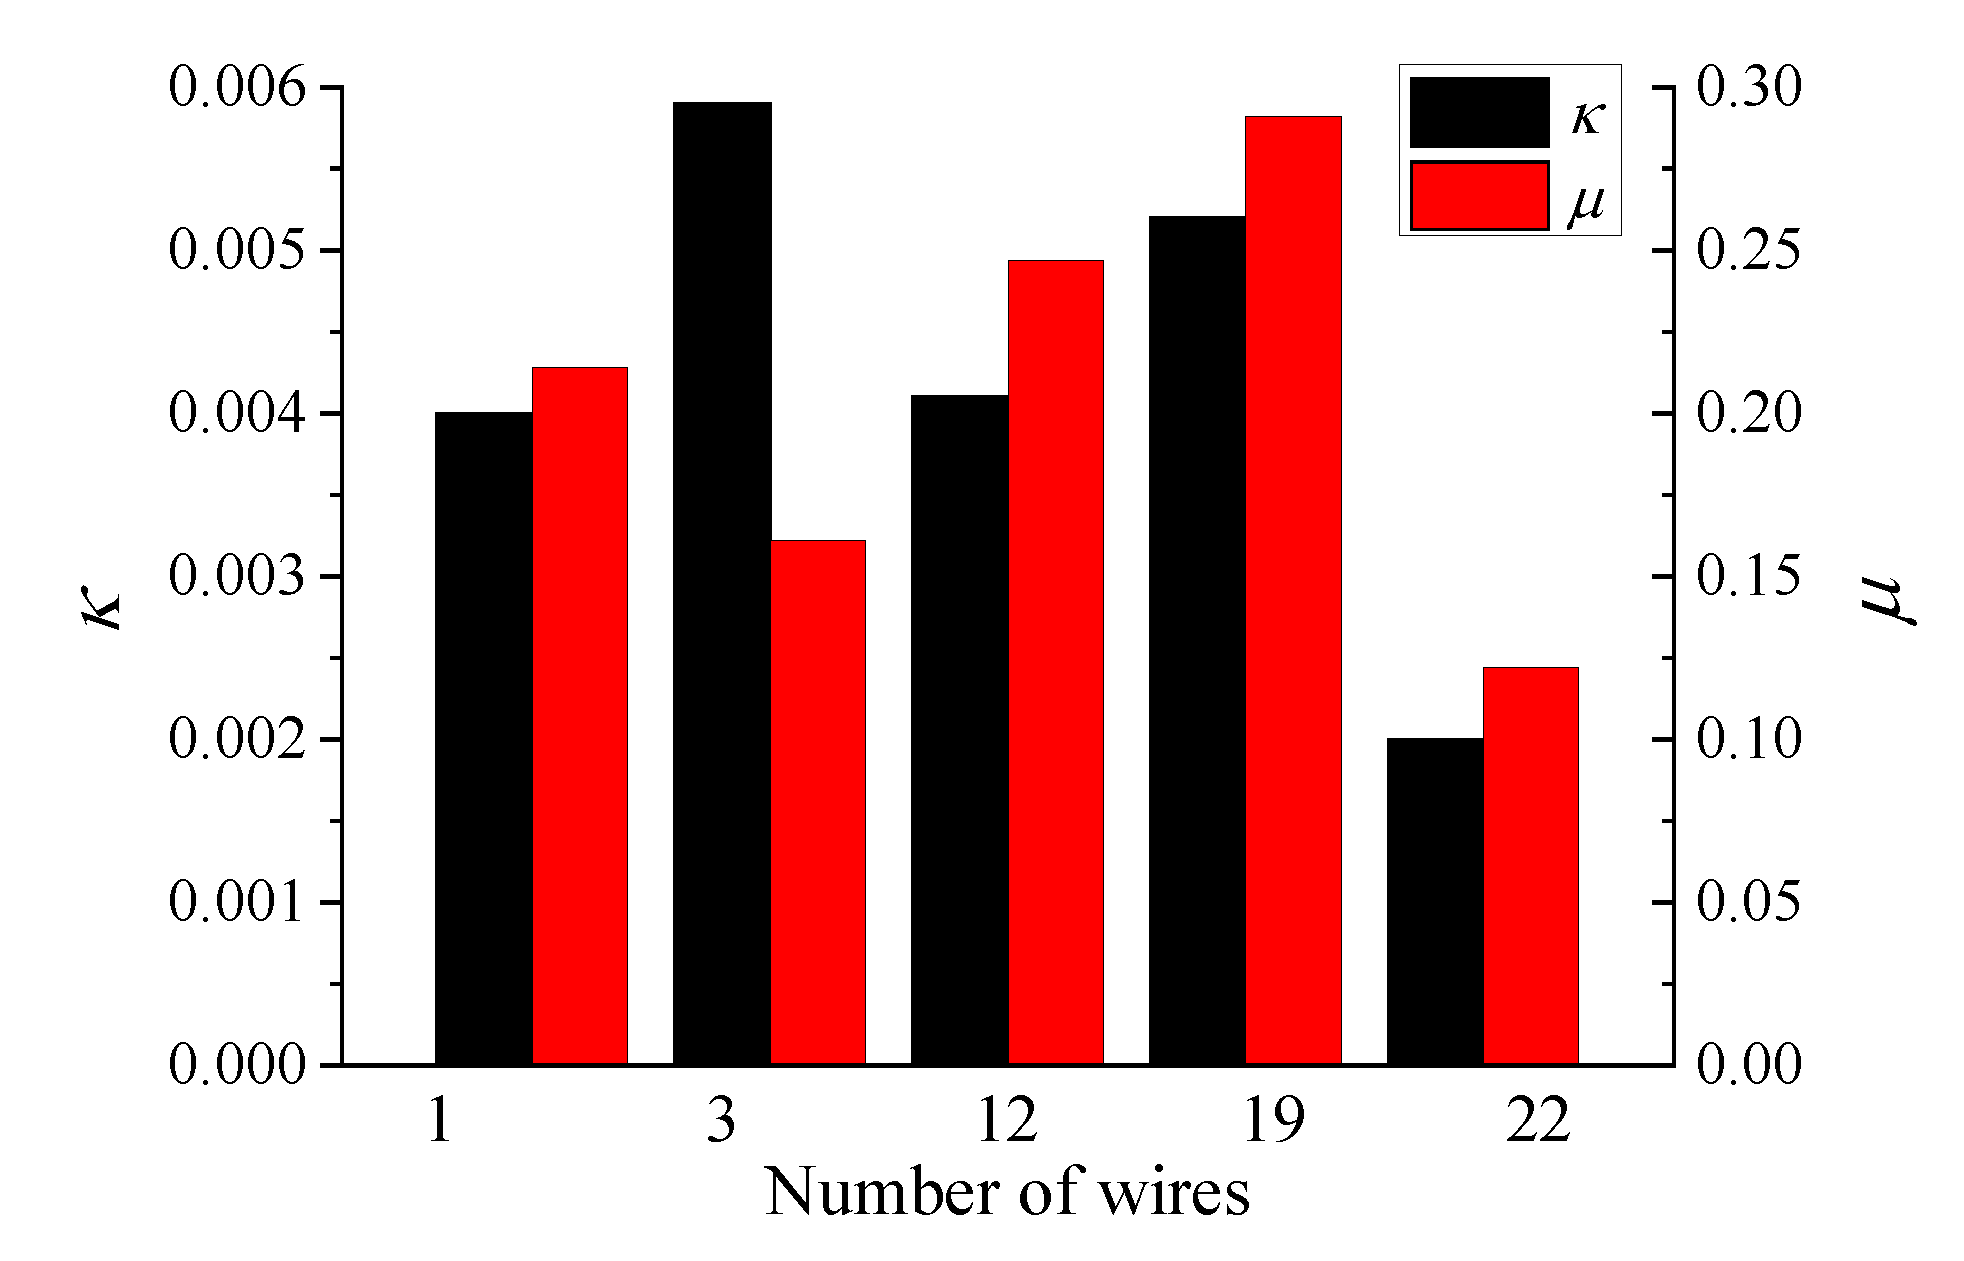
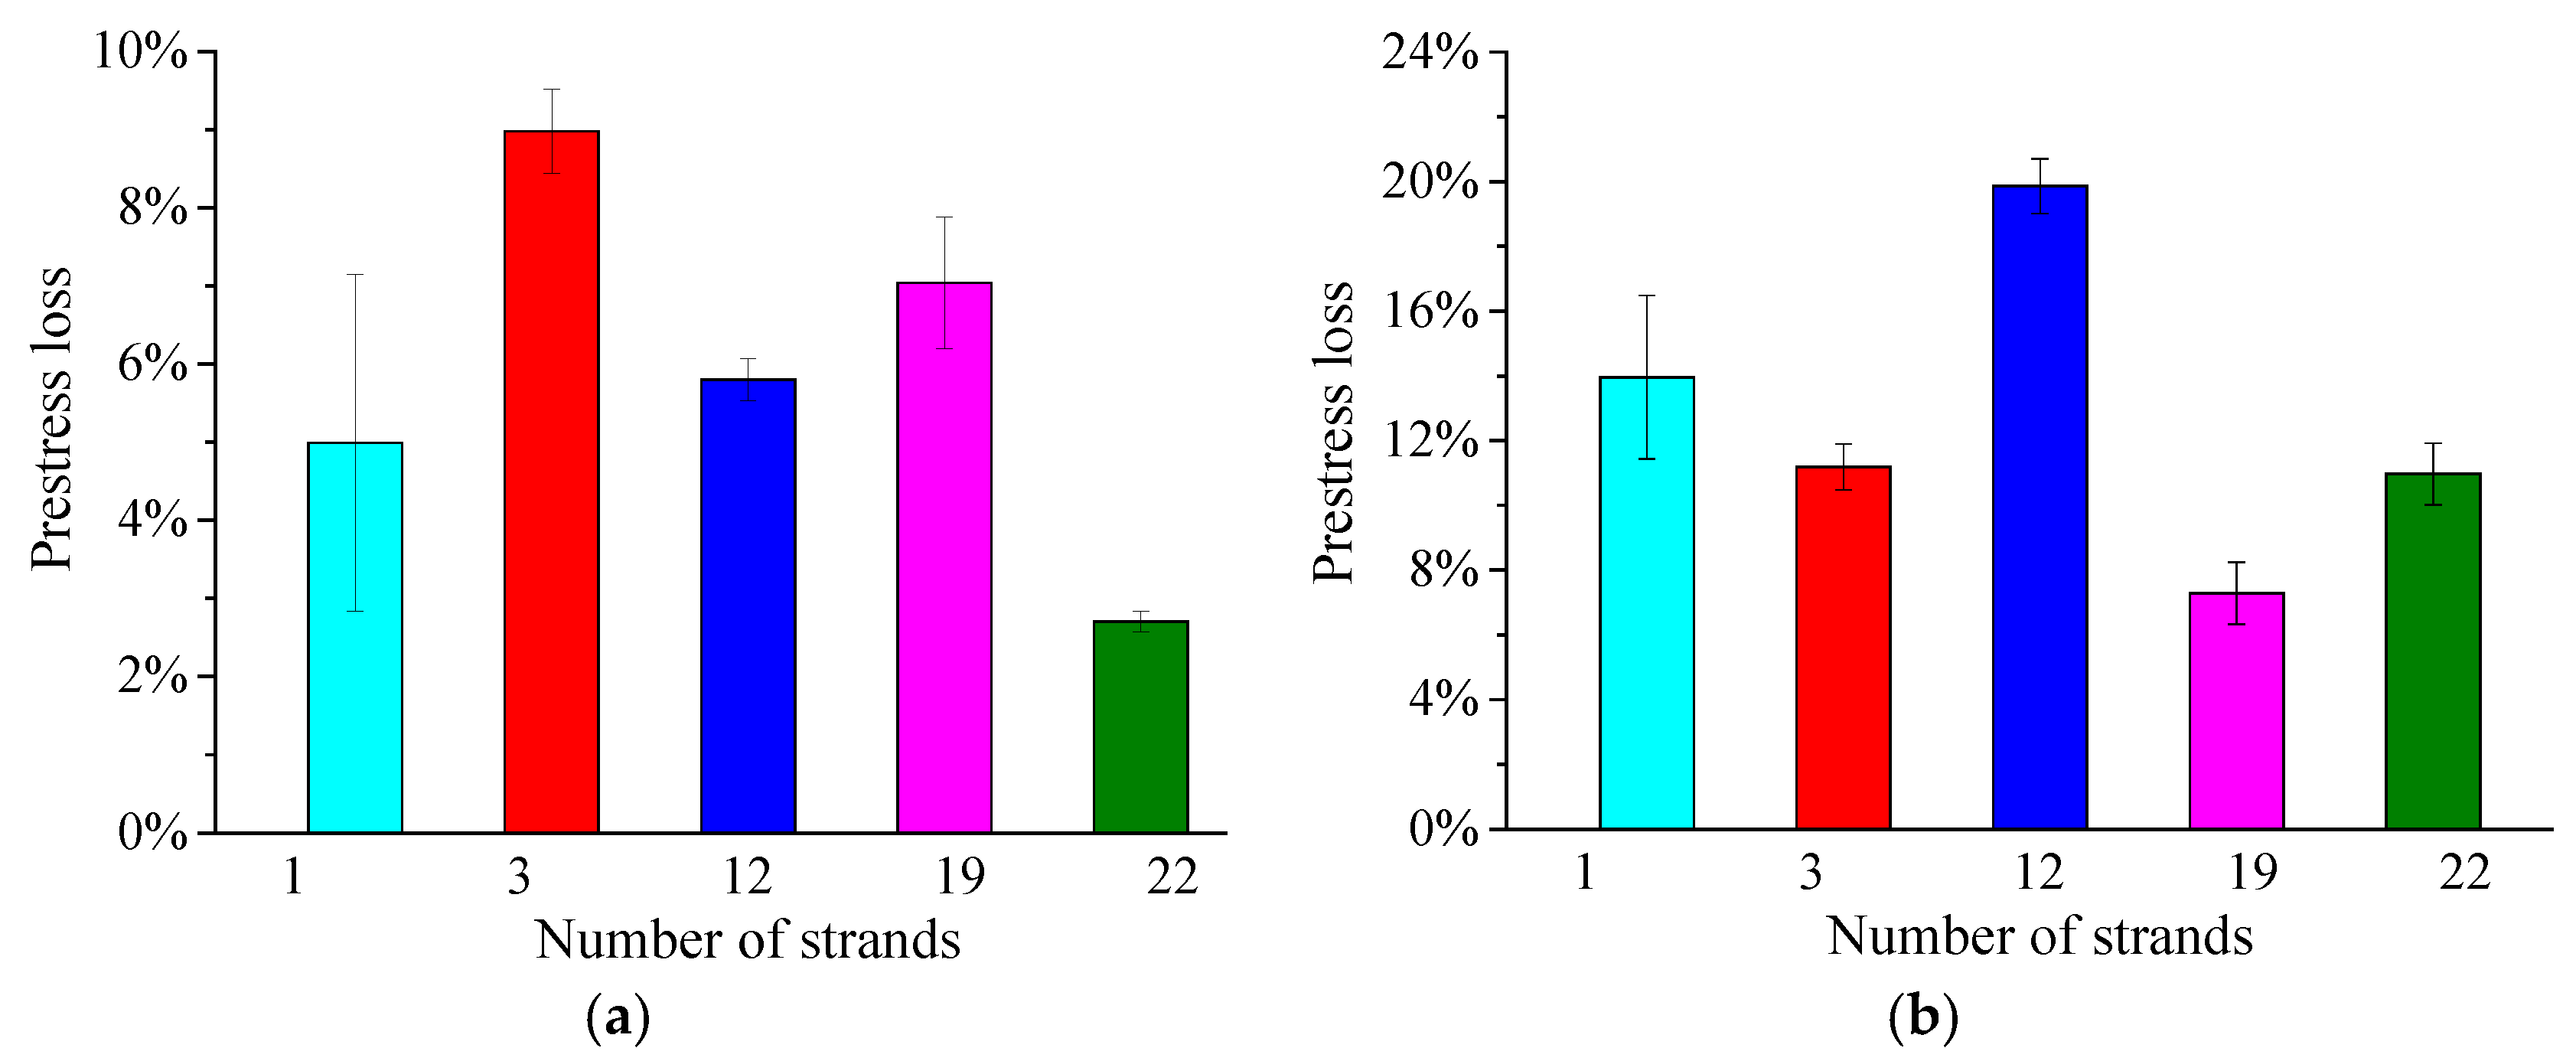
With an increase in the number of tendons, both the total initial tension and friction subsequently increase. The proportion of pre-stress friction loss first increases before decreasing. The pre-stress loss is generally 4–16% in specimens with single-wire, while this is 10–40% in specimens with multi-wire. The friction of inner tendons was shown to form the majority of the instantaneous pre-stress loss.
(2)
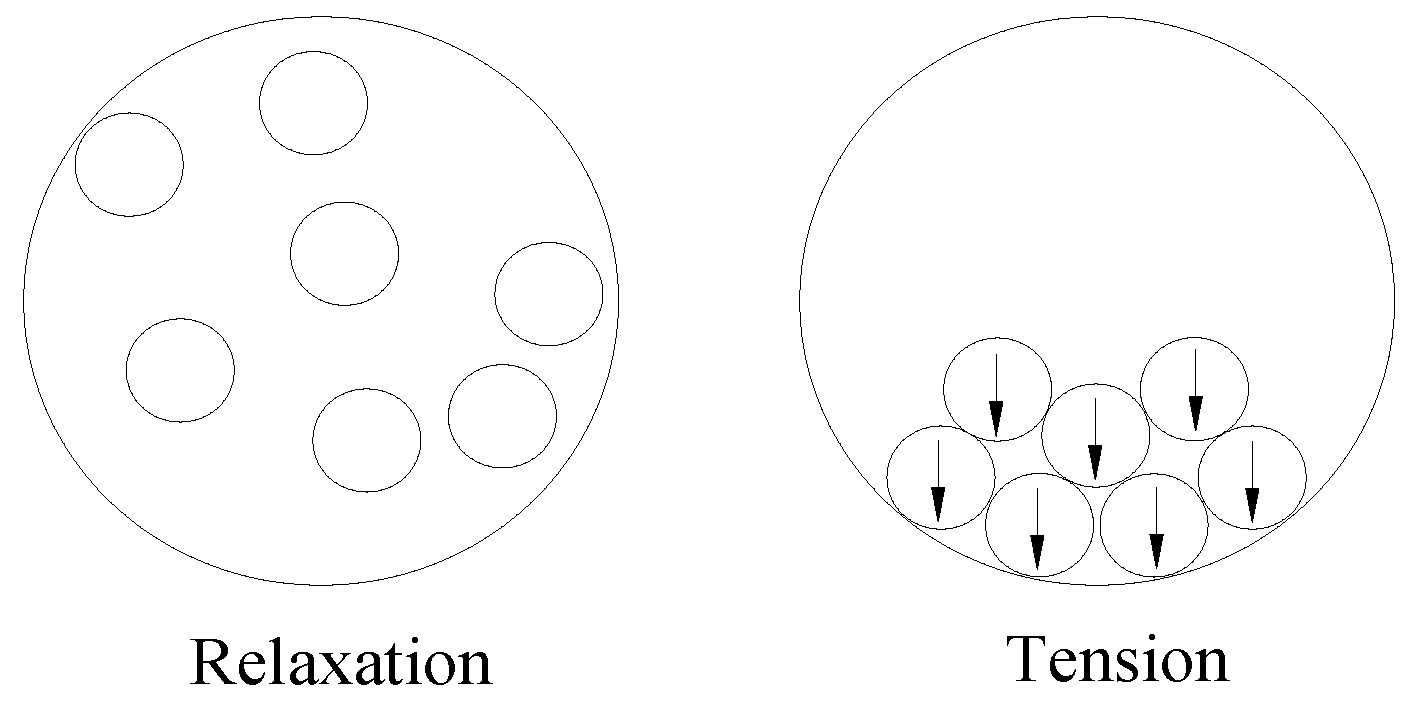
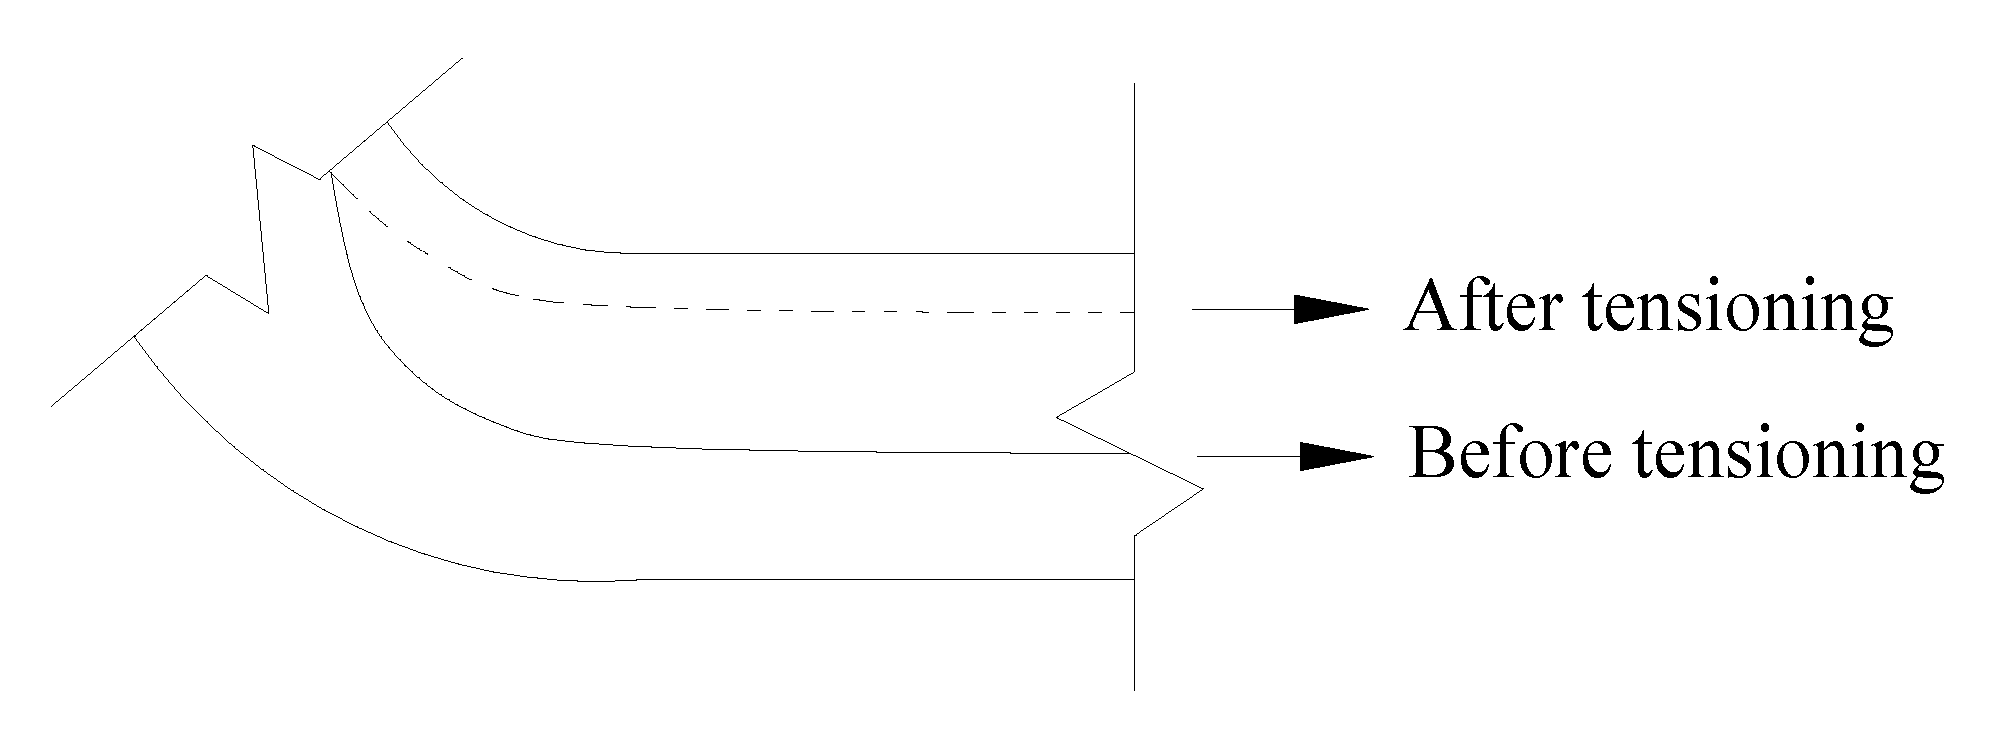
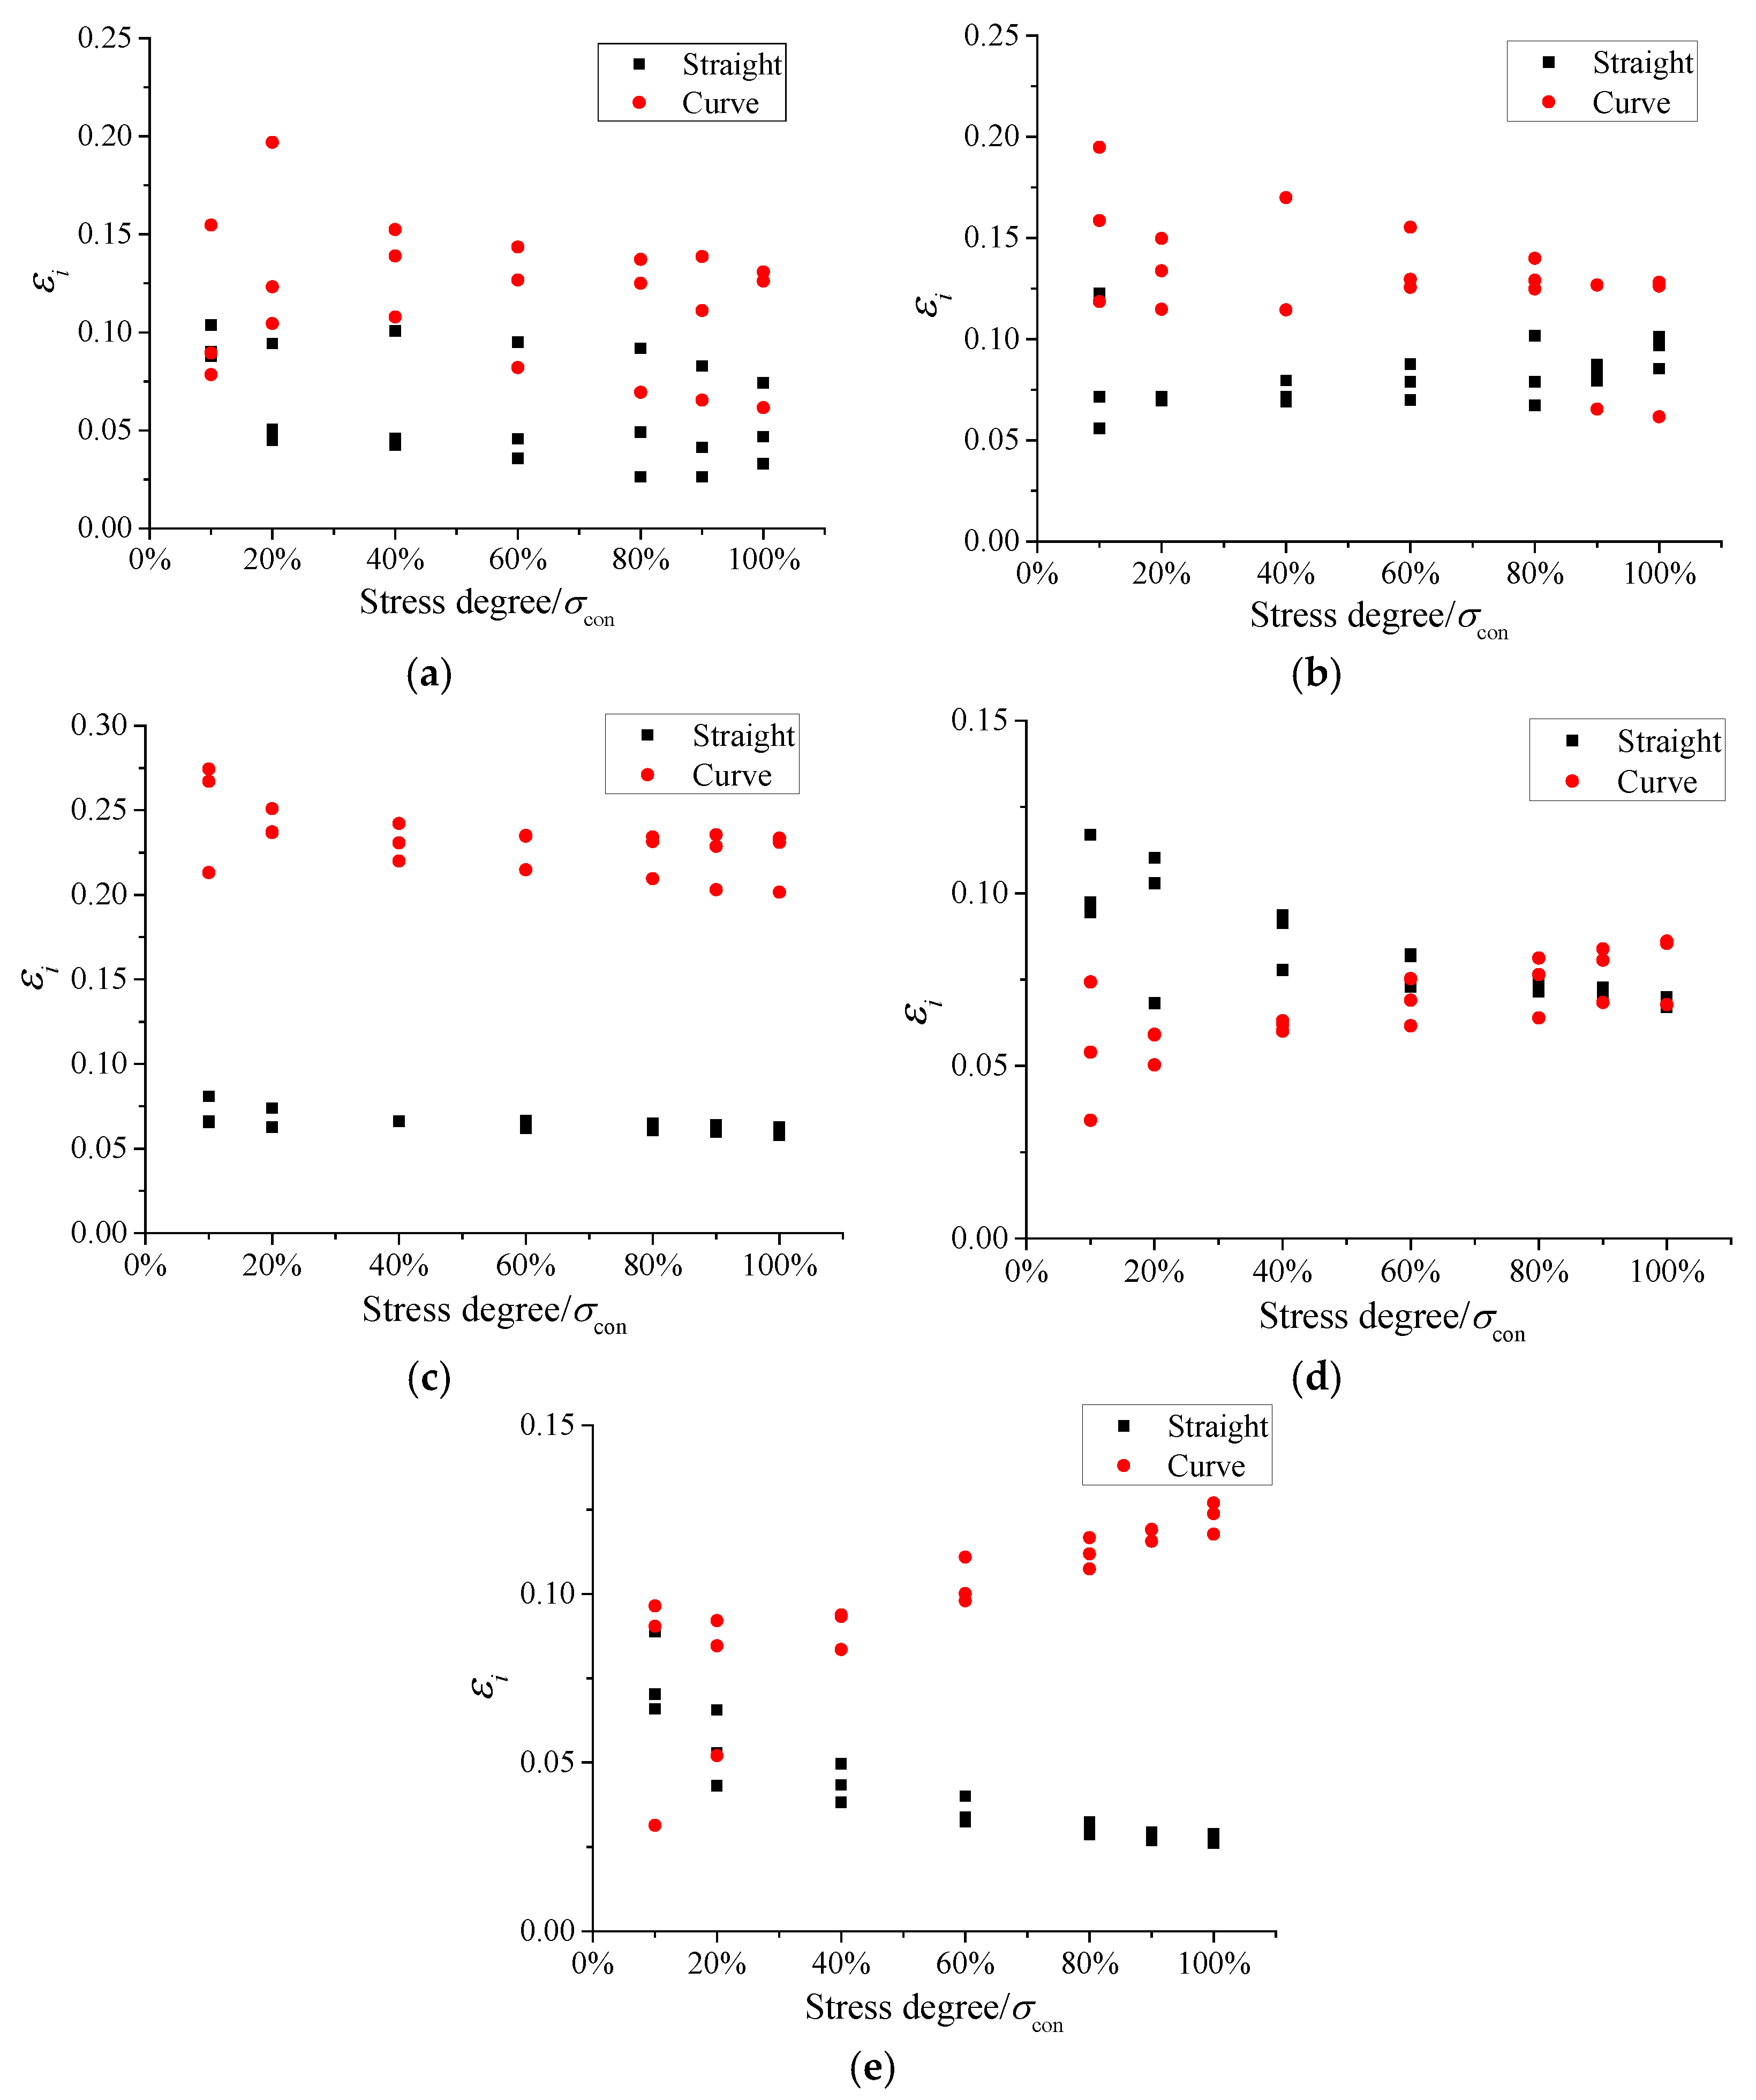
The friction in specimens with curve duct is definitely larger than that in straight duct. The proportion is 10–30% in curved duct and 10–20% in straight duct. First, large pressure is applied to the curved part. Moreover, the effective length is shortened because the location of tendon changes after tensioning. The curvature effect is the dominant factor in curve duct, which may result in additional friction.
(3)
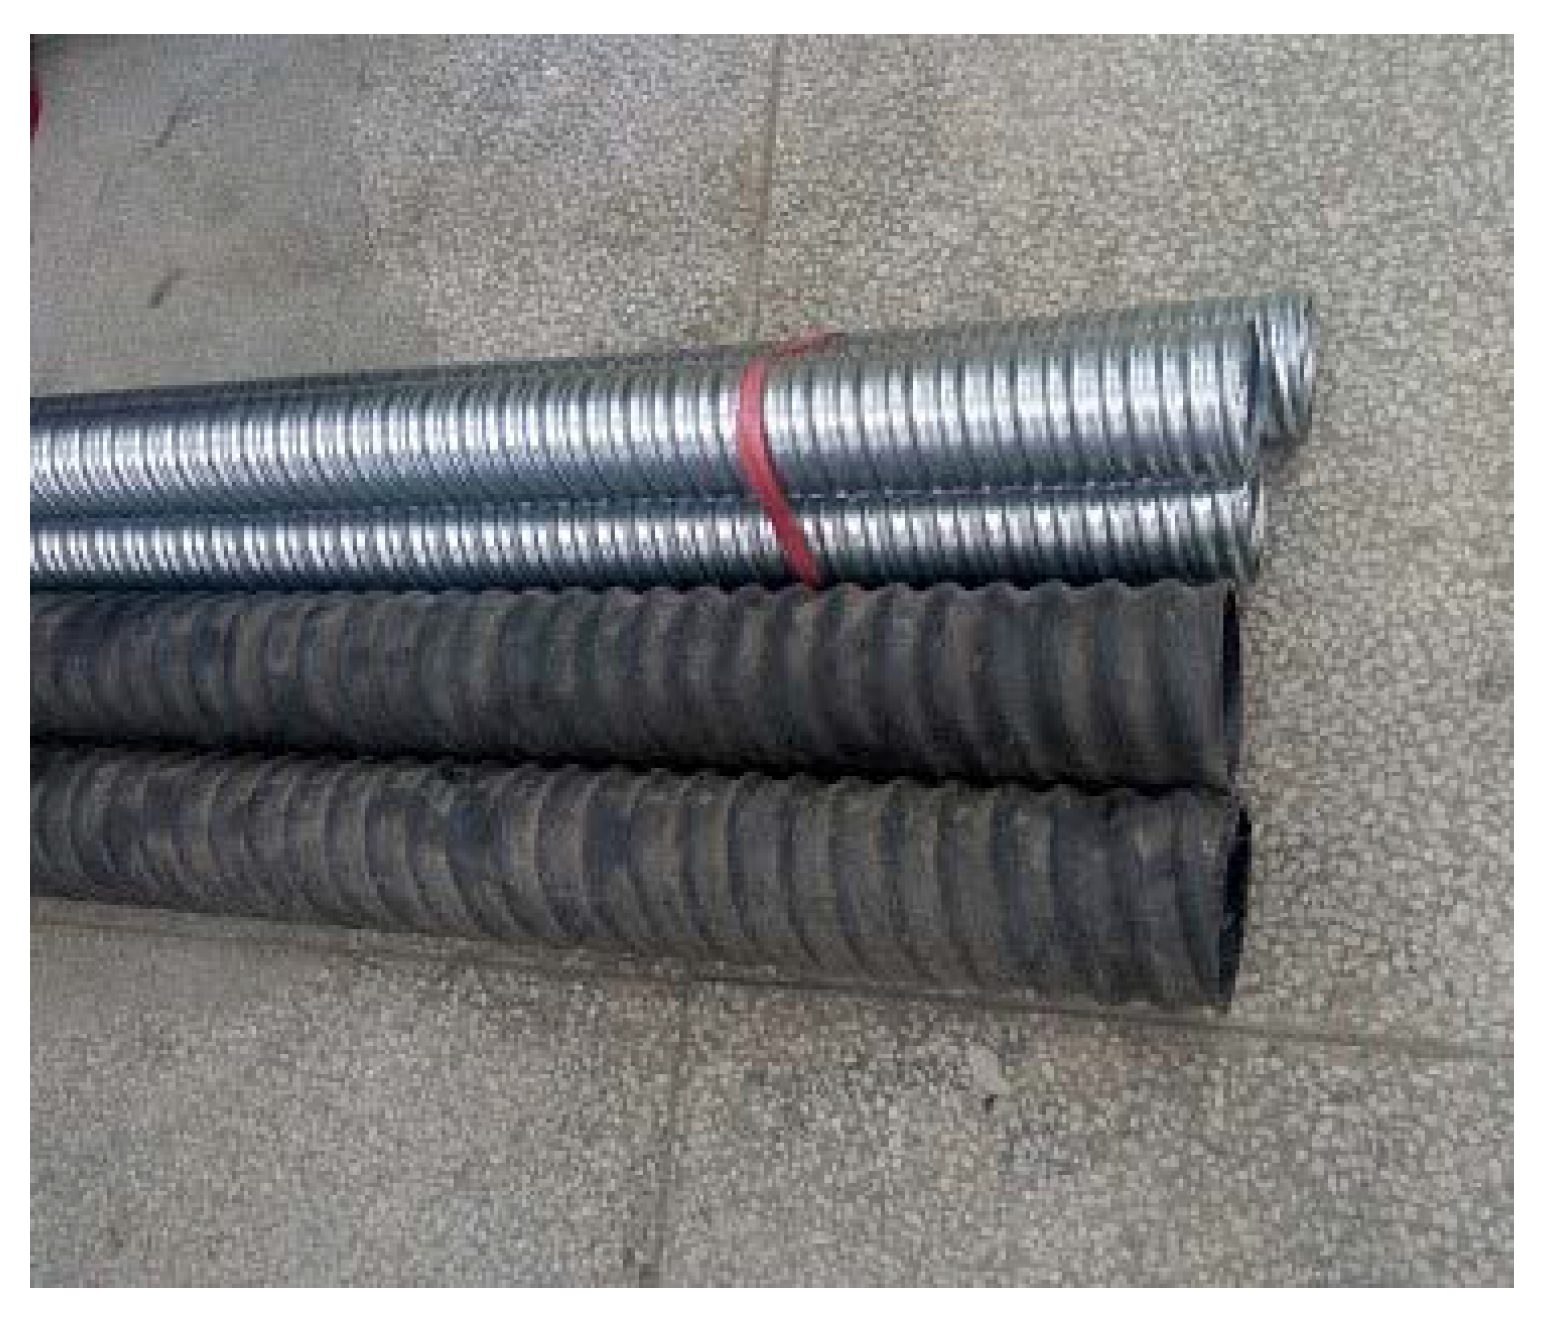
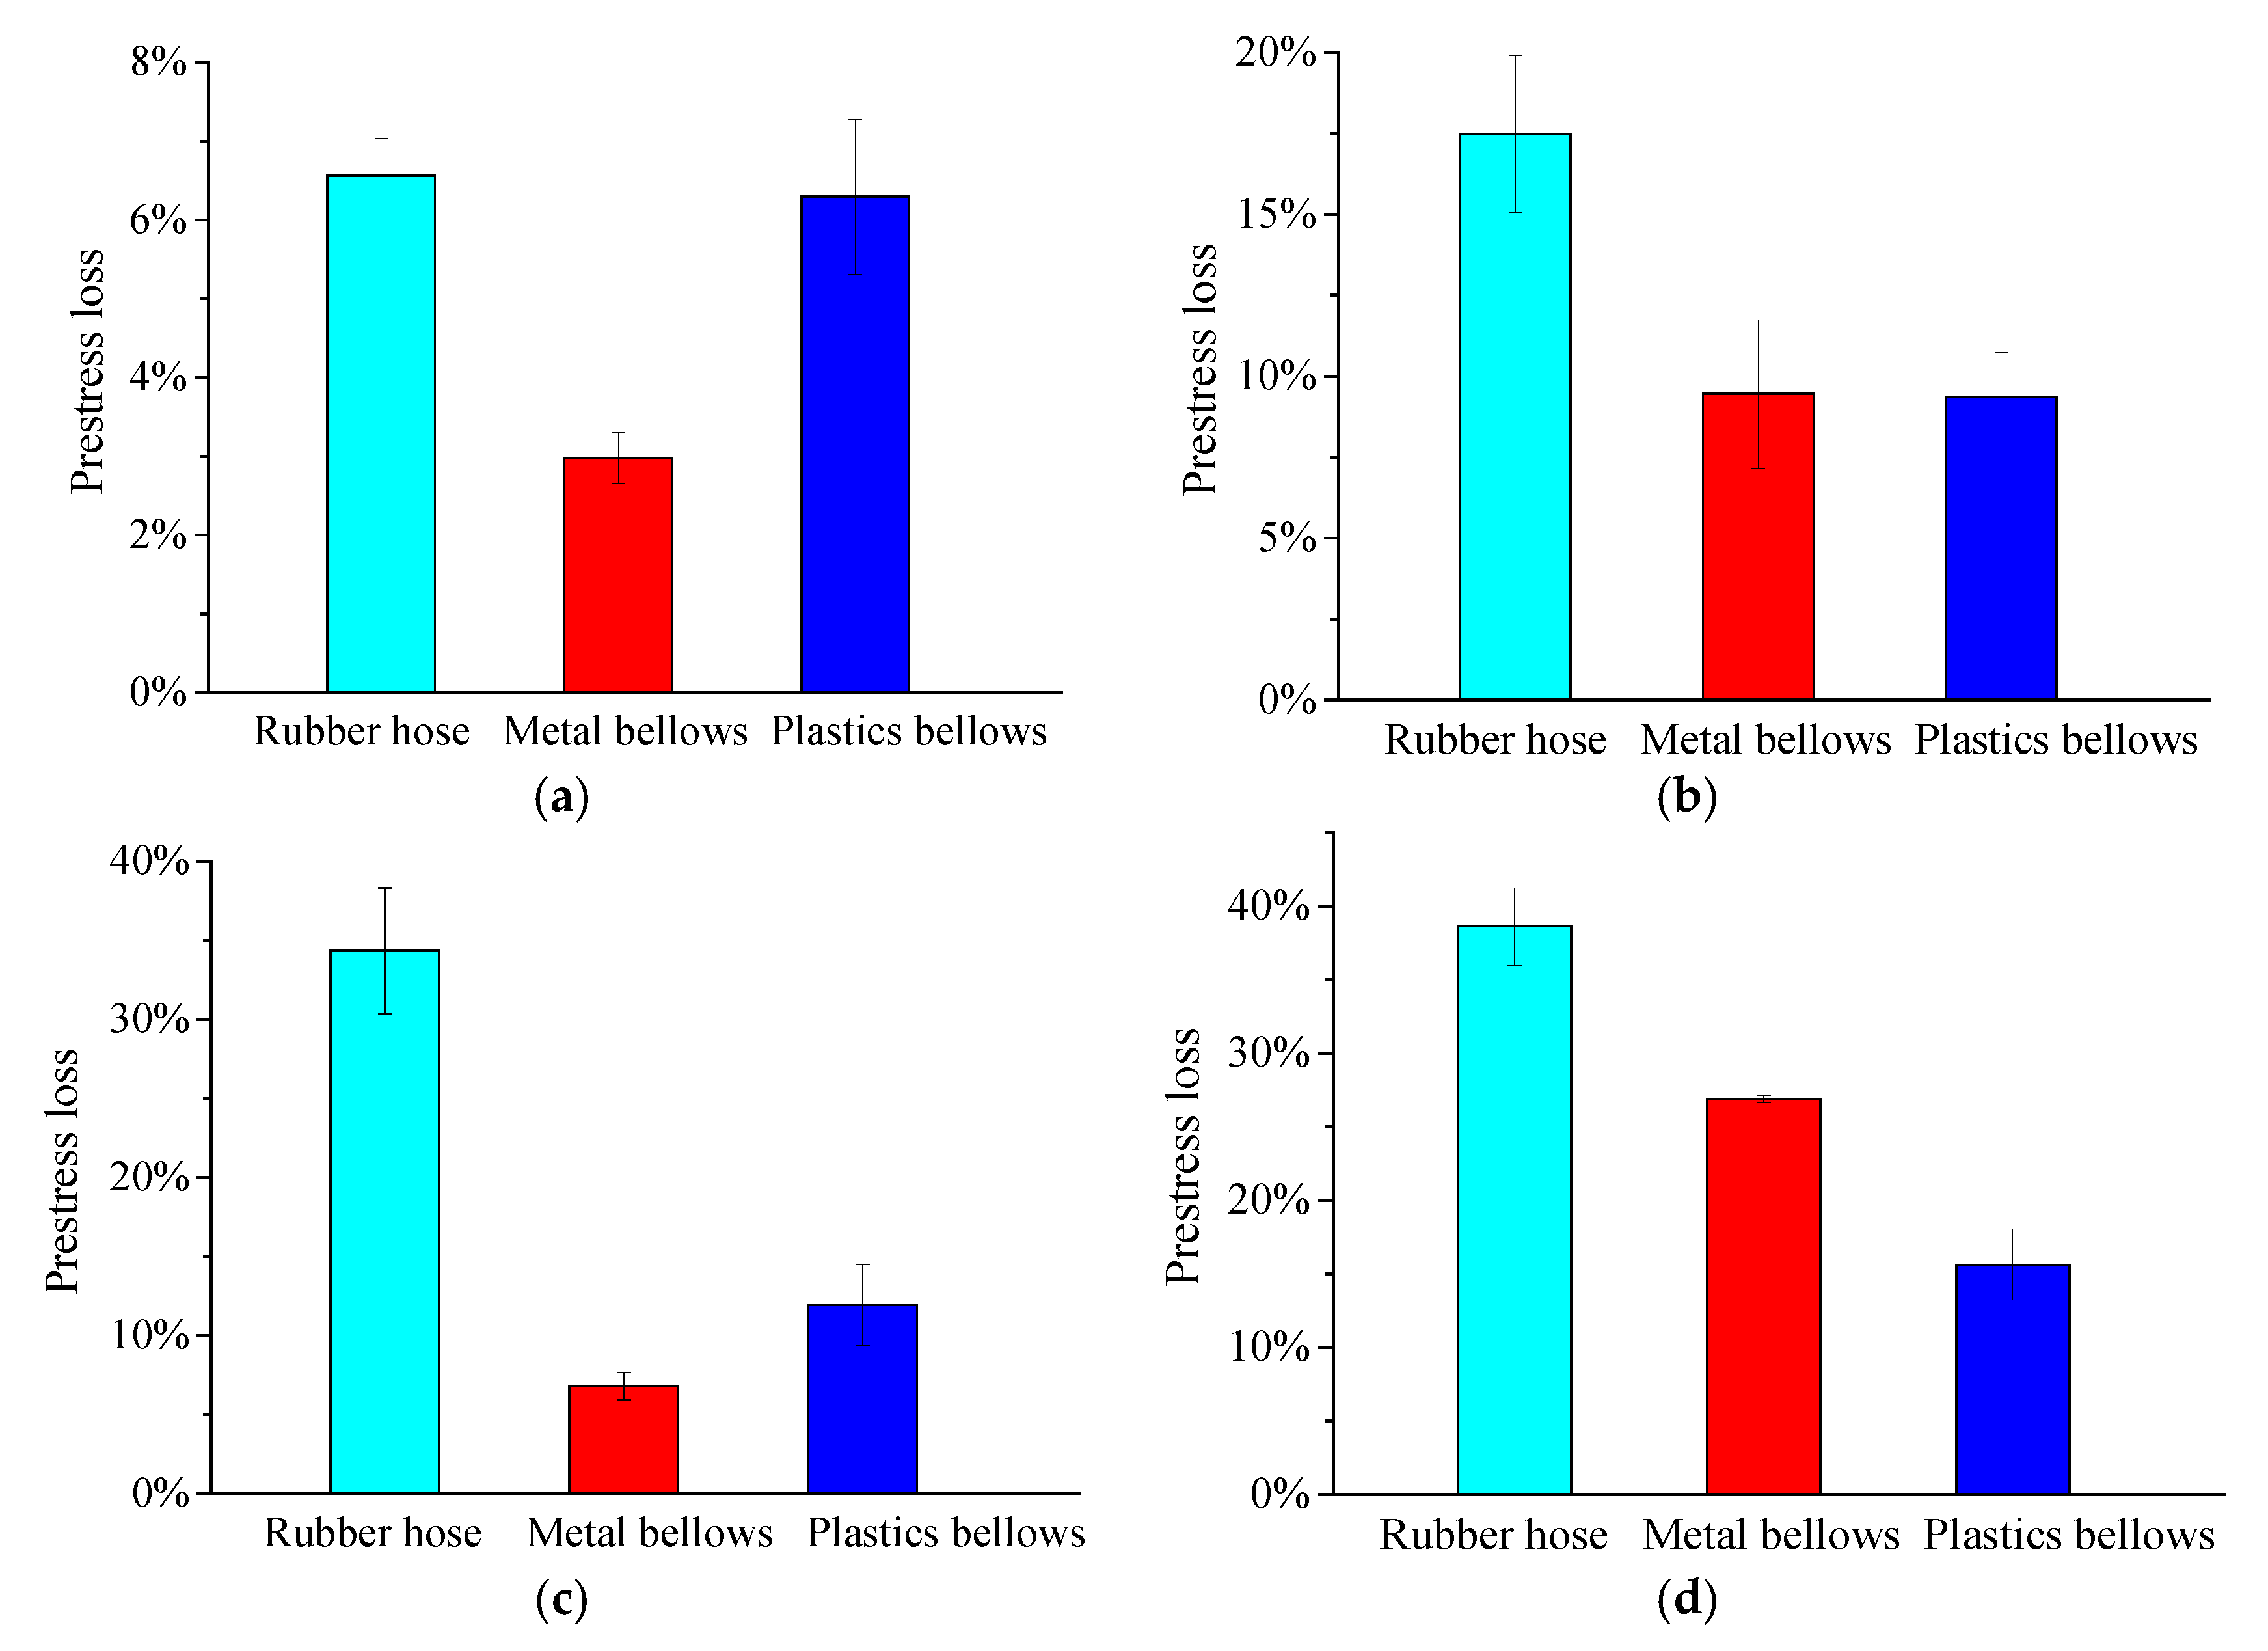
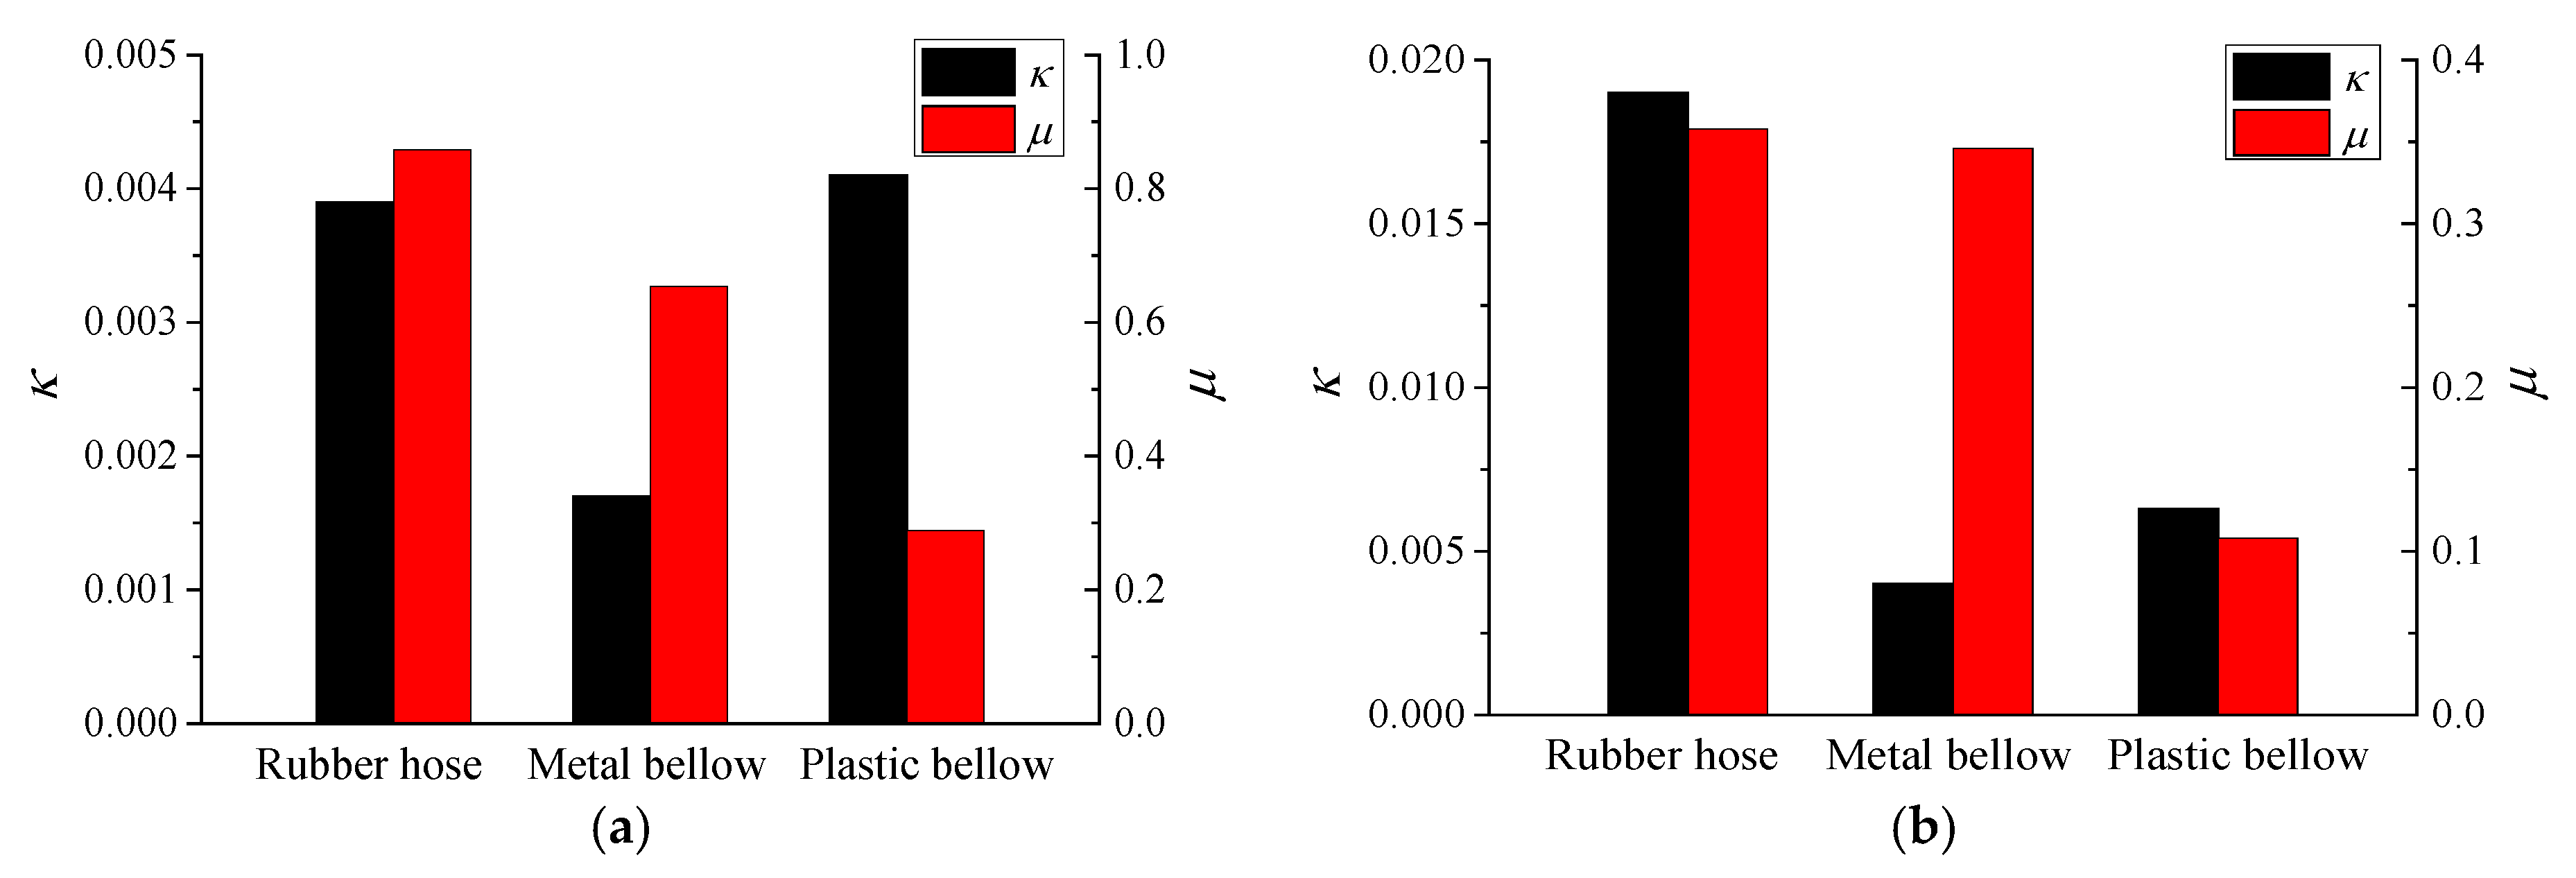
When compared with different duct-forming materials, the pre-stress friction loss in specimens with rubber hose is the largest and reaches nearly 40%. The rubber hose tends to deform and wobble by extrusion, which especially occurs during the concrete pouring. As the contact surface of metal bellow and plastic bellow is smooth, the pre-stress friction loss is smaller. This part of friction loss is mainly determined by the stiffness of duct material and nature of contact surface.
(4)
The frictional resistance κ and friction coefficient μ for CLS concrete member with post-tensioning were modified and detailed for each case. The parameters κ and μ are at the ranges of 0.0017–0.007 and 0.108–0.858, respectively. We hope that this work will provide references for the design of pre-stressed concrete structure and engineering applications.

Author Contributions

Yaoting Zhang conceived and designed the experiments; Yunfeng Xiao and Jiezhi Lu performed the experiments; Yong Liu and Wenjie Cheng analyzed the data; and Yunfeng Xiao and Yaoting Zhang wrote the paper.

Acknowledgments

The generous support provided by the National Natural Science Foundation of China (Grant No. 51278218) is gratefully acknowledged. The authors are especially grateful to Guizhou Provincial Transportation Department.

Conflicts of Interest

The authors declare no conflict of interest.

References

  1. Mo, Y.; Huang, X.B.; Zeng, Y.S.; Chen, F.H.; He, H.W.; Xiao, L.; Shu, X.J. Research on Key Prestress Construction Techniques of Continuous Box Girder. Adv. Mater. Res. 2013, 724–725, 1670–1676. [Google Scholar] [CrossRef]
  2. Zhang, Y.; Zheng, Y. Long-Term Deflections of Crushed Limestone Sand Concrete Beams. Adv. Struct. Eng. 2013, 16, 1535–1544. [Google Scholar] [CrossRef]
  3. Bederina, M.; Makhloufi, Z.; Bounoua, A.; Bouziani, T.; Quéneudec, M. Effect of partial and total replacement of siliceous river sand with limestone crushed sand on the durability of mortars exposed to chemical solutions. Constr. Build. Mater. 2013, 47, 146–158. [Google Scholar] [CrossRef]
  4. Akrout, K.; Mounanga, P.; Ltifi, M.; Jamaa, N.B. Rheological, Mechanical and Structural Performances of Crushed Limestone Sand Concrete. Int. J. Concr. Struct. Mater. 2010, 4, 97–104. [Google Scholar]
  5. Cao, Q.; Tao, J.; Ma, Z.J. Prestress loss in externally FRP reinforced self prestressing concrete beams. Constr. Build. Mater. 2015, 101, 667–674. [Google Scholar] [CrossRef]
  6. Shokoohfar, A.; Rahai, A. Prediction model of long-term prestress loss interaction for prestressed concrete containment vessels. Arch. Civ. Mech. Eng. 2017, 17, 132–144. [Google Scholar] [CrossRef]
  7. Bai, F.; Davidson, J.S. Composite beam theory for pretensioned concrete structures with solutions to transfer length and immediate prestress losses. Eng. Struct. 2016, 126, 739–758. [Google Scholar] [CrossRef]
  8. Idriss, R.; Solano, A. Effects of Steam Curing Temperature on Early Prestress Losses in High-Performance Concrete Beams. Transp. Res. Rec. 2002, 1813, 218–228. [Google Scholar] [CrossRef]
  9. Hurme, S.; Marquis, G. Shear fatigue of the bonded and frictional interface under constant normal pre-stress. Int. J. Fatigue 2015, 70, 1–12. [Google Scholar] [CrossRef]
  10. Derkowski, W.; Dyba, M. Behaviour of End Zone of Pre-tensioned Concrete Elements. Procedia Eng. 2017, 193, 19–26. [Google Scholar] [CrossRef]
  11. Markovič, M.; Krauberger, N.; Saje, M.; Planinc, I.; Bratina, S. Non-linear analysis of pre-tensioned concrete planar beams. Eng. Struct. 2013, 46, 279–293. [Google Scholar] [CrossRef]
  12. García-Segura, T.; Yepes, V.; Dan, M.F.; Yang, D.Y. Lifetime reliability-based optimization of post-tensioned box-girder bridges. Eng. Struct. 2017, 145, 381–391. [Google Scholar] [CrossRef]
  13. Dang, C.N.; Hale, W.M.; Martí-Vargas, J.R. Assessment of transmission length of prestressing strands according to fib Model Code 2010. Eng. Struct. 2017, 147, 425–433. [Google Scholar] [CrossRef]
  14. Li, C.; Zhang, K.Y.; Fan, Z.L. Research on Prestressed Loss in Curving Hole of Prestressed Concrete Structure Caused by Frictional Resistance. Appl. Mech. Mater. 2014, 587–589, 1668–1671. [Google Scholar] [CrossRef]
  15. Yu, T.L.; Zhang, L.Y. Friction Loss of Externally Prestressed Concrete Beams with Carbon Fiber-Reinforced Polymer Tendons. Adv. Mater. Res. 2010, 163–167, 3701–3706. [Google Scholar] [CrossRef]
  16. Caro, L.A.; Martí-Vargas, J.R.; Serna, P. Prestress losses evaluation in prestressed concrete prismatic specimens. Eng. Struct. 2013, 48, 704–715. [Google Scholar] [CrossRef]
  17. Hong, S. Effect of Prestress Levels and Jacking Methods on Friction Losses in Curved Prestressed Tendons. Appl. Sci. 2017, 7, 824. [Google Scholar] [CrossRef]
  18. Shin, K.J.; Kim, Y.Y.; Lee, H.W. Frictional Loss of Prestress Caused by Deflected Tendon. Appl. Mech. Mater. 2014, 513–517, 2599–2602. [Google Scholar] [CrossRef]
  19. Shin, K.J.; Kim, Y.Y.; Lee, H.W. Frictional Loss of Prestress Caused by Locally Deflected Tendons in Prestressed Concrete Girder Bridges. Adv. Mater. Res. 2015, 1119, 716–720. [Google Scholar] [CrossRef]
  20. Kim, J.M.; Kim, H.W.; Park, Y.H.; Yang, I.H.; Kim, Y.S. FBG Sensors Encapsulated into 7-Wire Steel Strand for Tension Monitoring of a Prestressing Tendon. Adv. Struct. Eng. 2012, 15, 907–918. [Google Scholar] [CrossRef]
  21. Xuan, F.Z.; Tang, H.; Tu, S.T. In situ monitoring on prestress losses in the reinforced structure with fiber-optic sensors. Measurement 2009, 42, 107–111. [Google Scholar] [CrossRef]
  22. Nguyen, K.D.; Kim, J.T. Smart PZT-interface for wireless impedance-based prestress-loss monitoring in tendon-anchorage connection. Smart Struct. Syst. 2012, 9, 489–504. [Google Scholar] [CrossRef]
  23. Youssef, M.A. Evaluating Prestress Losses during Pre-Tensioning. In Proceedings of the International Construction Specialty Conference, St. John’s, NL, Canada, 27–30 May 2009. [Google Scholar]
  24. Zhang, K.Y.; Cheng, C. Analysis on Prestress Loss Caused by Friction in Curved Duct in the Design of Prestressed Concrete Structure. In Proceedings of the 4th International Symposium on Lifetime Engineering of Civil Infrastructure, Changsha, China, 26 October 2009. [Google Scholar]
  25. Guo, Q. Iterative Prediction on Friction Loss Parameters of Prestress Tendon. Appl. Mech. Mater. 2014, 501–504, 1121–1124. [Google Scholar] [CrossRef]
  26. Wu, X.H.; Lu, X. Tendon Model for Nonlinear Analysis of Prestressed Concrete Structures. J. Struct. Eng. 2001, 127, 96–104. [Google Scholar] [CrossRef]
  27. Lin, T.Y.; Burns, N.H. Design of Prestressed Concrete Structures; Wiley: Hoboken, NJ, USA, 1981. [Google Scholar]
  28. Menadi, B.; Kenai, S.; Khatib, J.; Aït-Mokhtar, A. Strength and durability of concrete incorporating crushed limestone sand. Constr. Build. Mater. 2009, 23, 625–633. [Google Scholar] [CrossRef]
  29. Choi, Y.; Choi, J.H. A Comparative Study of Concretes Containing Crushed Limestone Sand and Natural Sand. Open J. Civ. Eng. 2013, 3, 13–18. [Google Scholar] [CrossRef]
  30. Singh, B.P.; Yazdani, N.; Ramirez, G. Effect of a Time Dependent Concrete Modulus of Elasticity on Prestress Losses in Bridge Girders. Int. J. Concr. Struct. Mater. 2013, 7, 183–191. [Google Scholar] [CrossRef]
Figure 1. The friction in pre-stressed tendons.
Applsci 08 00683 g001
Figure 2. Local deviation.
Applsci 08 00683 g002
Figure 3. Arrangement for the duct based on the project of Malinghe Bridge: (a) straight tendons with 1, 3, 12, 19 and 22 wires; (b) curve tendons with 1 and 3 wires; and (c) curve tendons with 12, 19 and 22 wires (unit: mm).
Applsci 08 00683 g003
Figure 4. General view of the specimens: (a) straight tendons with 1, 3, 12, 19 and 22 wires; (b) curve tendons with 1 and 3 wires; and (c) curve tendons with 12, 19 and 22 wires.
Applsci 08 00683 g004
Figure 5. Arrangement for the duct based on the project of Wujiang Bridge: (a) straight tendons with 1 wire; (b) curve tendons with 19 wires; (c) curve tendons with 1 wire; and (d) curve tendons with 19 wires (unit: mm).
Applsci 08 00683 g005
Figure 6. General view of the specimens: (a) straight tendons with 1 wire; (b) curve tendons with 19 wires; (c) curve tendons with 1 wire; and (d) curve tendons with 19 wires.
Applsci 08 00683 g006
Figure 7. Dimension of specimens: (a) specimen for straight tendons; and (b) specimen for curve tendons (unit: mm).
Applsci 08 00683 g007
Figure 8. The used metal bellow and plastic bellow.
Applsci 08 00683 g008
Figure 9. Measurement program for κ and μ.
Applsci 08 00683 g009
Figure 10. Loading device.
Applsci 08 00683 g010
Figure 11. Instantaneous εi at each stress degree: (a) 1 wire; (b) 3 wires; (c) 12 wires; (d) 19 wires; and (e) 22 wires.
Applsci 08 00683 g011
Figure 12. Average pre-stress losses: (a) straight duct; and (b) curve duct.
Applsci 08 00683 g012
Figure 13. Instantaneous εi at each stress degree: (a) rubber hose; (b) metal bellow; and (c) plastic bellow.
Applsci 08 00683 g013
Figure 14. Average pre-stress losses: (a) 1 wire with straight duct; (b) 1 wire with curve duct; (c) 19 wires with straight duct; and (d) 19 wires with curve duct.
Applsci 08 00683 g014
Figure 15. Pre-stress forces of specimens with a single-wire and curve duct based on Wujiang Bridge made of: (a) rubber hose; (b) metal bellow; and (c) plastic bellow.
Applsci 08 00683 g015aApplsci 08 00683 g015b
Figure 16. Pre-stress forces of specimens with 19 wires and curve duct based on Wujiang Bridge made of: (a) rubber hose; (b) metal bellow; and (c) plastic bellow.
Applsci 08 00683 g016
Figure 17. Suggested values based on project of Malinghe Bridge.
Applsci 08 00683 g017
Figure 18. Suggested values based on project of Wujiang Bridge: (a) 1 wire; and (b) 19 wires.
Applsci 08 00683 g018
Table 1. Suggested values of κ and μ in Chinese code.
Material of Ductκμ
Metal bellow0.00150.200–0.250
Plastic bellow0.00150.140–0.170
Rubber hose0.00150.550
Table 2. Suggested value of κ and μ in ACI code.
Material of DuctType of Tendonκμ
Flexible metal sheathingWire tendons0.0033–0.00490.15–0.25
7-wire strand0.0016–0.00660.15–0.25
High strength bars0.0003–0.00200.08–0.30
Rigid metal duct7-wire strand0.00070.15–0.25
Table 3. Mixture of crushed limestone sand concrete (unit: kg/m3).
CementCLSCoarse AggregateWater
4587591048160
Table 4. Details of the specimen.
ProjectArrangement of DuctLength/mmNumber of TendonsMaterial of Duct
Malinghe BridgeStraight15,0001, 3, 12, 19 and 22 wiresPlastic bellow
Curve90001, 3, 12, 19 and 22 wiresPlastic bellow
Wujiang BridgeStraight18,0001 and 19 wiresMetal bellow, plastic bellow and rubber hose
Curve90001 and 19 wiresMetal bellow, plastic bellow and rubber hose
Table 5. Measured pre-stress loss.
WiresStraight TendonsCurve Tendons
Na/kNNb/kNPre-Stress LossNa/kNNb/kNPre-Stress Loss
1214.43204.644.57%217.63190.9312.27%
215.26208.253.26%215.36187.1113.12%
216.29200.827.15%214.02178.7616.48%
3585.98538.028.18%523.97461.6011.90%
590.98536.369.24%530.58467.4511.90%
601.00543.809.52%542.98489.989.76%
122327.212185.956.07%2312.401835.5620.62%
2348.912214.885.71%2258.681846.4118.25%
2337.232205.795.62%2300.001823.8720.70%
193705.433465.156.48%3548.843256.068.25%
3713.183462.126.76%3556.593265.158.19%
3644.963357.587.88%3499.223309.095.43%
223996.903883.332.84%4144.193650.0011.92%
4043.413939.392.57%4167.443757.589.83%
4124.034012.122.71%4192.253724.2411.16%
Table 6. Measured pre-stress loss.
MaterialWiresStraight TendonsCurve Tendons
Na/kNNb/kNPre-Stress LossNa/kNNb/kNPre-Stress Loss
Rubber hose1185.11174.365.81%184.28147.5919.91%
187.71174.886.84%195.72160.9317.78%
189.79176.437.04%189.27161.3314.76%
193352.952067.6738.33%3365.081975.9441.28%
3444.322396.9930.41%3334.112045.1138.66%
3398.642232.3334.32%3304.682115.7935.98%
Metal bellow1175.85170.942.79%184.80171.237.34%
180.01174.882.85%184.48162.7311.75%
184.59178.503.30%181.36167.289.28%
193249.193057.145.91%3229.052368.4226.65%
3346.763090.237.67%3244.542363.9127.14%
3297.973073.686.80%3236.802366.1726.90%
Plastic bellow1185.63172.117.28%182.51165.099.29%
180.01171.174.91%180.01162.4710.73%
184.80172.426.70%182.09167.278.09%
193142.082766.9211.94%3354.502906.7713.35%
3236.552766.9214.51%3334.372818.0515.48%
3199.382899.259.38%3171.752600.0018.03%
Table 7. Suggested values for CLS concrete at each case.
Material of DuctSingle-WireMulti-Wire
κμκμ
Metal bellow0.00170.6540.00300.337
Plastic bellow0.00400.2890.00700.108
Rubber hose0.00390.8580.01600.378

