Communication

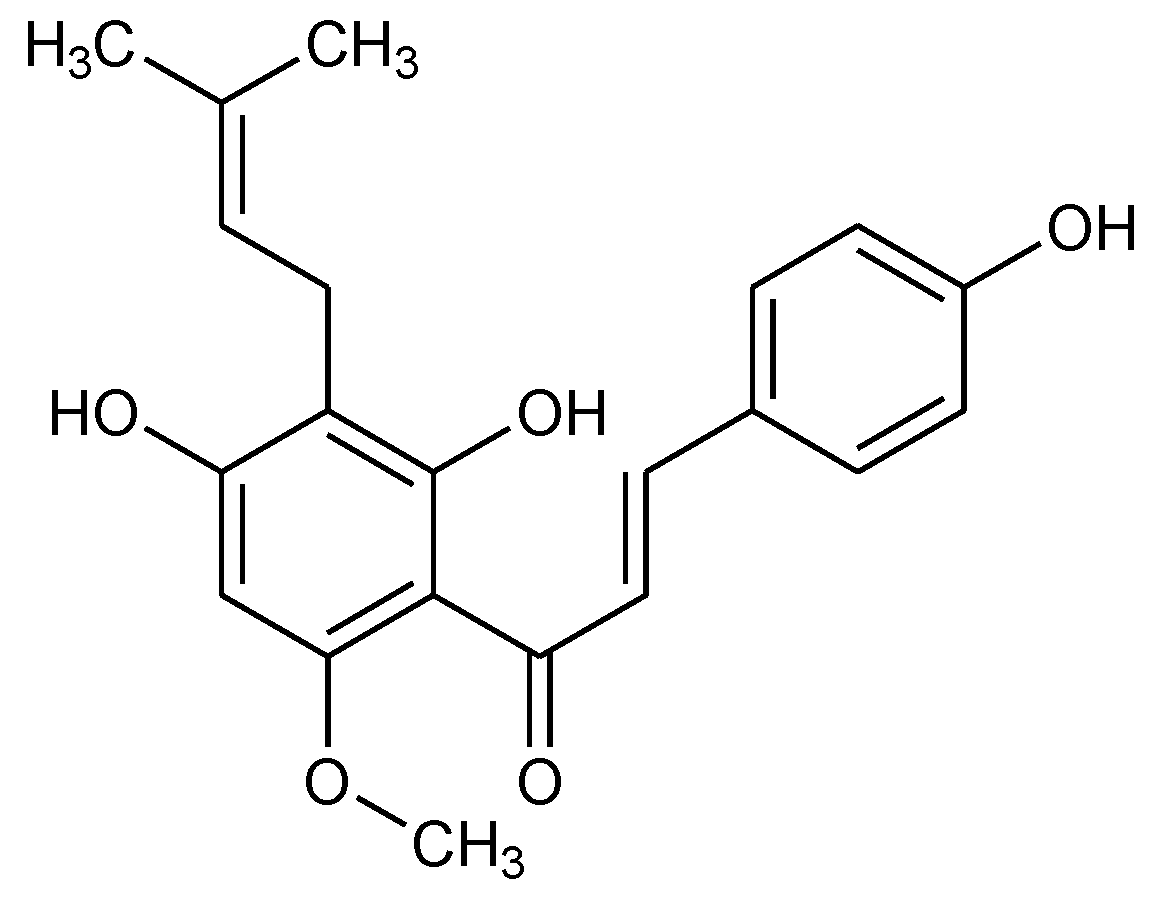
Experimental and Simulation Identification of Xanthohumol as an Inhibitor and Substrate of ABCB1

1
State Key Laboratory of Biological Fermentation Engineering of Beer, Qingdao 266061, China
2
Key Laboratory of Marine Bioactive Substance, The First Institute of Oceanography, State Oceanic Administration, Qingdao 266061, China
3
College of Science and Mathematics, Rowan University, Glassboro, NJ 08028, USA
4
Department of Medicine, Division of Hematology-Oncology, University of Pittsburgh, Pittsburgh, PA 15232, USA
5
Cancer Therapeutics Program, University of Pittsburgh Cancer Institute, University of Pittsburgh, Pittsburgh, PA 15232, USA
6
School of Foreign Language, Qufu Normal University, Qufu 273165, China
7
School of Medicine and Pharmacy, Ocean University of China, Qingdao 266003, China
*
Authors to whom correspondence should be addressed.
Appl. Sci. 2018, 8(5), 681; https://doi.org/10.3390/app8050681
Submission received: 30 March 2018 / Revised: 11 April 2018 / Accepted: 15 April 2018 / Published: 27 April 2018
(This article belongs to the Section Chemical and Molecular Sciences)

Abstract

:
Xanthohumol (XN) is a well-known prenylated flavonoid found in Humulus lupulus L. It is involved in several pharmacological activities, including the sensitization of doxorubicin-resistant breast cancer (MCF-7/ADR) cells to doxorubicin (DOX) through a reduction in cell viability and stemness. In the present study, we revealed another mechanism to further explain the reverse of the drug resistance of XN. In the MCF-7/ADR cell line, we found that XN inhibited the efflux functions of ATP-binding cassette subfamily B member 1 (ABCB1). We also observed that XN was a substrate of ABCB1 and stimulated its ATPase activity. Moreover, our results revealed that XN showed a synergic effect with the ABCB1 substrate colchicine (COL) in the MCF-7/ADR cell line. Further, we showed that XN bound to the central transmembrane domain (TMD) site, overlapping with the DOX binding site. This mechanism was supported by molecular modeling and simulation data, which revealed that XN bound to the ABCB1 transmembrane domain, where doxorubicin also binds, and its binding affinity was stronger than that of doxorubicin, resulting in less protein and ligand position fluctuation. These results support the XN-induced reversal of drug resistance via the inhibition of ABCB1-mediated transport of doxorubicin, stimulating ABCB1 ATPase activity and acting as a substrate of ABCB1.

1. Introduction

ATP-binding cassette subfamily B member 1 (ABCB1; also known as p-glycoprotein [Pgp] or multidrug resistance protein 1 [MDR1]) belongs to the family of ABC membrane transporters. The most studied biological role of ABCB1 is exporting chemically unrelated substrates; therefore, it is usually involved in MDR to cancer chemotherapy, and the modulation of drug pharmacokinetics and interactions [1,2]. ABCB1 has different kinds of substrates, ranging in size from 330 Da up to 4000 Da [1]. Inhibitors of ABCB1, as well as its non-toxic substrates, might be used to overcome drug resistance and understand the intestinal absorption of drugs. Much effort has been devoted to screening for natural phytochemicals, which can inhibit ABCB1-mediated transport, and thus have the potential application of reversing drug resistance [3].
Xanthohumol (XN, Figure 1) is a well-known prenylated flavonoid that exists uniquely in hops (Humulus lupulus L.), and its general dietary source is beer. As we have reviewed previously, XN has multiple health benefits, mainly including metabolic syndrome attenuating effects, hepatic protection effects, antimicrobial activity, anti-parasite effects, cancer chemo-preventive effects, cancer therapeutic activity [4], and also inhibitory activities in cancer angiogenesis [5,6]. Interestingly, recent studies have shown that XN could sensitize cancer cells to certain anticancer drugs [7,8]. Moreover, XN was considered to be an inhibitor of the breast cancer resistance protein (ABCG2) transporter [9]. Considering that both ABCB1 and ABCG2 play a vital role in MDR and share some common substrates, we investigated whether XN could also be a substrate of ABCB1, which might account for its drug resistance reversing effects.
Here, for the first time, we identified XN as a new substrate of ABCB1 that competitively inhibits ABCB1 transport functions, increasing the efficiency of the chemotherapy agent substrates of ABCB1, e.g., doxorubicin (DOX) and colchicin (COL). Our molecular docking studies further revealed that XN could bind to ABCB1 with the same binding site of DOX.

2. Materials and Methods

2.1. Reagents and Cells

Nanjing Spring and Autumn Biological Engineering Co., Ltd., Nanjing, China, provided the compound XN. The kit for Pgp-Glo™ ATPase assay was obtained from Promega Corporation, Madison, WI, USA. Other materials were purchased from Beyotime Biotechnology, Shanghai, China. The doxorubicin resistance MCF-7/ADR cell line was established by increasing DOX concentrations in the culture medium of MCF-7 until reaching a concentration of 0.5 μM, as previously described [10]. The MCF-7/ADR cell line was cultured at Roswell Park Memorial Institute (RPMI)-1640, supplemented with 10% fetal bovine serum (FBS), and maintained in the presence of DOX, penicillin, and streptomycin at 37 °C in 5% CO2.

2.2. Detection of Intracellular DOX Accumulation

For the intracellular DOX accumulation assay, the MCF-7/ADR cell line was pretreated with different concentration of XN (0–20 μM) for 34 h and then co-incubated with DOX (10 μM) for another 6 h. After the compound treatment, we harvested the cells and analyzed the autofluorescence of the DOX using a flow cytometer.

2.3. Rhodamine123 (Rho123) Efflux Assay

For the Rho123 efflux assay, the MCF-7/ADR cell line was pretreated with different concentrations of XN (0–40 μM) for the first 34 h, after which with 10 μM Rho123 for two hours. The intracellular Rho123 was detected using flow cytometry (with an excitation wavelength of 488 nm and emission wavelength of 530 nm).

2.4. ABCB1 ATPase Activity Assay

The ATPase activity of ABCB1 was assayed using a Pgp-Glo™ kit, according to the protocol provided by the manufacturer. Verapamil (200 μM), which acts as a positive control, and the tested compound XN (0–40 μM), were mixed with 25 μg ABCB1 and MgATP (5 mM) for 40 min at 37 °C. Then, the concentration of ATP remaining in the reaction system was measured. The ATPase activity of ABCB1 treated with XN or verapamil was compared to the basal ABCB1 ATPase activity.

2.5. Drug Synergism Calculation

The cell line was cultured with colchicine (COL) alone, XN alone, or COL and XN together. After 72 h treatment, a proliferation assay was carried out. Synergism between the two drugs was evaluated as described previously [11]. Calcusyn was used to calculate the combination index (CI). CI values < 1 indicated a synergistic effect, CI values = 1 indicated an additive effect, and CI values > 1 indicated an antagonistic effect.

2.6. Molecular Docking

Model generation, ligand preparation, docking, and molecular dynamics (MD) were conducted using Schrödinger Suite 2015. A mouse ABCB1a crystal structure (PDB ID: 4Q9I) [12] was used to construct a human ABCB1 homology model. Maestro Elements was used to prepare the ligands. A 2D sketcher was employed to draw the DOX and XN 2D structures. Epik was used to generate the ionization/tautomeric states pH 7, and select the lowest ionization/tautomeric states. To relax the ligand structure, minimization was used. ADP from a maltose transporter (PDB ID: 3PUV) was modified to ATP before transfer into the 4Q9I crystal structure. The ABCB1 (4Q9I) nucleotide binding domain (NBD) was structurally assigned with the NBD of the maltose transporter (3PUV), and two ATP molecules from 3PUV were incorporated into 4Q9I. Glide XP docking followed by induced fit docking (IFD) was used to dock DOX and XN into the transmembrane domain. For Glide XP ligand docking, from the prepared proteins, the protein grid files were generated, where the crystal ligand (QZ-Ala) centroid was employed to determine the active site. A Glide XP scoring function was used to dock the ligands DOX and XN separately into the generated grid. The obtained complexes from the Glide XP docking were further subjected to IFD to obtain the final complexes (Figure S1).

2.7. Molecular Dynamics Simulations and Analysis

2.7.1. Simulation System Setup

IFD was applied to generate the structural models of protein-ligand complexes as the starting conformation for MD simulations. Each of the docked complex models was first placed in a membrane of 1-palmitoyl-2-oleoyl-sn-glycero-3-phosphocholine (POPC) lipid-bilayer, then solvated in an orthorhombic water box with a buffer distance of 10 Å using the simple point-charge (SPC) water model. The constructed tri-phase model systems were further neutralized using Na+ ions by adding NaCl salt at a concentration of 0.15 M. The OPLS3 force field was used in docking and system preparation.

2.7.2. System Relaxation and MD Simulations

For each of the two prepared systems, the model was first relaxed using the Desmond module, following the default protocol for membrane protein relaxation [13]. A 1000-ns constant-temperature, constant-pressure (NPT) MD simulation was then launched as the production run. Specifically, the temperature was kept at 310 K using the Nosé–Hoover chain coupling scheme [14] with a coupling constant of 1 ps. The pressure was maintained at 1 bar using the Martyna–Tuckerman–Klein chain coupling scheme [14] with a coupling constant of 2 ps. All bonds connecting hydrogen atoms were constrained using M-SHAKE [13] to enable 2-fs time step simulations. The long-range electrostatic interaction was treated by the k-space Gaussian split Ewald method [14] under periodic boundary conditions (charge grid spacing, ~1.0 Å; direct sum tolerance, 10–9). While the cutoff distance for short-range non-bonded interactions was set to 9 Å, the long-range Van der Waals (VDW) interaction cutoff was based on uniform density approximation. Non-bonded forces were calculated using an r-RESPA integrator [15], where the short-range forces were updated each step, and the long-range forces were updated every three steps. The simulation trajectories were saved at 50-ps intervals.

2.7.3. Simulation Interaction Diagrams (SID)

Simulation trajectories were analyzed to explore the protein–ligand interactions using the Desmond SID tool. Specifically, root mean square deviation (RMSD; Figure S2), root mean square fluctuation (RMSF), secondary structure changes (Figure S3), protein-ligand contacts (Figures S4 and S5), and ligand torsion profiles (Figure S6), were derived from the simulation results.

2.7.4. Convergence of Simulations

We checked the convergence of each MD simulation trajectory by analyzing the protein Cα and ligand RMSD plots (Figure S2). The relatively stable RMSD within the last 200 ns indicated that the complex systems reached a steady state at the later simulation stage.

2.7.5. MM-GBSA Binding Energies

For each system, the molecular mechanics/generalized Born surface area (MM-GBSA) binding energy was calculated based on the last 200 ns simulation results. The OPLS3 force field, VSGB 2.0 solvation model, and the default Prime parameter were used for the MM-GBSA calculations, which consisted of three calculation steps: receptor alone minimization, ligand alone minimization, and receptor–ligand complex minimization. The total binding free energy was finally calculated as ΔG(bind) = Ecomplex(minimized) − (Eligand(minimized) + Ereceptor(minimized)). For each of the minimization steps, three energy components were analyzed, including Eelectrostatics(Hbond + Ecoulomb + EGB_solvation), EvdW (EvdW + Eπ−π stacking + Eself-contact), and Elipophilic.

2.8. Data Analysis

One-way analysis of variance (ANOVA) followed by Tukey’s post hoc test was used for the statistical analysis of the data. Data were expressed as means ± standard deviations (SD). p < 0.05 was considered statistically significant.

3. Results

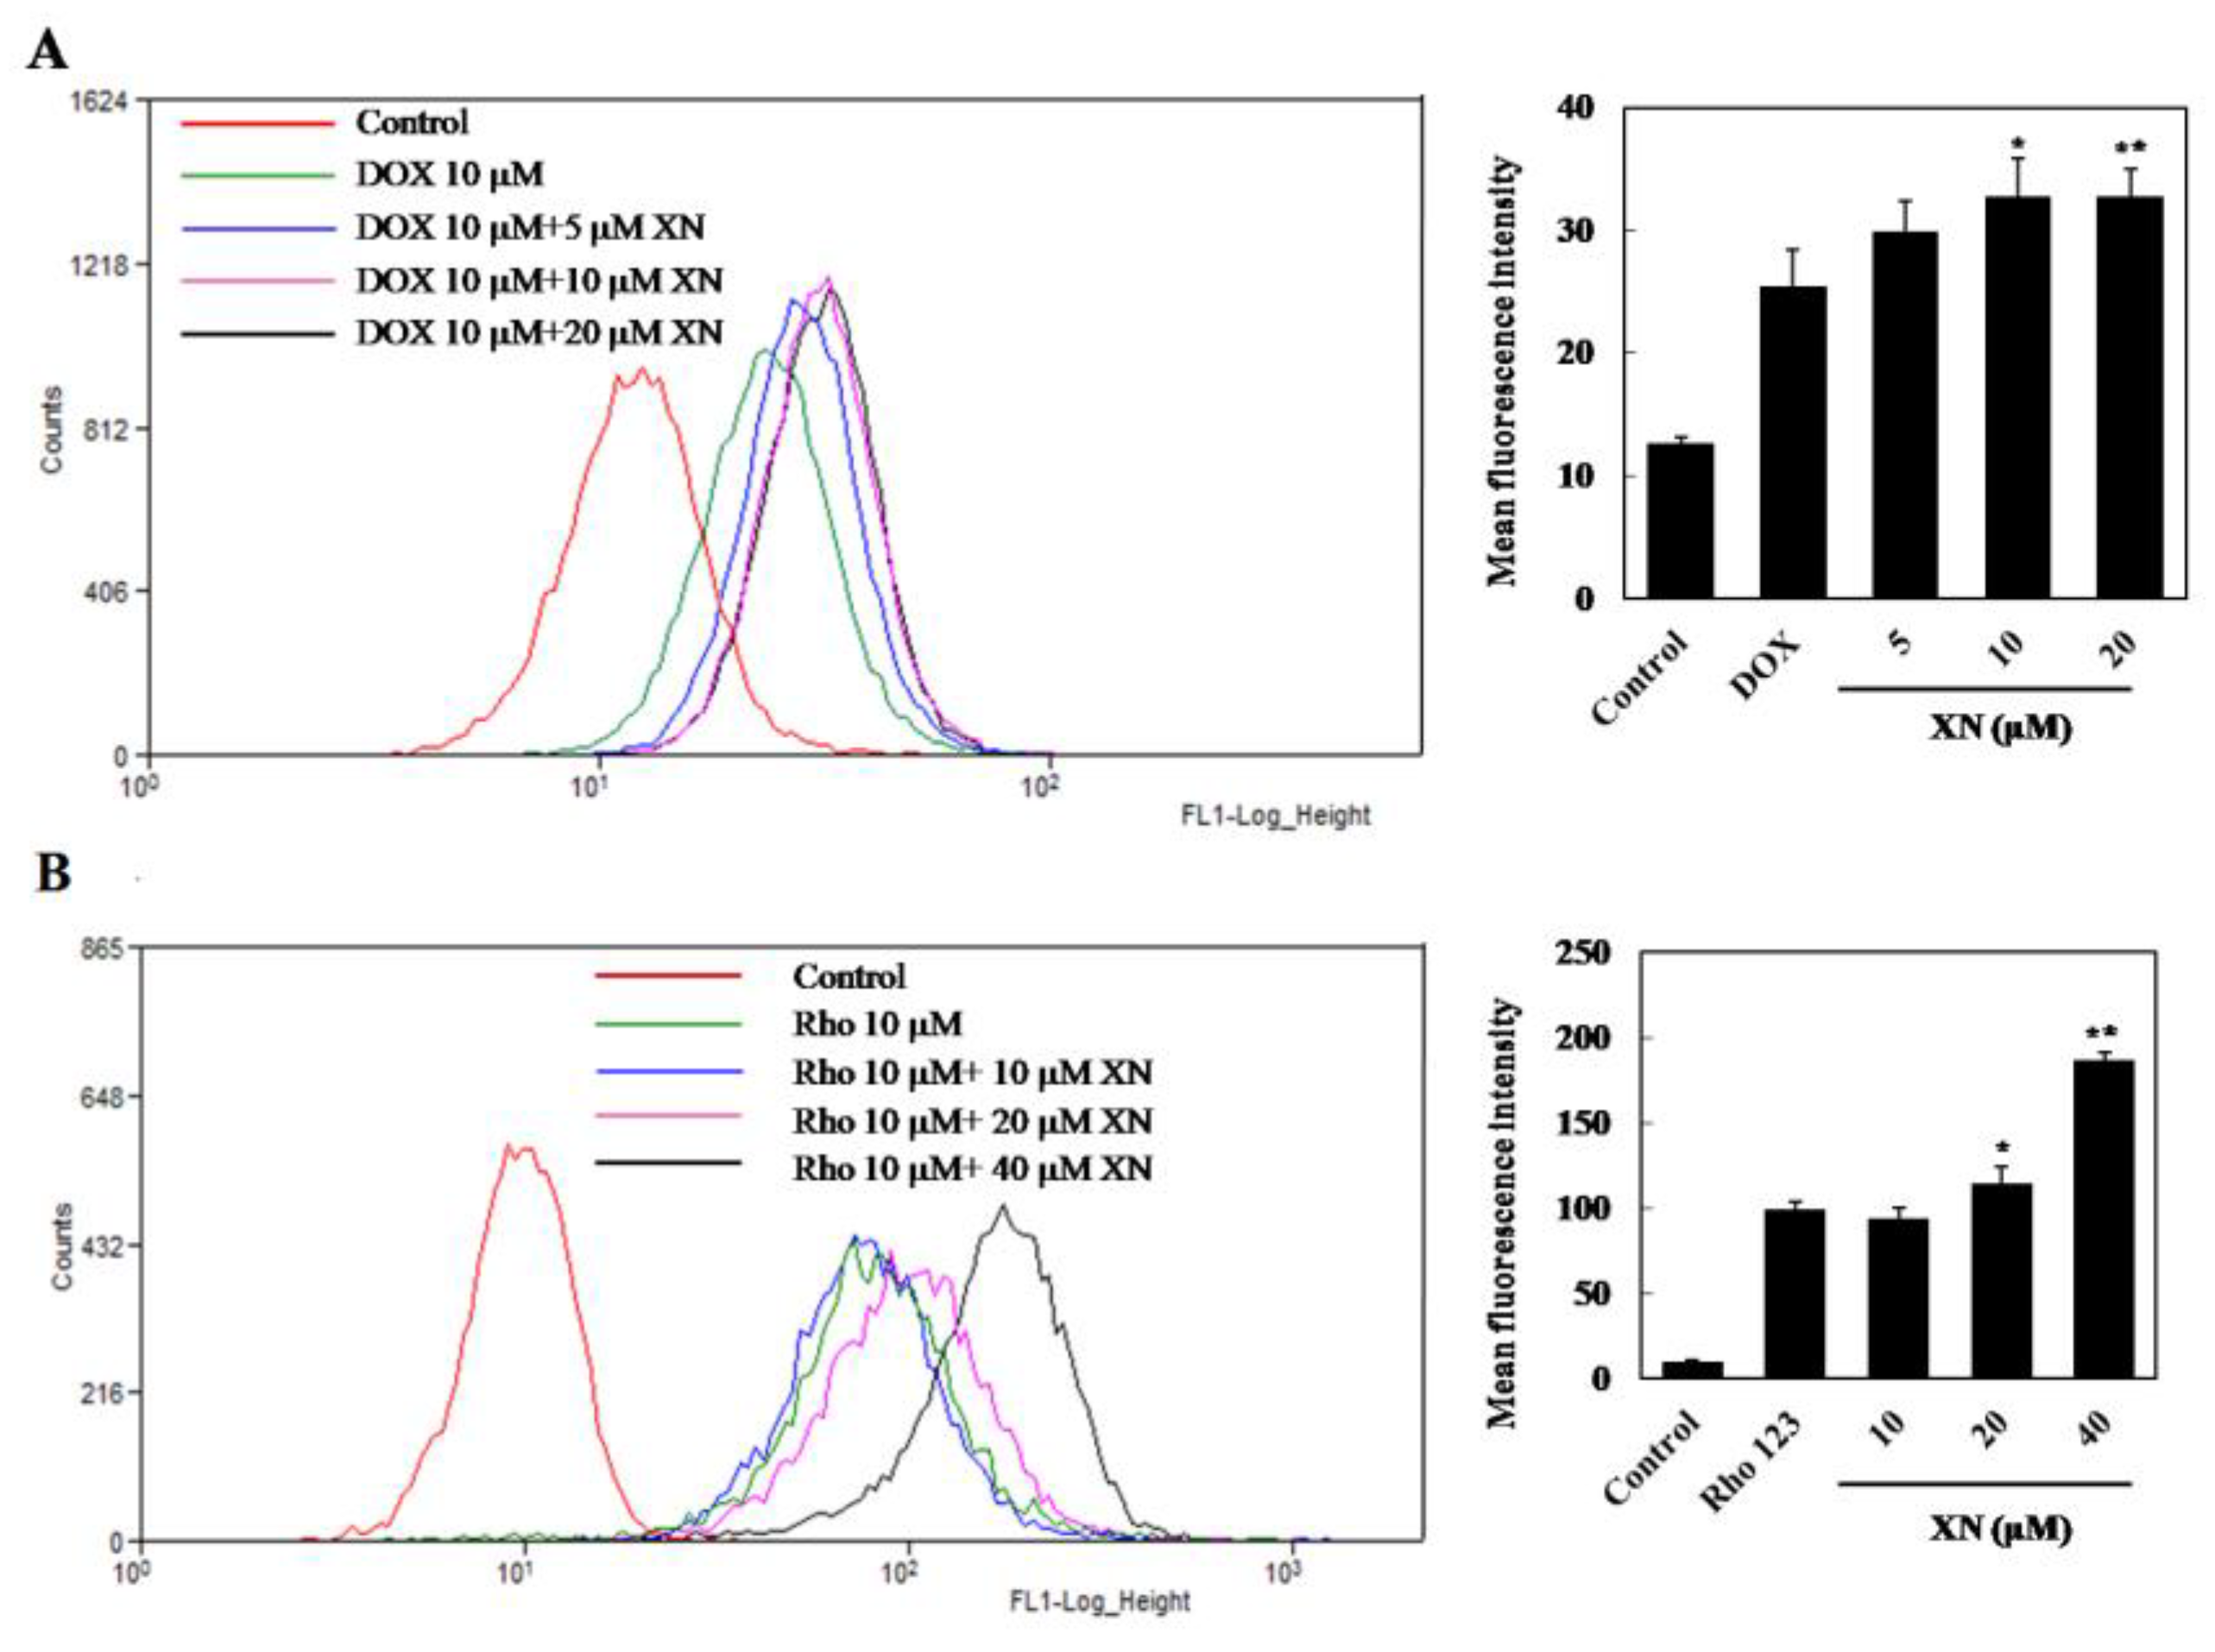
3.1. XN Inhibited the Efflux Functions of ABCB1 in MCF-7/ADR Cells

Our previous works have revealed XN exhibits significant synergistic effects with DOX [8]. To determine whether XN could modulate ABCB1 efflux function, we measured the intracellular DOX concentration when treated or untreated with XN using flow cytometry. Our results showed that there was only a little intracellular DOX when treated with XN, whereas XN concentration-dependently increased DOX accumulation intracellularly (Figure 2A), suggesting that XN was able to decrease DOX efflux.
We further confirmed that XN inhibited ABCB1 transport functions via evaluation of the efflux of the ABCB1 substrate, Rho123, from MCF-7/ADR cells. As shown in Figure 2B, XN could significantly and concentration-dependently increase the intracellular Rho123 concentration, emphasizing that XN could inhibit the efflux function of ABCB1.

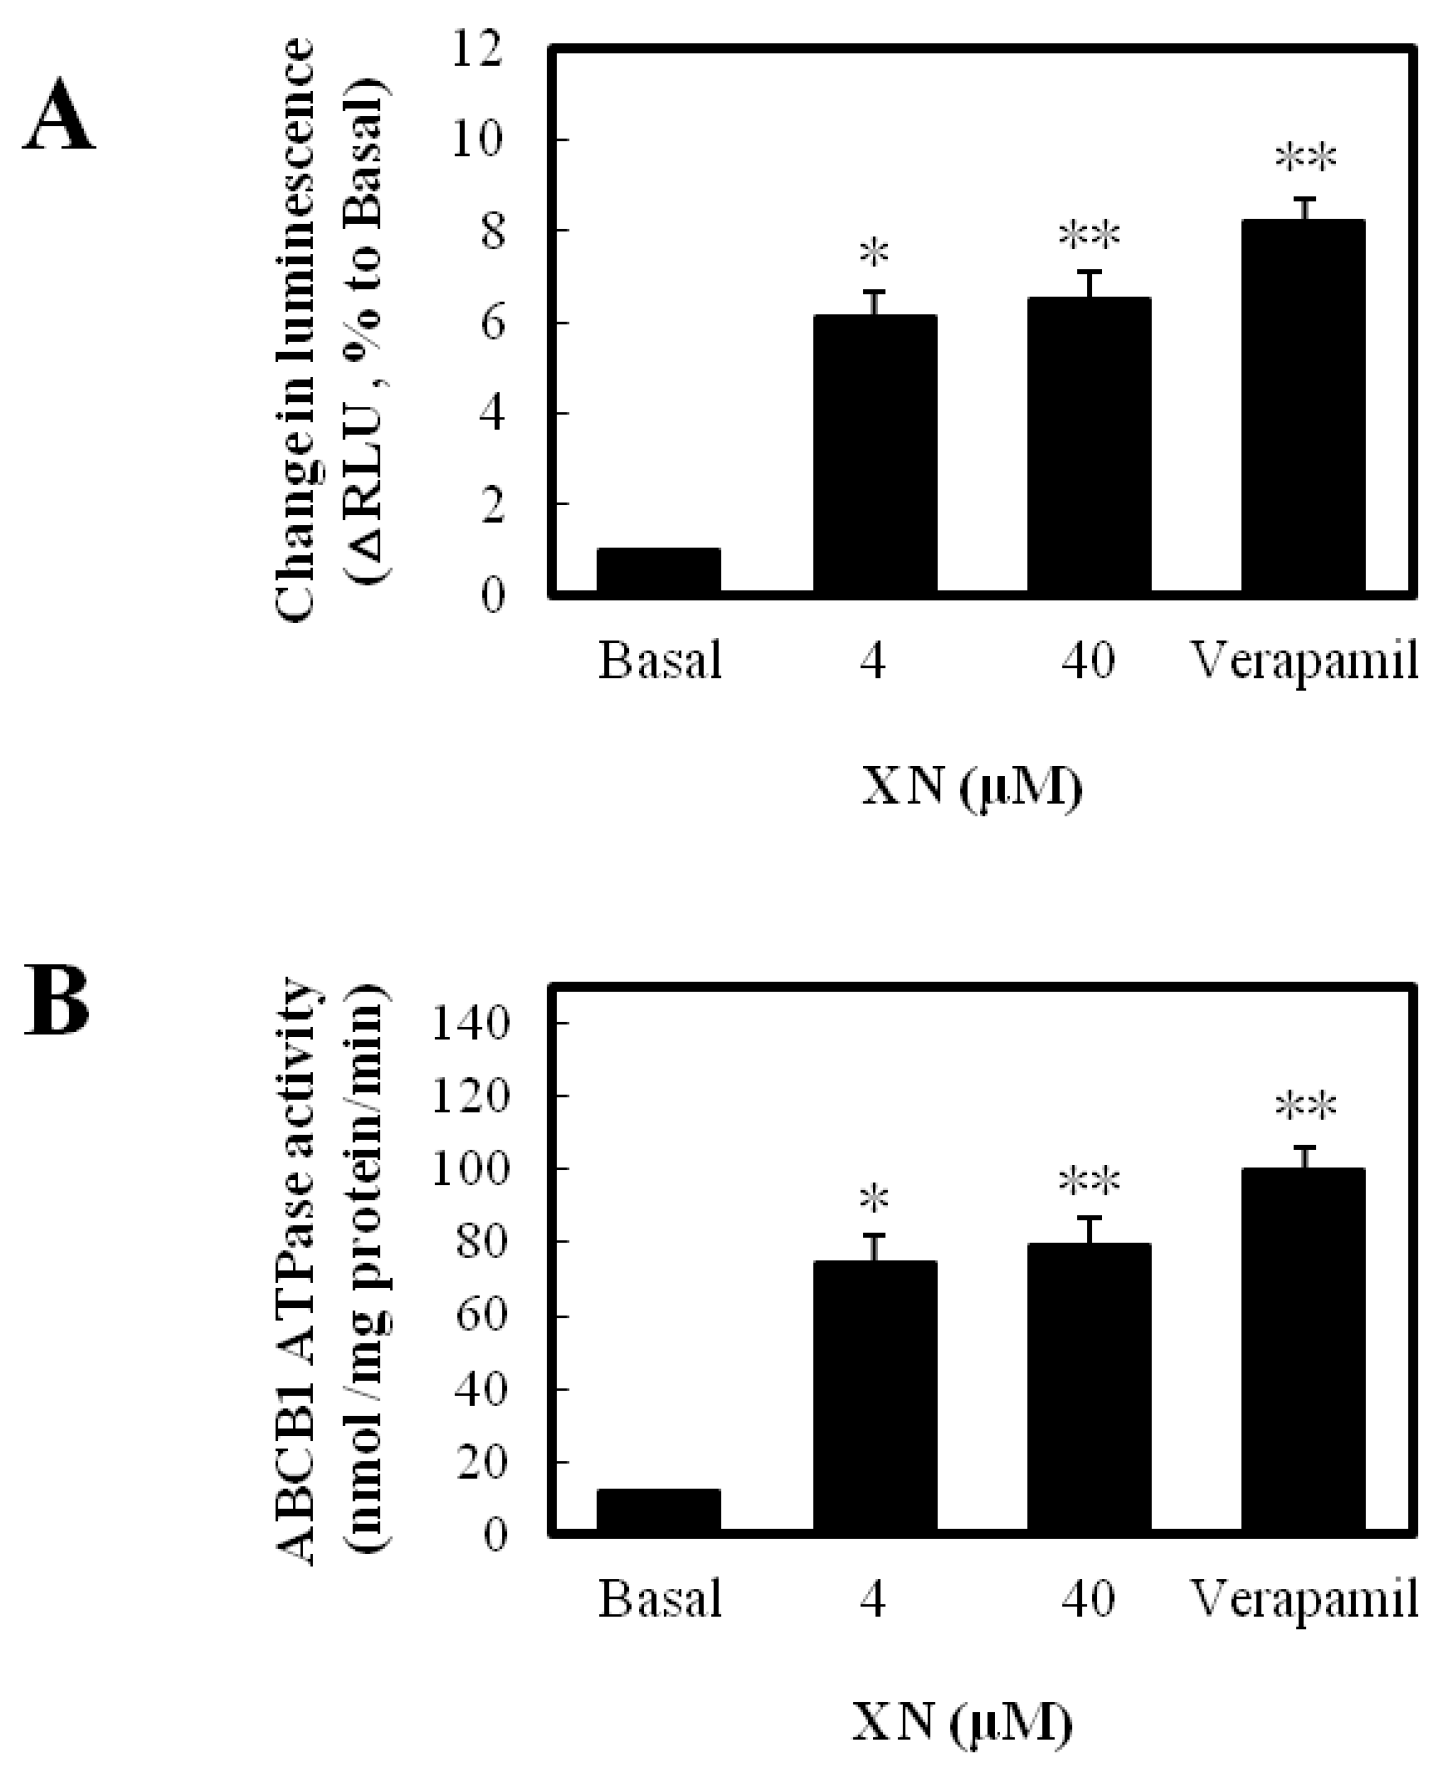
3.2. XN Was a Substrate of ABCB1 and Stimulated Its ATPase Activity

Next, we evaluated the effects of XN on ABCB1-mediated ATP hydrolysis. The positive control, verapamil, which is a classic substrate of ABCB1, showed ABCB1 substrate characteristics (Figure 3A) and stimulated ABCB1 ATPase activity (Figure 3B). Similarly, XN showed classic ABCB1 substrate characteristics (Figure 3A) and stimulated ABCB1 ATPase activity (Figure 3B). This result suggests that XN might be a substrate of ABCB1, which could competitively inhibit ABCB1-mediated DOX transport.

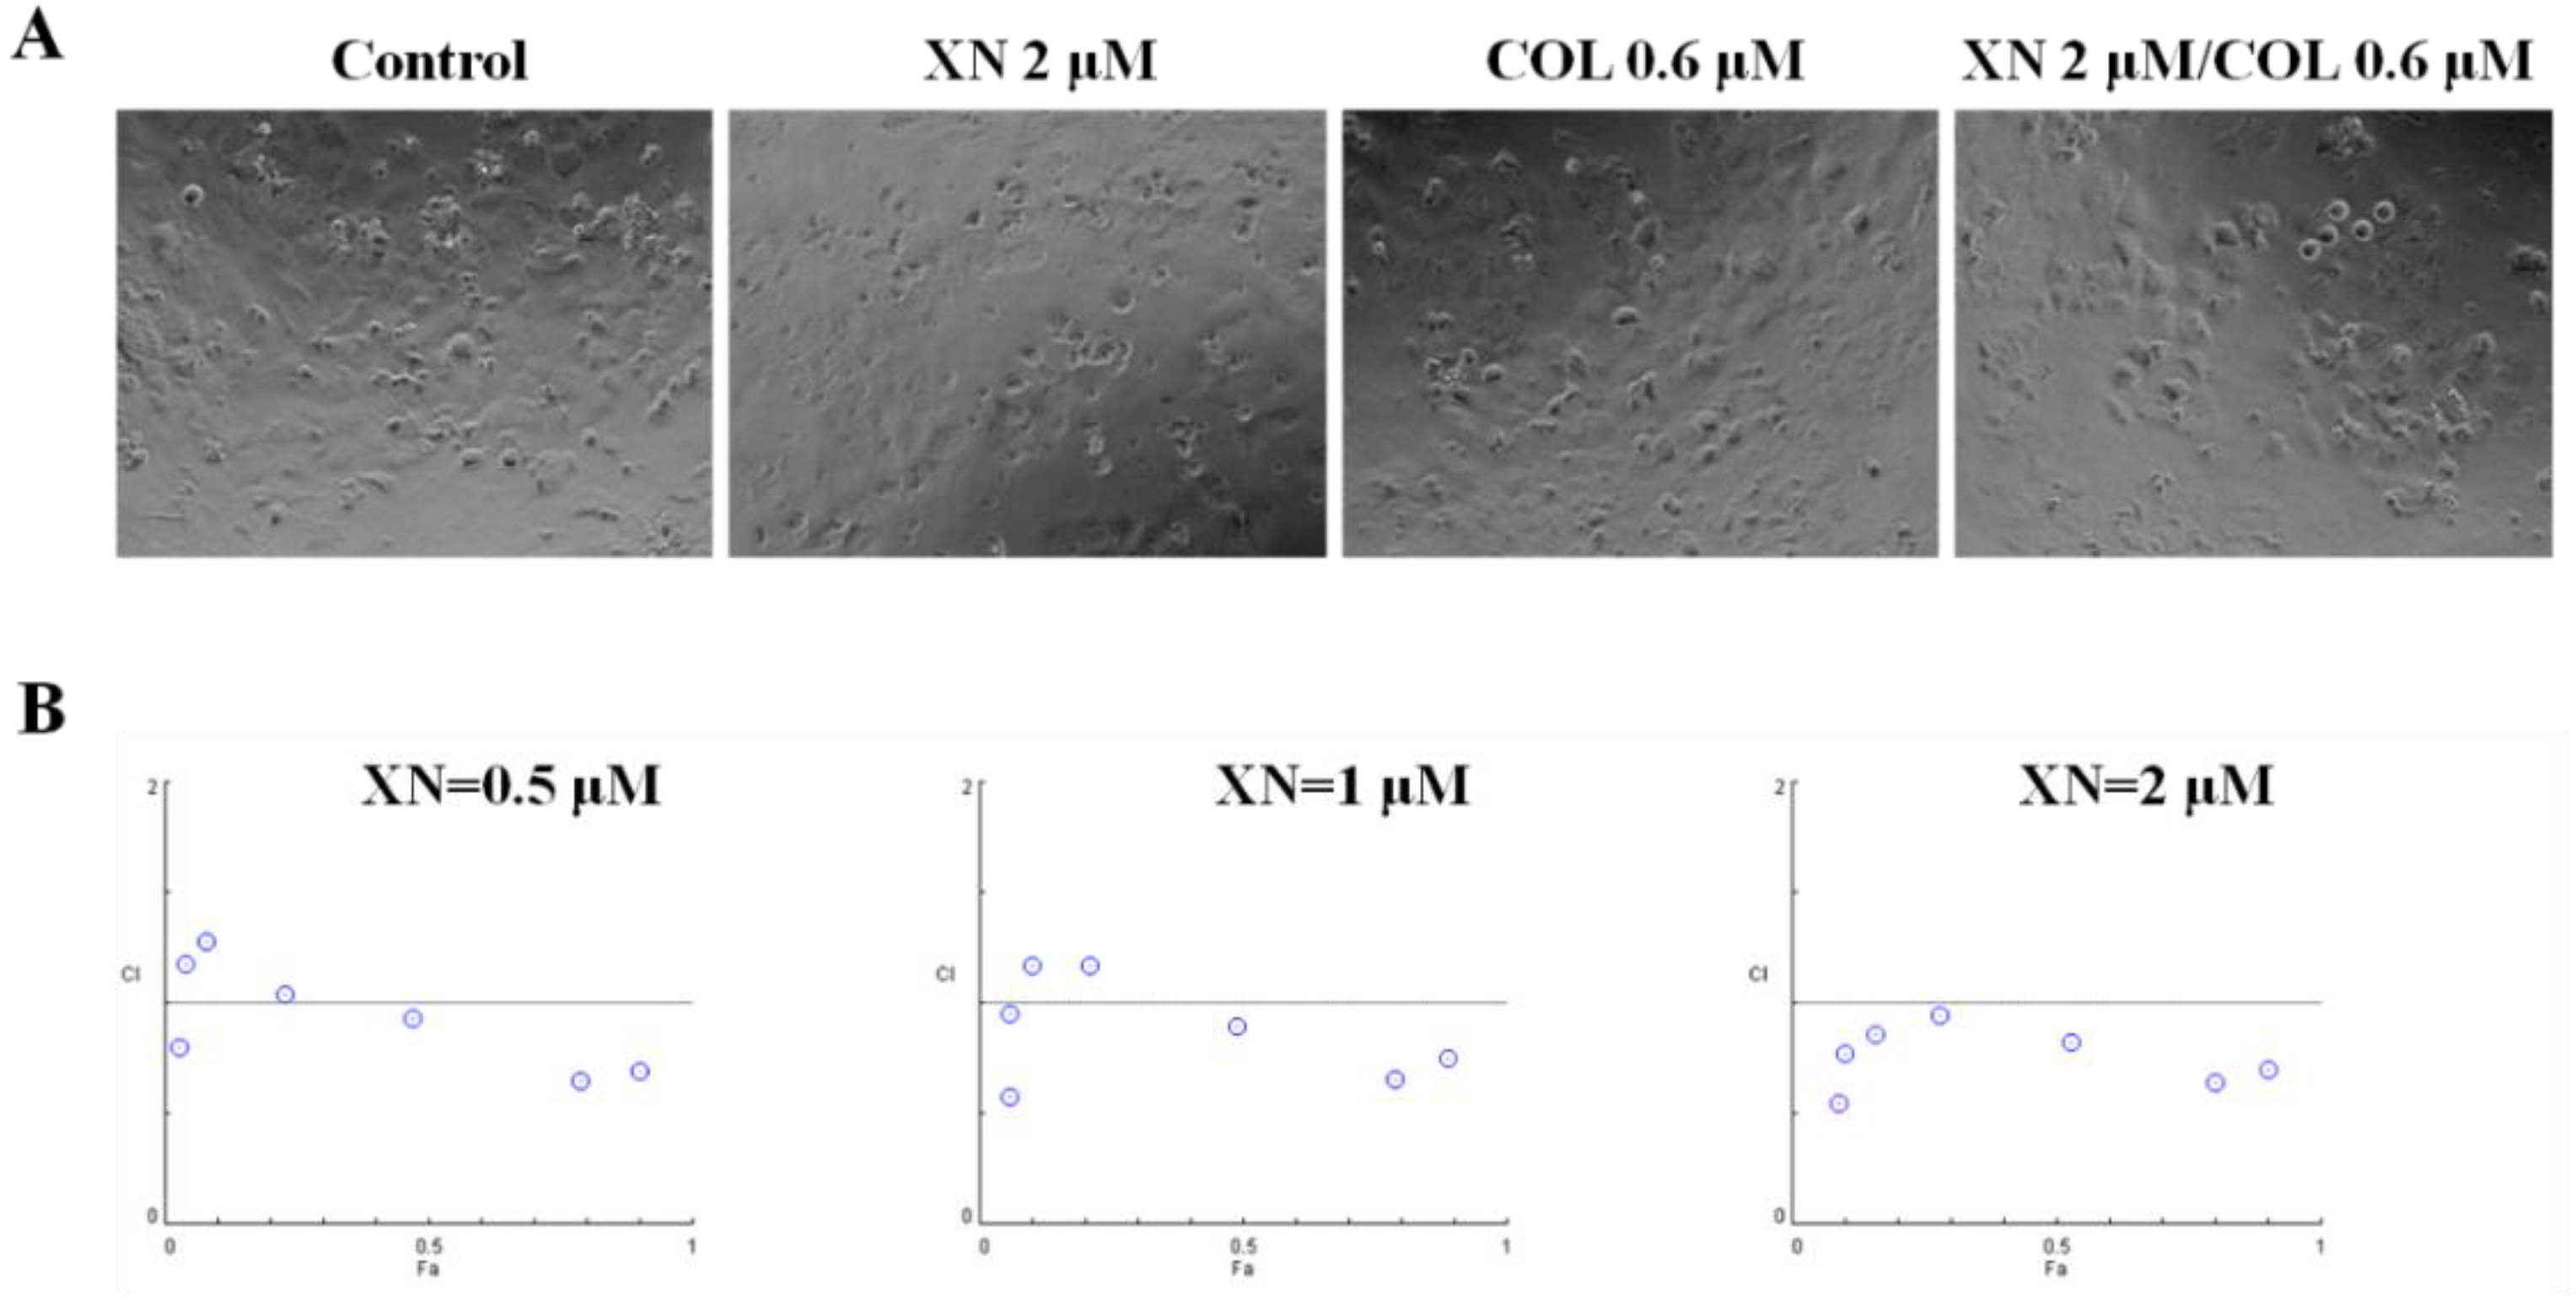
3.3. XN Showed a Synergic Effect with COL in MCF-7/ADR Cells

To further confirm that XN is a substrate of ABCB1, we examined whether XN could increase the cytotoxicity of the ABCB1 substrate, COL, in MCF-7/ADR cells. Neither COL nor XN alone had significant inhibitory effects against cell viability at the indicated concentrations; however, when administrated with XN, COL could remarkably inhibit the growth of MCF-7/ADR cells (Figure 4A). We then conducted an isobolographic analysis and evaluated the synergistic effects. As shown in Figure 4B and Table 1, COL in combination with XN at 1 and 2 μM, resulted in strong synergism between XN, as evidenced by CI values < 1, and in addition, the synergistic effects increased with increasing concentrations of XN. This result is supported by our published results showing XN exhibited synergic effects with DOX (also a ABCB1 substrate) in MCF-7/ADR cells [8]. Taken together, we confirmed that XN is a substrate of the ABCB1 transporter.

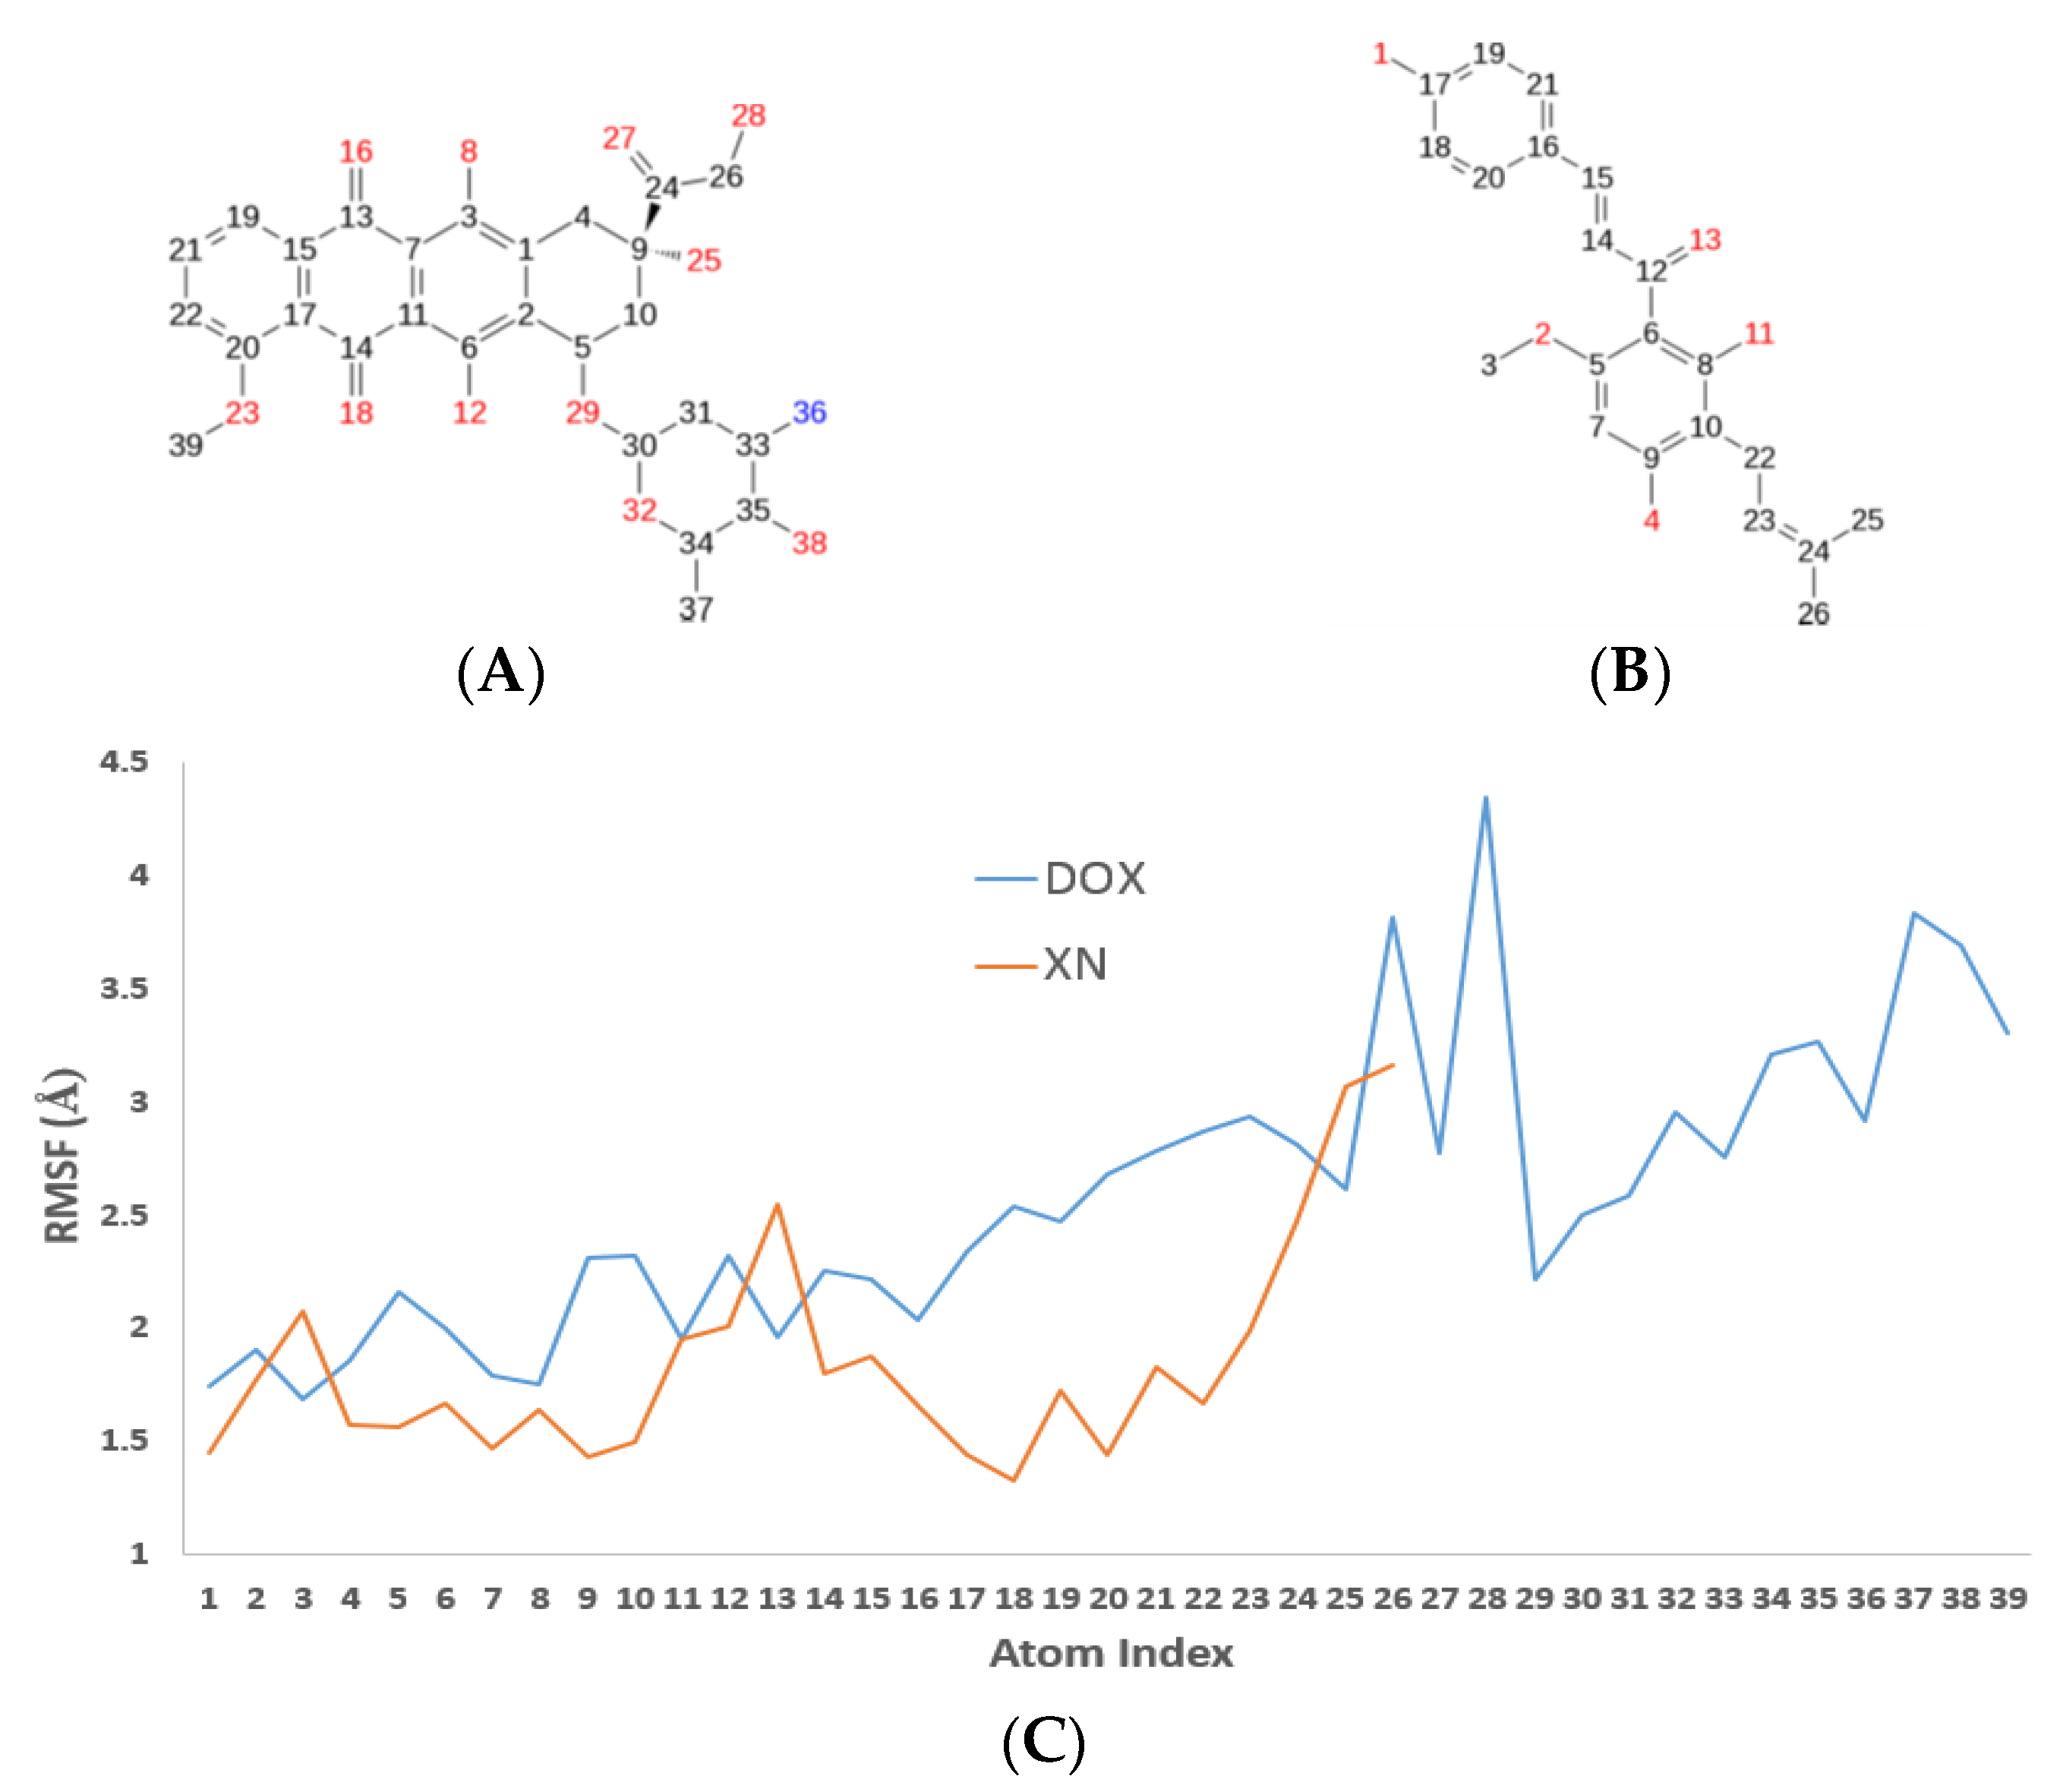
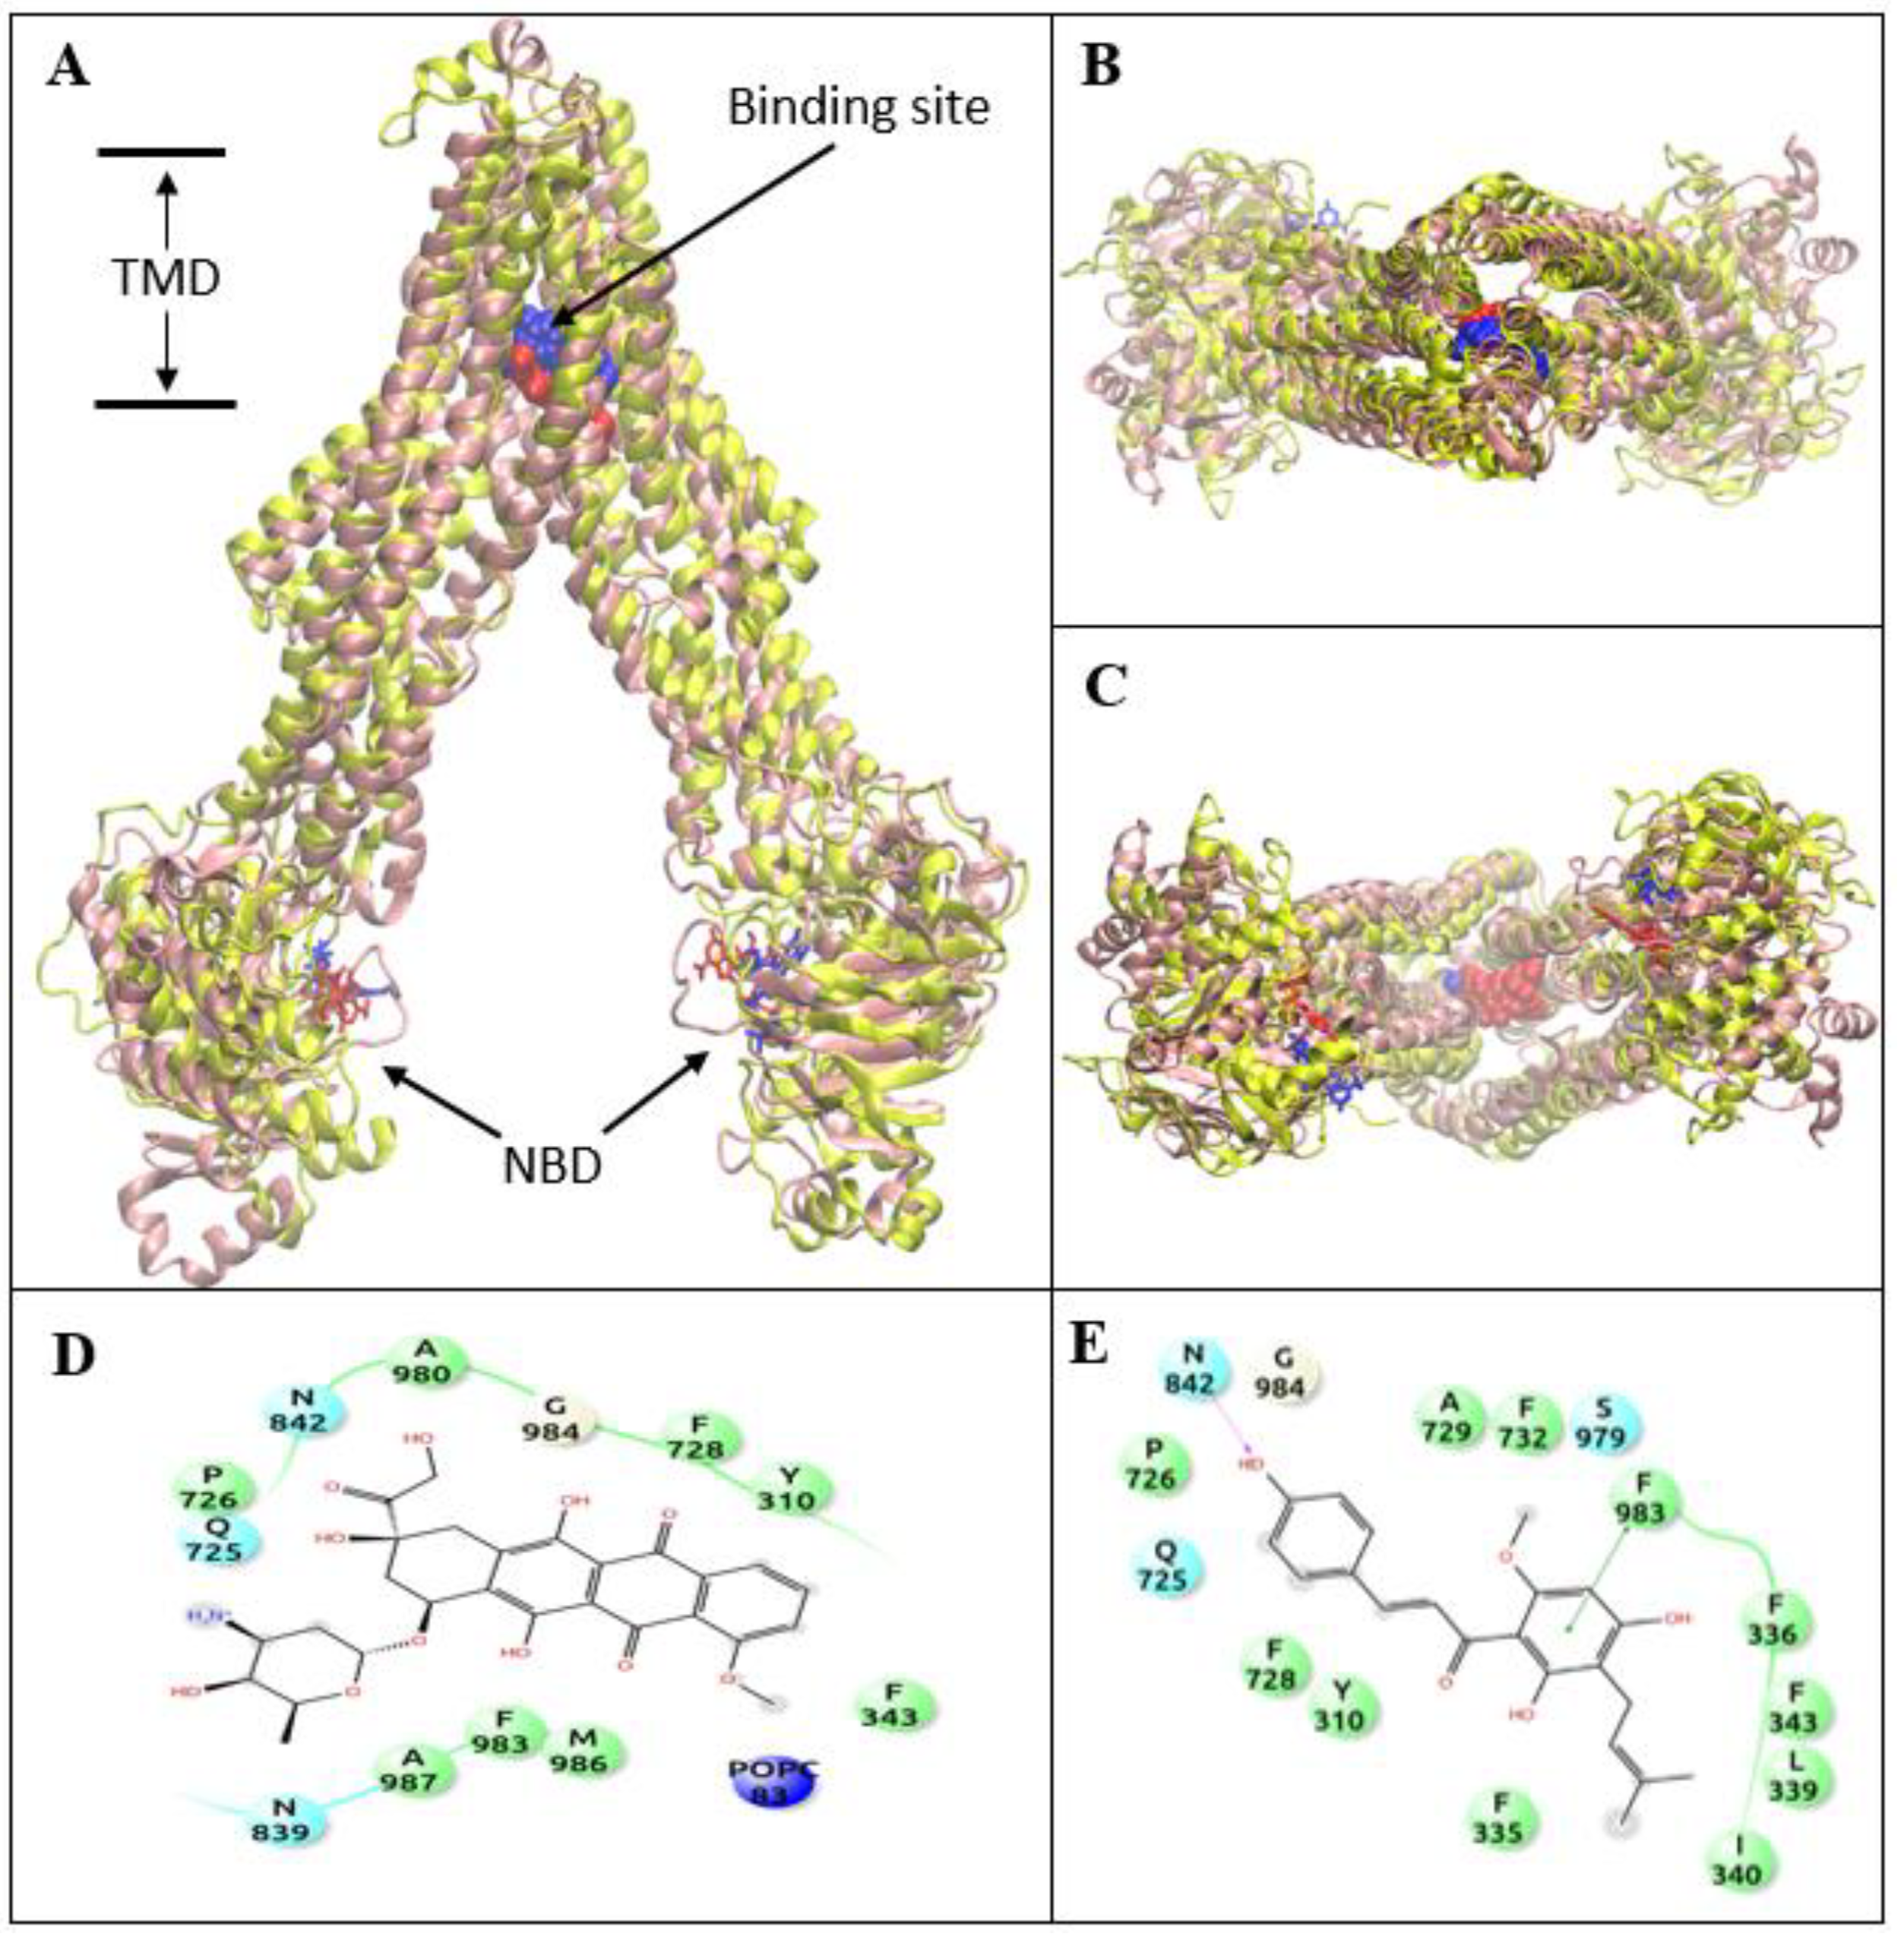
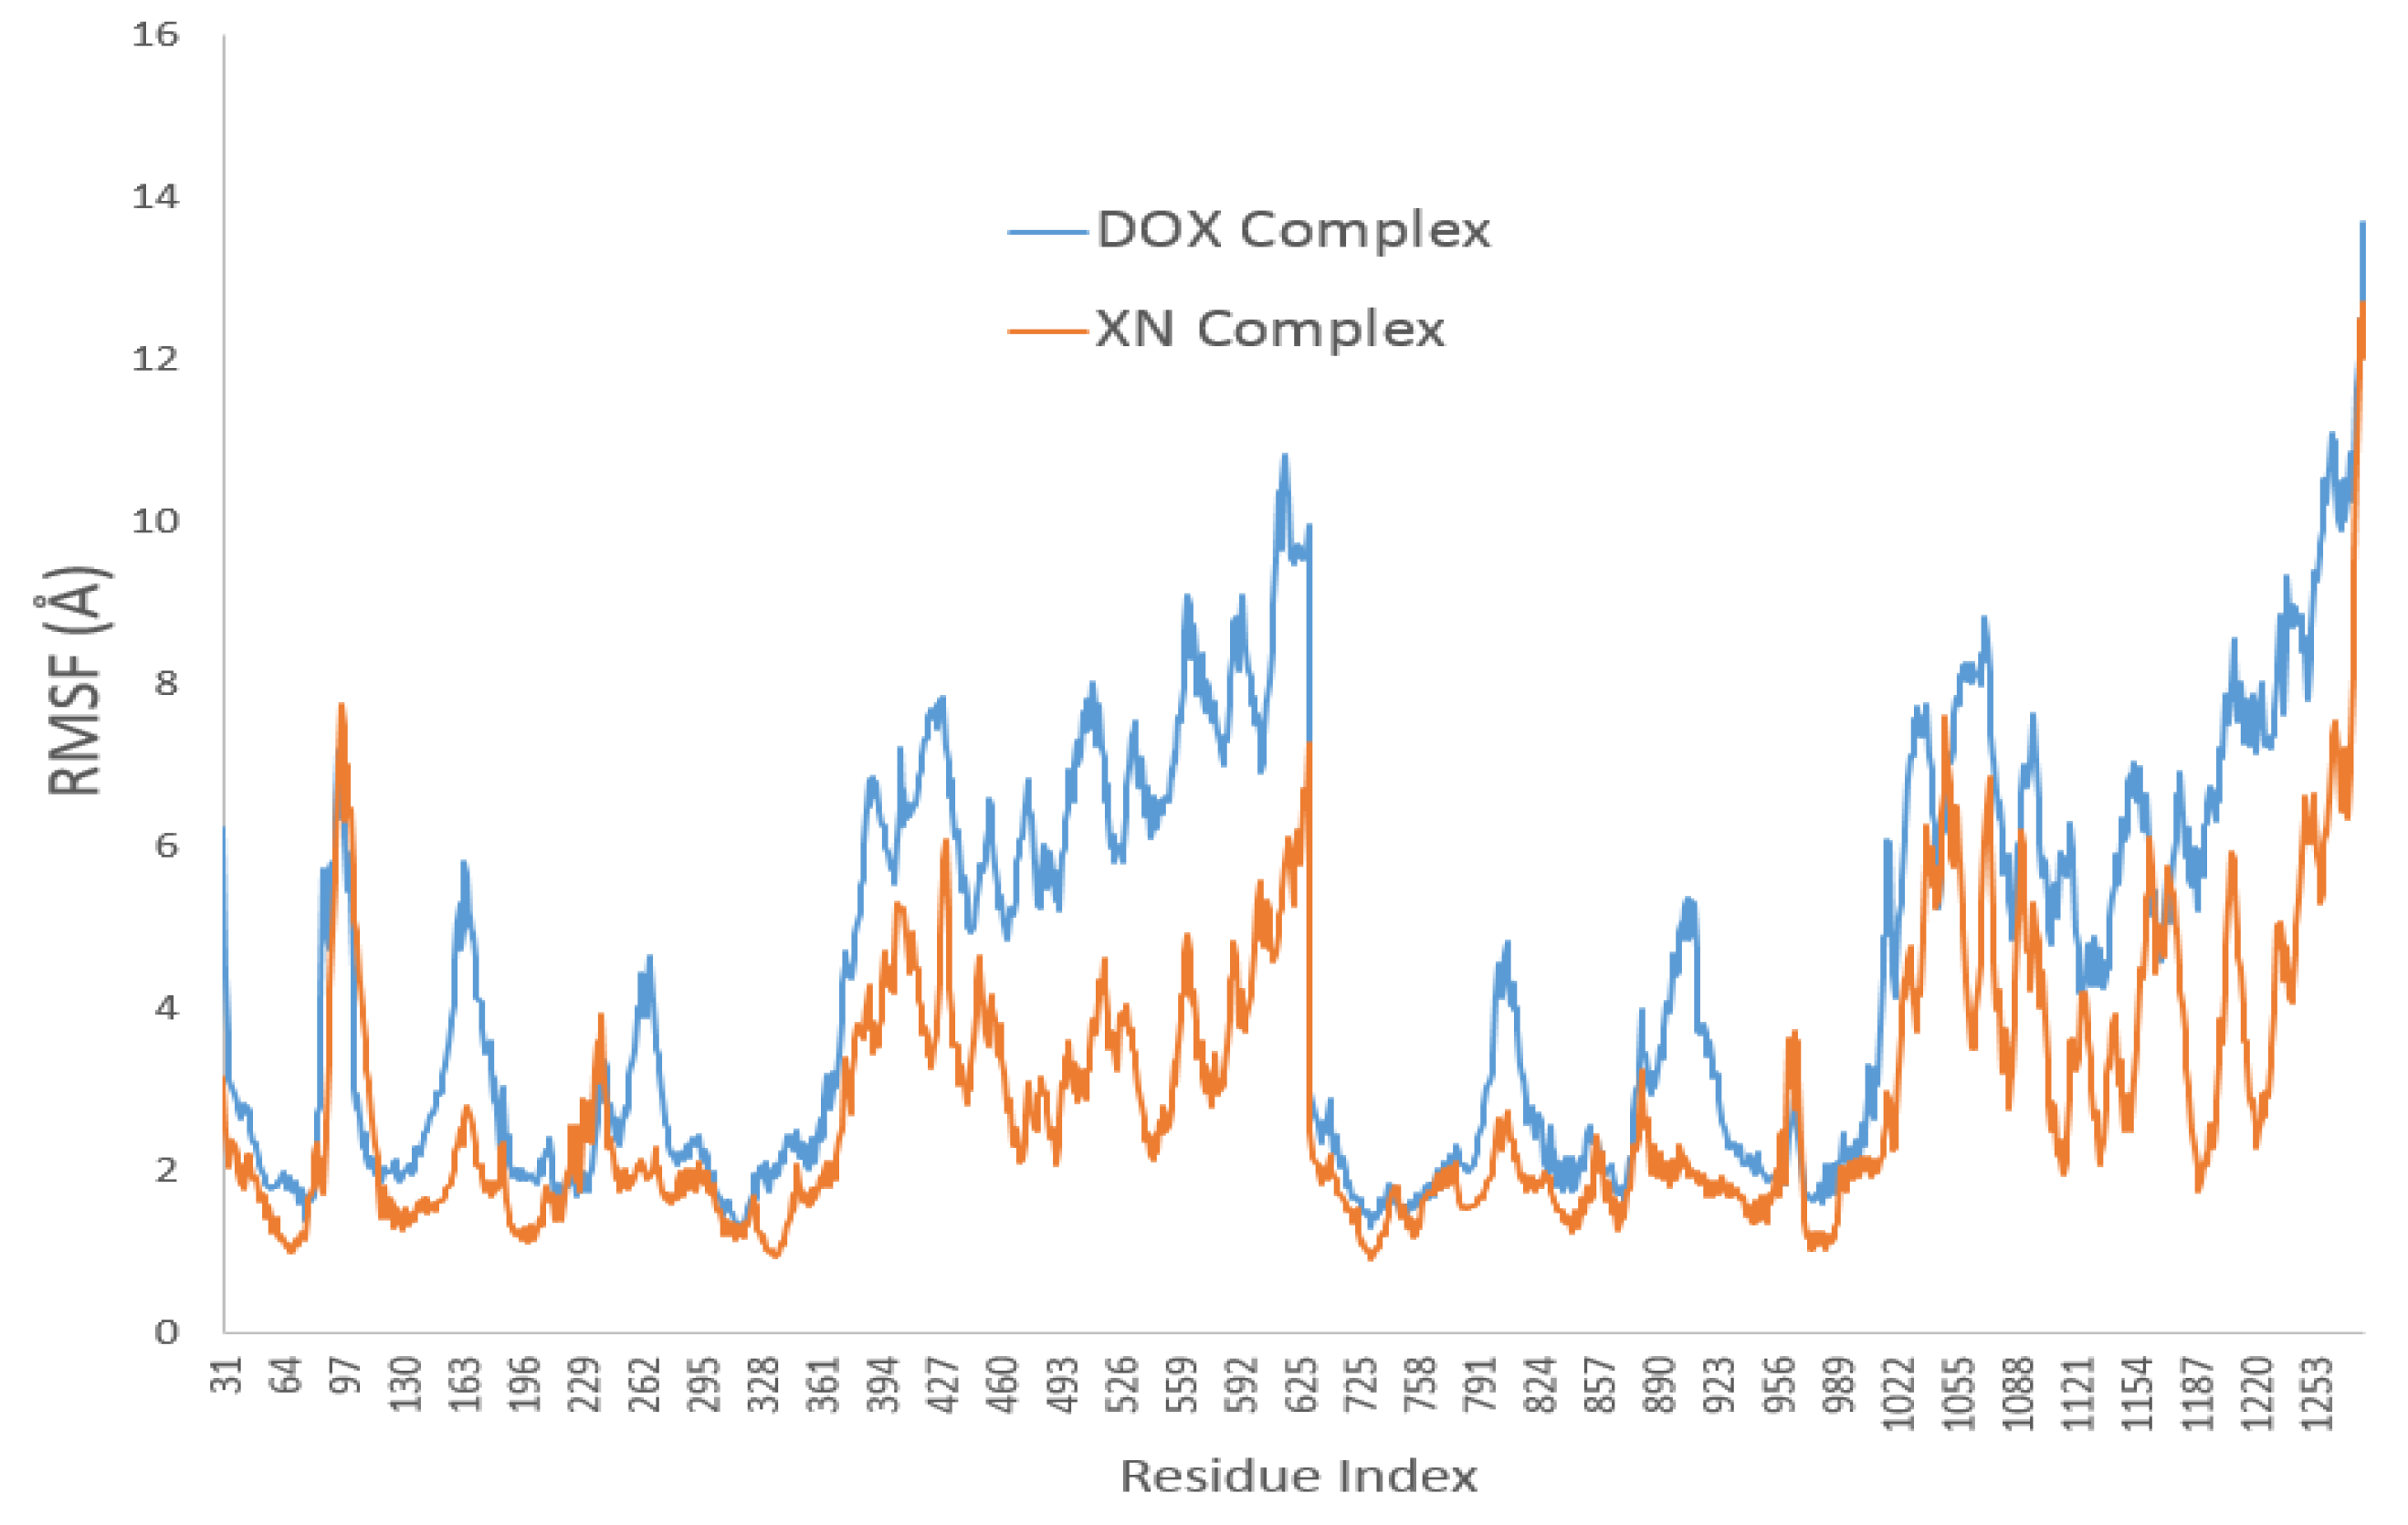
3.4. XN Bound to the Central Transmembrane Domain (TMD) Site, Overlapping with the DOX Binding Site

To probe the interactions between the ligands (DOX and XN) and ABCB1, two ABCB1-ligand-ATP complexes and 1000-ns MD simulations for each system were constructed. Our RMSD analysis indicated the convergence of the MD simulations in the last 400 ns for both systems (Figure S2). The detailed results of the protein secondary structure, protein–ligand contacts, and ligand torsion profiles are provided in the supporting material (Figures S3–S6). Here, we highlight some key observations. First, DOX and XN bound to similar central TMD sites. Figure 5A–C shows the superimposed structures containing the ligands from the last frames of the two MD simulations. It is noteworthy that the ligands DOX (red) and XN (blue) overlapped in the central TMD site. Figure 5D,E show the binding of DOX and XN to nearby residues in the central TMD site, respectively. DOX bound close to the residues Ile 340, Phe 983, Asn 839, Gln 990, Tyr 307, Gln 725, and Phe 343 (Figure 5D and Table S1). XN bound close to residues Phe 336, Phe 983, Ala 980, Phe 728, Asn 842, Tyr 953, and Phe 732 (Figure 5E and Table S1). The binding sites of XN overlapped with that of DOX, which suggested XN could block DOX and interact to ABCB1 competitively. Second, MM-GBSA binding energy data (Table 2) showed the binding of XN (−88.0 ± 6.3 kcal/mol) to the transporter at the central TMD site was stronger than that of DOX (−86.1 ± 8.6 kcal/mol) by −1.9 kcal/mol. The energy decomposition indicated that the hydrophobic interaction (ΔΔLip = −10.7 kcal/mol) was the major contributor to the energy difference (−1.9 kcal/mol) between the two ligands. This hydrophobic interaction could be reduced by the VDW interaction (ΔΔVDW = 6 kcal/mol), and electrostatic interaction (ΔΔGBELE = 2.9 kcal/mol). Third, both the protein (Figure 6) and ligand RMSF analyses (Figure 7) showed that the DOX-protein system had slightly higher position fluctuation than the XN-protein system. The average protein RMSF for the DOX complex was 4.51 Å, whereas the protein RMSF for the XN complex was 2.89 Å. Similarly, the average ligand RMSF for DOX was 2.58 Å, whereas the average ligand RMSF for XN was 1.85 Å. The XN complex experienced less fluctuation overall, compared to the DOX complex. This could indicate a more stable ligand–protein complex, providing evidence that XN bound to ABCB1 and acted as a competitive inhibitor of DOX.

4. Discussion

XN is a bioactive prenylated flavonoid compound uniquely distributed in the female inflorescences of Humulus lupulus L., a well-known bittering agent in the brewing industry. In recent years, XN has received much attention for its biological effects, especially in the anticancer area. A large amount of research has shown that XN can prevent and treat cancers. The related mechanisms underlying this anticancer activity have been revealed, including chemopreventive activity by inhibition of the initiation and development of carcinogenesis, and therapeutic activity by proliferation inhibition, apoptosis induction, migration inhibition, as well as angiogenesis inhibition [4].
Most recently, studies have shown that in MCF-7/ADR cells XN could reverse DOX resistance. The underlying mechanisms of this are related to the signal transduction and activation of transcription 3 (STAT3) and epidermal growth factor receptor (EGFR) suppression [7], as well as MCF-7/ADR cell stemness reduction [8]. ABCB1 plays a vital role in drug resistance by stimulating drug efflux. In this study, we investigated, for the first time, whether XN could modulate ABCB1 efflux functions. Our present results showed that XN decreased ABCB1 transporting functions, as evidenced by the increased intracellular accumulation of ABCB1 substrates, DOX and Rho123. Subsequent molecular experiments showed that XN was a substrate of ABCB1, which suggests that XN mediated-reversal of DOX resistance might be related to ABCB1 activity modulation. The finding that XN was a substrate and inhibitor of ABCB1, together with the previous finding that XN was also an inhibitor and substrate of transporter ABCG2 [9], strongly supports its efficiency in the regulation of the efflux of chemical drugs and exogenous compounds via affecting ABC transporters and its potential use for the reversal of anticancer drug resistance. Since ABCB1 is also expressed in the intestine, inhibition of ABCB1 transport function might enhance the intestinal absorption of drugs.
Results of molecular modeling and simulation showed the detailed interactions between the ligands (XN and DOX) and ABCB1 and explained the molecular basis for the competitive inhibition of DOX efflux by XN. XN bound to ABCB1 at the central TMD site, which overlapped with the DOX binding site. In addition, XN binding affinity was stronger than that of DOX, resulting in less protein and ligand position fluctuation. These results support that XN competitively blocked DOX binding and efflux by ABCB1. However, further studies, including mutagenesis studies, are needed to experimentally confirm the XN-ABCB1 interactions predicted by molecular docking and simulation.

5. Conclusions

In summary, we showed, for the first time, that the prenylated flavonoid, XN, was a substrate and inhibitor of ABCB1. XN competitively bound to the DOX binding site in ABCB1 and, thus, inhibited DOX efflux. Our study provided another mechanism underlying the reversal of ABCB1-mediated MDR by XN and showed its potential use to reverse drug resistance and enhance drug intestinal absorption.

Supplementary Materials

The following are available online at https://www.mdpi.com/2076-3417/8/5/681/s1.

Acknowledgments

This work was funded by the Natural Science Foundation of China (No. 41576187), Key Research and Development Program of Shandong Province (No. 2016YYSP017, 2016ZDJS06A03, 2017GHY15112), Natural Science Foundation of China-Shandong Joint Fund (No. U1606403), and Open Research Fund of State Key Laboratory of Biological Fermentation Engineering of Beer (No. K2014002). We also acknowledge the High Performance Computing Facility at Rowan, funded by the National Science Foundation under the Grant MRI-1429467 and XSEDE MCB160164/160173/170088. The Anton2 machine at the Pittsburgh Supercomputing Center (PSCA17017P) was generously made available by D. E. Shaw Research.

Author Contributions

J.M. and M.L. conceived and designed the experiments; F.L., J.D., H.L., H.Y., F.M. and Z.Q. performed the experiments; F.L., J.M., M.L. and C.W. wrote the manuscript; statistical analysis was by Mary Lesperance. C.W. designed the modeling part; and H.H. carried out the modeling part. All authors approved the final manuscript.

Conflicts of Interest

The authors declare no conflict of interest.

References

  1. Aller, S.G.; Yu, J.; Ward, A.; Weng, Y.; Chittaboina, S.; Zhuo, R.; Harrell, P.M.; Trinh, Y.T.; Zhang, Q.; Urbatsch, I.L.; et al. Structure of P-glycoprotein reveals a molecular basis for poly-specific drug binding. Science 2009, 323, 1718–1722. [Google Scholar] [CrossRef] [PubMed]
  2. Safar, Z.; Vasko, B.; Ritchie, T.K.; Imre, G.; Mogyorosi, K.; Erdo, F.; Rajnai, Z.; Fekete, Z.; Szeremy, P.; Muka, L.; et al. Investigating ABCB1-Mediated Drug-Drug Interactions: Considerations for In Vitro and In Vivo Assay Design. Curr. Drug Metab. 2016, 17, 430–455. [Google Scholar] [CrossRef] [PubMed]
  3. Eichhorn, T.; Efferth, T. P-glycoprotein and its inhibition in tumors by phytochemicals derived from Chinese herbs. J. Ethnopharmacol. 2012, 141, 557–570. [Google Scholar] [CrossRef] [PubMed]
  4. Liu, M.; Hansen, P.E.; Wang, G.; Qiu, L.; Dong, J.; Yin, H.; Qian, Z.; Yang, M.; Miao, J. Pharmacological profile of xanthohumol, a prenylated flavonoid from hops (Humulus lupulus). Molecules 2015, 20, 754–779. [Google Scholar] [CrossRef] [PubMed]
  5. Nuti, E.; Bassani, B.; Camodeca, C.; Rosalia, L.; Cantelmo, A.; Gallo, C.; Baci, D.; Bruno, A.; Orlandini, E.; Nencetti, S.; et al. Synthesis and antiangiogenic activity study of new hop chalcone Xanthohumol analogues. Eur. J. Med. Chem. 2017, 138, 890–899. [Google Scholar] [CrossRef] [PubMed]
  6. Albini, A.; Dell’Eva, R.; Vene, R.; Ferrari, N.; Buhler, D.R.; Noonan, D.M.; Fassina, G. Mechanisms of the antiangiogenic activity by the hop flavonoid xanthohumol: NF-kappaB and Akt as targets. FASEB J. 2006, 20, 527–529. [Google Scholar] [CrossRef] [PubMed]
  7. Kang, Y.; Park, M.A.; Heo, S.W.; Park, S.Y.; Kang, K.W.; Park, P.H.; Kim, J.A. The radio-sensitizing effect of xanthohumol is mediated by STAT3 and EGFR suppression in doxorubicin-resistant MCF-7 human breast cancer cells. Biochim. Biophys. Acta (BBA) Gen. Subj. 2013, 1830, 2638–2648. [Google Scholar] [CrossRef] [PubMed]
  8. Liu, M.; Yin, H.; Qian, X.; Dong, J.; Qian, Z.; Miao, J. Xanthohumol, a prenylated chalcone from hops, inhibits the viability and stemness of doxorubicin-resistant MCF-7/ADR cells. Molecules 2016, 22, 36. [Google Scholar] [CrossRef] [PubMed]
  9. Tan, K.W.; Cooney, J.; Jensen, D.; Li, Y.; Paxton, J.W.; Birch, N.P.; Scheepens, A. Hop-derived prenylflavonoids are substrates and inhibitors of the efflux transporter breast cancer resistance protein (BCRP/ABCG2). Mol. Nutr. Food Res. 2014, 58, 2099–2110. [Google Scholar] [CrossRef] [PubMed]
  10. Fairchild, C.R.; Ivy, S.P.; Kao-Shan, C.S.; Whang-Peng, J.; Rosen, N.; Israel, M.A.; Melera, P.W.; Cowan, K.H.; Goldsmith, M.E. Isolation of amplified and overexpressed DNA sequences from adriamycin-resistant human breast cancer cells. Cancer Res. 1987, 47, 5141–5148. [Google Scholar] [PubMed]
  11. Chou, T.C.; Talalay, P. Quantitative analysis of dose-effect relationships: The combined effects of multiple drugs or enzyme inhibitors. Adv. Enzyme Regul. 1984, 22, 27–55. [Google Scholar] [CrossRef]
  12. Szewczyk, P.; Tao, H.; McGrath, A.P.; Villaluz, M.; Rees, S.D.; Lee, S.C.; Doshi, R.; Urbatsch, I.L.; Zhang, Q.; Chang, G. Snapshots of ligand entry, malleable binding and induced helical movement in P-glycoprotein. Acta Crystallogr. Sect. D Biol. Crystallogr. 2015, 71, 732–741. [Google Scholar] [CrossRef] [PubMed]
  13. Gu, Y.; Qi, C.; Sun, X.; Ma, X.; Zhang, H.; Hu, L.; Yuan, J.; Yu, Q. Arctigenin preferentially induces tumor cell death under glucose deprivation by inhibiting cellular energy metabolism. Biochem. Pharmacol. 2012, 84, 468–476. [Google Scholar] [CrossRef] [PubMed]
  14. Ikeguchi, M. Partial rigid-body dynamics in NPT, NPAT and NP gamma T ensembles for proteins and membranes. J. Comput. Chem. 2004, 25, 529–541. [Google Scholar] [CrossRef] [PubMed]
  15. Stuart, S.J.; Zhou, R.H.; Berne, B.J. Molecular dynamics with multiple time scales: The selection of efficient reference system propagators. J. Chem. Phys. 1996, 105, 1426–1436. [Google Scholar] [CrossRef]
Figure 1. Xanthohumol (XN) molecular structure.
Applsci 08 00681 g001
Figure 2. XN blocks the efflux function of ABCB1 in MCF-7/ADR cells. (A) XN affects the intracellular doxorubicin (DOX). The cells were treated with different concentrations of XN (0–40 μM) and then 10 μM DOX. The autofluorescence of DOX in MCF-7/ADR was as described in the materials and methods section. Histograms show the intracellular DOX autofluorescence, * p < 0.05, ** p < 0.01, vs. the control group; (B) Effect of XN on the efflux of the ABCB1 substrate, Rho123. After XN treatment, followed by co-incubation with Rho123, intracellular Rho123 fluorescence was detected. The relative mean fluorescence of Rho123 is shown in histograms, * p < 0.05, ** p < 0.01, vs. the control group.
Applsci 08 00681 g002
Figure 3. XN is a substrate of ABCB1 and stimulates its ATPase activity. (A) XN shows ABCB1 substrate characteristics; (B) XN stimulates ABCB1 ATPase activity. The assay was performed as described in the materials and methods section. * p < 0.05, ** p < 0.01, vs. the basal control group.
Applsci 08 00681 g003
Figure 4. XN sensitizes the cytotoxicity of the ABCB1 substrate, colchicin (COL), in MCF-7/ADR cells. (A) MCF-7/ADR cells treated with 0.6 μM COL alone, 2 μM XN alone, or both; (B) Synergisms analyzed by median effect plot using the software, Calcusyn. MCF-7/ADR cells were co-treated with COL and XN (0.5, 1, and 2 μM) for 72 h, the proliferation inhibition was detected, and the combination index (CI) values were obtained.
Applsci 08 00681 g004
Figure 5. Structural representation of the predicted interaction between ABCB1 and its ligands. (A) Superimposed ABCB1 models from the last snapshot of the MD simulations. The model with DOX and ATP ligands is represented using red ligands in VDW and pink-colored ribbons. The model with XN and ATP ligands is represented using blue ligands in VDW and yellow-colored ribbons; (B) Close-up view of the superimposed DOX and XN complexes at the ABCB1 central TMD from the top. DOX is shown in red and XN is shown in blue; (C) Close-up view of the superimposed complexes of DOX and XN at the central TMD of ABCB1 from the bottom; (D) Protein–ligand interactions between DOX and nearby residues in the central TMD site; (E) Protein–ligand interactions between XN and nearby residues in the central TMD site.
Applsci 08 00681 g005
Figure 6. Protein Root Mean Square Fluctuation (RMSF). Protein RMSF was used to characterize local changes along the protein chain. Peaks indicate areas of the protein that fluctuated the most during the simulation. The average RMSF for the DOX complex was 4.51 Å. The average RMSF for the XN complex was 2.89 Å.
Applsci 08 00681 g006
Figure 7. Ligand Root Mean Square Fluctuation (RMSF). (A) DOX atom reference; (B) XN atom reference; (C) Ligand RMSF is used to characterize changes in the ligand atom positions. The graph shows the ligand’s fluctuations broken down by atom, corresponding to the 2D structure. Ligand RMSF was measured on the ligand heavy atoms after first being aligned on the protein backbone. The average RMSF for DOX ligand was 2.58 Å. The average RMSF for the XN ligand was 1.85 Å.
Applsci 08 00681 g007
Table 1. CI values of the combination between xanthohumol (XN) and colchicin (COL) in MCF-7/ADR cells.
XN (μM)DOX (μM)EffectCI
0.50.080.030.79
0.50.160.041.17
0.50.310.081.28
0.50.630.231.04
0.51.250.470.93
0.52.50.790.65
0.55.00.900.69
10.080.060.58
10.160.060.95
10.310.11.16
10.630.211.16
11.250.490.89
12.50.790.66
15.00.890.75
20.080.090.55
20.160.100.76
20.310.160.86
20.630.280.94
21.250.530.82
22.50.800.64
25.00.900.70
Table 2. MM-GBSA binding energies.
ABCB1/Inhibitor ComplexΔVDWΔGBELEΔLIPOΔTOTΔΔTOT
XN Complex−51.6 ± 3.214.3 ± 3.2−50.7 ± 3.1−88.0 ± 6.3−1.9
DOX Complex−57.5 ± 3.411.4 ± 6.5−39.9 ± 3.0−86.1 ± 8.60.0
ΔVDW = Change in VDW energy in gas phase upon complex formation (Units: kcal/mol); ΔGBELE = Change in GB reaction field energy + gas phase Elec. energy upon complex formation (Units: kcal/mol); ΔLIPO = Change in lipophilic term (lipophilic energy) upon complex formation (Units: kcal/mol); ΔTOT = ΔVDW + ΔLiPO + ΔGBELE Change in potential energy in water upon complex formation (Units: kcal/mol).

