Cross-Cultural Perception of Spanish Synthetic Expressive Voices Among Asians

 ,
, 
Abstract

1. Introduction
Related Work
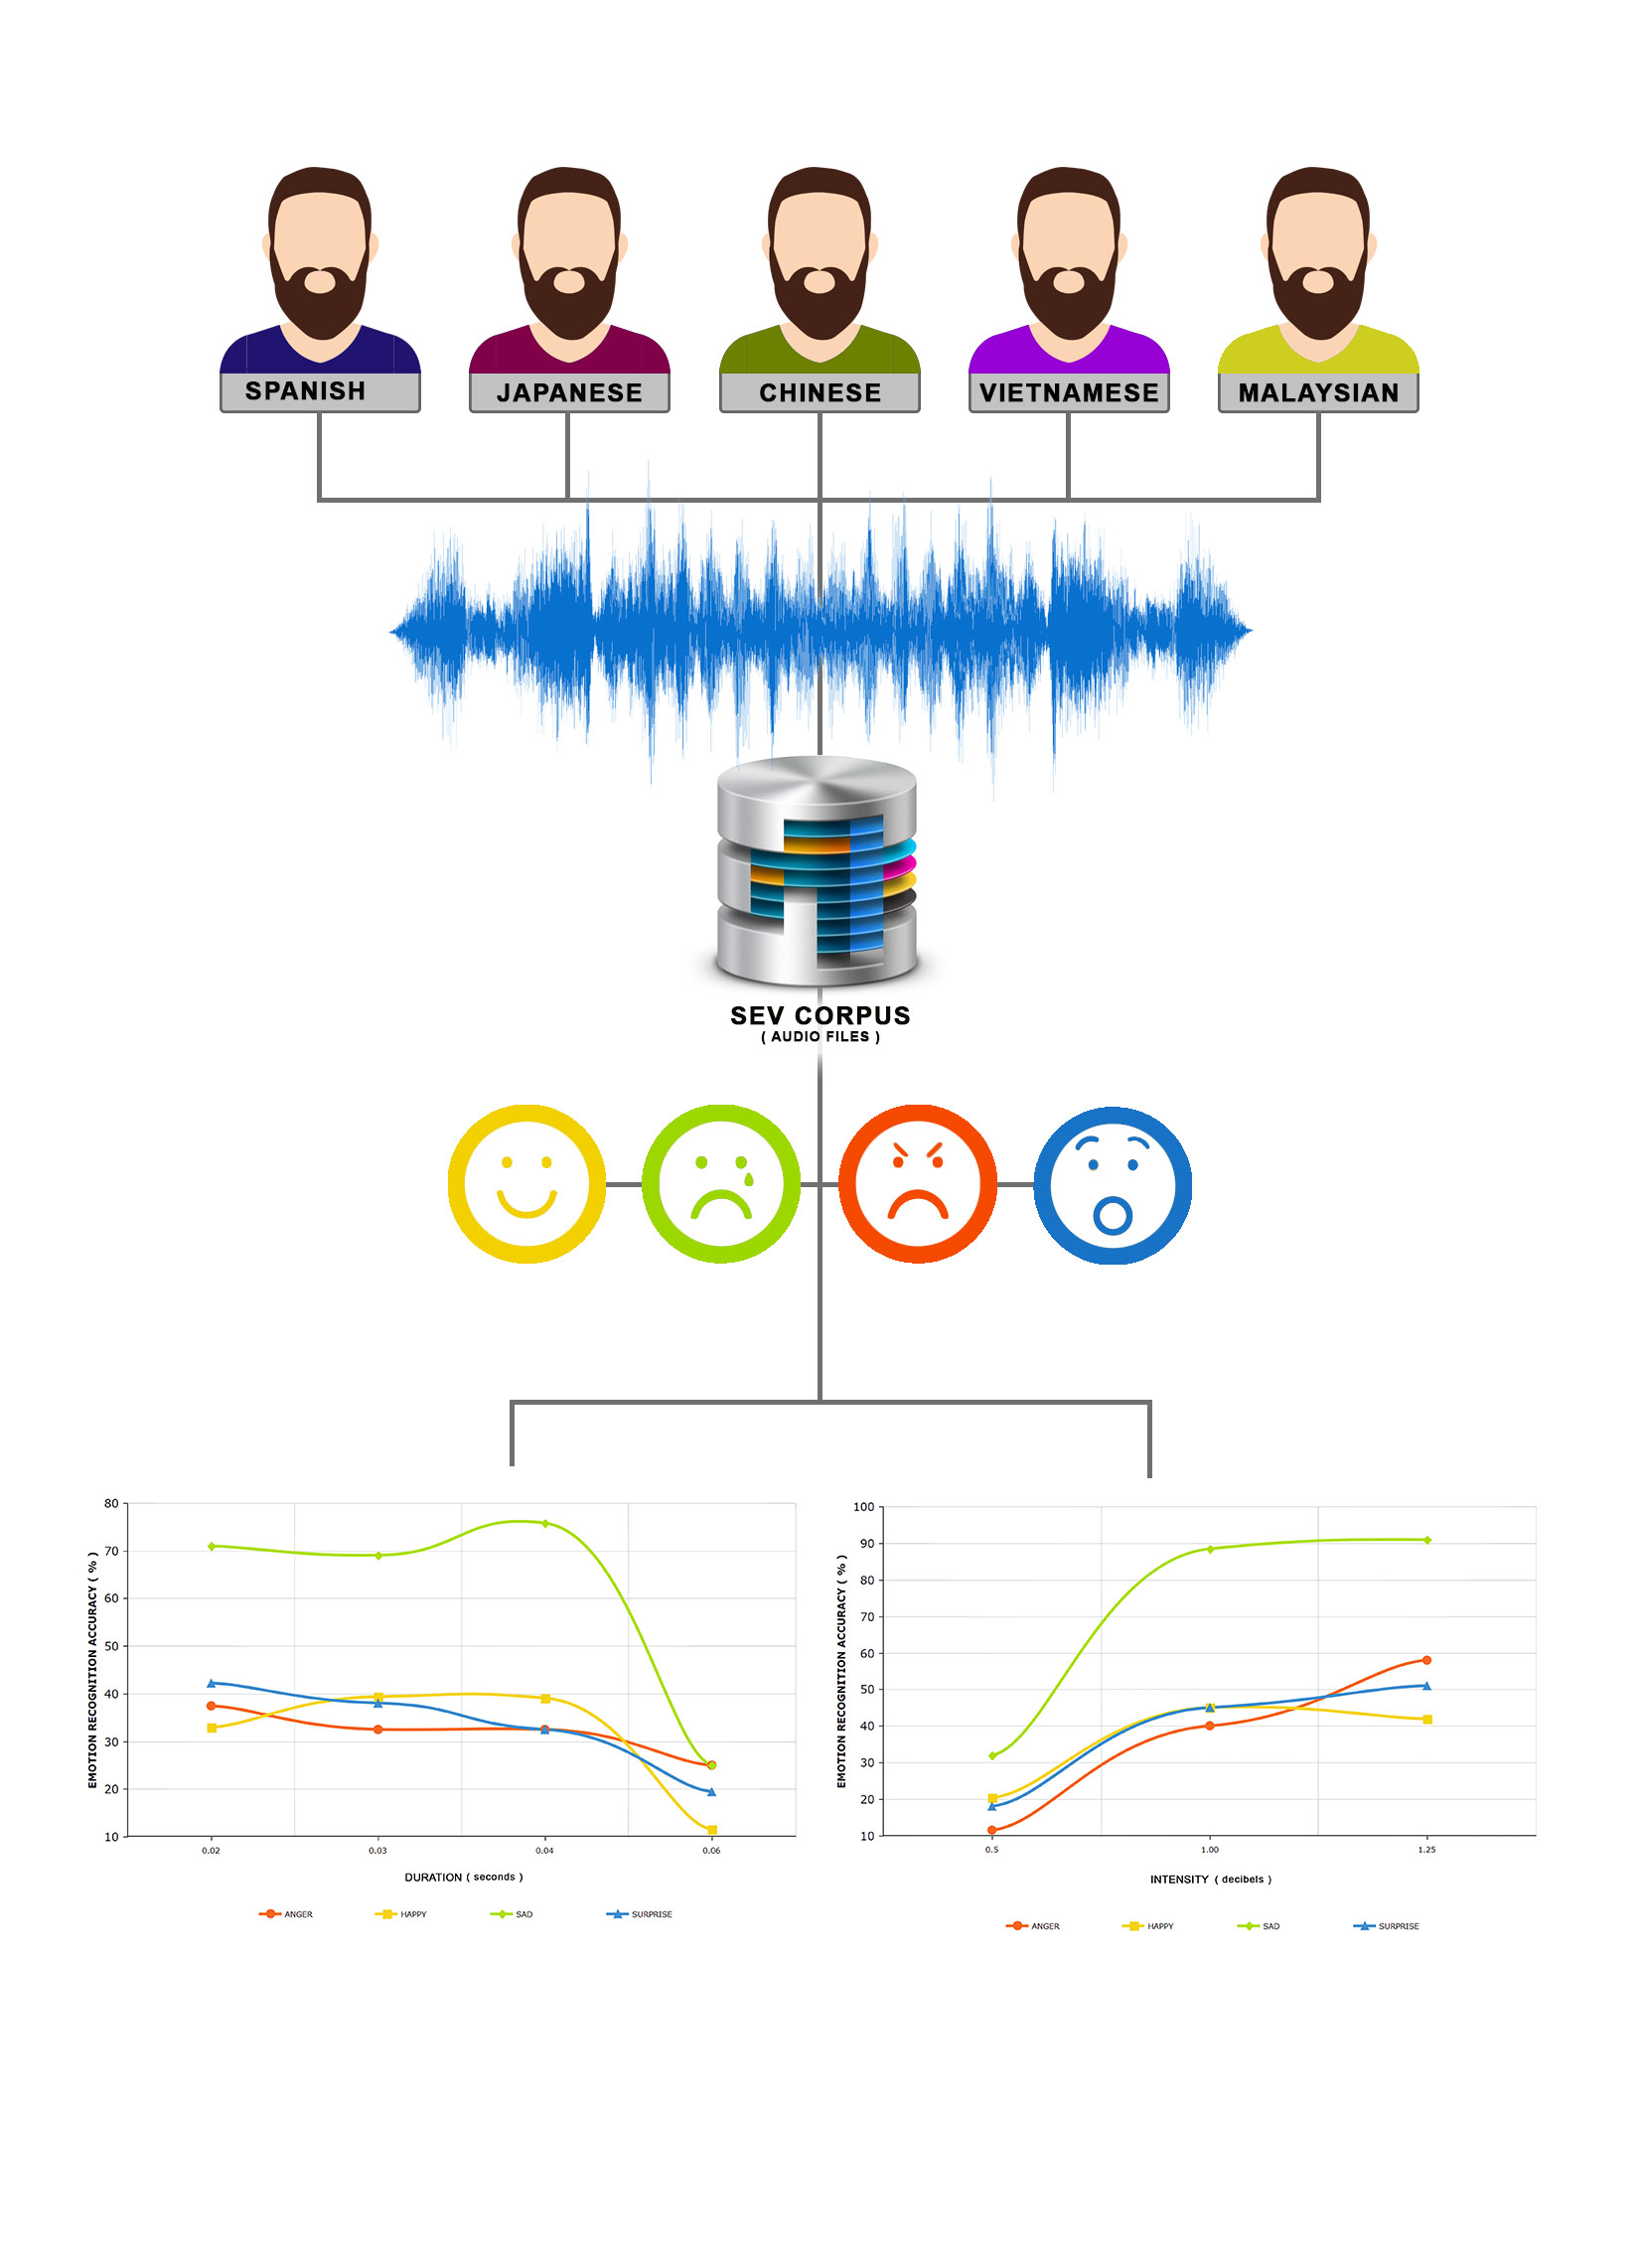
2. Experiment
2.1. The Corpus
2.2. Subjects
2.3. Method
3. Results and Discussion
3.1. Overall Results on Emotion Perception
3.1.1. In-Group Perception Results (Spanish)
3.1.2. Out-Group Perception Results (Asians)
- In general, anger is less acceptable in Asian cultures [36]; this is reflected by the perception rates of anger in the present experiment where Asians significantly perceived anger less than the Spanish. The lowest perception rate of anger was scored by the Japanese listeners, which is statistically significantly less than the Chinese (p = 0.002) and Malaysians (at p < 0.001). This finding is in line with findings of previous studies, where Japanese typically tend to avoid negative outcomes and thus engage in fewer negative emotions [37,38]. Evidence suggests that generally Asians suppress their negative emotions when perceiving out-group emotions, but not positive emotions such as happiness [39]. In this study, it was noted that all Asian groups perceived happiness higher than the Spanish listeners.
- Noticeably, Malaysians perceived Spanish surprise and anger more accurately than the other Asian ethnics. They perceived surprise statistically significantly higher than Japanese (at p < 0.05) and Chinese (at p = 0.001), whereas anger was perceived statistically significantly higher than the Japanese (p < 0.001) and Vietnamese (p < 0.005). Studies by Hei et al. [40] showed that Malaysians tend to be more expressive in showing high-arousal emotions such as surprise and anger compared to other Asian ethnicities.
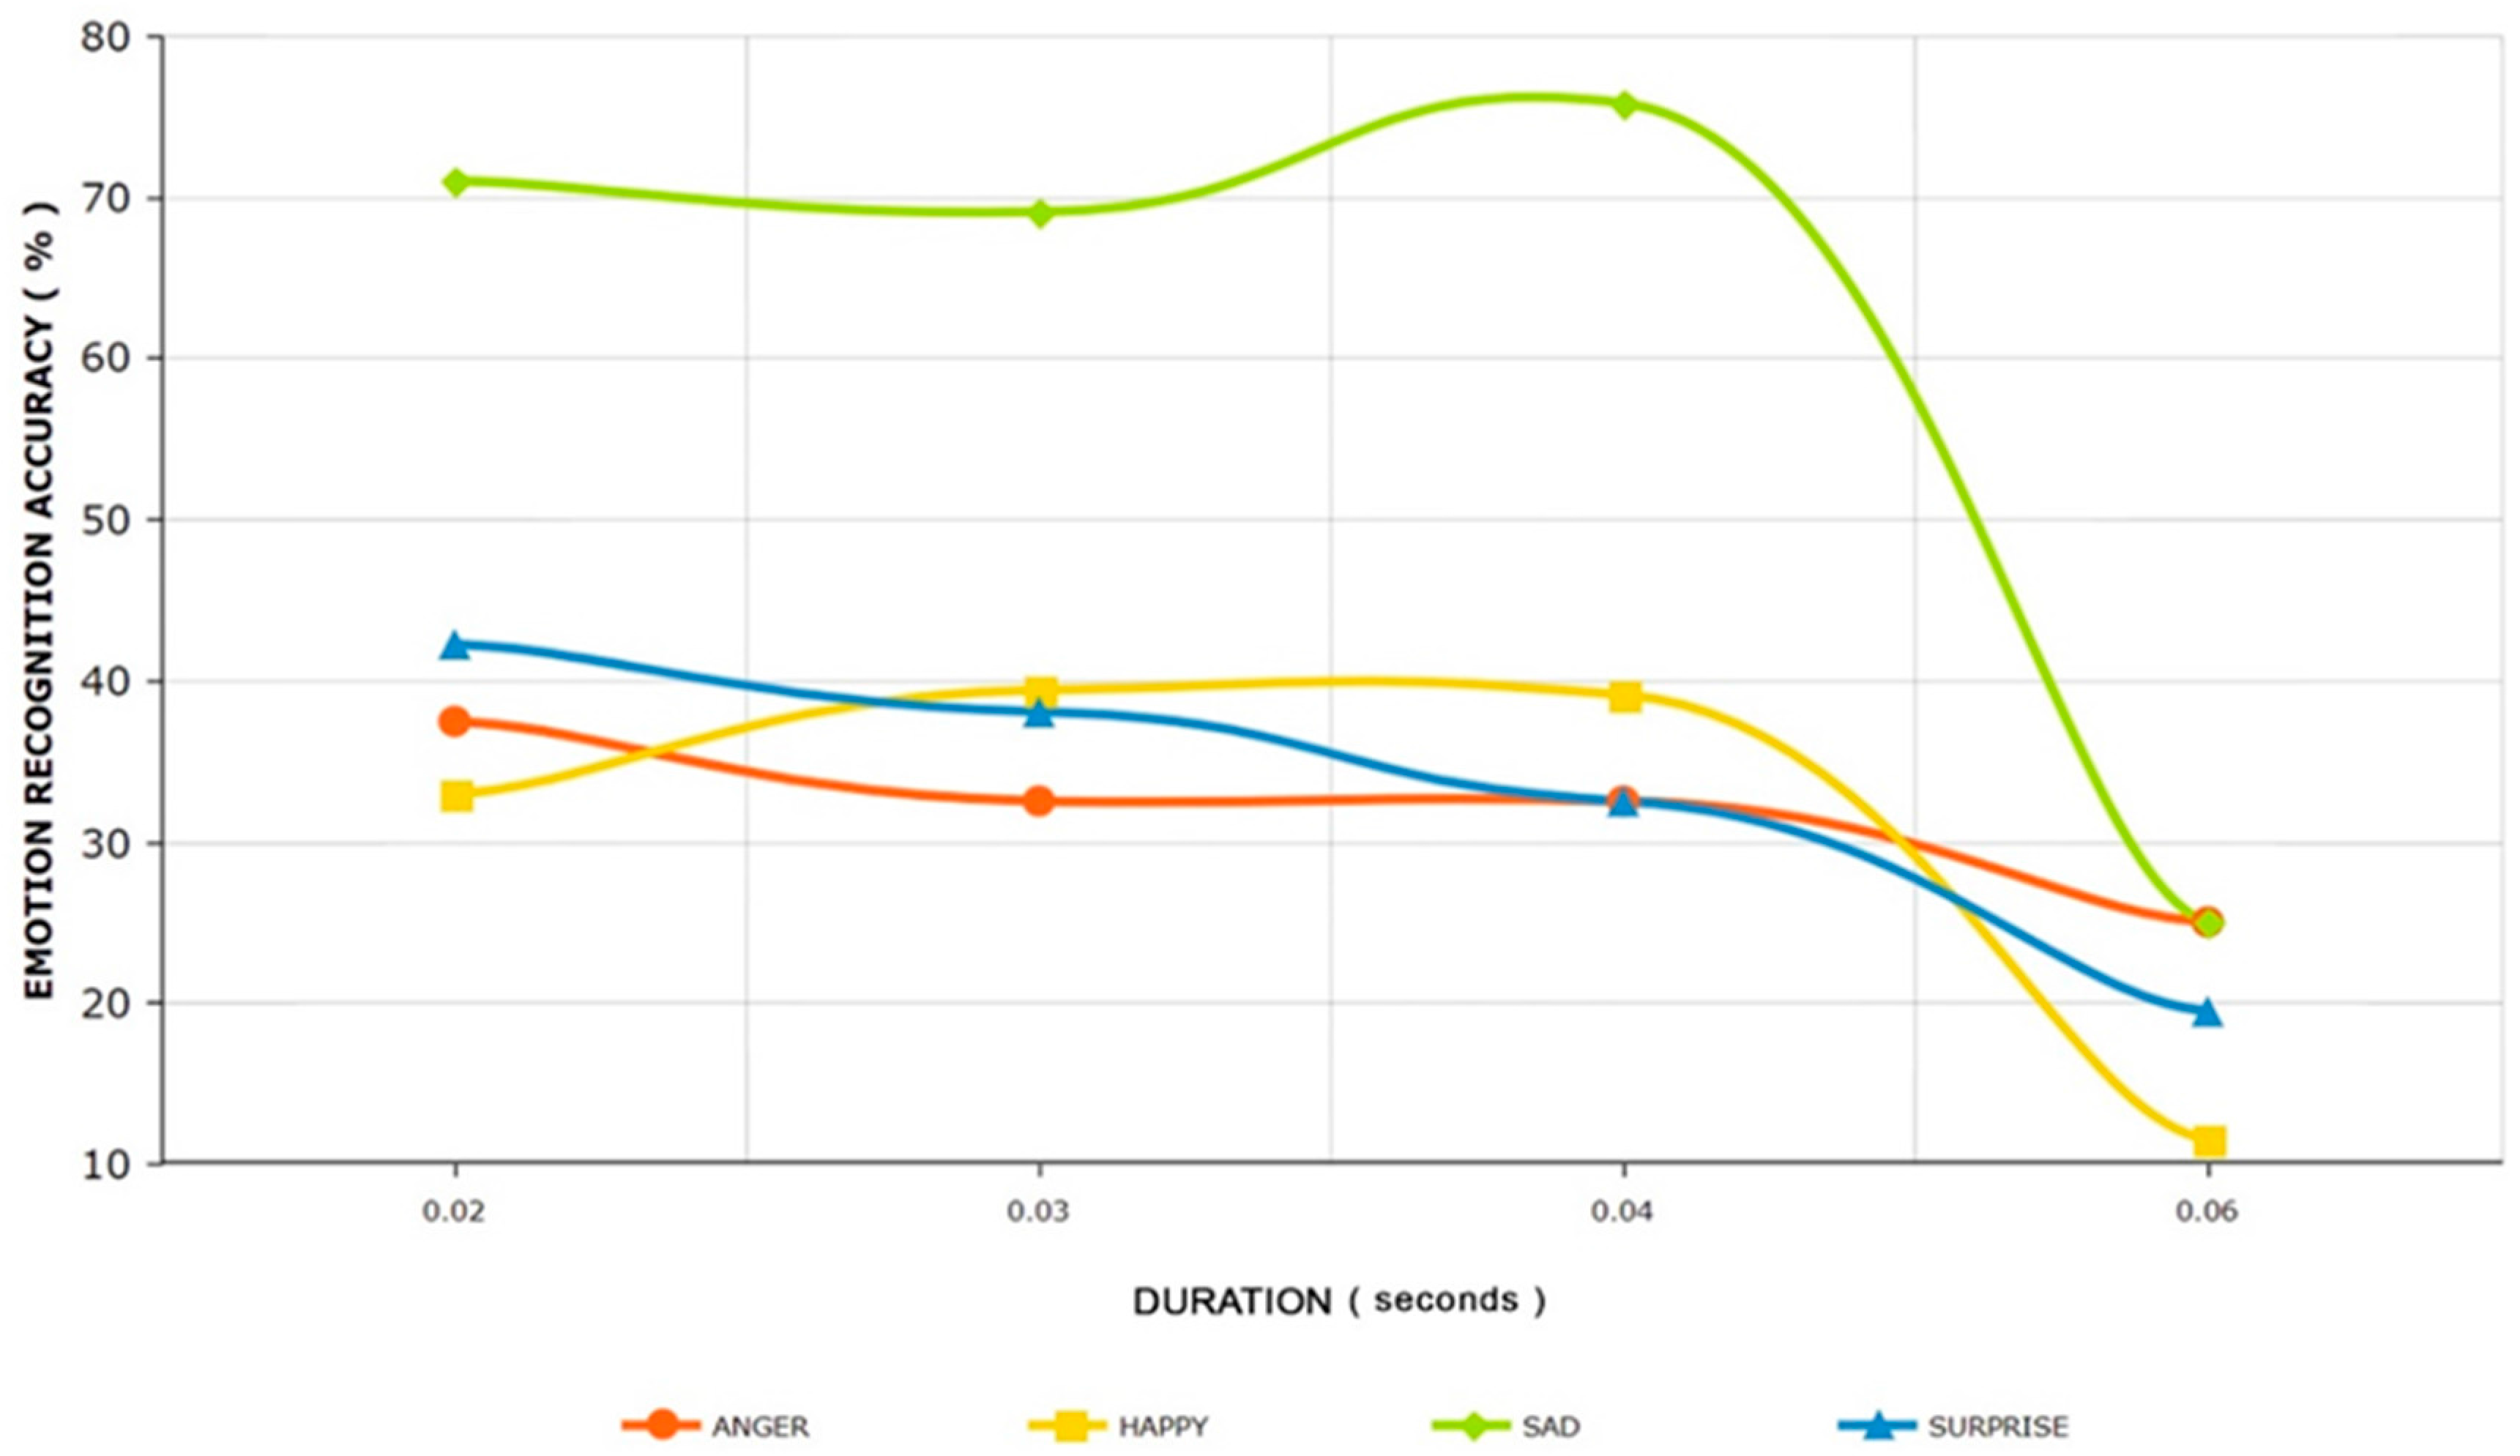
3.2. Analysis on Cultural Perception-Duration of Speech
3.3. Analysis on Cultural Perception-Intensity of Speech
3.4. Analysis on Cultural Perception-Interaction between Ethnic, Duration and Intensity
4. Conclusions
Acknowledgments
Author Contributions
Conflicts of Interest
References
- Remland, M.S. Nonverbal Communication in Everyday Life; SAGE Publications: Thousand Oaks, CA, USA, 2017. [Google Scholar]
- Warren, P. Prosody and language processing. In Language Processing; Psychology Press Ltd.: London, UK, 1999; pp. 155–188. [Google Scholar]
- Banse, R.; Scherer, L. Acoustic profiles in vocal emotion expression. J. Pers. Soc. Psychol. 1996, 70, 614–636. [Google Scholar] [CrossRef] [PubMed]
- Juslin, P.N.; Laukka, P. Communication of emotions in vocal expression and music performance: Different channels, same code? Psychol. Bull. 2003, 129, 770–814. [Google Scholar] [CrossRef] [PubMed]
- Scherer, K.R. Vocal communication of emotion: A review of research paradigms. Speech Commun. 2003, 40, 227–256. [Google Scholar] [CrossRef]
- Graham, C.R.; Hamblin, A.; Feldstein, S. Recognition of emotion in English voices by speakers of Japanese, Spanish, and English. IRAL 2001, 39, 19–37. [Google Scholar] [CrossRef]
- Thompson, W.F.; Balkwill, L.-L. Decoding speech prosody in five languages. Semiotica 2006, 158, 407–424. [Google Scholar] [CrossRef]
- Bryant, G.A.; Barrett, H.C. Vocal emotion recognition across disparate cultures. J. Cognit. Cult. 2008, 8, 135–148. [Google Scholar] [CrossRef]
- Pell, M.D.; Paulmann, S.; Dara, C.; Alasseri, A.; Kotz, S.A. Factors in the recognition of vocally expressed emotions: A comparison of four languages. J. Phon. 2009, 37, 417–435. [Google Scholar] [CrossRef]
- Elfenbein, H.A.; Ambady, N. On the universality and cultural specificity of emotion recognition: A meta-analysis. Psychol. Bull. 2002, 128, 203–235. [Google Scholar] [CrossRef] [PubMed]
- Barra Chicote, R.; Montero Martínez, J.M.; Macías Guarasa, J.; Lutfi, S.L.; Lucas Cuesta, J.M.; Fernández Martínez, F.; D’haro Enríquez, L.F.; San Segundo Hernández, R.; Ferreiros López, J.; Córdoba Herralde, R.D.; et al. Spanish expressive voices: Corpus for emotion research in Spanish. In Proceedings of the 6th Conference of Language Resources and Evaluation (Workshop on Corpora for Research on Emotion and Affect), Marrakech, Morocco, 26 May 2008. [Google Scholar]
- Katsumi, Y.; Kim, S.; Sung, K.; Dolcos, F.; Dolcos, S. When nonverbal greetings “Make it or break it”: The role of ethnicity and gender in the effect of handshake on social appraisals. J. Nonverbal Behav. 2017, 41, 345–365. [Google Scholar] [CrossRef]
- Scherer, K.R. Vocal affect expression: A review and a model for future research. Psychol. Bull. 1986, 99, 143–165. [Google Scholar] [CrossRef] [PubMed]
- Wilson, D.; Wharton, T. Relevance and prosody. J. Pragmat. 2006, 38, 1559–1579. [Google Scholar] [CrossRef]
- Root, A.R. The pitch factors in speech—A survey. Q. J. Speech 1930, 16, 320–343. [Google Scholar] [CrossRef]
- Pluggé, D.E. “Voice qualities” in oral interpretation. Q. J. Speech 1942, 28, 442–444. [Google Scholar] [CrossRef]
- Lewis, M.; Takai-Kawakami, K.; Kawakami, K.; Sullivan, M.W. Cultural differences in emotional responses to success and failure. Int. J. Behav. Dev. 2010, 34, 53–61. [Google Scholar] [CrossRef] [PubMed]
- Beier, E.G.; Zautra, A.J. Identification of vocal communication of emotions across cultures. J. Consult. Clin. Psychol. 1972, 39, 166. [Google Scholar] [CrossRef] [PubMed]
- Jacewicz, E.; Fox, R.A.; O’Neill, K.; Salmons, J. Articulation rate across dialect, age, and gender. Lang. Var. Chang. 2009, 21, 233–256. [Google Scholar] [CrossRef] [PubMed]
- Adank, P.; Janse, E. Perceptual learning of time-compressed and natural fast speech. J. Acoust. Soc. Am. 2009, 126, 2649–2659. [Google Scholar] [CrossRef] [PubMed]
- Heald, S.; Klos, S.; Nusbaum, H. Understanding Speech in the Context of Variability. In Neurobiology of Language; Elsevier Science: Amsterdam, The Netherlands, 2015; pp. 195–208. [Google Scholar]
- McCulloch, G. The very idea of the phenomenological. Proc. Aristot. Soc. 1993, 93, 39–57. [Google Scholar] [CrossRef]
- Bassiouney, R. (Ed.) Identity and Dialect Performance: A Study of Communities and Dialects; Routledge: Abingdon, UK, 2017. [Google Scholar]
- Iacobelli, F.; Cassell, J. Ethnic identity and engagement in embodied conversational agents. In Intelligent Virtual Agents; Springer: Berlin/Heidelberg, Germany, 2007; pp. 57–63. [Google Scholar]
- Cassell, J. Social practice: Becoming enculturated in human-computer interaction. In Universal Access in Human-Computer Interaction. Applications and Services; Springer: Berlin/Heidelberg, Germany, 2009; pp. 303–313. [Google Scholar]
- Sharma, L.; Srivastava, V. Performance enhancement of information retrieval via Artificial Intelligence. IJSRSET 2017, 3, 187–192. [Google Scholar]
- Reeves, B.; Nass, C. How People Treat Computers, Television, and New Media Like Real People and Places; CSLI Publications Stanford University: Stanford, CA, USA, 1996; pp. 3–18. [Google Scholar]
- Nass, C.I.; Brave, S. Wired for Speech: How Voice Activates and Advances the Human-Computer Relationship; MIT Press: Cambridge, MA, USA, 2005. [Google Scholar]
- Lorenzo-Trueba, J.; Watts, O.; Barra-Chicote, R.; Yamagishi, J.; King, S. Simple4all proposals for the albayzin evaluations in speech synthesis. In Proceedings of the IberSPEECH 2012, Madrid, Spain, 21–23 November 2012. [Google Scholar]
- Barra-Chicote, R.; Yamagishi, J.; King, S.; Montero, J.M.; Macias-Guarasa, J. Analysis of statistical parametric and unit selection speech synthesis systems applied to emotional speech. Speech Commun. 2010, 52, 394–404. [Google Scholar] [CrossRef]
- SPSS [Computer Software]; Version 11.5; SPSS Inc.: Chicago, IL, USA, 2013.
- Elfenbein, H.A.; O’Reilly, C.A. Fitting in: The effects of relational demography and person-culture fit on group process and performance. Group Organ. Manag. 2007, 32, 109–142. [Google Scholar] [CrossRef]
- Petkova, D. Cultural Diversity in People’s Attitudes and Perceptions. April 2006. Fondazione Eni Enrico Mattei Working PAPER No. 56.2006. Available online: http://dx.doi.org/10.2139/ssrn.897423 (accessed on 16 January 2017).
- Jones, C.M.; Jonsson, I.M. Automatic recognition of affective cues in the speech of car drivers to allow appropriate responses. In Proceedings of the 17th Australia conference on Computer-Human Interaction: Citizens Online: Considerations for Today and the Future, Canberra, Australia, 21–25 November 2005; pp. 1–10. [Google Scholar]
- Iriondo, I.; Guaus, R.; Rodríguez, A.; Lázaro, P.; Montoya, N.; Blanco, J.M.; Bernadas, D.; Oliver, J.M.; Tena, D.; Longhi, L. Validation of an acoustical modelling of emotional expression in Spanish using speech synthesis techniques. In Proceedings of the ISCA Tutorial and Research Workshop (ITRW) on Speech and Emotion, Newcastle, UK, 5–7 September 2000. [Google Scholar]
- Paulmann, S.; Uskul, A.K. Cross-cultural emotional prosody recognition: Evidence from Chinese and British listeners. Cognit. Emot. 2014, 28, 230–244. [Google Scholar] [CrossRef] [PubMed]
- Zahn-Waxler, C.; Friedman, R.J.; Cole, P.M.; Mizuta, I.; Hiruma, N. Japanese and United States preschool children’s responses to conflict and distress. Child Dev. 1996, 67, 2462–2477. [Google Scholar] [CrossRef] [PubMed]
- Mesquita, B.; Karasawa, M. Different emotional lives. Cognit. Emot. 2002, 16, 127–141. [Google Scholar] [CrossRef]
- Hurley, C.M.; Teo, W.J.; Kwok, J.; Seet, T.; Peralta, E.; Chia, S.Y. Diversity from within: The Impact of Cultural Variables on Emotion Expressivity in Singapore. IJPS 2016, 8, 50. [Google Scholar] [CrossRef]
- Hei, K.C.; Ling, W.N.; David, M.K. Communicating Disagreements among Malaysians: Verbal or Non-verbal? Lang. India 2011, 11, 442–462. [Google Scholar]
- Lee, Y.C.; Wang, T.; Liberman, M. Production and Perception of Tone 3 Focus in Mandarin Chinese. Front. Psychol. 2016. [Google Scholar] [CrossRef] [PubMed]
- Hirata, Y. Training native English speakers to perceive Japanese length contrasts in word versus sentence contexts. J. Acoust. Soc. Am. 2004, 116, 2384–2394. [Google Scholar] [CrossRef] [PubMed]
- Lutfi, S.L.; Fernández-Martínez, F.; Lorenzo-Trueba, J.; Barra-Chicote, R.; Montero, J.M. I feel you: The design and evaluation of a domotic affect-sensitive spoken conversational agent. Sensors 2013, 13, 10519–10538. [Google Scholar] [CrossRef] [PubMed]


| Anger | Happy | Neutral | Sad | Surprise | ||
|---|---|---|---|---|---|---|
| Anger | Spanish | * 71.20% | 0.00% | 7.30% | 3.60% | 7.30% |
| Japanese | 22.00% | 2.50% | 58.70% | 12.00% | 4.80% | |
| Chinese | 43.20% | 5.50% | 35.80% | 10.50% | 5.00% | |
| Vietnamese | 27.50% | 1.80% | 49.80% | 15.50% | 5.30% | |
| Malaysian | 48.00% | 9.20% | 29.80% | 4.80% | 8.20% | |
| Happy | Spanish | 10.90% | 32.70% | 10.90% | 12.70% | 25.50% |
| Japanese | 25.30% | 33.00% | 20.70% | 4.00% | 17.00% | |
| Chinese | 26.30% | * 38.20% | 18.20% | 4.00% | 13.30% | |
| Vietnamese | 27.30% | 35.70% | 20.20% | 1.70% | 15.20% | |
| Malaysian | 31.30% | 34.00% | 18.00% | 3.70% | 13.00% | |
| Neutral | Spanish | 7.30% | 1.80% | 76.30% | 1.80% | 14.60% |
| Japanese | 9.50% | 1.50% | 73.50% | 14.50% | 1.00% | |
| Chinese | 4.50% | 3.00% | 77.00% | 11.00% | 4.50% | |
| Vietnamese | 2.50% | 0.50% | * 84.00% | 9.00% | 4.00% | |
| Malaysian | 7.50% | 5.00% | 75.00% | 7.50% | 5.00% | |
| Sad | Spanish | 0.00% | 0.00% | 16.40% | * 78.10% | 3.60% |
| Japanese | 3.30% | 2.20% | 21.30% | 71.00% | 2.20% | |
| Chinese | 2.20% | 3.20% | 19.30% | 72.70% | 2.70% | |
| Vietnamese | 1.50% | 0.80% | 27.80% | 67.70% | 2.20% | |
| Malaysian | 3.30% | 3.50% | 20.30% | 70.20% | 2.70% | |
| Surprise | Spanish | 14.60% | 30.90% | 9.10% | 3.60% | 38.10% |
| Japanese | 11.00% | 24.20% | 28.30% | 1.70% | 34.80% | |
| Chinese | 13.20% | 29.50% | 21.30% | 2.80% | 33.20% | |
| Vietnamese | 11.20% | 20.20% | 25.20% | 1.50% | 42.00% | |
| Malaysian | 11.00% | 15.50% | 23.80% | 3.80% | * 45.80% |
© 2018 by the authors. Licensee MDPI, Basel, Switzerland. This article is an open access article distributed under the terms and conditions of the Creative Commons Attribution (CC BY) license (http://creativecommons.org/licenses/by/4.0/).
Share and Cite
Renunathan Naidu, G.; Lebai Lutfi, S.; Azazi, A.A.; Lorenzo-Trueba, J.; Martinez, J.M.M. Cross-Cultural Perception of Spanish Synthetic Expressive Voices Among Asians. Appl. Sci. 2018, 8, 426. https://doi.org/10.3390/app8030426
Renunathan Naidu G, Lebai Lutfi S, Azazi AA, Lorenzo-Trueba J, Martinez JMM. Cross-Cultural Perception of Spanish Synthetic Expressive Voices Among Asians. Applied Sciences. 2018; 8(3):426. https://doi.org/10.3390/app8030426
Chicago/Turabian StyleRenunathan Naidu, Ganapreeta, Syaheerah Lebai Lutfi, Amal Abdulrahman Azazi, Jaime Lorenzo-Trueba, and Juan Manuel Montero Martinez. 2018. "Cross-Cultural Perception of Spanish Synthetic Expressive Voices Among Asians" Applied Sciences 8, no. 3: 426. https://doi.org/10.3390/app8030426
APA StyleRenunathan Naidu, G., Lebai Lutfi, S., Azazi, A. A., Lorenzo-Trueba, J., & Martinez, J. M. M. (2018). Cross-Cultural Perception of Spanish Synthetic Expressive Voices Among Asians. Applied Sciences, 8(3), 426. https://doi.org/10.3390/app8030426