Article

Development of Multiphoton Ionization Time-of-Flight Mass Spectrometry for the Detection of Small Emulsion Droplets

Department of Materials Science and Engineering, Graduate School of Engineering, University of Fukui, 3-9-1 Bunkyo, Fukui 910-8507, Japan
*
Author to whom correspondence should be addressed.
Appl. Sci. 2018, 8(3), 413; https://doi.org/10.3390/app8030413
Submission received: 29 January 2018 / Revised: 1 March 2018 / Accepted: 8 March 2018 / Published: 11 March 2018
(This article belongs to the Special Issue Photoionization Mass Spectrometry)

Abstract

:
A system for measuring small oil droplets in an oil-in-water (O/W) emulsion was developed using multiphoton ionization time-of-flight mass spectrometry. In the present study, a capillary column with an inner diameter of 15 µm was used for sample introduction. Moreover, a compact microscopic system was constructed for observing an emulsion flowing through a capillary column. As a result, the length for sample introduction was shortened, which is preferable for the direct evaluation of an emulsion. Using this system, the minimum diameter of a detectable toluene droplet in an O/W emulsion was decreased to 1.7 µm. The present system could be used to evaluate the local microenvironment and stability of an emulsion.

Graphical Abstract

1. Introduction

An emulsion is normally a mixture of two liquids, where one is dispersed as small droplets throughout the other. The applications for emulsions include foods, drinks, cosmetics, and pharmaceuticals. Most emulsions are thermodynamically unstable, and droplet phenomena such as aggregation and coalescence are common. Moreover, according to the differences in the density between the droplets and the medium in a continuous phase, dispersed droplets can move to the top or the bottom, which is referred to as creaming or sedimentation, respectively [1]. Many studies concerning emulsions appear in the literature, including recent reports on the coalescence of emulsion droplets [2,3], the monitoring of interfacial lipid oxidation in emulsions [4], an examination into the luminol chemiluminescence profiles of emulsions [5], and a determination of the electrostatic potential of droplets [6].
The diameter of the droplets in an emulsion influences both its texture and stability. Therefore, it is important to obtain information about the size and constituents of droplets in an emulsion. Methods used to analyze emulsions include microscopy [7,8] and dynamic light scattering (DLS) [9,10,11]. Smith et al. used electrospray ionization quadrupole mass spectrometry (ESI-QMS) to detect small quantities of protein in small droplets [12]. ESI, however, requires the addition of a solvent for efficient ionization, which changes the droplet size and stability of an emulsion.
Recently, we developed a version of multiphoton ionization time-of-flight mass spectrometry (MPI-TOFMS) for the direct analysis of an emulsion [13]. MPI-TOFMS has characteristics such as high selectivity and robustness [14,15] that make it suitable for the analysis of emulsions with inherently high concentrations of each constituent. MPI-TOFMS is normally applied to the detection of a gas sample [15,16,17]. In combination with gas chromatography (GC), this method can be applied to the comprehensive trace analysis of complex environmental samples [18,19,20,21]. In addition, laser desorption and pyrolytic vaporization techniques have been used to measure solid samples [22,23,24,25,26,27]. To measure an emulsion in a liquid sample, we developed a sample introduction technique for MPI-TOFMS that is based on a pair of concentric capillaries. This technique allowed for the mass analysis of oil constituents in an oil-in-water (O/W) emulsion [13]. Moreover, we obtained the time profile of an analyte, which was constructed by plotting the peak areas for a series of mass spectra, and found that many spikes appeared when measuring an emulsion with white turbidity. The appearance of spikes confirms the existence of oil droplets that are vaporized into the vacuum chamber of a TOFMS and then ionized by MPI. Using this MPI-TOFMS, the existing position of an analyte could be evaluated whether it was placed inside or outside an emulsion droplet [28,29]. Moreover, this technique was applied to the detection of a water-in-oil-in-water (W/O/W) multiple emulsion [30]. This method was recently used for the quantitative analysis of an oil component in an O/W emulsion [31].
In addition, we proposed a relationship between the diameter of an oil droplet in a toluene O/W emulsion and the intensity of a spike appearing on a time profile for toluene [32]. Briefly, the signal intensity of the spike should be directly proportional to the square of the diameter of the small droplet of toluene, and based on the values of Smax (the maximum spike intensity), Smin (the minimum detectable spike intensity), and Dmax (the diameter of the droplet which caused the spike with Smax), we calculated Dmin (the minimum diameter of a droplet that was detectable as a spike). In that report, a Dmin of 2.9 µm was obtained when a capillary column with an inner diameter of 25 µm was used for sample introduction. As mentioned previously, the size of droplets in an emulsion can affect its stability. Therefore, an analytical technique for the direct mass analysis of the constituents of a small droplet would be useful for evaluating several types of emulsions.
In the present study, a technique for the detection of small emulsion droplets by MPI-TOFMS was developed. To achieve this, a narrowed capillary column with an inner diameter of 15 µm was employed, which will be described in detail later. In the previous paper, a conventional microscope was placed between a sample container and a TOFMS to monitor an emulsion passing through a capillary column [32]. Accordingly, this required a long capillary column (practically, 120 cm). However, the formation of aggregates of small droplets was confirmed during the flow through the capillary. That is, the obtained results did not necessarily reflect the local microenvironment of an emulsion existing in a sample container. Therefore, the use of a much shorter capillary column is preferable for the monitoring of an emulsion, and for the evacuation of an emulsion from a sample container via the vacuum of a TOFMS, because using a narrowed capillary column can negatively influence the introduction of an emulsion. In the present study, a compact microscopic system was constructed in order to use a short capillary column. This MPI-TOFMS system allowed both the microscopic observation of an emulsion flowing through the capillary column and on-line mass analysis.

2. Materials and Methods

2.1. Reagents and Sample Preparation

Toluene (Wako Pure Chemical Industries, Osaka, Japan), purified water, and sodium dodecyl sulfate (SDS, Wako Pure Chemical Industries) served as the dispersed phase, the continuous phase, and an emulsifier for an O/W emulsion, respectively. The concentrations of toluene and SDS were 6 and 3 g/L, respectively, where the denominator of the unit was the sum of the volume of water and toluene before mixing. The preparation scheme was as follows. First, SDS was dissolved in 20 mL of purified water in a 30 mL sample container. Toluene was added, and the sample was covered with a lid and ultrasonicated for 90 s. The time was extended compared with the previous report (60 s) [32] in order to reduce the sizes of the oil droplets. The obtained emulsion had a white turbidity. Before measurement, the emulsion was allowed to stand with a lid for 1 day to promote creaming, after which almost all the lower portion of the resultant sample appeared transparent. As described later, the transparent portion of the sample was continuously measured at first. Then, the sample was ultrasonicated for 75 s to re-disperse the toluene, and the resultant emulsion with a white turbidity was re-measured.

2.2. Apparatus

The experimental apparatus used in the present study is shown in Figure 1. A system comprised of a pair of concentric deactivated fused-silica capillaries (GL Sciences, Tokyo, Japan) was used for the sample introduction [13]. An emulsion was introduced through an inner capillary (55 cm in length, i.d. 15 µm, o.d. 150 µm), and ambient air was introduced through an outer capillary (35 cm in length, i.d. 320 µm, o.d. 450 µm). The tip of the inner capillary on the side of a TOFMS was set 1.5 mm inward from the tip of the outer capillary in order to insure the introduction of a liquid sample via the evacuation force of TOFMS vacuum, although the corresponding length was set at 2–3 mm in previous reports [13,28,29,30,31,32]. The tips were indirectly heated at 40 °C by a heater mounted in the flange of a TOFMS. The height of the prepared sample was 4 cm in a sample container, and the inner capillary was inserted into a container 1.5 cm from the bottom through a small hole in the lid. A flow meter (RK-1250, Kofloc, Kyoto, Japan) allowed adjustment of the rate of ambient air from an outer capillary to 2 mL/min. The pressure of the vacuum chamber of the TOFMS was 1 × 10⁻² Pa during measurement.
In the present study, a compact microscopic system was constructed of an objective (G plan Apo 20×, NA 0.28, Mitutoyo, Kanagawa, Japan), an imaging lens (MT-1, Mitutoyo), a light source (MegaLight100, AS ONE, Osaka, Japan), and a digital camera (DIGITAL SIGHT DS-U1, Nikon, Tokyo, Japan) in order to monitor the emulsion flowing through the inner capillary. The objective was set so that the length between the sampling point of the sample container and the microscopic observation point was 30 cm.
The MPI-TOFMS used in the present study has been reported elsewhere [13,28,30,31,32], and is only briefly described here. The fourth harmonic of a nanosecond Nd:YAG laser (GAIA II, 266 nm, 4 ns, 10 Hz, Rayture Systems, Tokyo, Japan) was employed for MPI. The pulse energy was adjusted to 20 µJ, and a plano-convex lens (f = 200 mm) was used to focus the pulses 2 mm from the tip of the outer capillary. A linear-type TOFMS with a drift length of 60 cm was used in the present study. A digitizer (AP240, 1 GHz, 1 GS/s, Acqiris/Agilent Technologies, Tokyo, Japan) was used to acquire the ion signals. Following the introduction of a creamed emulsion, measurement of the transparent portion was recorded after the signal for toluene was confirmed. After the dispersion of toluene, measurement of the white-turbid emulsion was simultaneously begun when the inner capillary was inserted into the sample container. In both experiments, laser pulses were not irradiated for the first 30 s in order to determine the ground (zero) level. In the present study, the series of mass spectra were recorded without averaging. It is worth noting that a huge amount of data will be obtained during long-time measurements, which complicates processing. Therefore, the series of mass spectra were consecutively (and separately) recorded, and, as a result, a slight time interval of ca. 2 s existed between the end of one recording and the beginning of the next. In the present study, the time profile for toluene was constructed by extracting the areas of both the molecular ion (M+) peak and the [M − H]+ peak (m/z 92 and 91, respectively) from the series of mass spectra. In detail, the m/z window applied to the extractions was set between 90.1 and 92.8 in order to extract almost all the signals for the above two peaks.

3. Results and Discussion

3.1. Microscopic Observation and Time Profiles

In the present study, the online measurement of an O/W emulsion was performed using an inner capillary with an inner diameter of 15 µm as a sample introduction port, rather than the inner diameter of 20 or 25 µm used in previous reports [13,28,29,30,31,32]. Before the measurement, we theorized that the use of a narrowed capillary column for sample introduction would allow for the detection of spikes for much smaller oil droplets on a time profile, as follows. When considering the cross section of an inner capillary column with respect to the axis of sample flow, the ratio of the cross section of an oil droplet and the cross section of a column becomes larger when using a narrowed capillary column. In other words, the ratio of the cross section of a continuous phase is diminished. A small quantity of an oil component dissolved in a continuous phase causes background signals rather than spikes on a time profile obtained from the online mass analysis of an O/W emulsion. That is, the background signal should decrease when using a narrowed inner capillary column. As a result, the ratio of the spike signal to the background fluctuation (S/B) should increase.
On the other hand, we also considered the difficulty in flowing an emulsion through a narrow capillary column via the evacuation force of a vacuum chamber. Therefore, the length of the inner capillary column was shortened; other reasons for the use of a shorter capillary were mentioned in the introduction section. However, when a conventional microscope was placed between a sample container and a TOFMS in order to monitor the flow of a sample, an inner capillary was required for adjustment to no shorter than 120 cm [32]. Therefore, a compact microscopic system was constructed in the present study, and the resultant length of the inner capillary was shortened to 55 cm.
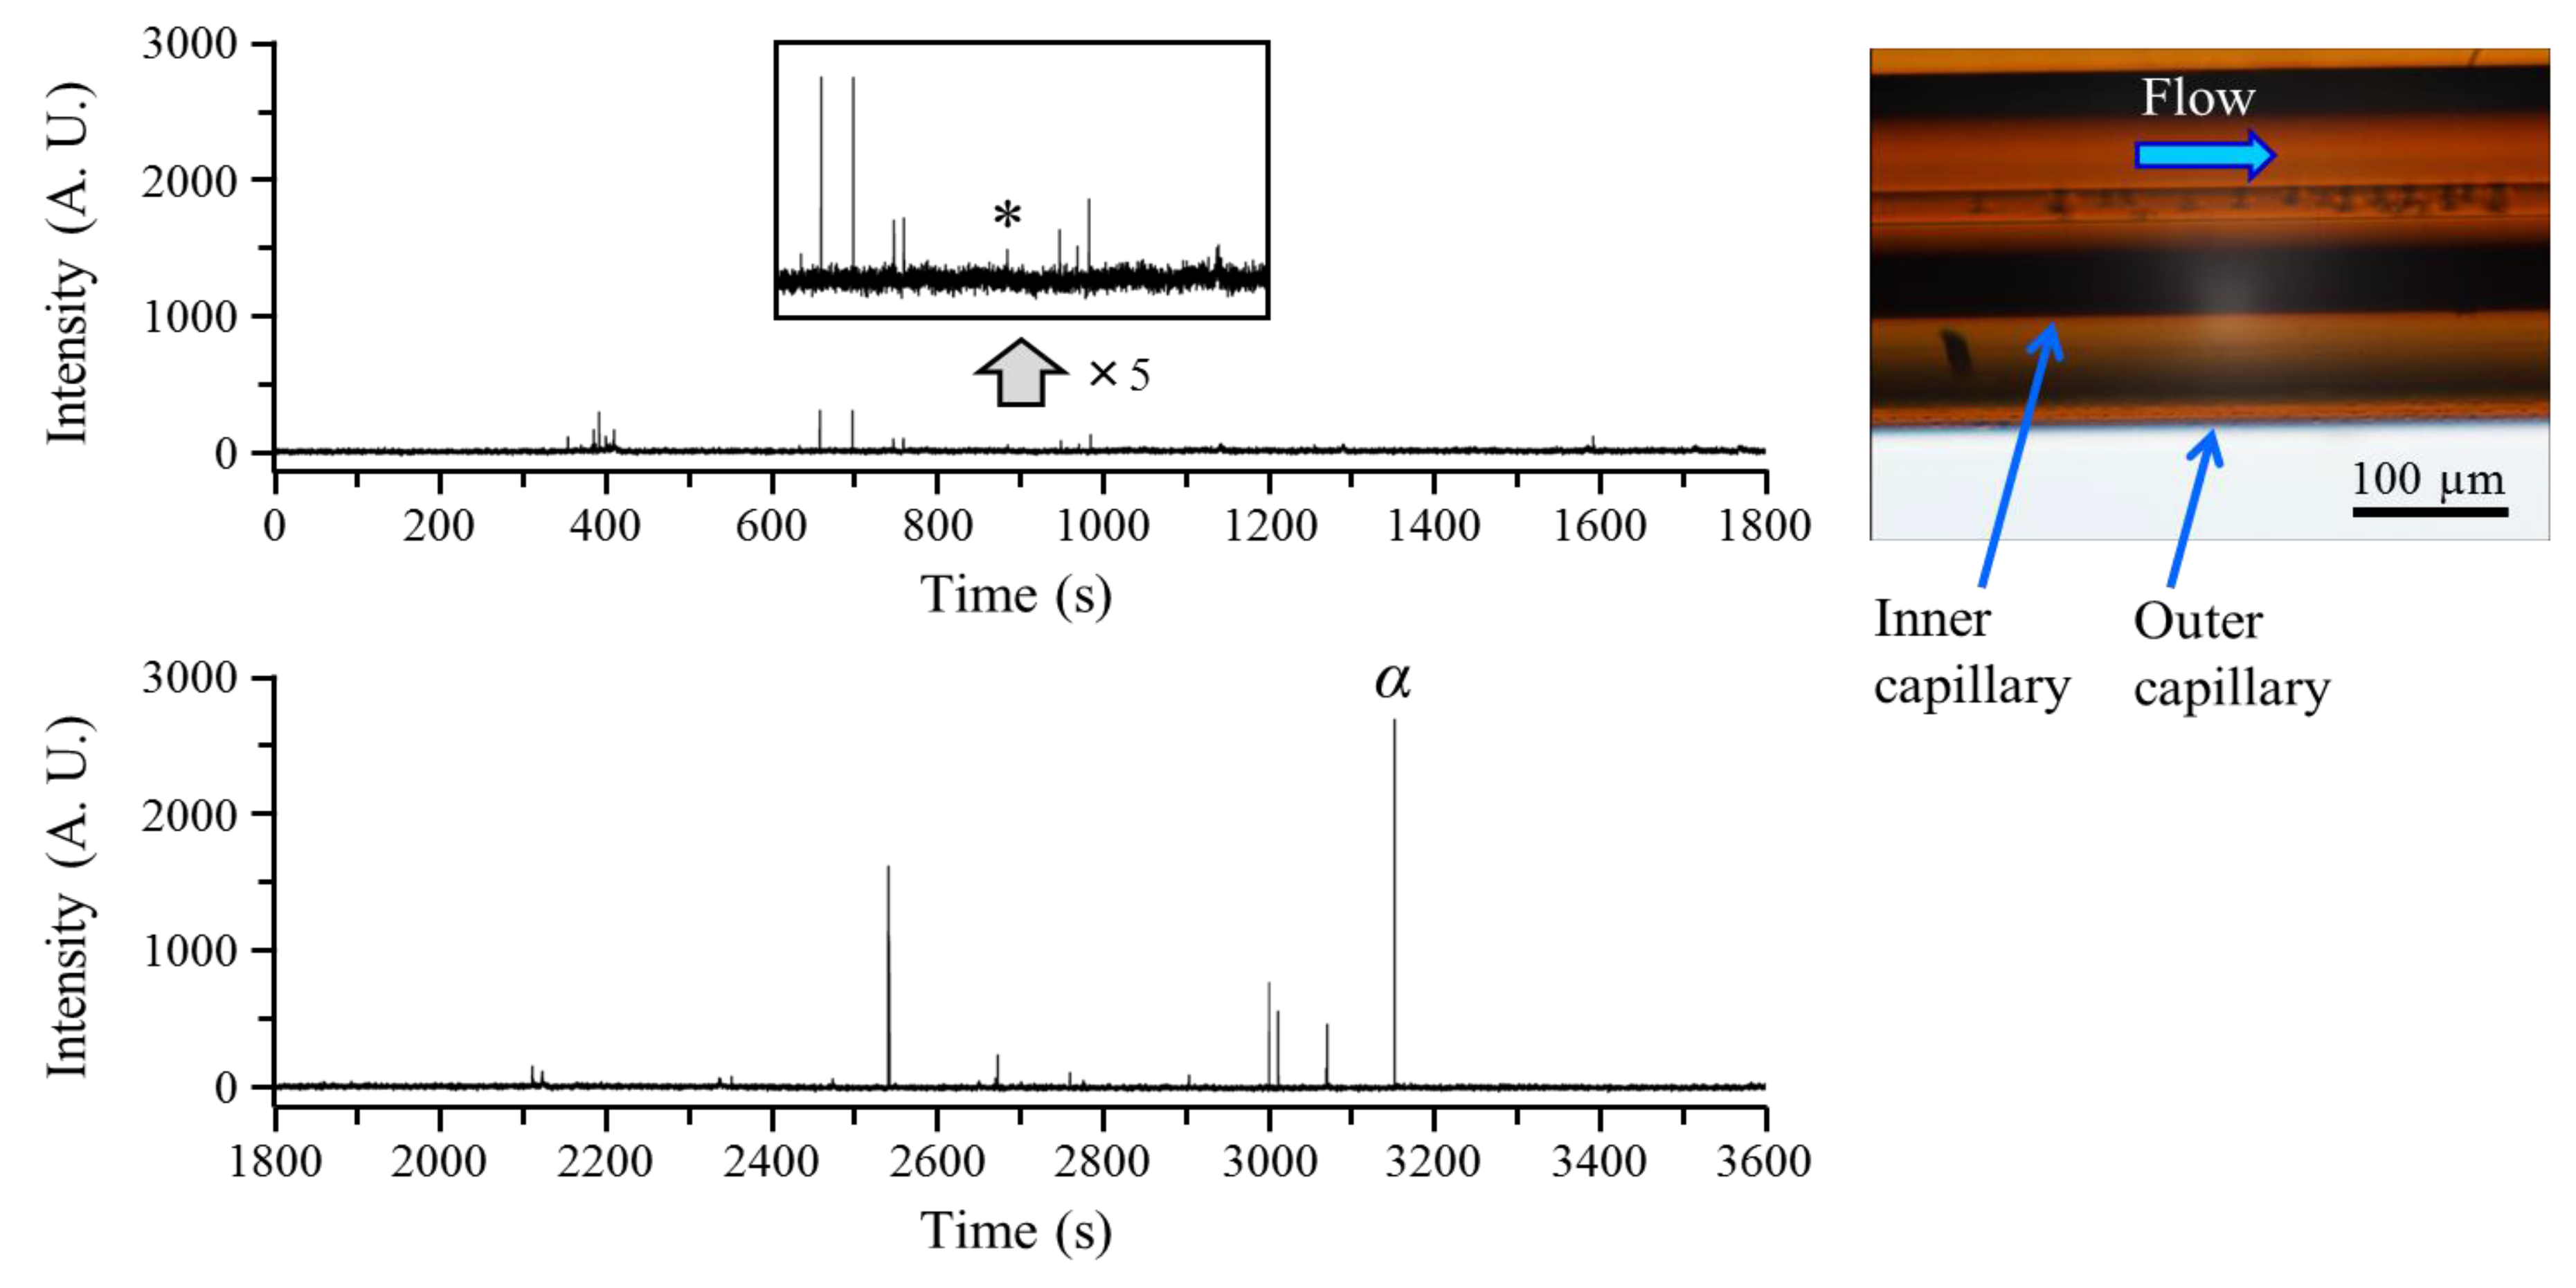
Using this system, a toluene O/W emulsion was measured online. First, a prepared emulsion was allowed to stand for 1 day to promote creaming, after which the lower portion of the resultant transparent sample was measured. Figure 2 shows a time profile of the peak area of toluene constructed from a series of obtained mass spectra. In addition, a bright-field image of a sample passing through an inner capillary column obtained by the present microscopic system is also shown. In this measurement, the flow of the sample was confirmed, but no oil droplets were found to flow. From the results of a time profile obtained by MPI-TOFMS, a constant signal for toluene was detected, although it was very small. It should be noted that, at this point, a transparent portion of an emulsion was measured as almost all toluene was moved to the upper side with only small quantities remaining in the lower transparent portion. In this manner, the oil component that remains in the transparent portion of an emulsion after creaming could surely be monitored using the present system.
After measuring the transparent portion, the capillary column was removed from the sample container, and the sample was ultrasonicated in order to re-disperse the toluene. The resultant emulsion had a white turbidity and was then immediately measured again. The obtained results are shown in Figure 3. In this measurement, oil droplets of various sizes were found to have flowed, although the exact diameters of oil droplets in the capillary were difficult to determine, although it must be assumed that the size of some of the oil droplets were compatible with the inner diameter of the inner capillary. Moreover, several spikes appeared on the time profile obtained by MPI-TOFMS. These results indicate that an emulsion with white turbidity could also pass through a narrow inner capillary and be measured by the present system. It should be noted that the number of spikes was considerably fewer than that obtained in a previous report [32]. In the present measurement, small oil droplets were found, but their aggregates were seldom confirmed. This was probably the result of the use of a short capillary column, because the formation of aggregates is not likely to have occurred during passage through a short capillary column, which was suggested in the previous report [32]. Incidentally, we detected no large droplets, which would have had a cylinder shape, although the vacuum of the present system should be sufficient to draw in droplets of this nature.

3.2. The Minimum Droplet Size that Can be Detected as a Spike

Next, we used the present system to calculate the minimum diameter of an oil droplet in an O/W emulsion, Dmin, which could be detected as a spike. Previously, the following equation was proposed for calculating the value [32]:
D min = D max s min s max
where Smin is the minimum detectable spike intensity, Smax is the maximum spike intensity observed on the time profile, and Dmax is the diameter of the droplet that caused the spike with Smax. In the present study, a value for Dmax of 15 µm was applied, which was the same as the inner diameter of the inner capillary.
The values for Smin and Smax were obtained from the time profiles shown in Figure 2 and Figure 3. First, the background signal was determined as the point at which a constant signal for toluene can be detected, but a spike cannot. Calculation of the standard deviation of the background signal intensities showed 8, which was obtained by the data from 31–1200 s shown in Figure 2. Moreover, the background fluctuation, B, was determined to be twice the standard deviation of the background signal intensities. Assuming that a spike with an S/B = 3 was defined as detectable, we obtained an Smin = 48. A peak with an S/B of 3 can be found in an enlarged time profile of Figure 3, which is marked with an asterisk. Next, Smax = 2700 was obtained from the most intense spike, which is indicated by α in Figure 3. Consequently, the minimum diameter of a detectable toluene droplet as a spike, Dmin, was calculated to be 1.9 µm. We conducted one more experiment where a value for Smax = 4900 was obtained and a value for Dmin of 1.5 μm was calculated. Therefore, using the present system, a value for Dmin of 1.7 μm was achieved, which corresponds to 2.6 fL. These values were smaller than the previous ones (2.9 µm and 13 fL, respectively) [32]. Although a potential limitation of the present system could be that it is not necessarily suited for evaluating an emulsion containing large droplets, by selecting an appropriate capillary column with an inner diameter of 15–25 μm, an online mass-analysis and a stability evaluation of emulsions could be performed.

4. Conclusions

In the present study, a new technique was developed for detecting small emulsion droplets via MPI-TOFMS. To achieve this, a capillary column that was narrower than that previously used was employed for sample introduction. Moreover, a compact microscopic system was constructed to monitor an emulsion passing through the capillary, which enabled a shortening of the sample introduction port. Consequently, the minimum diameter of a detectable toluene droplet in an O/W emulsion was decreased to 1.7 µm. The present system offers the possibility for the on-line mass analysis of the constituents in an emulsion without pretreatment, which could become a powerful tool for analyzing the local microenvironment and stability of emulsions.

Acknowledgments

This work was supported by a research grant provided by the JGC-S Scholarship Foundation.

Author Contributions

Tomohiro Uchimura conceived the experiments; Chiaki Fujita and Yoshiki Sugimura performed the experiments; Chiaki Fujita and Tomohiro Uchimura analyzed the data and wrote the paper.

Conflicts of Interest

The authors declare no conflicts of interest.

References

  1. Tadros, T.F. Emulsion Science and Technology; Tadros, T.F., Ed.; Wiley-VCH: Weinheim, Germany, 2009; Chapter 1. [Google Scholar]
  2. Mitsunobu, M.; Kobayashi, S.; Takeyasu, N.; Kaneta, T. Temperature-induced coalescence of droplets manipulated by optical trapping in an oil-in-water emulsion. Anal. Sci. 2017, 33, 709–713. [Google Scholar] [CrossRef] [PubMed]
  3. Chiu, S.-H.; Urban, P.L. Fusion of microlitre water-in-oil droplets for simple, fast and green chemical assays. Analyst 2015, 140, 5145–5151. [Google Scholar] [CrossRef] [PubMed]
  4. Banerjee, C.; Westberg, M.; Breitenbach, T.; Bregnhøj, M.; Ogilby, P.R. Monitoring interfacial lipid oxidation in oil-in-water emulsions using spatially resolved optical techniques. Anal. Chem. 2017, 89, 6239–6247. [Google Scholar] [CrossRef] [PubMed]
  5. Wada, M.; Yamaguchi, A.; Ogawa, A.; Kido, H.; Nakamura, S.; Takada, M.; Kawakami, S.; Kuroda, N.; Nakashima, K. Luminol chemiluminescence profile of o/w emulsions during thermal oxidation. Anal. Sci. 2017, 33, 249–252. [Google Scholar] [CrossRef] [PubMed]
  6. Iwata, T.; Nagatani, H.; Osakai, T. Determination of the electrostatic potential of oil-in-water emulsion droplets by combined use of two membrane potential-sensitive dyes. Anal. Sci. 2017, 33, 813–819. [Google Scholar] [CrossRef] [PubMed]
  7. Utada, A.S.; Lorenceau, E.; Link, D.R.; Kaplan, P.D.; Stone, H.A.; Weitz, D.A. Monodisperse double emulsions generated from a microcapillary device. Science 2005, 308, 537–541. [Google Scholar] [CrossRef] [PubMed]
  8. Hou, L.; Ren, Y.; Jia, Y.; Deng, X.; Tang, Z.; Tao, Y.; Jiang, H. A simple microfluidic method for one-step encapsulation of reagents with varying concentrations in double emulsion drops for nanoliter-scale reactions and analyses. Anal. Methods 2017, 9, 2511–2516. [Google Scholar] [CrossRef]
  9. Pal, N.; Verma, S.D.; Singh, M.K.; Sen, S. Fluorescence correlation spectroscopy: An efficient tool for measuring size, size-distribution and polydispersity of microemulsion droplets in solution. Anal. Chem. 2011, 83, 7736–7744. [Google Scholar] [CrossRef] [PubMed]
  10. Vélez, G.; Fernández, M.A.; Muñoz, J.; Williams, P.A.; English, R.J. Role of hydrocolloids in the creaming of oil in water emulsions. J. Agric. Food Chem. 2003, 51, 265–269. [Google Scholar] [CrossRef] [PubMed]
  11. Yu, L.; Li, C.; Xu, J.; Hao, J.; Sun, D. Highly stable concentrated nanoemulsions by the phase inversion composition method at elevated temperature. Langmuir 2012, 28, 14547–14552. [Google Scholar] [CrossRef] [PubMed]
  12. Smith, C.A.; Li, X.; Mize, T.H.; Sharpe, T.D.; Graziani, E.I.; Abell, C.; Huck, W.T.S. Sensitive, high throughput detection of proteins in individual, surfactant-stabilized picoliter droplets using nanoelectrospray ionization mass spectrometry. Anal. Chem. 2013, 85, 3812–3816. [Google Scholar] [CrossRef] [PubMed] [Green Version]
  13. Ishigami, H.; Tsuda, Y.; Uchimura, T. Laser ionization/time-of-flight mass spectrometry for the direct analysis of emulsions. Anal. Methods 2014, 6, 5615–5619. [Google Scholar] [CrossRef]
  14. Boesl, U. Time-of-flight mass spectrometry: Introduction to the basics. Mass Spectrom. Rev. 2017, 36, 86–109. [Google Scholar] [CrossRef] [PubMed]
  15. Lubman, D.M.; Kronick, M.N. Mass spectrometry of aromatic molecules with resonance-enhanced multiphoton ionization. Anal. Chem. 1982, 54, 660–665. [Google Scholar] [CrossRef]
  16. Lin, J.L.; Huang, C.J.; Lin, C.H.; Tzeng, W.B. Resonant two-photon ionization and mass-analyzed threshold ionization spectroscopy of the selected rotamers of m-methoxyaniline and o-methoxyaniline. J. Mol. Spectrosc. 2007, 244, 1–8. [Google Scholar] [CrossRef]
  17. Matsumoto, J.; Misawa, K.; Ishiuchi, S.; Fujii, M. In situ, fast-response, molecular-selective methods for measuring emission factors of volatile organic compounds (VOCs) into the atmosphere. Chem. Lett. 2009, 38, 74–75. [Google Scholar] [CrossRef]
  18. Imasaka, T. Ultraviolet femtosecond laser ionization mass spectrometry. Chem. Rec. 2008, 8, 23–32. [Google Scholar] [CrossRef] [PubMed]
  19. Gullett, B.K.; Oudejans, L.; Tabor, D.; Touati, A.; Ryan, S. Near-real-time combustion monitoring for PCDD/PCDF indicators by GC-REMPI-TOFMS. Environ. Sci. Technol. 2012, 46, 923–928. [Google Scholar] [CrossRef] [PubMed]
  20. Hamachi, A.; Imasaka, T.; Nakamura, H.; Li, A.; Imasaka, T. Determination of nerve agent metabolites by ultraviolet femtosecond laser ionization mass spectrometry. Anal. Chem. 2017, 89, 5030–5035. [Google Scholar] [CrossRef] [PubMed]
  21. Miyagawa, T.; Shimizu, S.; Miura, A.; Fukuyama, A.; Uchimura, T. Rapid evaluation of the bioremediation of fuel oil in soil by gas chromatography–laser ionization time-of-flight mass spectrometry. Anal. Lett. 2017, 50, 2859–2868. [Google Scholar] [CrossRef]
  22. Li, L.; Lubman, D.M. Analytical jet spectroscopy of tyrosine and its analogs using a pulsed laser desorption volatilization method. Appl. Spectrosc. 1988, 42, 418–424. [Google Scholar] [CrossRef]
  23. Elsila, J.E.; de Leon, N.P.; Zare, R.N. Factors affecting quantitative analysis in laser desorption/laser ionization mass spectrometry. Anal. Chem. 2004, 76, 2430–2437. [Google Scholar] [CrossRef] [PubMed]
  24. Haefliger, O.P.; Zenobi, R. Laser mass spectrometric analysis of polycyclic aromatic hydrocarbons with wide wavelength range laser multiphoton ionization spectroscopy. Anal. Chem. 1998, 70, 2660–2665. [Google Scholar] [CrossRef] [PubMed]
  25. Sakurai, S.; Uchimura, T. Pyrolysis-gas chromatography/multiphoton ionization/time-of-flight mass spectrometry for the rapid and selective analysis of polycyclic aromatic hydrocarbons in aerosol particulate matter. Anal. Sci. 2014, 30, 891–895. [Google Scholar] [CrossRef] [PubMed]
  26. Miles, J.; De Camillis, S.; Alexander, G.; Hamilton, K.; Kelly, T.J.; Costello, J.T.; Zepf, M.; Williams, I.D.; Greenwood, J.B. Detection limits of organic compounds achievable with intense, short-pulse lasers. Analyst 2015, 140, 4270–4276. [Google Scholar] [CrossRef] [PubMed] [Green Version]
  27. Passig, J.; Schade, J.; Oster, M.; Fuchs, M.; Ehlert, S.; Jäger, C.; Sklorz, M.; Zimmermann, R. Aerosol mass spectrometer for simultaneous detection of polyaromatic hydrocarbons and inorganic components from individual particles. Anal. Chem. 2017, 89, 6341–6345. [Google Scholar] [CrossRef] [PubMed]
  28. Fukaya, H.; Tsuda, Y.; Uchimura, T. Laser ionization time-of-flight mass spectrometry for the evaluation of a local microenvironment in an emulsion. Anal. Methods 2016, 8, 270–274. [Google Scholar] [CrossRef]
  29. Yamamoto, H.; Ishigami, H.; Uchimura, T. Online monitoring of a styrene monomer and a dimer in an emulsion via laser ionization time-of-flight mass spectrometry. Anal. Sci. 2017, 33, 731–733. [Google Scholar] [CrossRef] [PubMed]
  30. Tsuda, Y.; Uchimura, T. Evaluating the aging of multiple emulsions using resonance-enhanced multiphoton ionization time-of-flight mass spectrometry. Anal. Sci. 2016, 32, 789–795. [Google Scholar] [CrossRef] [PubMed]
  31. Fukaya, H.; Uchimura, T. A quantitative analysis of an oil component in an emulsion by multiphoton ionization mass spectrometry. Anal. Sci. 2017, 33, 1067–1070. [Google Scholar] [CrossRef] [PubMed]
  32. Shimo, Y.; Uchimura, T. Time-profile measurement of an emulsion using multiphoton ionization time-of-flight mass spectrometry in combination with a microscope. Anal. Sci. 2016, 32, 1059–1063. [Google Scholar] [CrossRef] [PubMed]
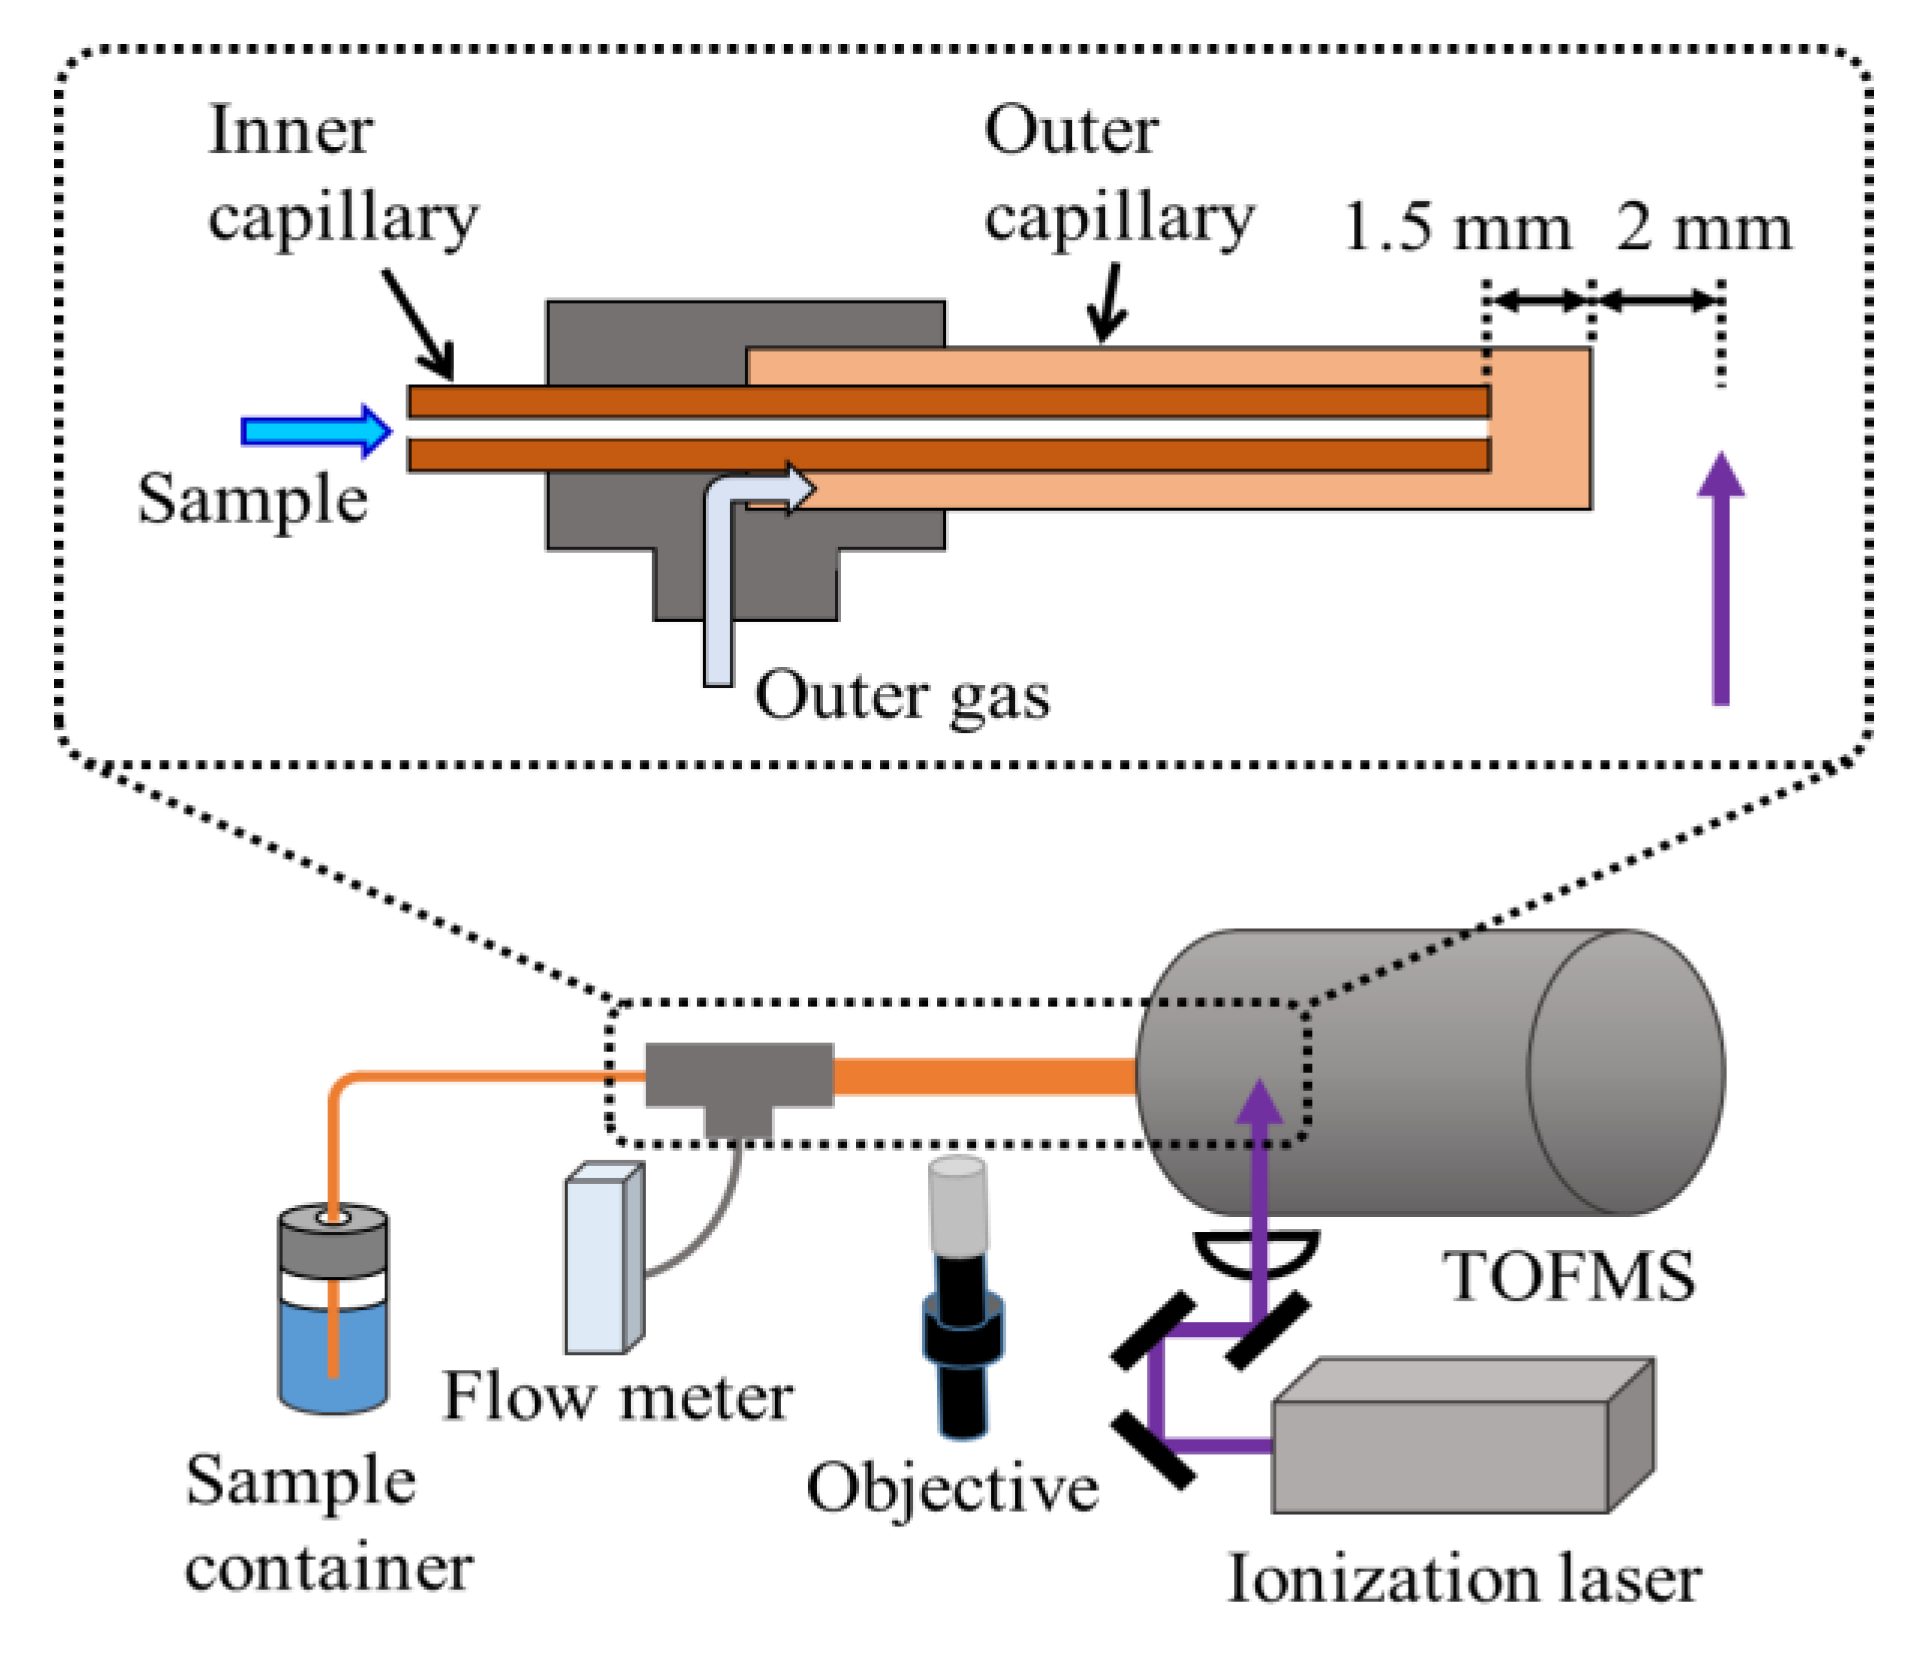
Figure 1. Schematic diagram of the apparatus. An enlarged view of a pair of concentric capillary columns for sample introduction is also shown.
Applsci 08 00413 g001
Figure 2. Time profile for toluene in an oil-in-water (O/W) emulsion after creaming that appeared transparent. The time profile was obtained by extracting the peak areas at m/z 92 and 91 (see text). The bright-field image of a sample flowing through an inner capillary column is also shown.
Applsci 08 00413 g002
Figure 3. Time profile for toluene in an O/W emulsion with white turbidity. The time profile was obtained by extracting the peak areas at m/z 92 and 91 (see text). It is noted that the bottom time profile is a continuation of the top time profile. The bright-field image of a sample flowing through an inner capillary column is also shown. The most intense spike is specified by α, and was used for obtaining Smax (see text). A peak with an S/B of 3 is marked with an asterisk (*).
Applsci 08 00413 g003