1. Introduction and Motivation
Earthquake-induced ground motions are identified as one of the most unpredictable, and more importantly, destructive threats to civil engineering structures. Strong seismic events may cause loss of life and property damage through soft-storey and weak-storey failures, pounding-induced damage (see, for example, [
1,
2]), brittle fracture and collapse of masonry and concrete structures, or failures resulting from excessive plastic deformations in steel frame structures. Therefore, developing earthquake protection systems in order to improve safety and reliability of structures is an issue of the highest priority in many seismically active regions (see, for example, [
3,
4]).
In general, the family of earthquake protective systems consists of passive, active, and semi-active (hybrid) control systems. Base isolation, which is an example of passive control methods, is recognized as one of the most effective and widely adopted approaches of protecting structures during strong ground motions (see, for example, [
5,
6]). This solution is also considered to be the safest and most reliable method, because, in contrast to active and hybrid (semi-active) devices (see, for example, [
7,
8,
9]), its activation requires no external source of energy, that may not necessarily be accessible due to earthquake-induced devastation. Broadly, base isolation system works by decoupling the building from the horizontal components of an earthquake ground motion by incorporating a layer with relatively low horizontal stiffness between the structure and its foundation (see, for example, [
10,
11,
12]). Thus, the primary concept of base isolation systems is to modify structural dynamic properties by elongating the fundamental period of vibration and introducing additional damping so that base-isolated structures may respond more favourably to earthquake ground motions (see, for example, [
13,
14]). The philosophy of base isolation is well established and commonly accepted in many seismically active regions including California, Japan, and New Zealand. Base isolators, such as lead-rubber bearings (LRBs), high-damping rubber bearings (HDRBs), and friction pendulum bearings (FPBs), are commonly used in practice in order to improve structural safety, and thus, minimize property damage. It should also be mentioned, however, that base isolation devices made with the use of rubbery materials may be susceptible to aging resulting in degradation of stiffness and damping properties. Therefore, every type of rubber bearing requires routine maintenance to ensure the structural safety and reliability.
Both numerical and experimental results of research focused on the effectiveness of various types of base isolation system have been widely published (see, for example, [
15,
16,
17,
18]). More importantly, many of the completed base-isolated buildings have already experienced strong ground motions, and their dynamic performance has been just as predicted, which explicitly confirms high effectiveness of base isolation systems in suppressing structural vibrations (see, for example, [
19,
20]).
However, in order get an accurate insight into the seismic performance of base-isolated structures in numerical analysis, it is absolutely necessary to accurately capture the mechanical behaviour of base isolation system. This issue is particularly important at the design stage of new structures or retrofitting existing ones. Moreover, with the increasing number of base isolators exhibiting different mechanical behaviour, which may also be triggered due to new materials employed, this task is very challenging and often requires and individual approach to a specific type of seismic isolation device. In nonlinear structural dynamics, there are generally a few approaches, which can be incorporated to simulate the nonlinear behaviour of base isolation devices. These mathematical models, however, are evaluated for different base isolators, which are characterized by their own specific load-displacement behaviour, and thus, may not be fully appropriate for detailed numerical analysis of structures isolated with different types of base isolation systems. Moreover, most of these models refer to either elastomeric bearings (see, for example, [
21,
22,
23,
24]), or HDRBs (see, for example, [
25,
26]), which are also susceptible to vertical loads.
Motivated by the preceding discussion, the present paper was designed to verify the effectiveness of an advanced hysteretic model in simulating complex force-deformation behaviour of a prototype seismic isolation system made of PBs, which are constructed with the use of a specially prepared for this purpose polymeric material with improved damping properties [
27]. High effectiveness of PBs in reducing structural vibrations due to seismic excitations was confirmed during previously conducted extensive shaking table investigation and the results have already been published (see [
28] for details). In order to achieve the above-mentioned aim of the present investigation, the following specific objectives were established:
- (1)
Perform dynamic oscillatory test in order to determine the energy dissipation properties of the base isolation system made of PBs based on the experimentally obtained hysteresis loops.
- (2)
Propose a general form of an advanced mathematical model, which defines the lateral force as a nonlinear function of shear displacement and deformation velocity, in order to accurately capture the nonlinear mechanical behaviour of PBs in numerical analysis of base-isolated structures.
- (3)
Evaluate the function parameters by fitting the general form of the proposed mathematical model into the experimentally obtained hysteresis loops using the least squares optimisation method.
- (4)
Implement the proposed mathematical model into the computational analysis in order to perform numerical evaluation of the seismic response of the previously examined experimental models with dynamic characteristics typical for low-rise and medium-rise buildings, both fixed-base and base-isolated with the use of PBs, to a number of different ground motions and a mining tremor.
- (5)
Verify the effectiveness of the proposed mathematical model in simulating nonlinear behaviour of PBs by comparing the results of the detailed lumped-parameter analysis with the experimentally obtained shaking table data.
2. Polymeric Bearings and Previous Shaking Table Investigation
Precise description of PBs, detailed material testing (i.e., static tension and compression tests, Dynamic Mechanical Analysis, etc.), and finally the results of the extensive shaking table investigation, which was conducted in order to verify the effectiveness of this prototype base isolation system in reducing structural vibrations due to ground motions, has already been published (see [
27,
28]). To briefly outline the key results it should be mentioned that PBs were constructed with the use of a specially prepared for this purpose polymeric material with increased energy dissipation potential. Energy dissipation potential of PBs was confirmed by a relatively high value of the loss factor obtained from the Dynamic Mechanical Analysis test. Moreover, static tension and compression results explicitly demonstrated that the tested polymer is considerably nonlinear and its mechanical behaviour is strongly dependent on the strain rate.
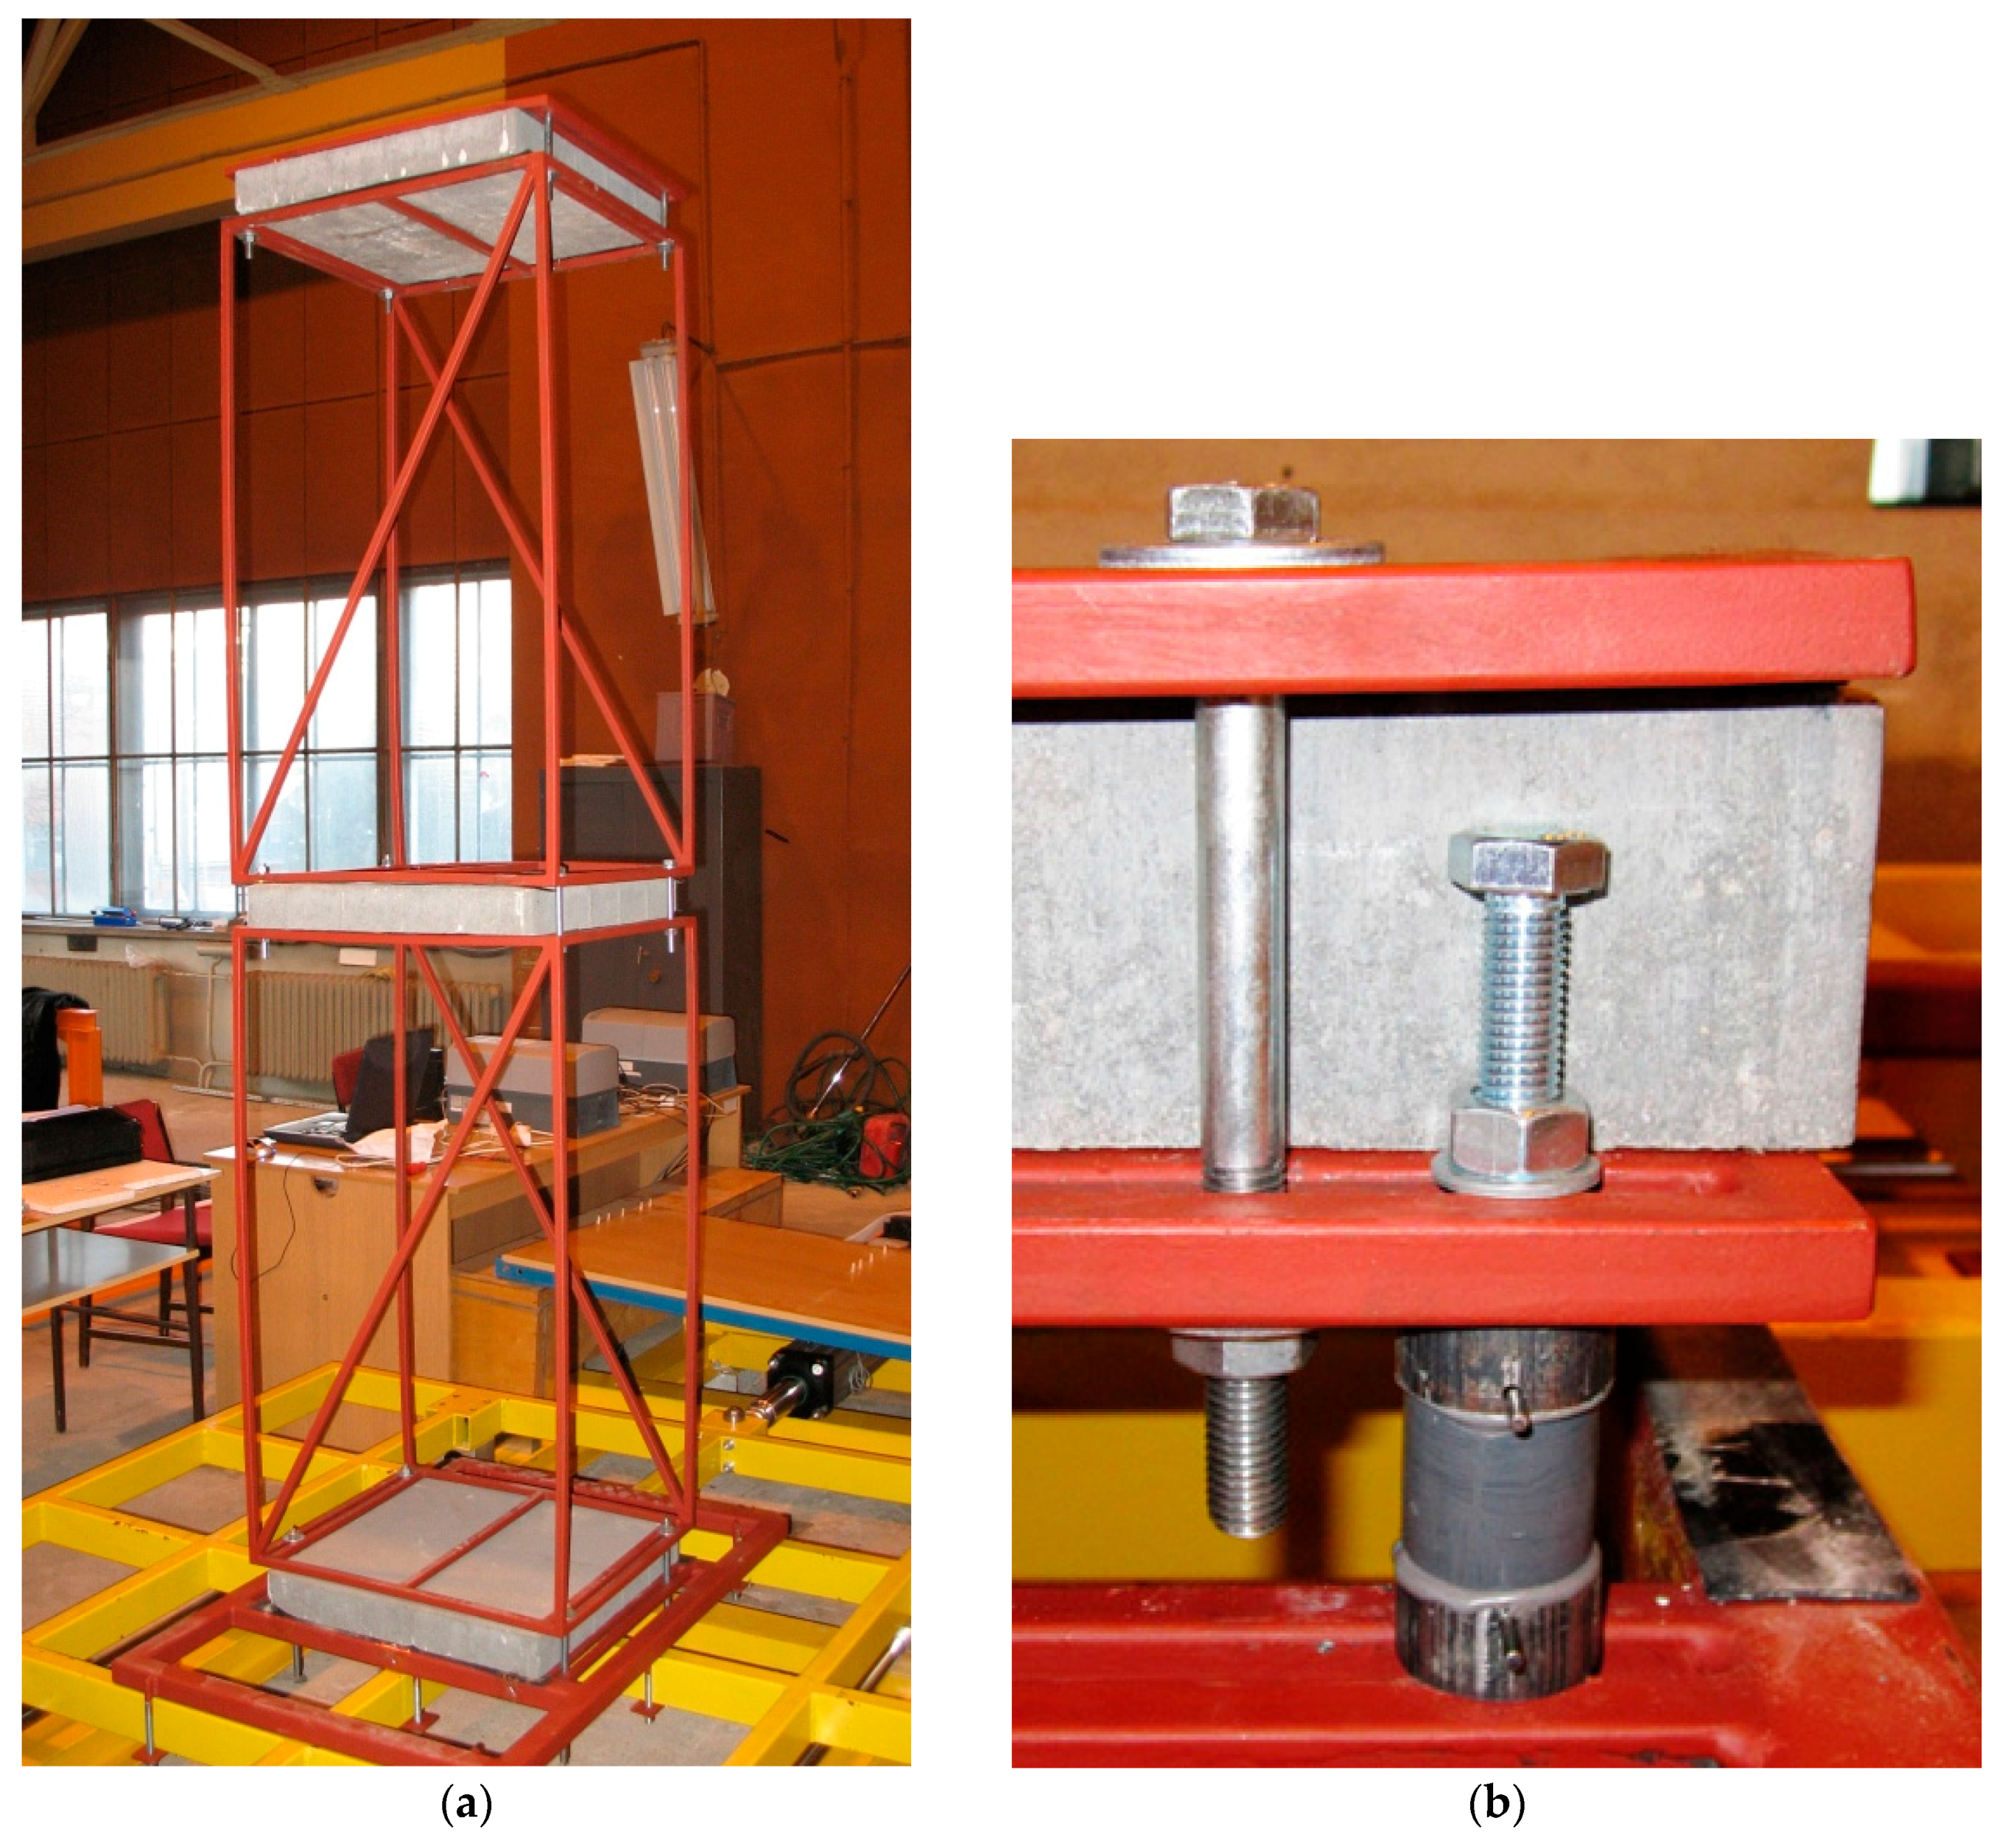
In the final step, an extensive shaking table investigation was conducted. This experimental research program was performed with the use of a middle-sized one-directional shaking table platform, which was employed to simulate the lateral forces and displacements caused by seismic excitations. Dynamic response of two experimental structure models with dynamic characteristics typical for low-rise and medium-rise buildings (i.e., a 1.20 m high single-storey, and a 2.30 m high two-storey structures with fundamental frequencies of 3.34 Hz and 1.94 Hz, respectively), both fixed-base and base-isolated with the use of PBs, to a number of different ground motions and a mining tremor (as an example of so-called induced seismicity) was deeply analyzed. As an example, the 2.30 m high two-storey experimental model mounted on the shaking table platform, together with the close-up view of PB, is presented in
Figure 1. The results of this experimental research explicitly confirmed the effectiveness of seismic isolation system made of PBs in mitigating seismic-induced structural vibrations. Peak lateral accelerations recorded at the top of the tested structures subjected to a number of different ground motions were decreased by approximately 11–39% and 12–57% for the single-storey and two-storey structure models, respectively. Also, it is worth mentioning that a full scale version of the PB to be used for real structures was developed, submitted to the Polish Patent Officeand patented in 2017.
3. Dynamic Oscillatory Test
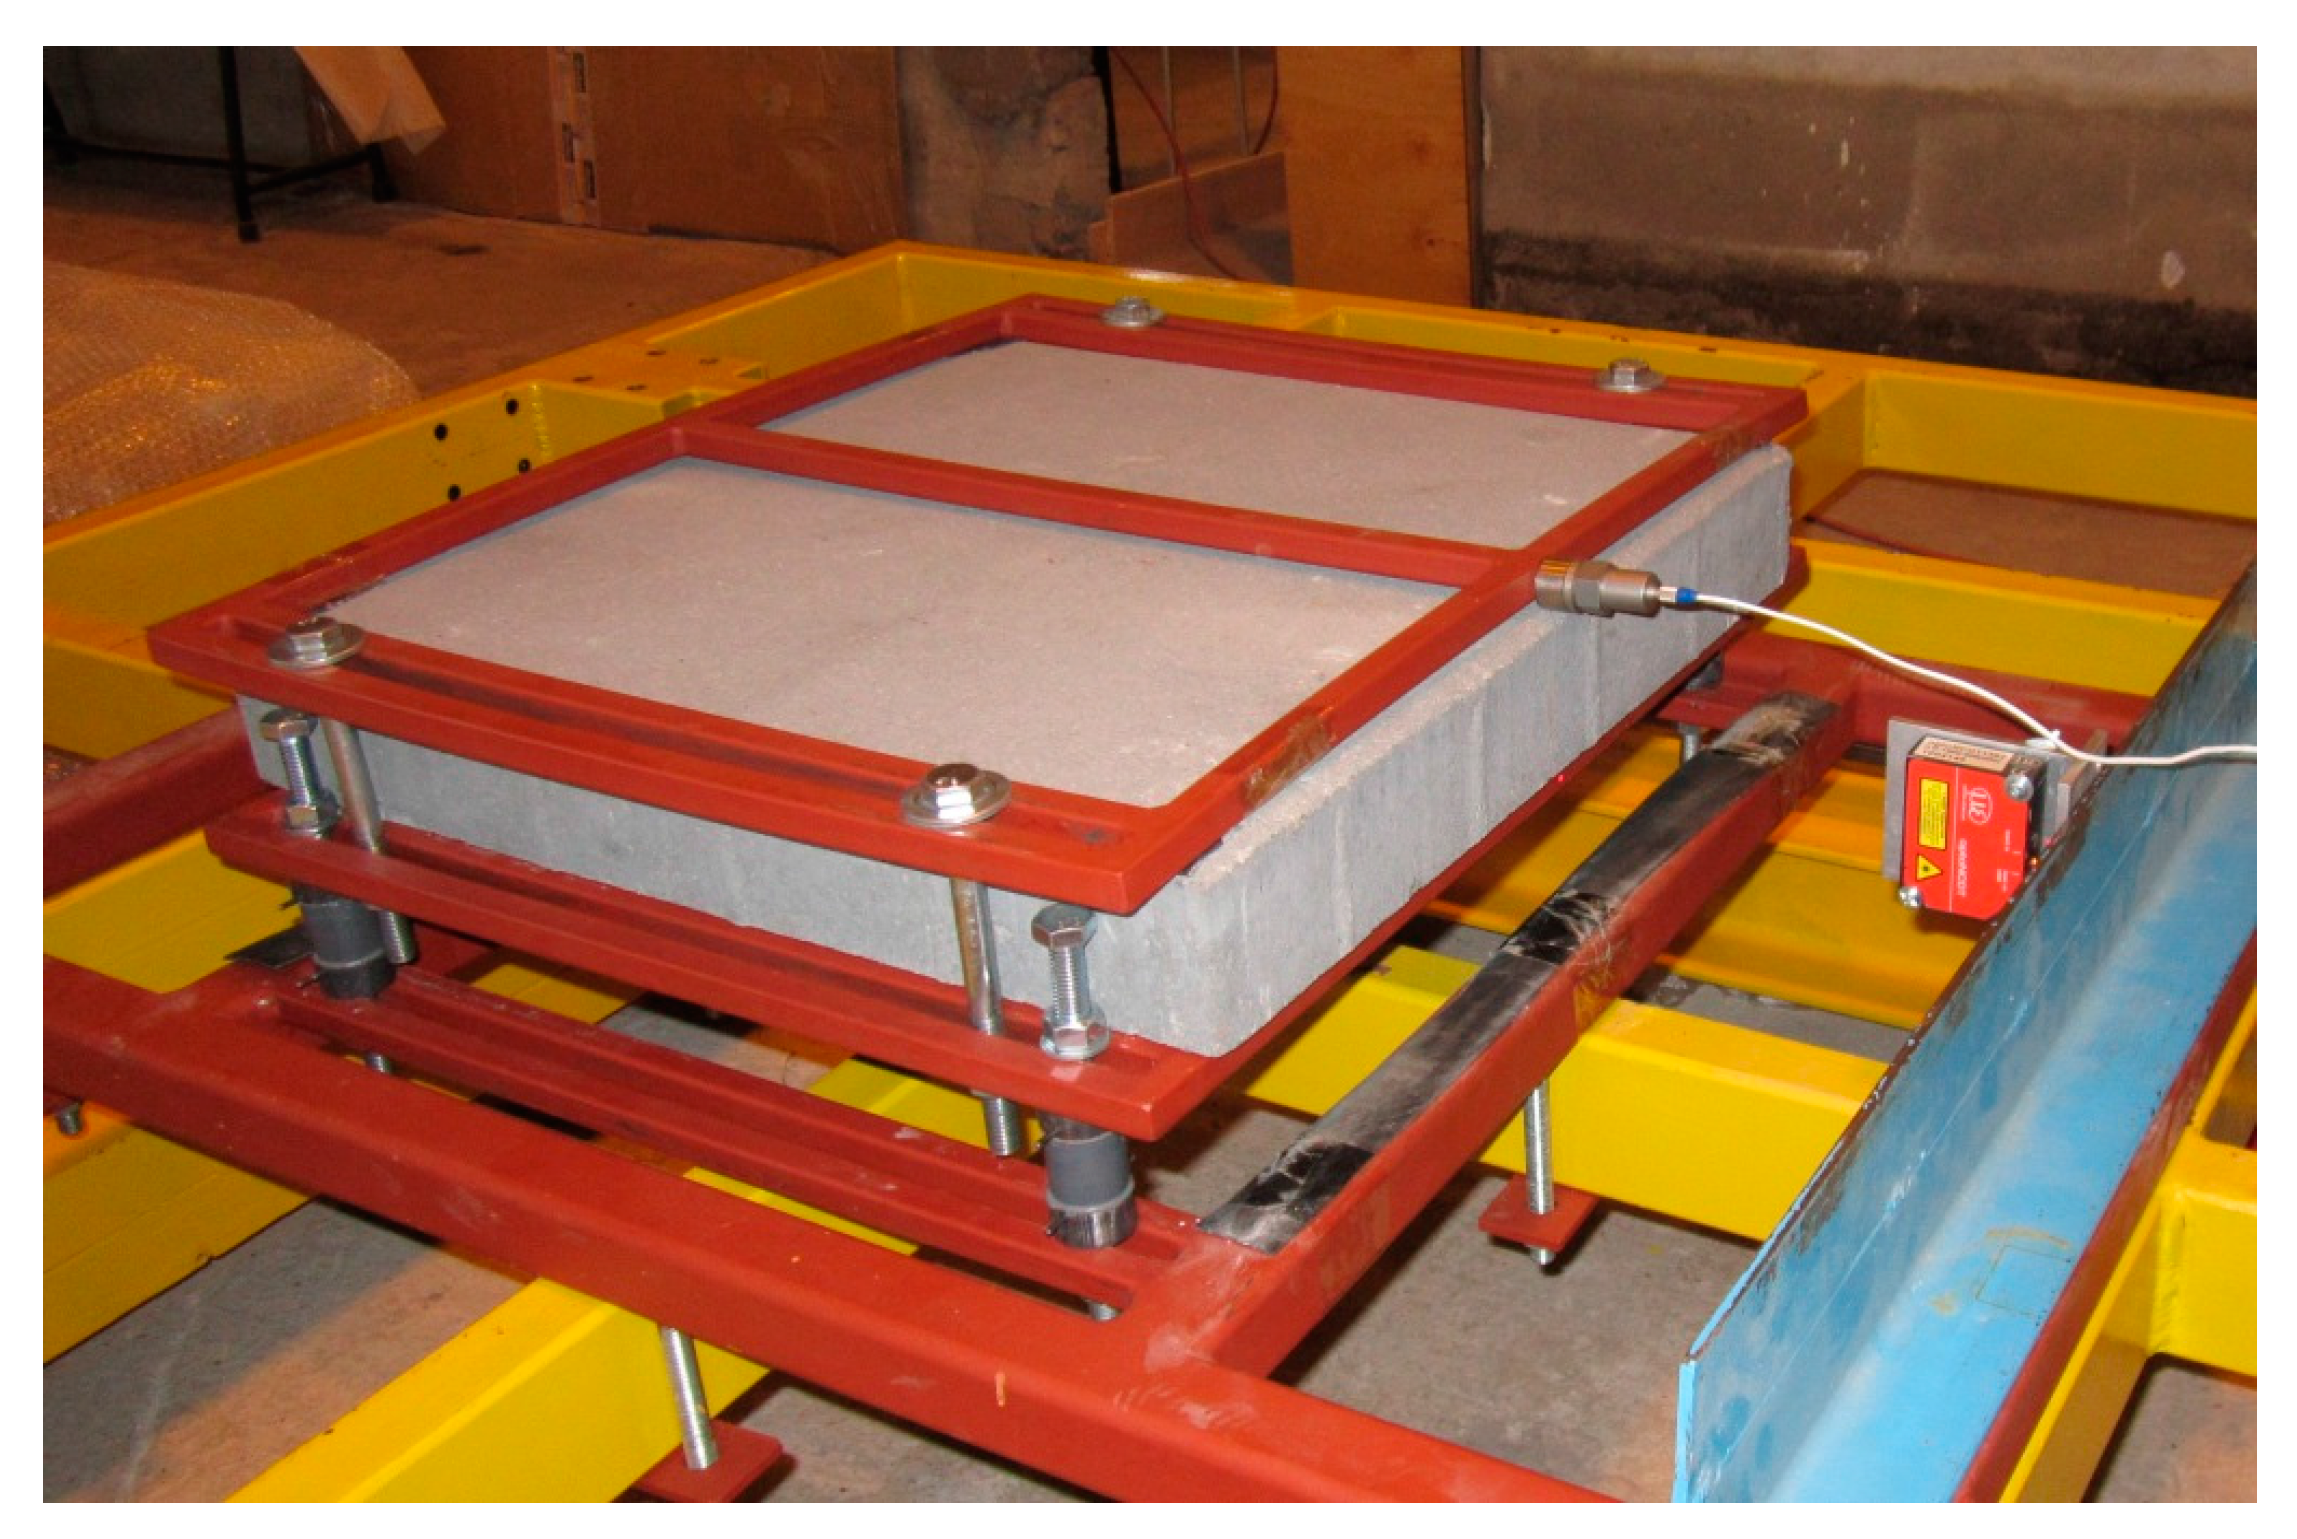
The first step in the present research was to perform dynamic oscillatory tests in order to analyze the load-deformation behaviour of PBs under different horizontal excitation frequencies. In order to obtain hysteresis loops, four PBs supporting a concrete slab (dimensions of the concrete base slab are 50 cm × 50 cm × 7 cm), were mounted on the shaking table platform and subjected to harmonic excitations with gradually increasing amplitudes resulting in different shear strain levels. The experimental testing was carried out at the excitation frequencies of 1 Hz, 2 Hz, and 5 Hz, which correspond to the range of excitation frequencies typical for earthquakes and mining tremors. The response of the system to cyclic horizontal loading was measured using a laser displacement sensor and an uniaxial accelerometer, as indicated by
Figure 2.
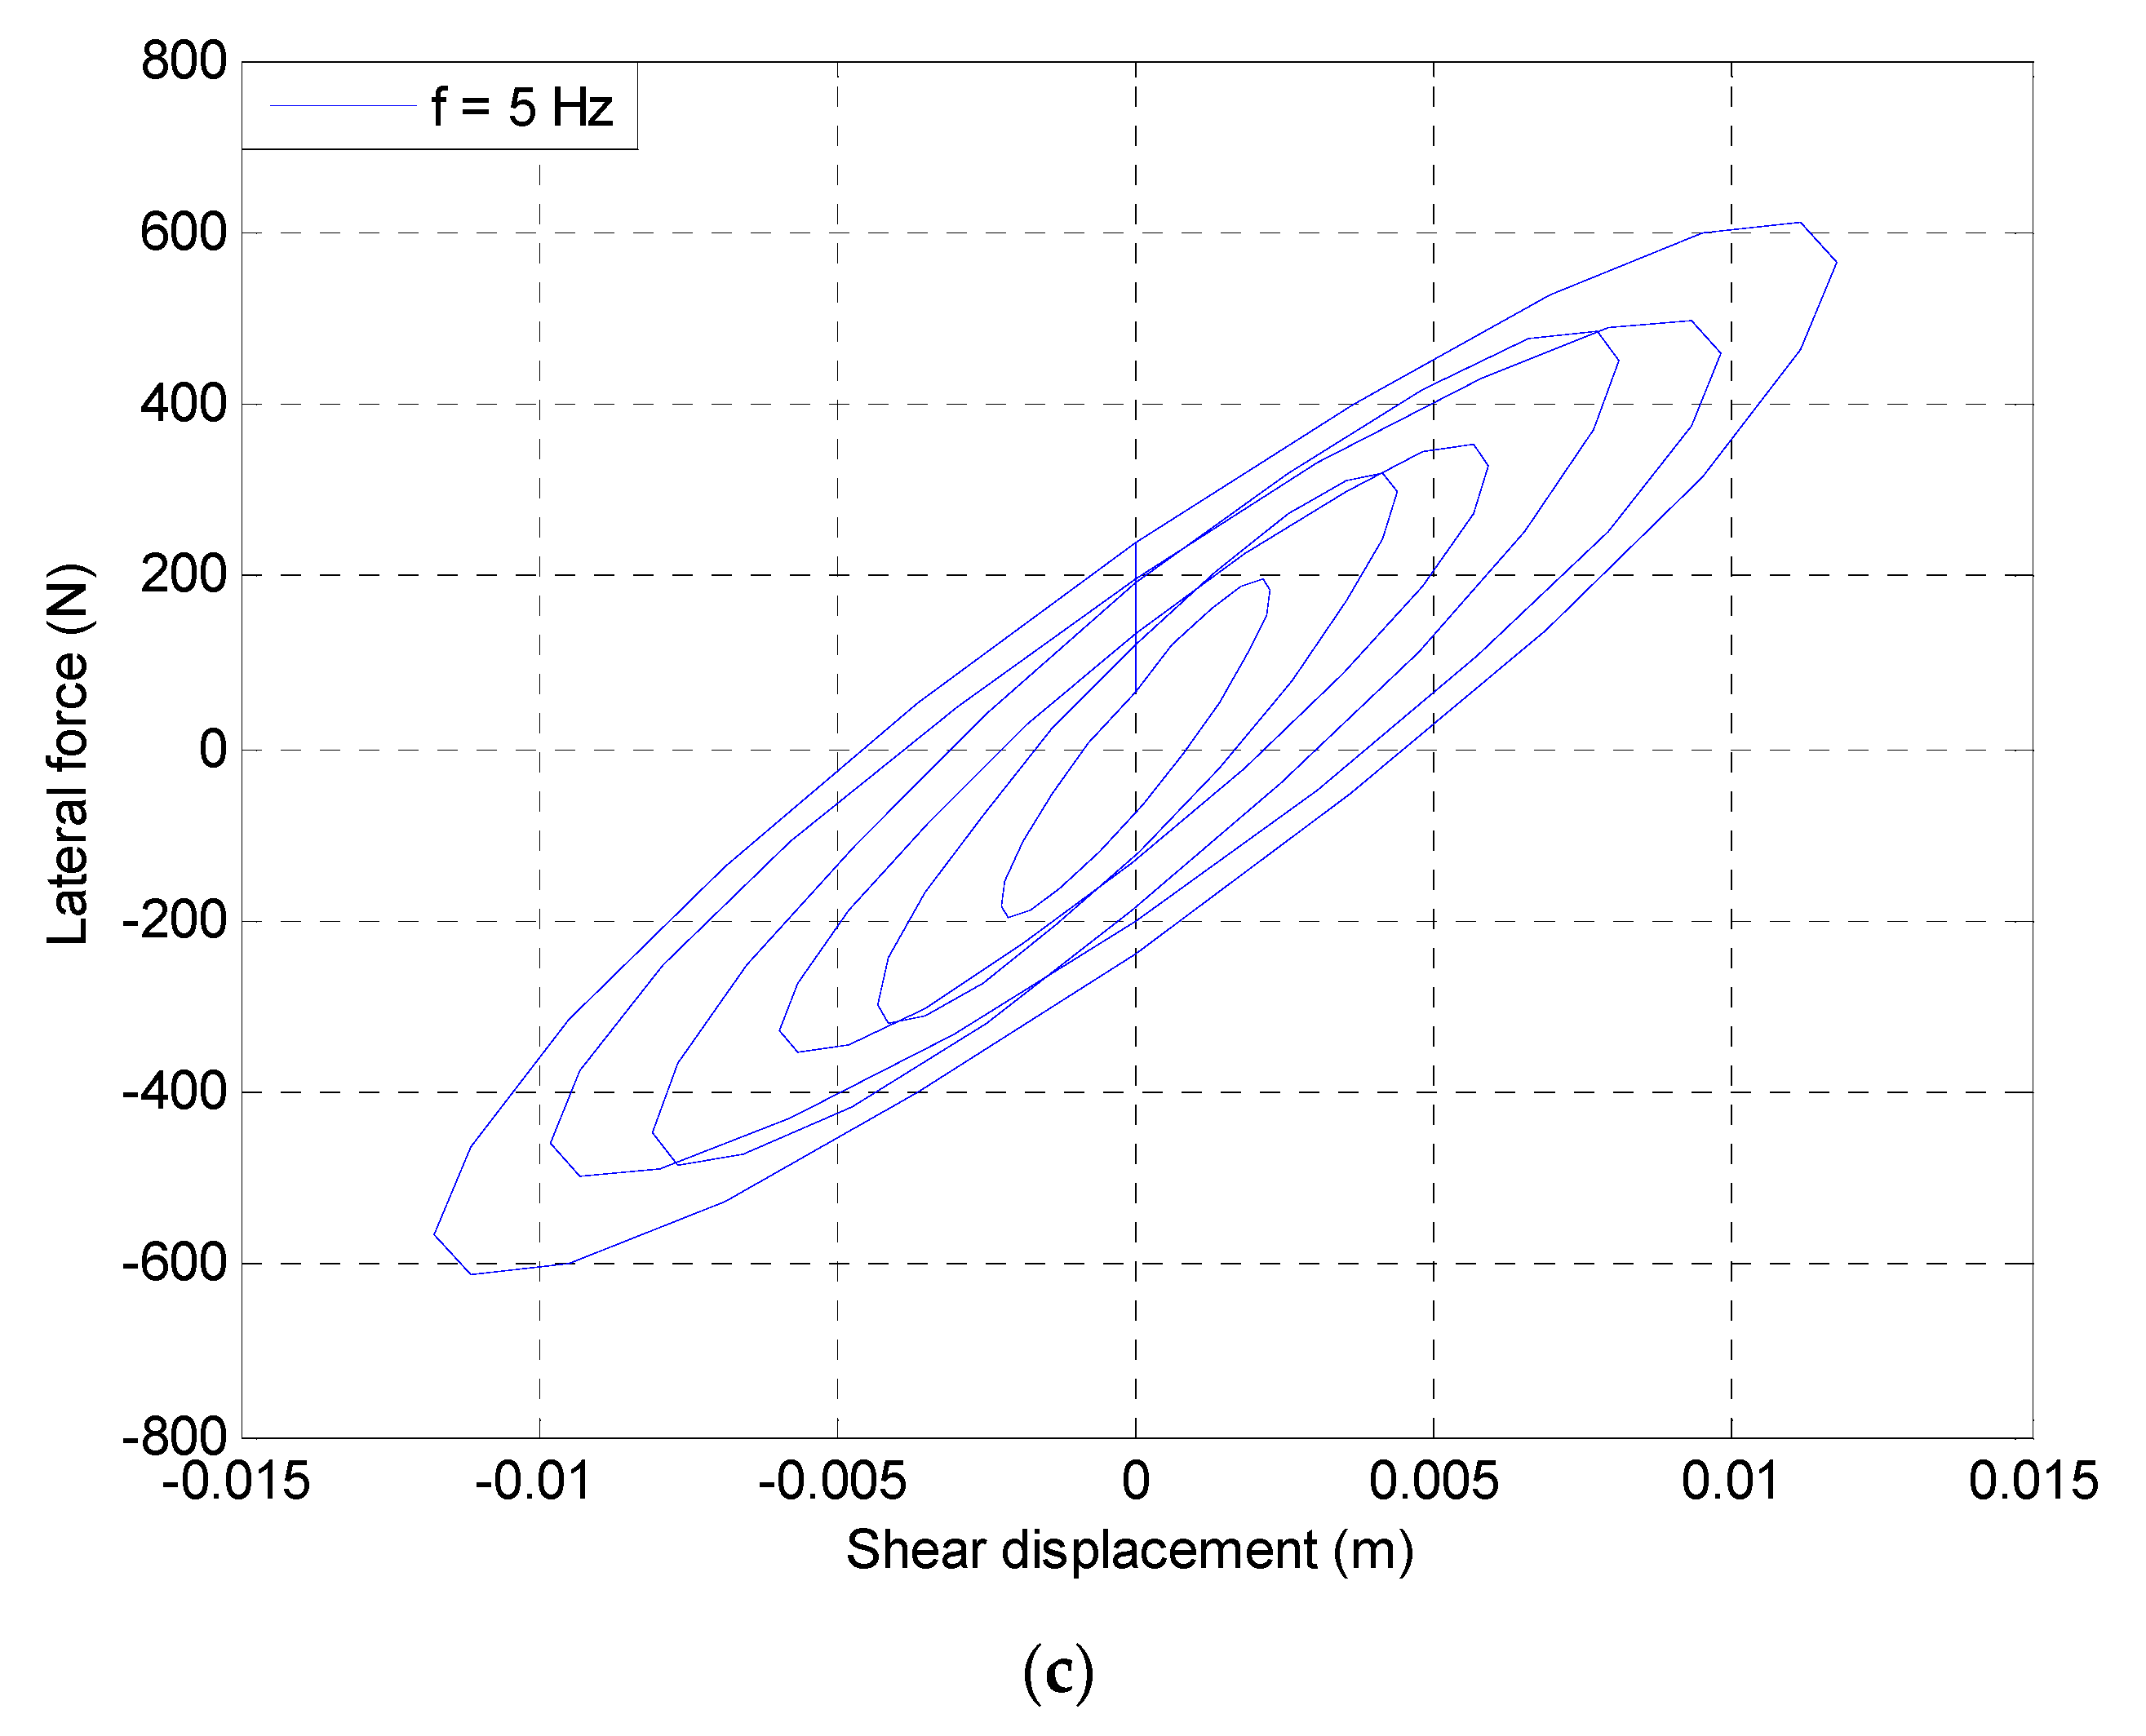
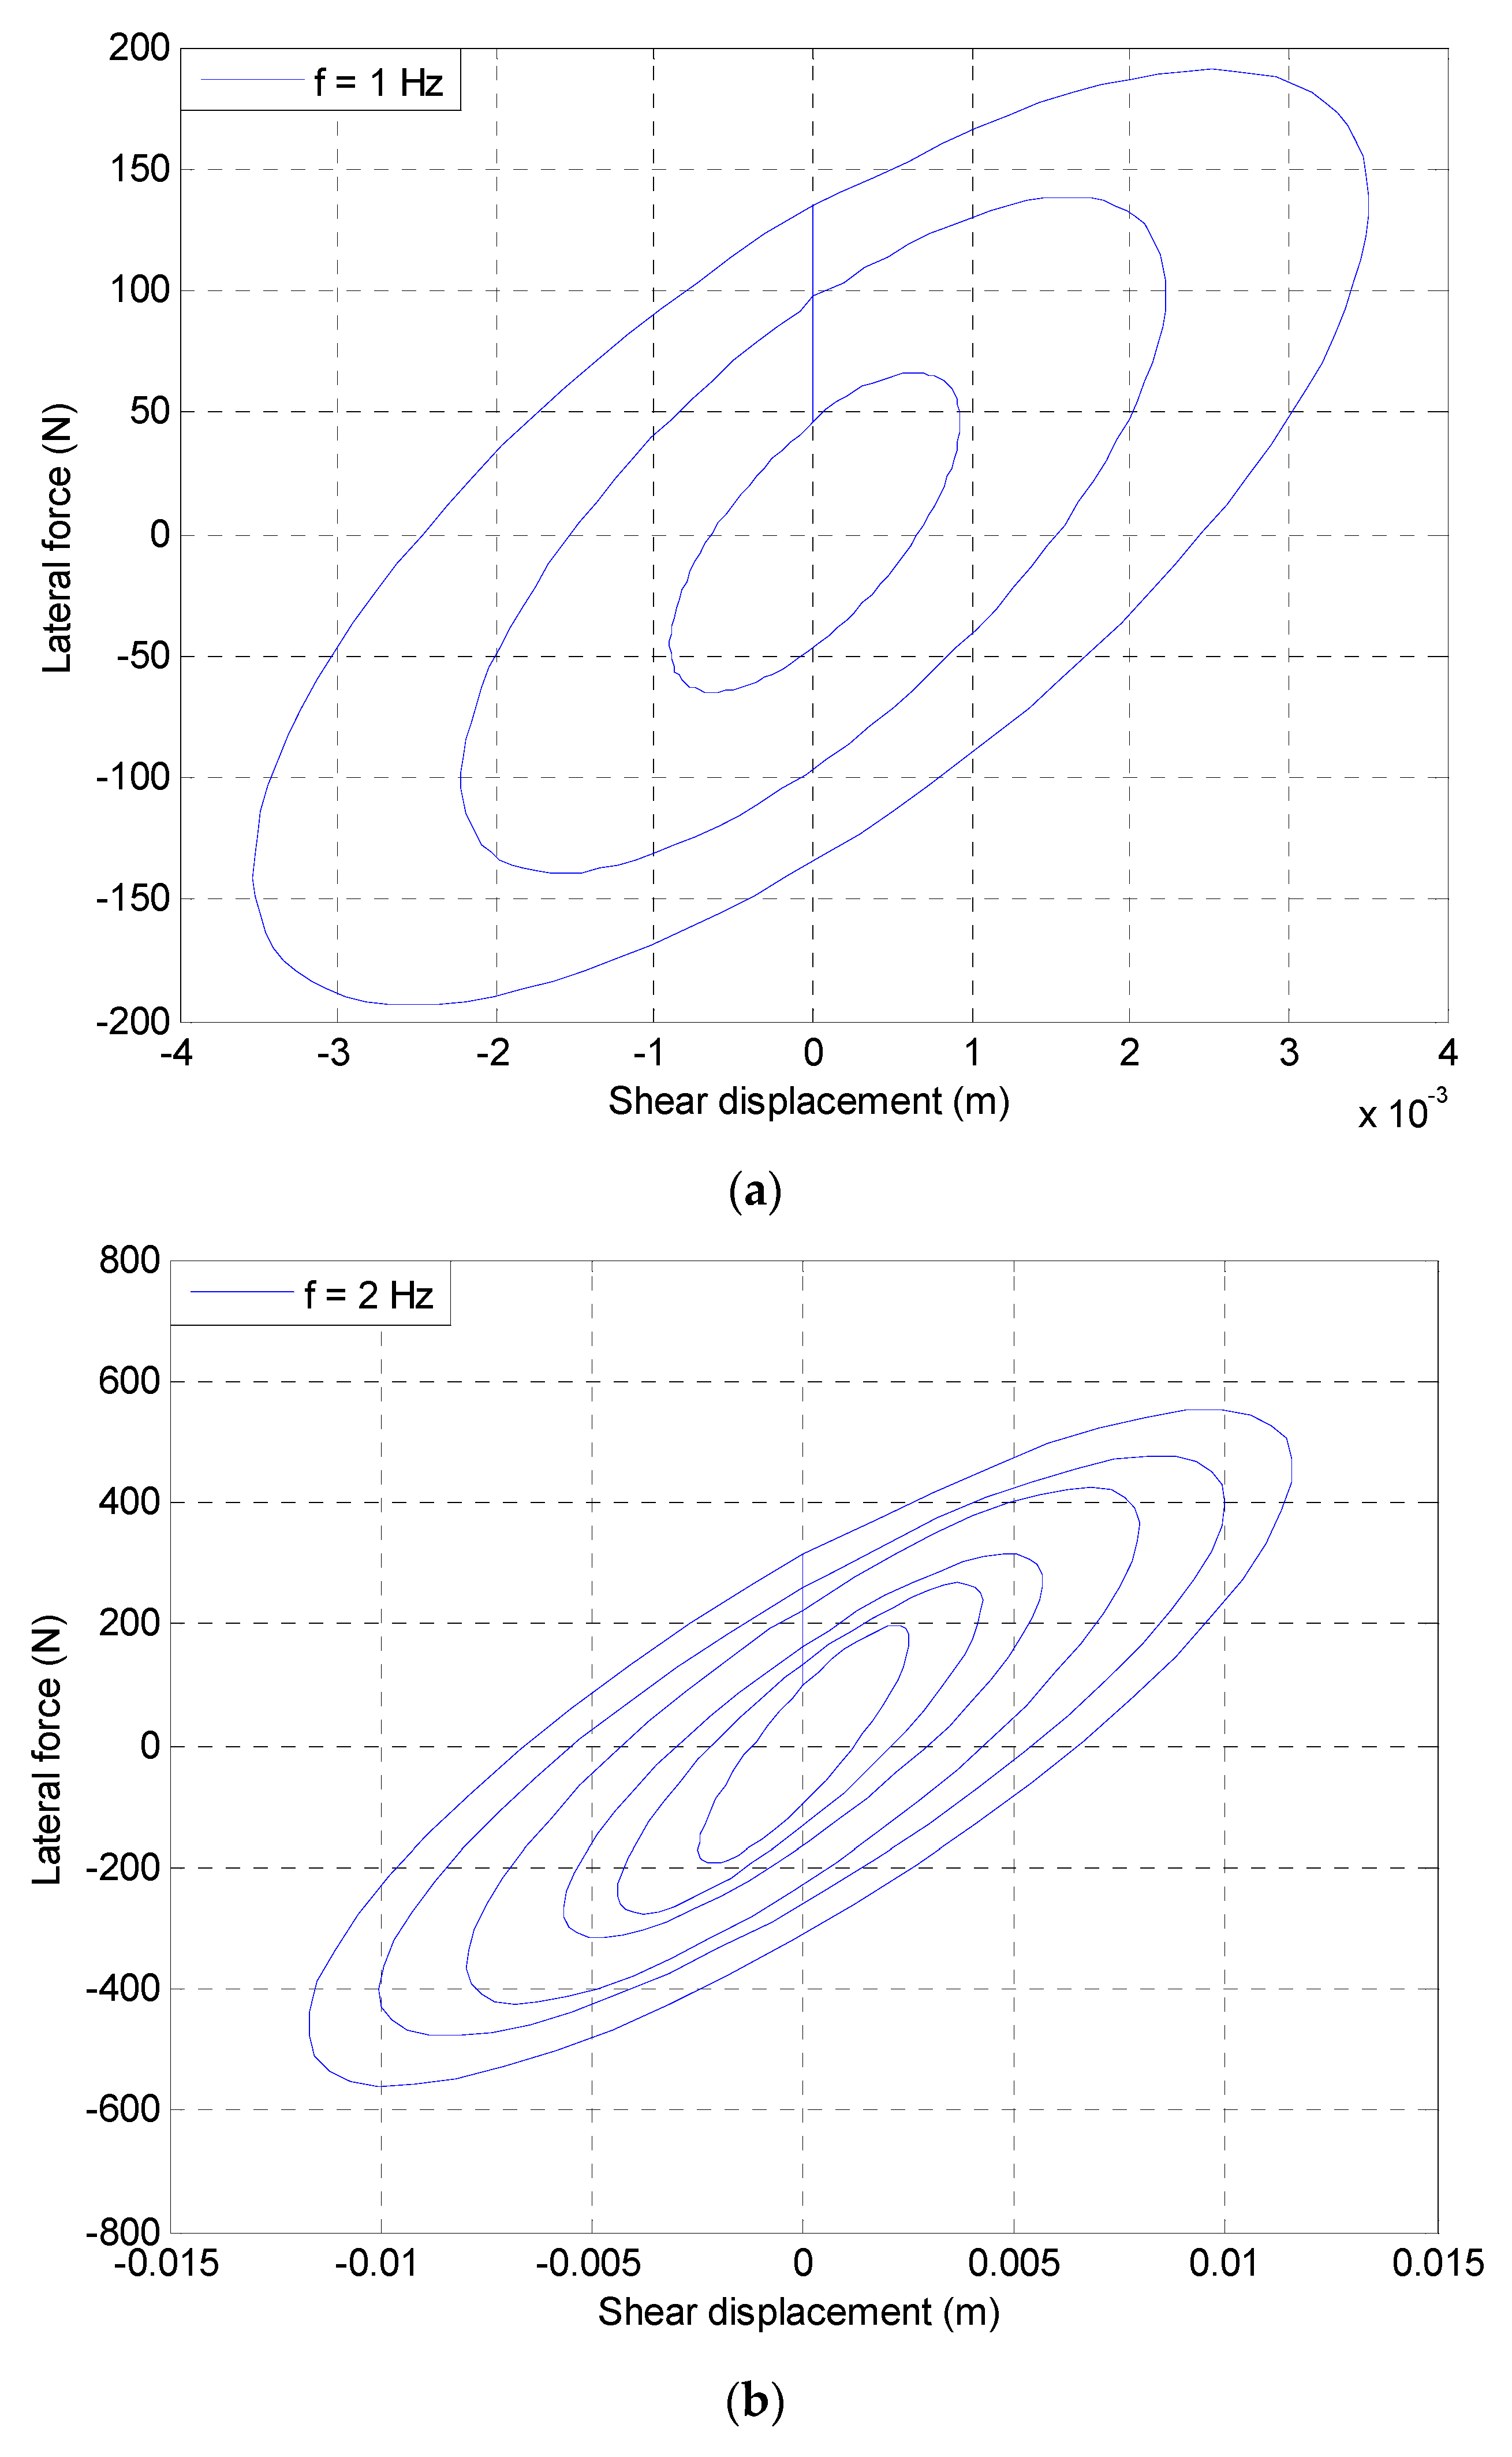
Experimentally obtained hysteresis loops for three different excitation frequencies are presented in
Figure 3 (it should be mentioned that due to technical restrictions of the shaking table, limited number of hysteresis loops at the excitation frequency of 1 Hz could be obtained). Based on the loops, the equivalent damping ratio,
, of the base isolation system was determined using the following formula (see [
26]):
where
is the energy dissipated in one cycle of motion (the area enclosed by the hysteresis loop) and
is a strain energy induced in a seismic isolation bearing given by:
where u is a maximum shear deflection and F(u) is a lateral force recorded at u. Average values of equivalent damping ratios for hysteresis loops, recorded at three excitation frequencies, are briefly summarized in
Table 1.
The results obtained from the dynamic oscillatory tests exhibit pronounced hysteretic behaviour of PBs, which confirms high energy dissipation properties of this base isolation system. Moreover, experimentally obtained hysteresis loops indicate that PBs exhibit higher stiffness at lower shear strain levels. Close inspection of
Figure 3 shows that with increasing shear deflection, the slope of the hysteresis loop decreases. The same effect, which is often referred to as the stiffness degradation, can also be observed for other seismic isolation devises, such as HDRBs [
12]. Additionally, results obtained from this investigation clearly demonstrate that the higher the excitation frequency, the lower the value of equivalent damping ratio,
, as indicated by
Table 1. The cyclic loading tests indicate that the damping ratio provided by PBs is within the range of about 20–49%, while for the most commonly used base isolators (LRBs, HDRBs, FPBs), the damping ratio is approximately 10–20%.
4. Mathematical Model
In order to accurately simulate the complex mechanical behaviour of PBs under lateral dynamic excitations in numerical analysis, an advanced hysteretic model was firstly developed. The general form of this mathematical model is presented in Equations (3)–(5). It defines the lateral force,
, as a nonlinear function of the shear displacement,
, and the deformation velocity,
. In the proposed mathematical approach
, and
represent the stiffness and damping of the PBs, respectively. Function parameter
defines the initial stiffness of PBs, parameter
depicts stiffness degradation for higher strain rates (i.e., deformation velocity), parameters
and
are responsible for broadening and rounding hysteresis loops. Finally, parameter
defines damping properties of PBs. The function parameters
–
can be estimated by curve fitting the general form of the mathematical model to the experimentally obtained hysteresis loops using the least squares optimization method.
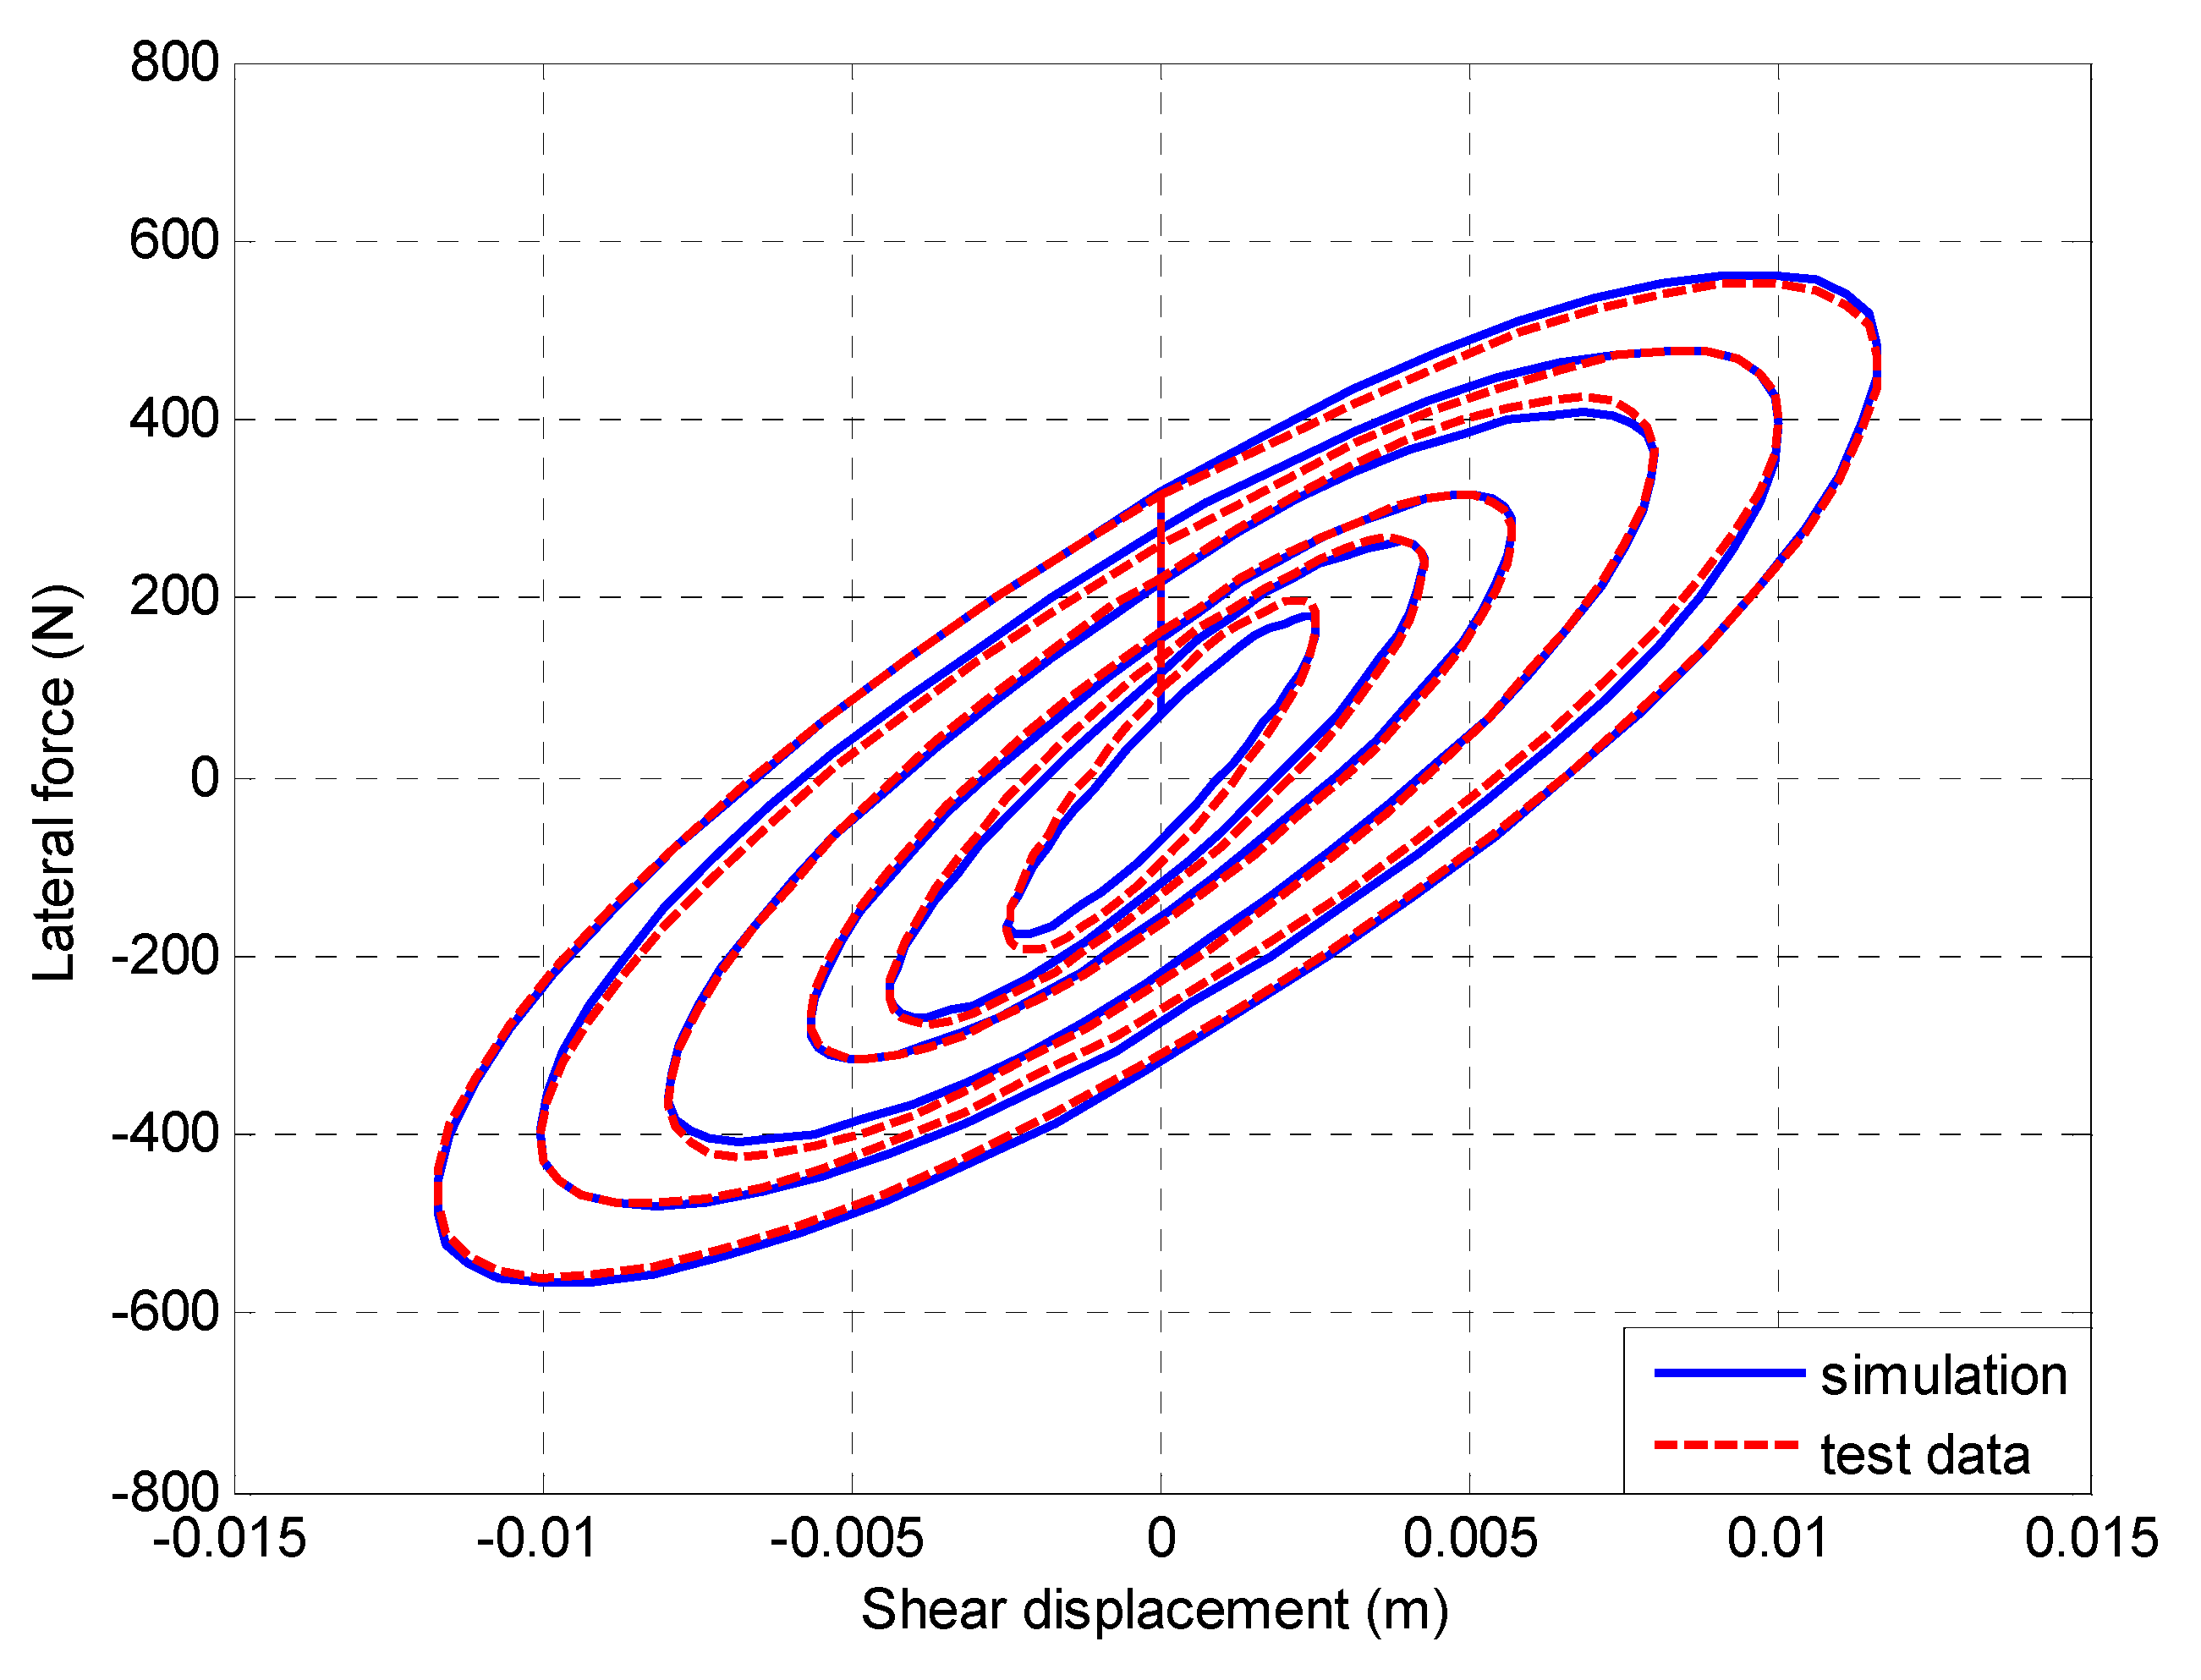
In the present study, the curve fitting procedure was conducted for hysteresis loops with different excitation frequencies and the exemplary results for the frequency of 2 Hz are shown below. The evaluated set of function parameters is summarized in
Table 2. Comparison between experimentally and numerically obtained hysteresis loops is presented in
Figure 4. It should be underlined that the normalized mean square error calculated for the fit is equal to 4.44%.
5. Numerical Analysis
The final stage of the current investigation was focused on implementation the proposed mathematical model of PBs into detailed lumped-parameter numerical analysis (see, for example, [
29]). Therefore, in order to verify the effectiveness of the proposed hysteretic model, the dynamic response of a single-storey and two-storey structure models, both fixed-base and base-isolated with PBs, to a number of ground motions was evaluated and compared to the previously obtained experimental data. The fixed-base and base-isolated single-storey structure models were idealized as a single-degree-of-freedom (1-DOF), and two-degree-of-freedom (2-DOF) systems, respectively. Consequently, the fixed-base and base-isolated two-storey structures were modelled as a two-degree-of-freedom (2-DOF), and three-degree-of-freedom (3-DOF) systems, respectively. Two numerical models, each with and without base-isolation system, were subjected to the El Centro earthquake of 1940, the San Fernando earthquake of 1971, the Loma Prieta earthquake of 1989, the Northridge earthquake of 1994, and finally the Polkowice (Poland) tremor of 2002 as an example of mining-induced seismicity, which is also a major concern of professional and research communities (see, for example, [
30,
31]). For numerical evaluation of differential equation of motion, the unconditionally stable Newmark’s average acceleration method was applied [
29], as it is the most frequently adopted integration procedure is seismic analysis of structures.
5.1. Single-Storey Structure Model
In order to evaluate dynamic response of the fixed-based single-storey model in numerical analysis, the structure was idealized as 1-DOF system, for which the differential equation of motion is given in Equation (6). This simple numerical model is characterized by three parameters: lumped mass
lumped at the roof level (i.e., first storey level), lateral stiffness
, and viscous damping c
1. The exact values of these parameters, which are also given in Equations (7)–(9), were already determined during the previously conducted shaking table investigation (see [
28] for details):
Employing parameters determined in the previous study ([
28]), i.e., dominant frequency of the fixed-base single-storey structure,
, equal to 3.34 Hz (and, consequently, angular frequency,
, equal to 20.98 rad
−1 according to Equation (7)), lumped-mass concentrated at the top level,
, equal to 46.76 kg, and damping ratio,
, equal to 0.5%, into the Equations (8) and (9), stiffness and damping was obtained as
and
, respectively.
The single-storey structure model mounted on the foundation base plate supported with PBs (as shown in
Figure 2) was considered as 2-DOF system, for which the differential equation of motion can be presented in a general matrix form given in Equation (10).
In this formula,
,
, and
denote mass, damping, and stiffness matrices, respectively,
,
,
are the acceleration, velocity and displacement vectors, respectively, and
stands for the acceleration input ground motion. Additional matrix
is the influence coefficient matrix, having 1 for elements corresponding to degrees of freedom in the direction of the applied ground motion and 0 for other degrees of freedom. The structure was mounted on a base plate of mass
which is supported on a base isolation system made of PBs characterized by lateral stiffness
, and viscous damping
, as defined in Equations (4) and (5). Accordingly, for the base-isolated single-storey model idealized as 2-DOF system, matrices
,
,
,
,
,
and
are defined in Equations (11)–(15).
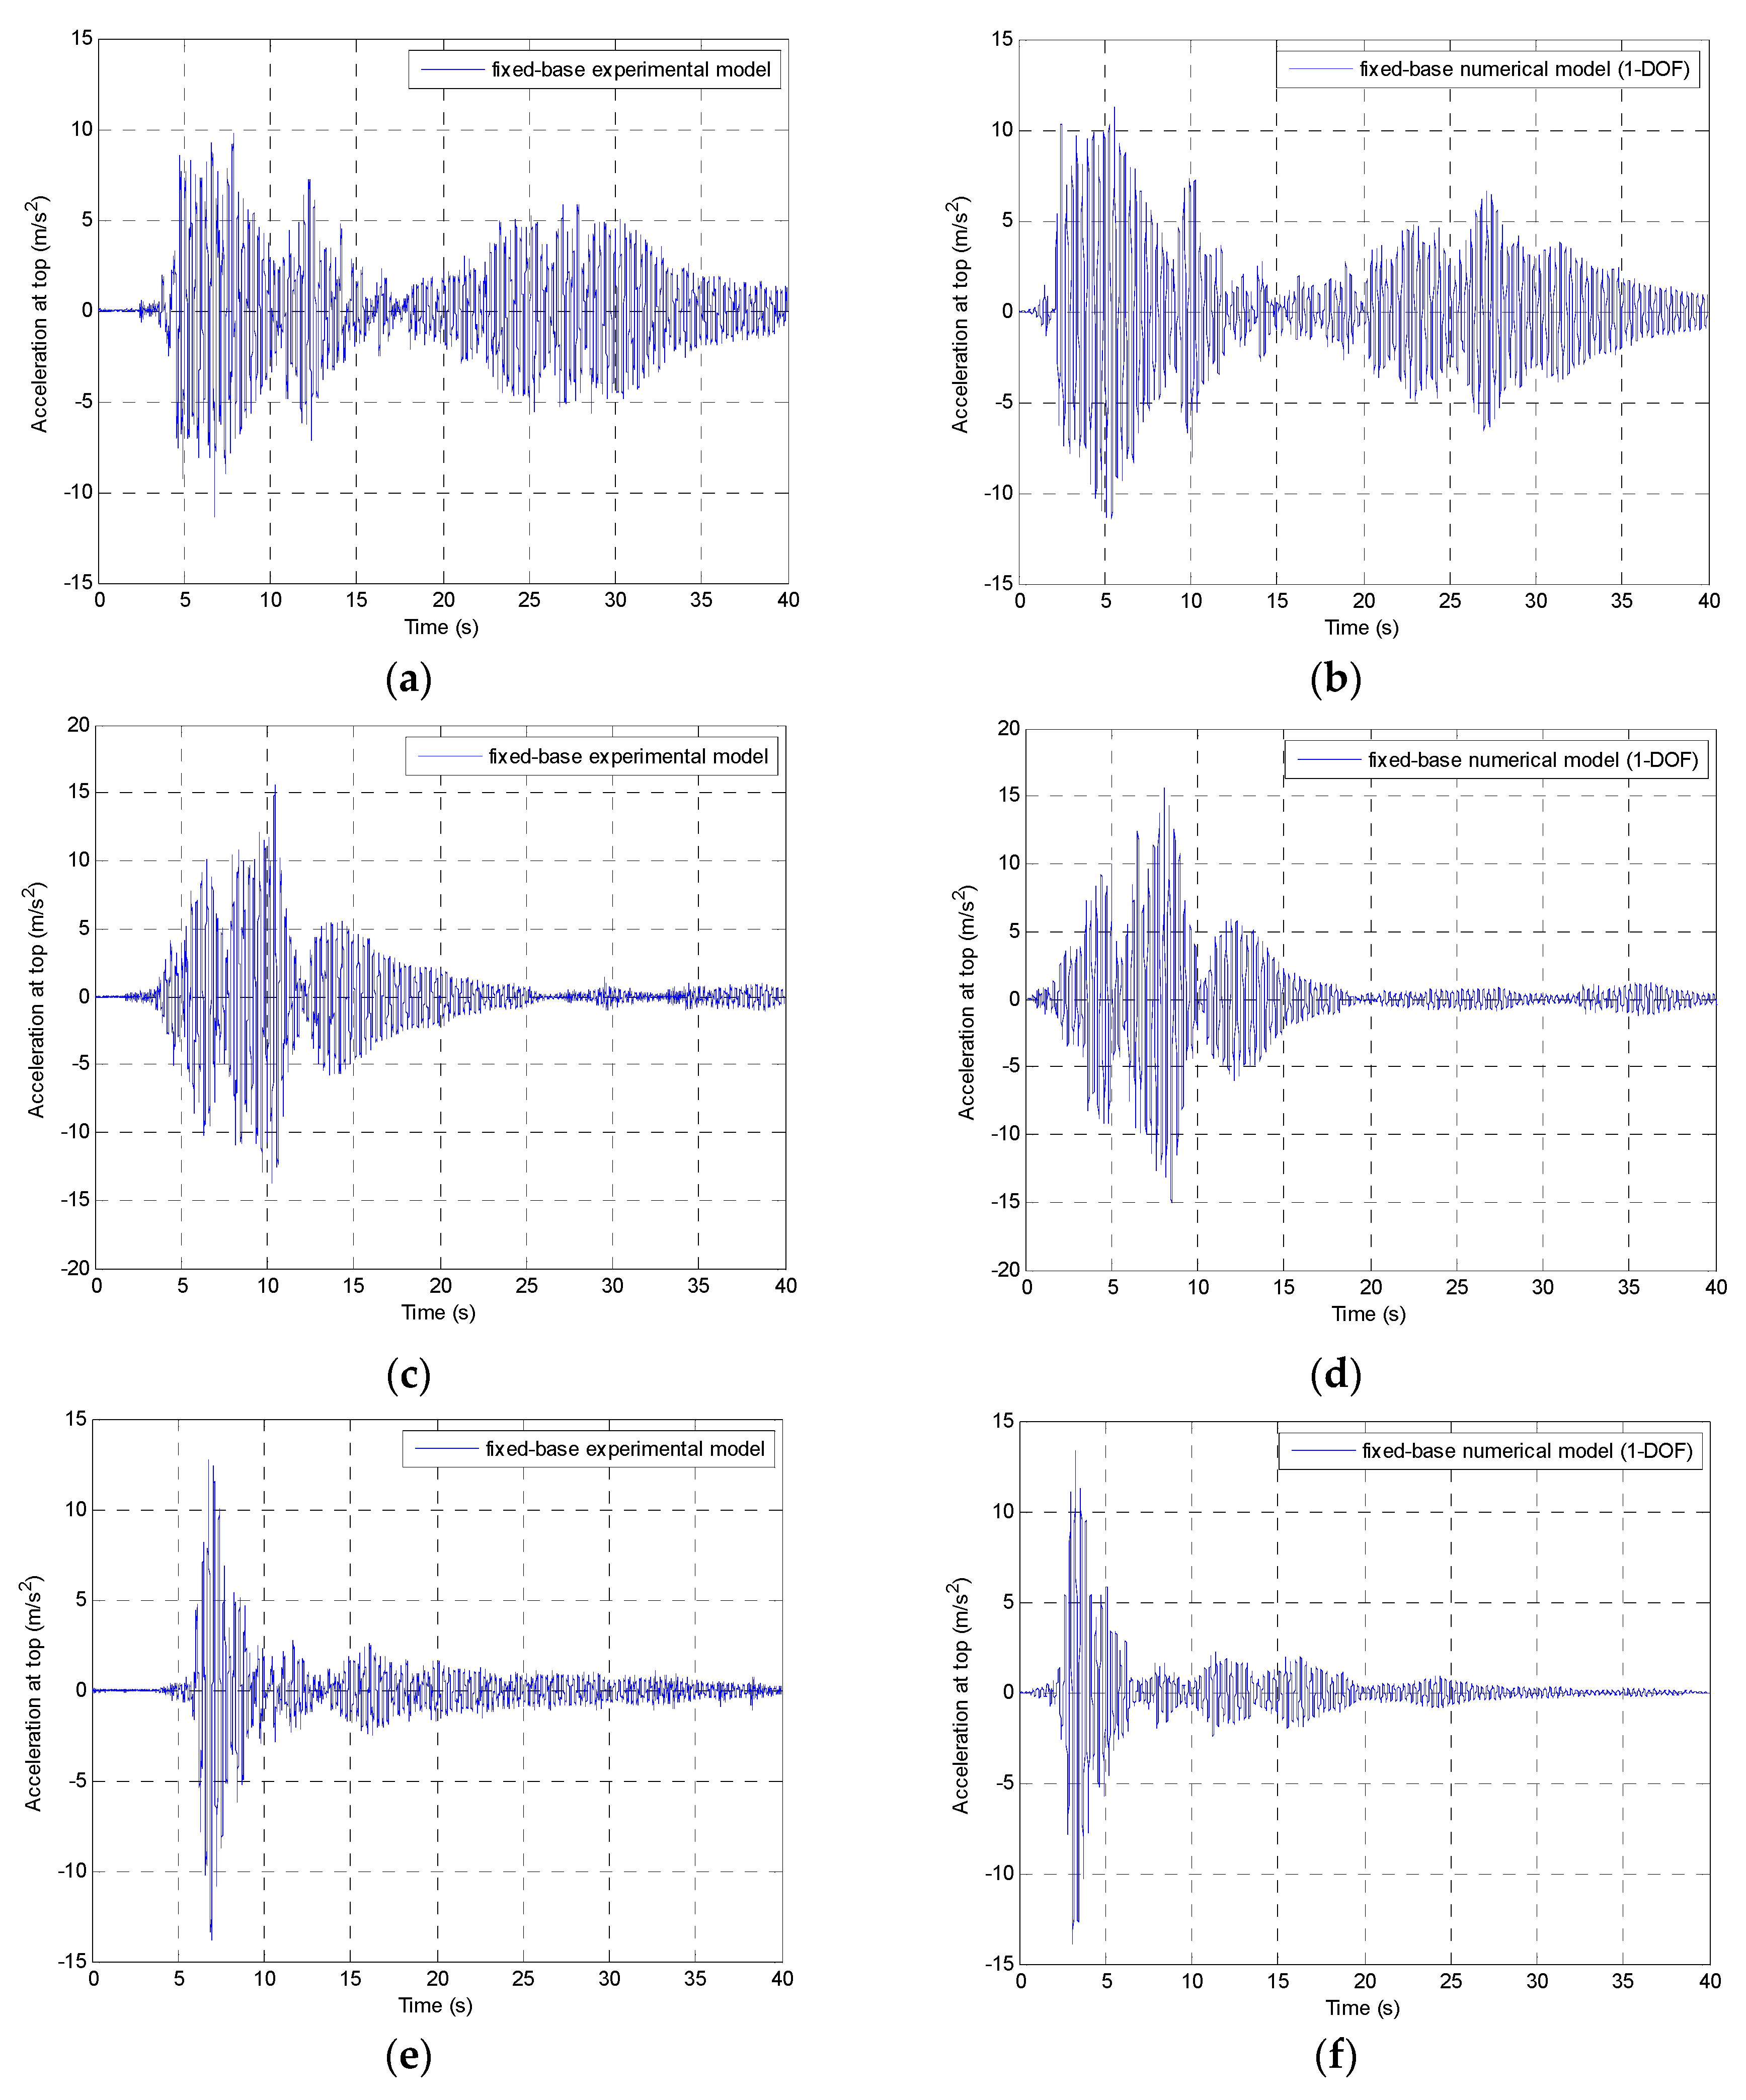
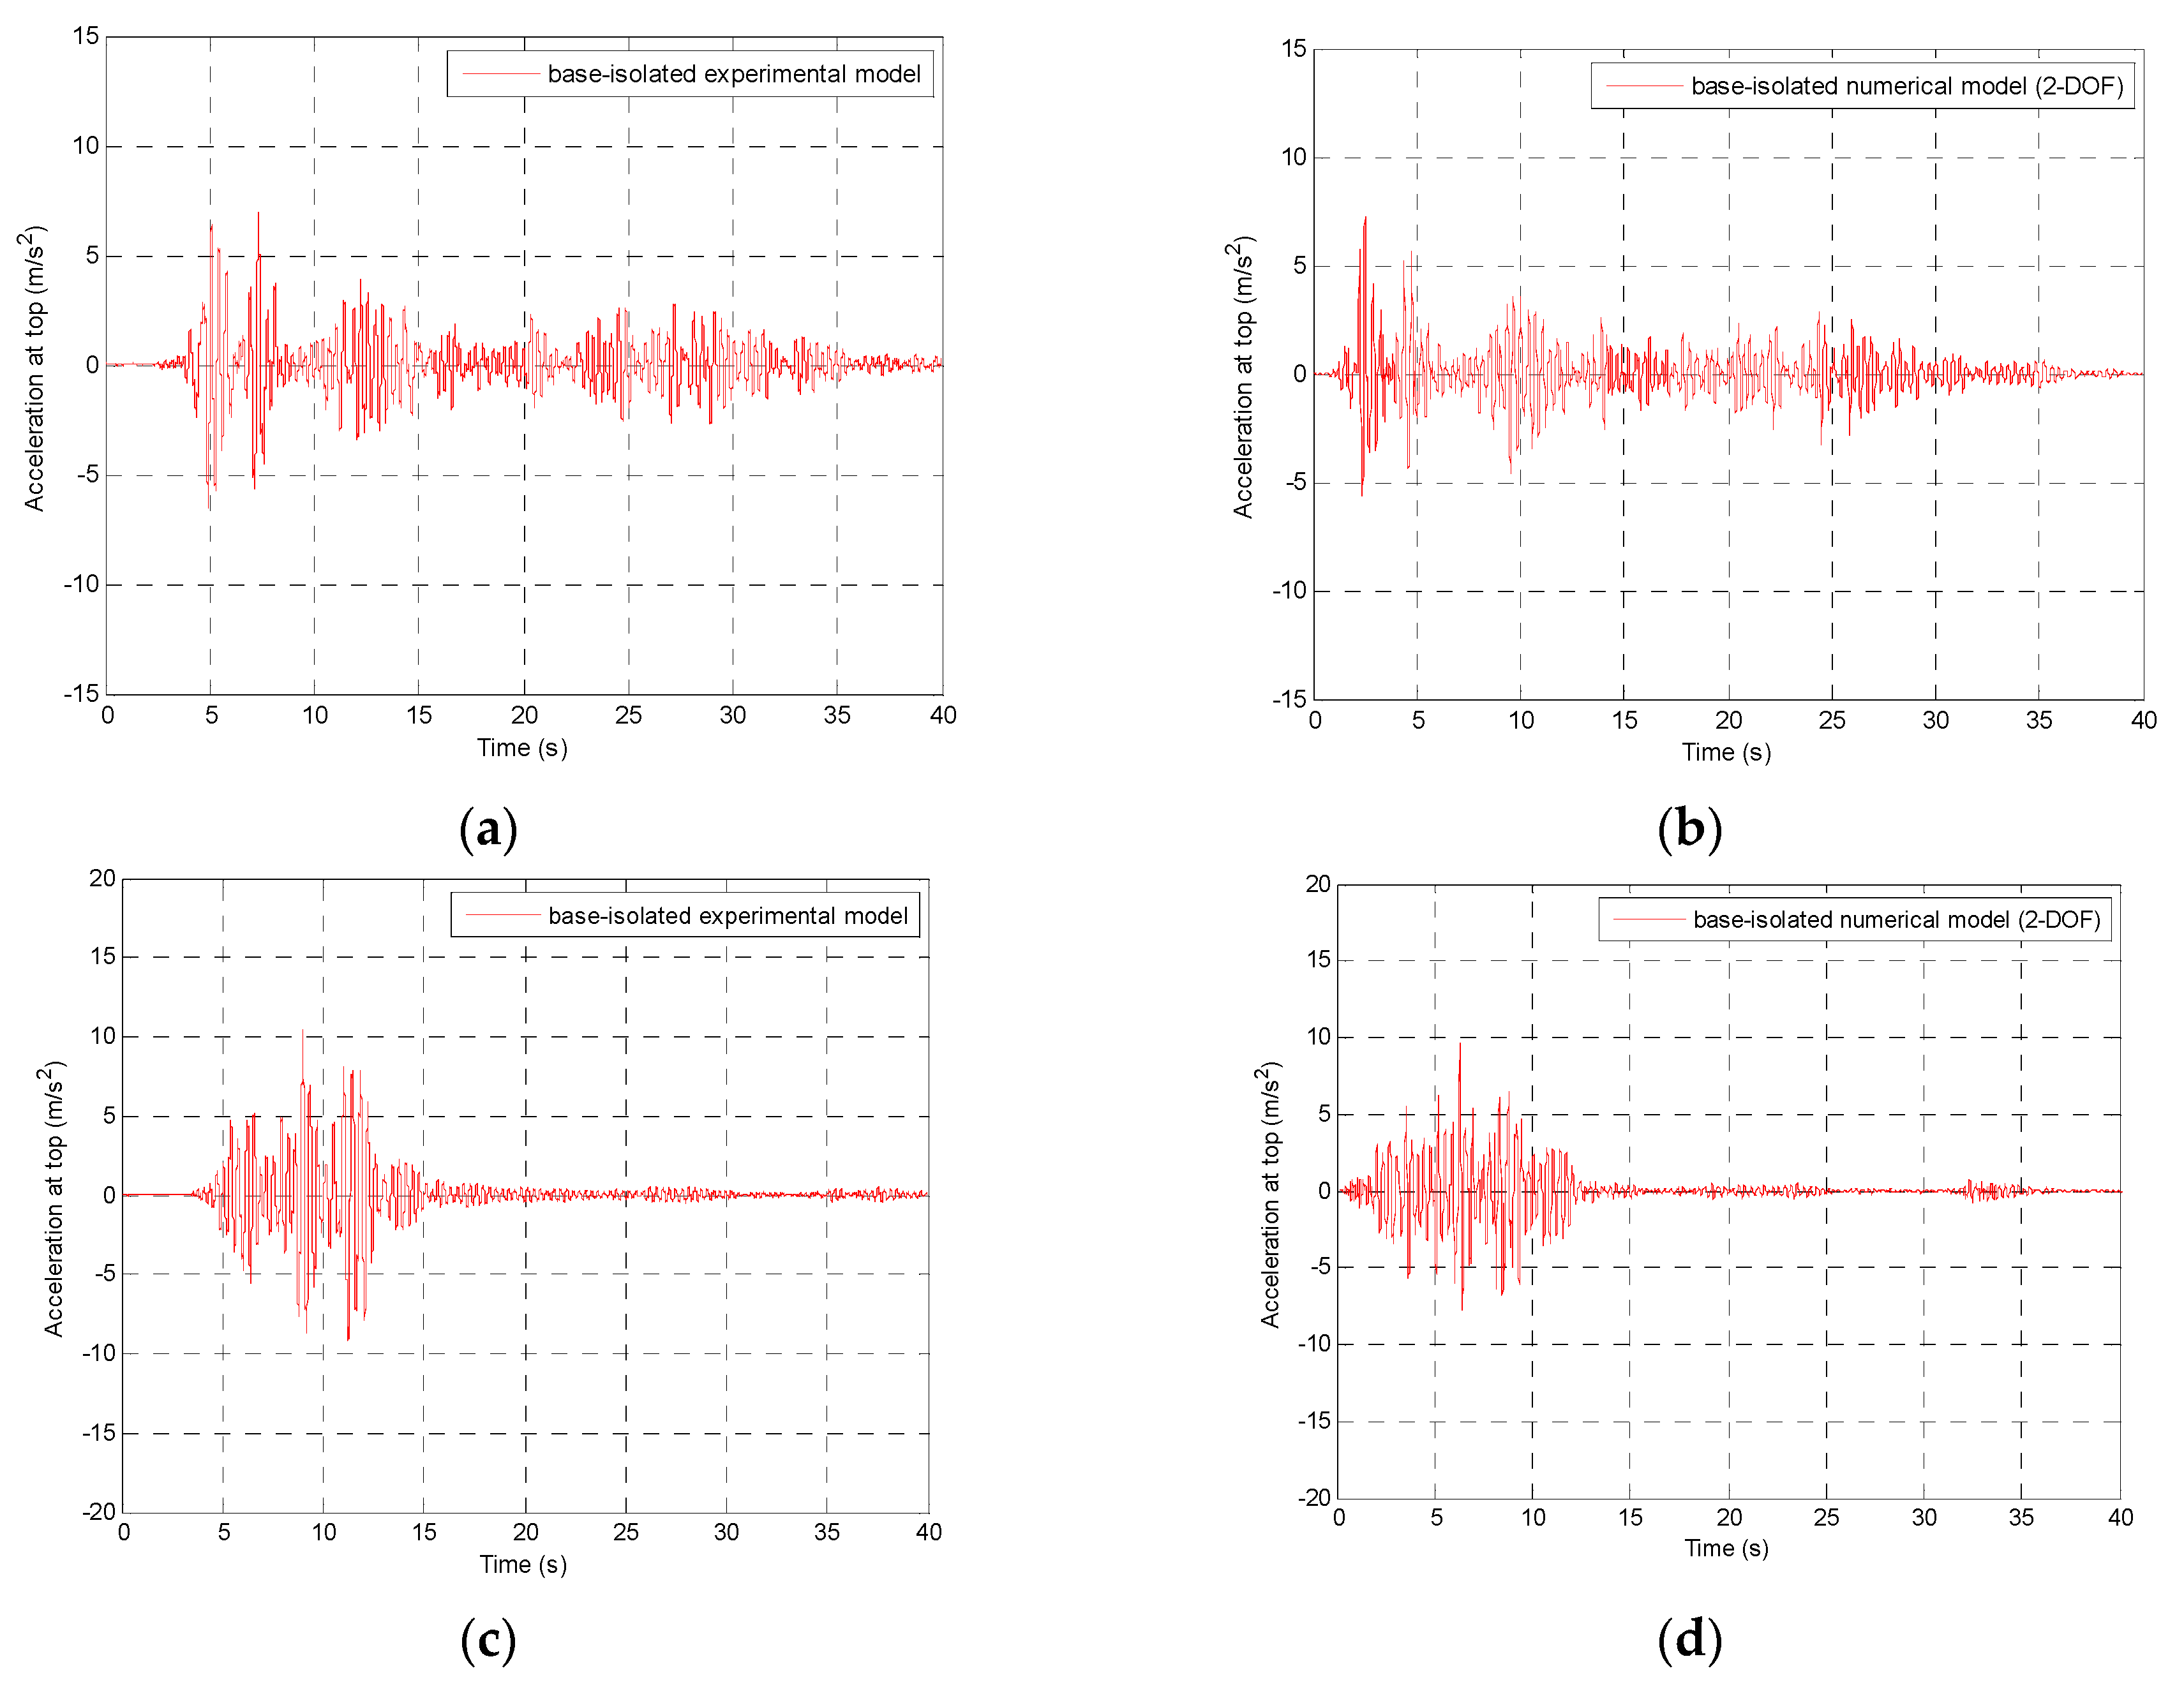
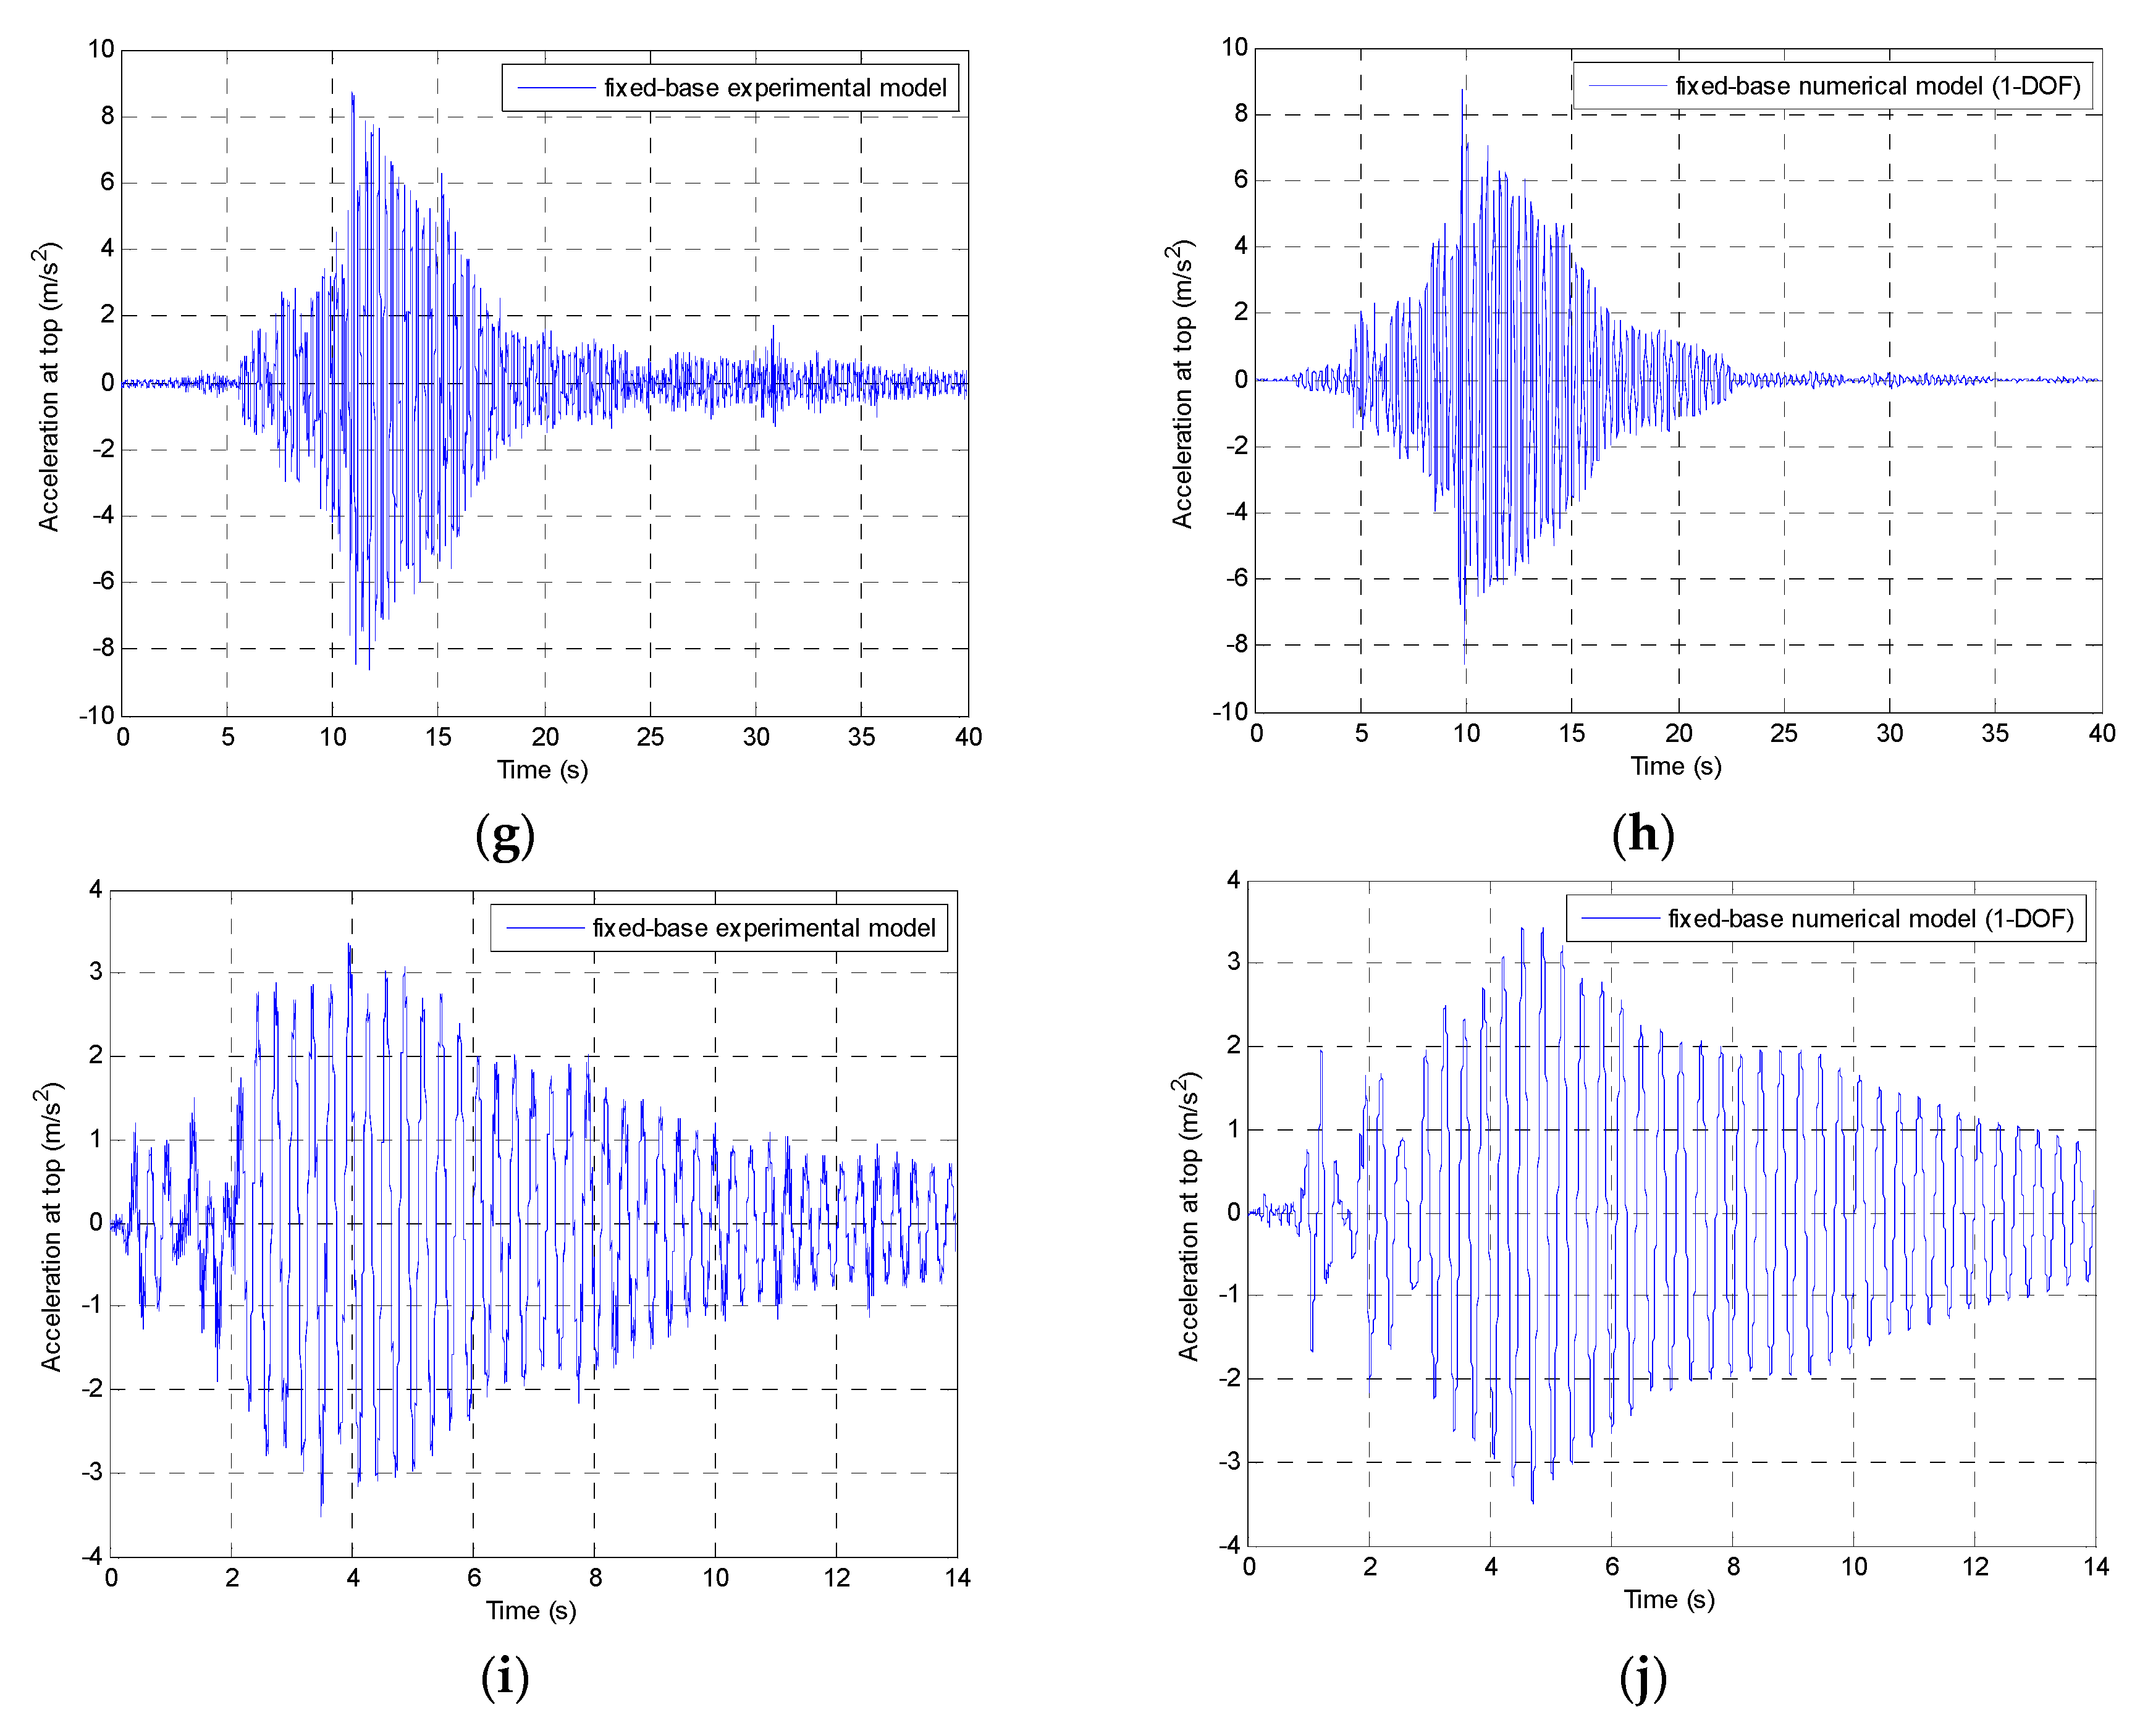
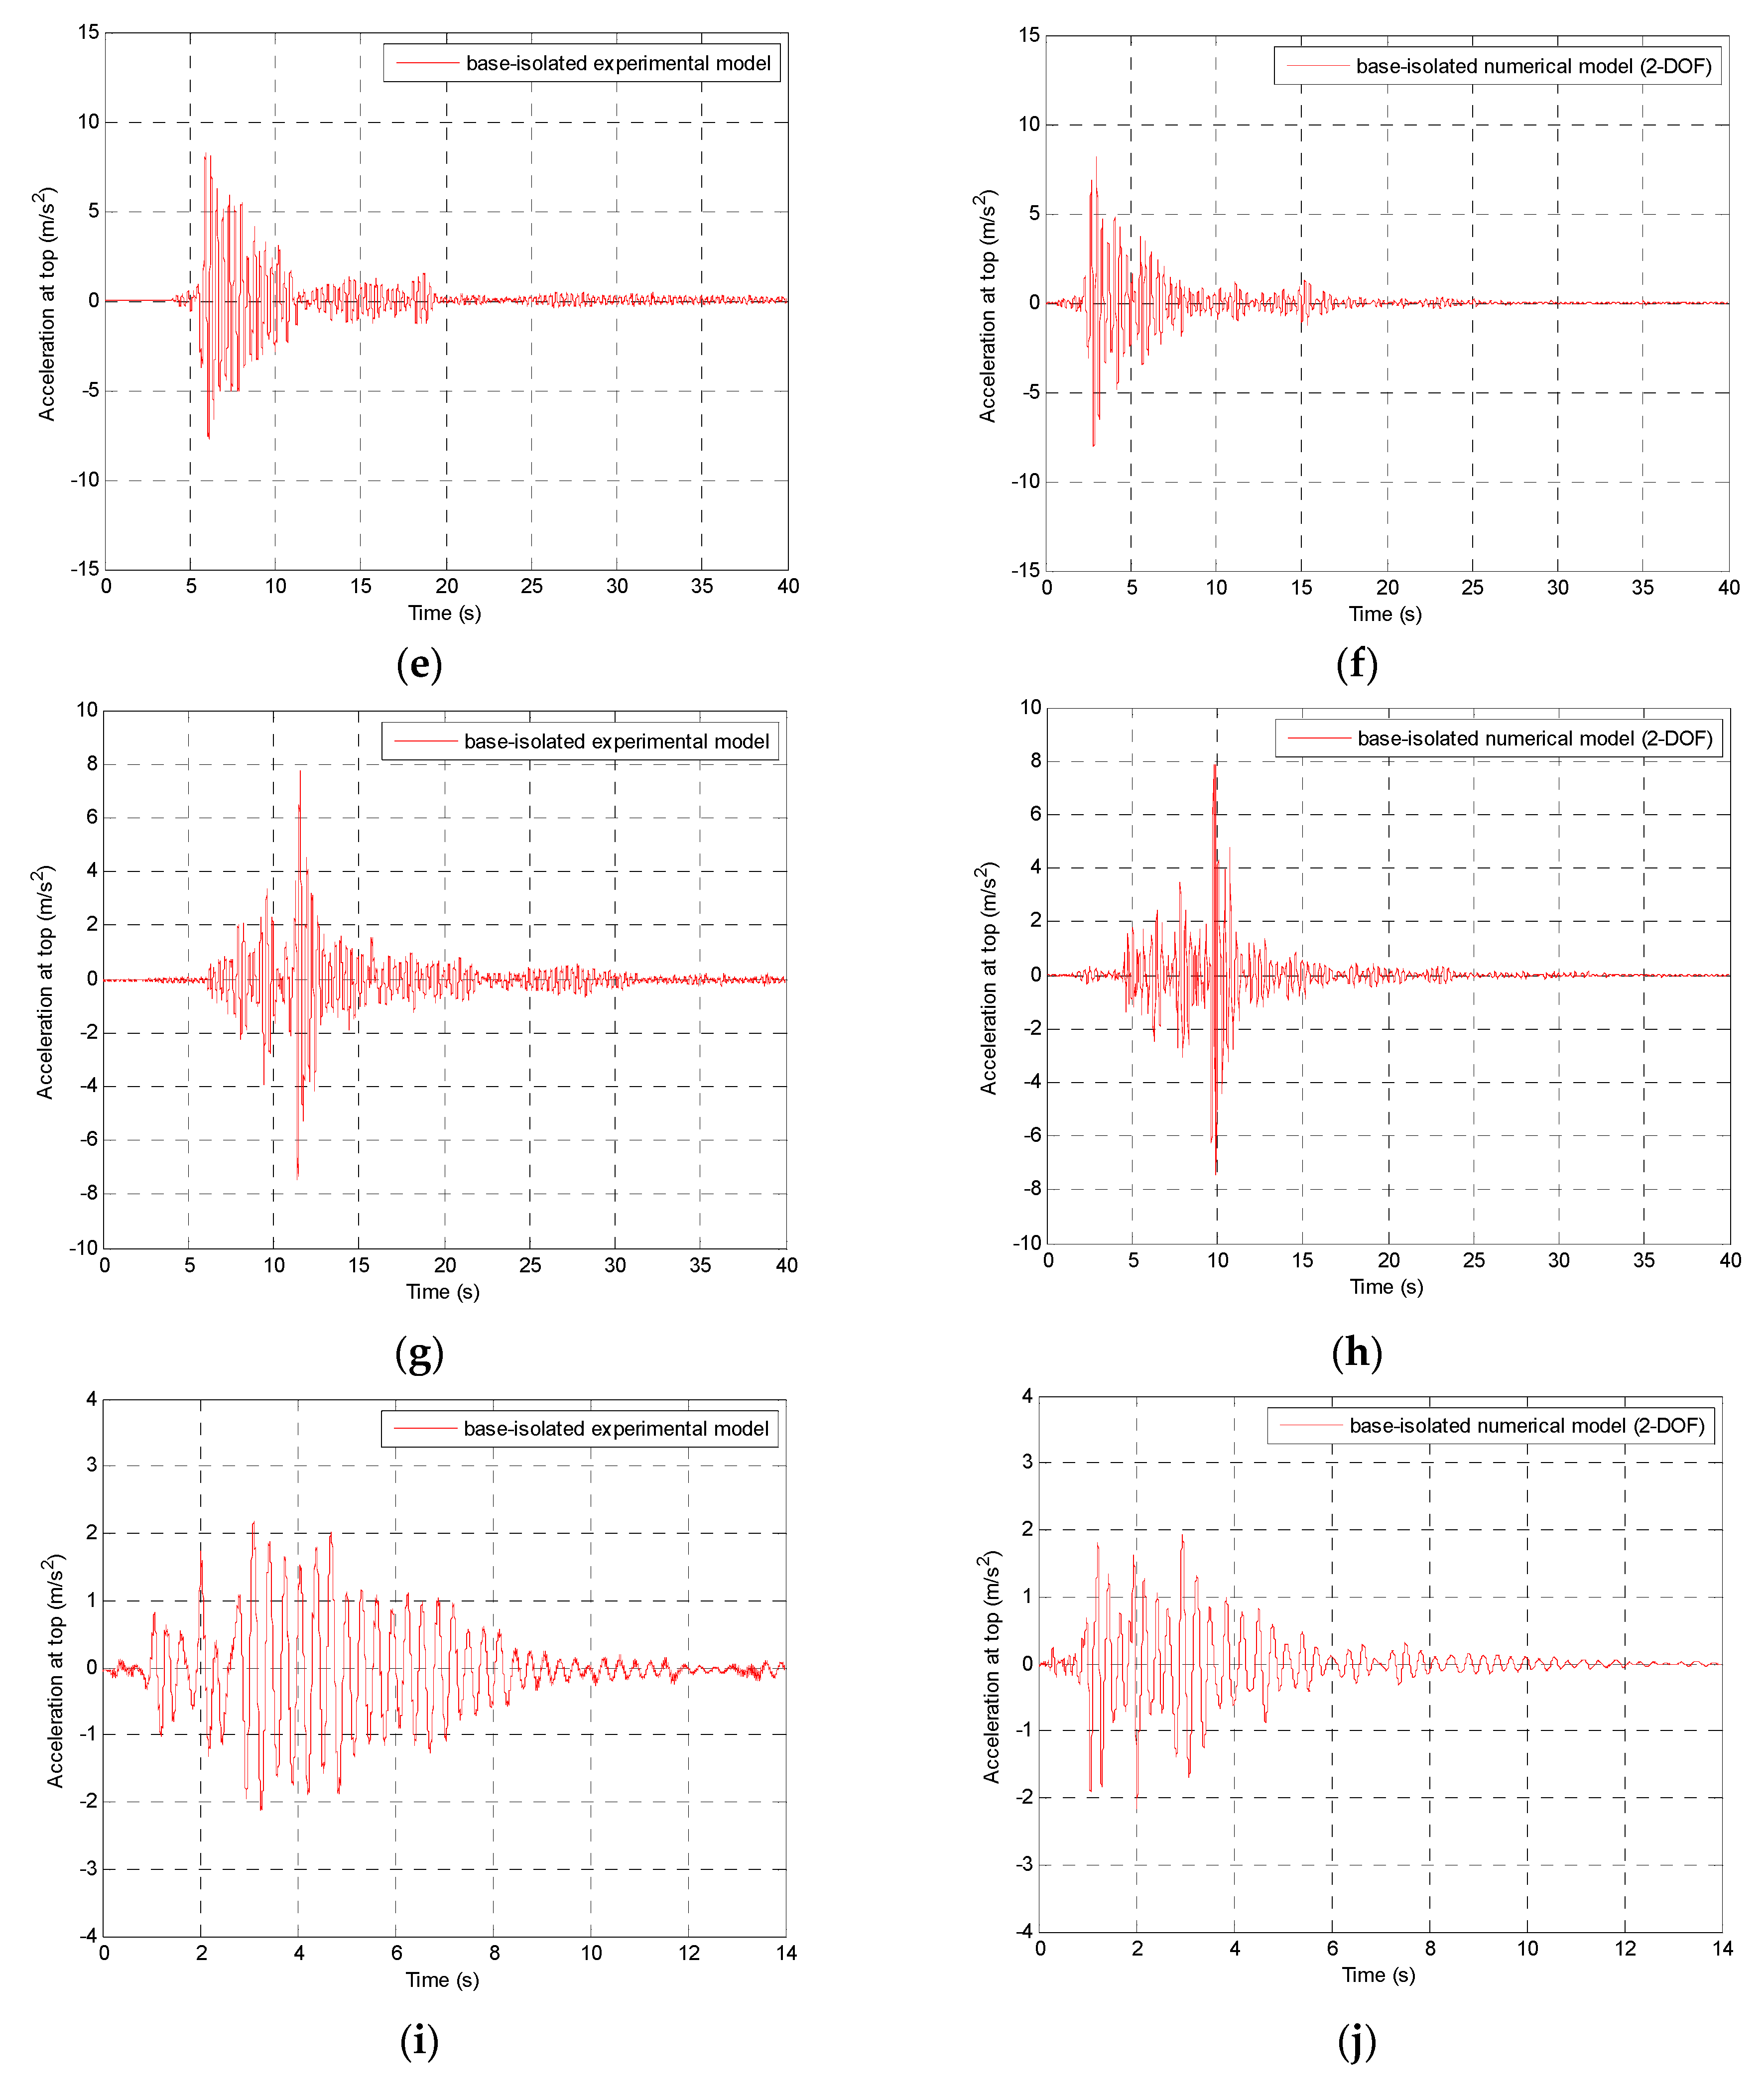
Numerically obtained acceleration-time history plots for the single-storey structure model, both fixed-base and base-isolated considered as 1-DOF and 2-DOF systems, respectively, are compared with the experimental data (see [
28]) in
Figure 5 and
Figure 6. Moreover, computed peak lateral accelerations recorded at the top of the analyzed single-storey structure model, with and without the PBs, are briefly reported in
Table 3. Additionally, reduction levels in lateral accelerations are also presented and compared with the results of the previously performed shaking table investigation [
28].
5.2. Two-Storey Structure Model
In the next step of the numerical investigation, 2-DOF and 3-DOF systems were applied to simulate the dynamic behaviour of the fixed-base and base-isolated two-storey structure models, respectively. The general matrix form of differential equation of motion has already been presented in Equation (10). Similarly to the single-storey structure model, for the fixed-based two-storey structure model, matrices
,
,
,
,
,
and
are defined as given in Equations (16)–(20), whereas for the base-isolated case, these matrices are presented in Equations (21)–(25):
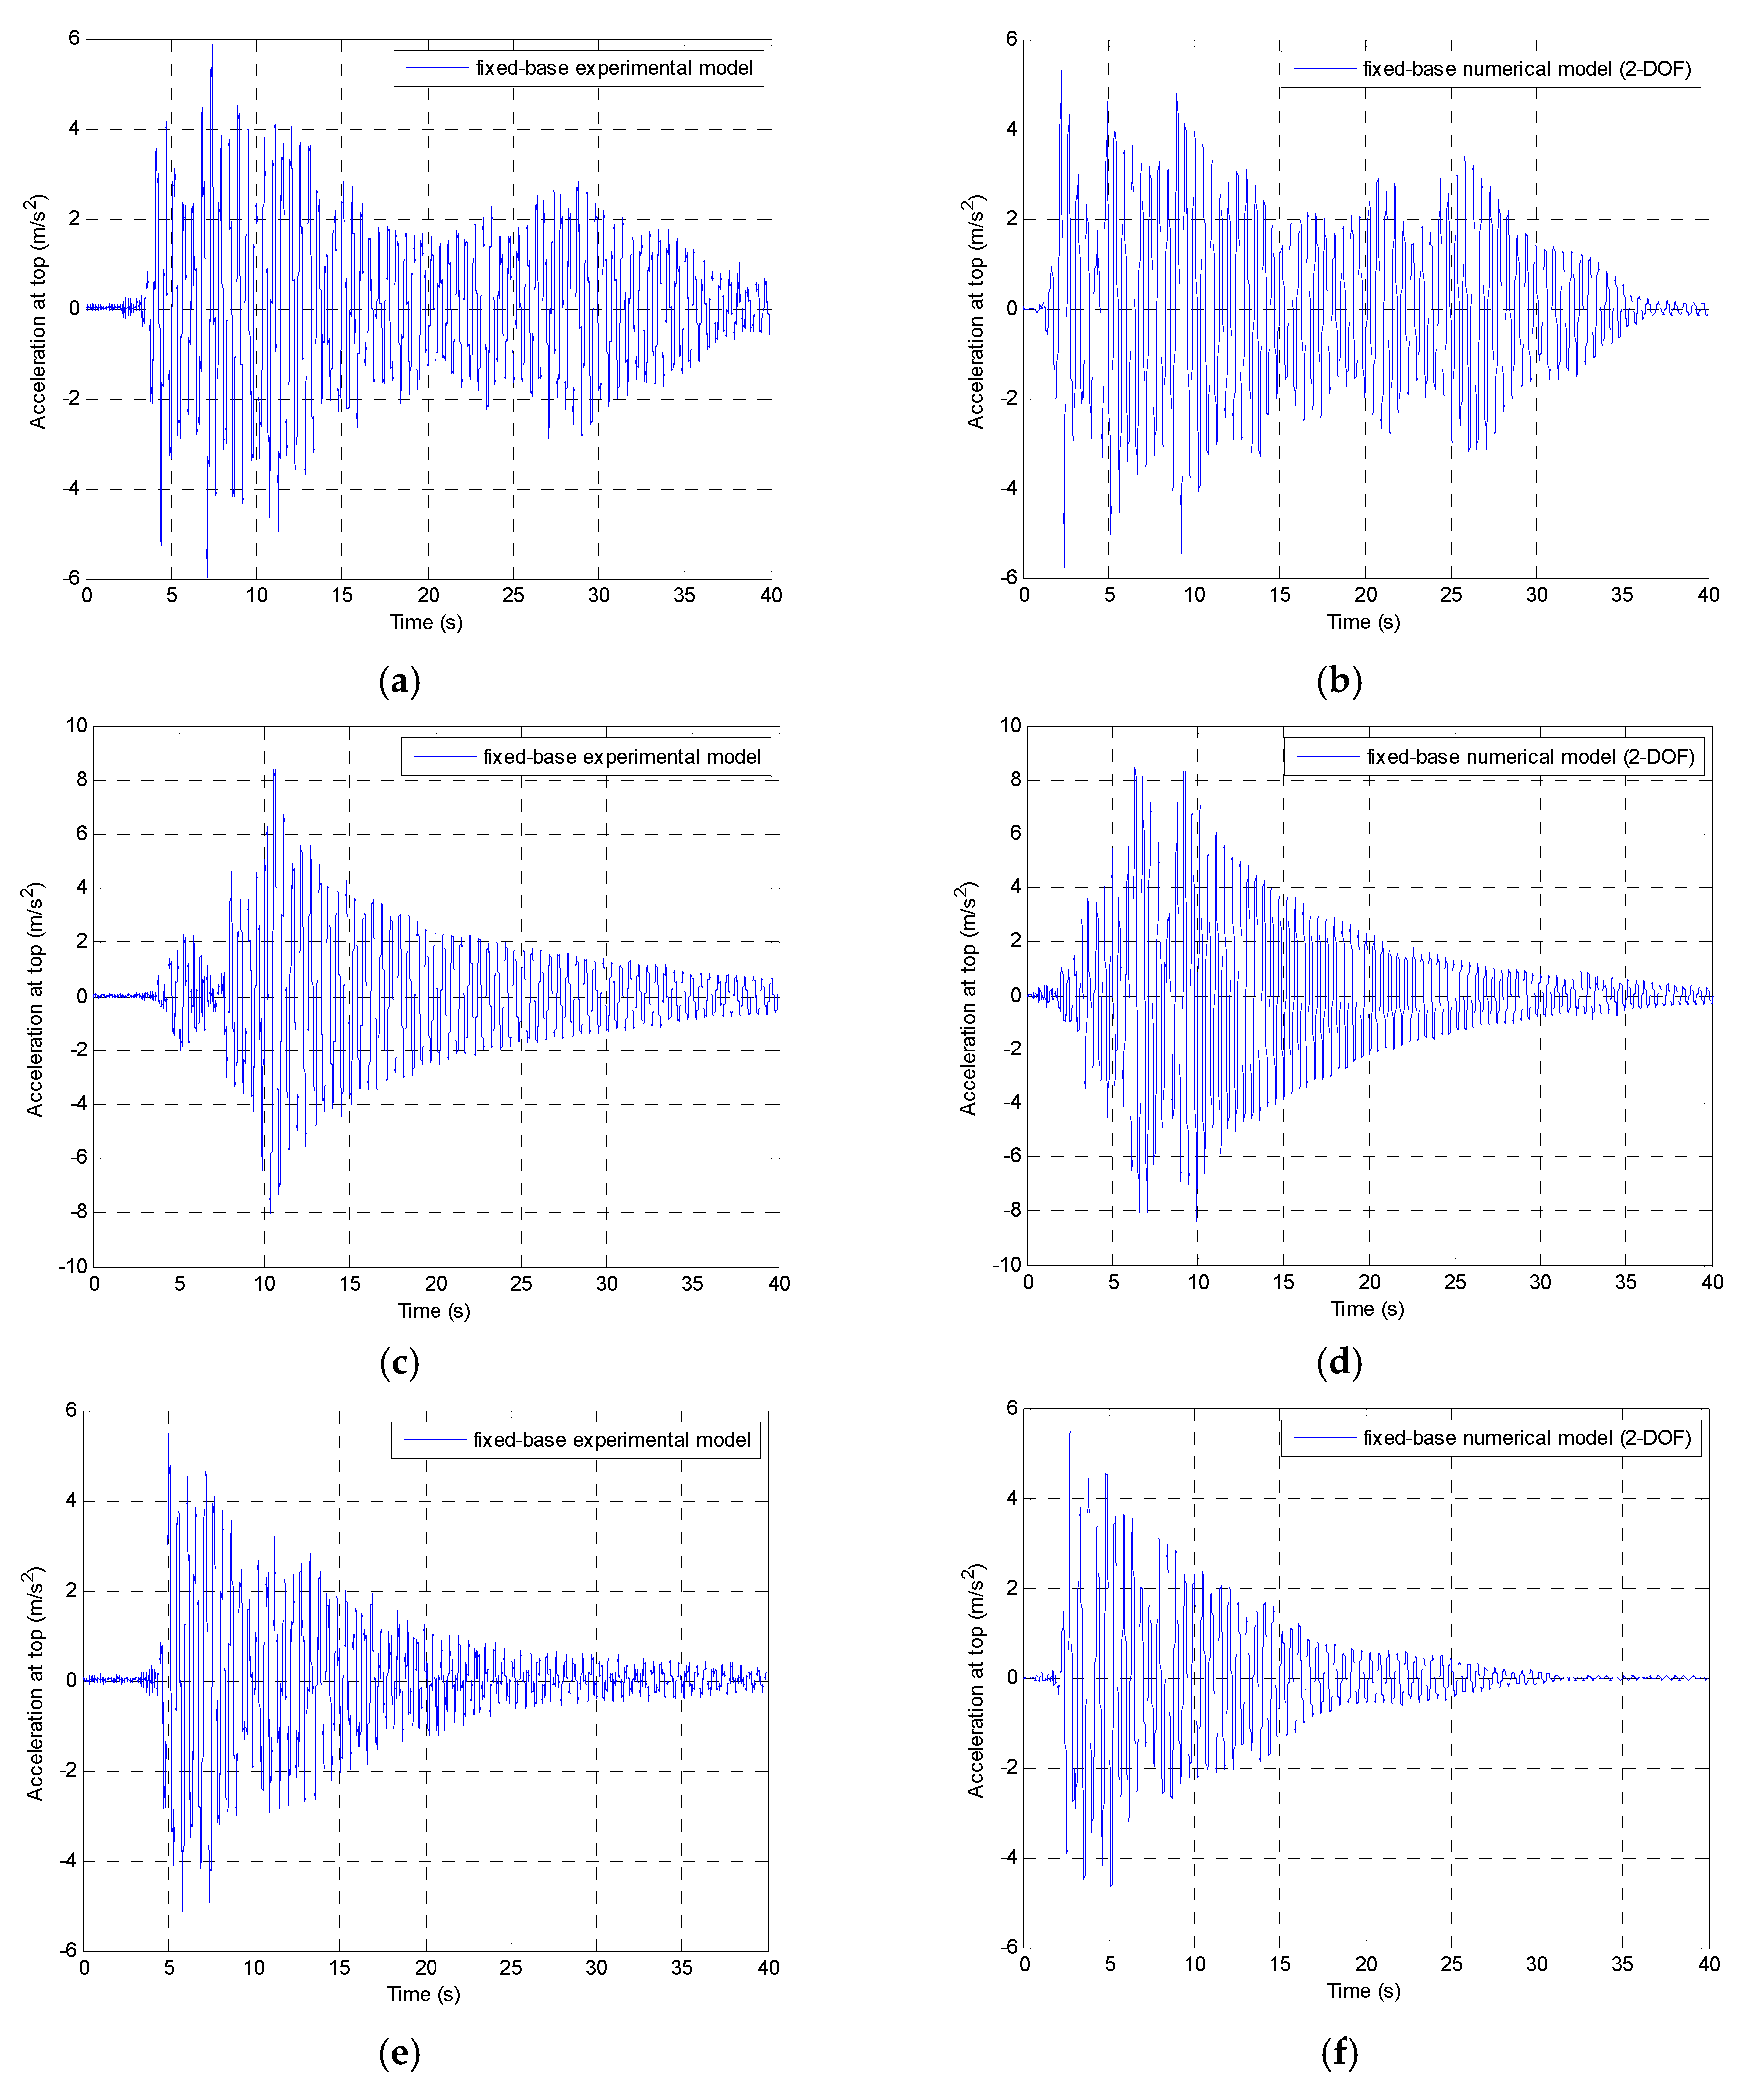
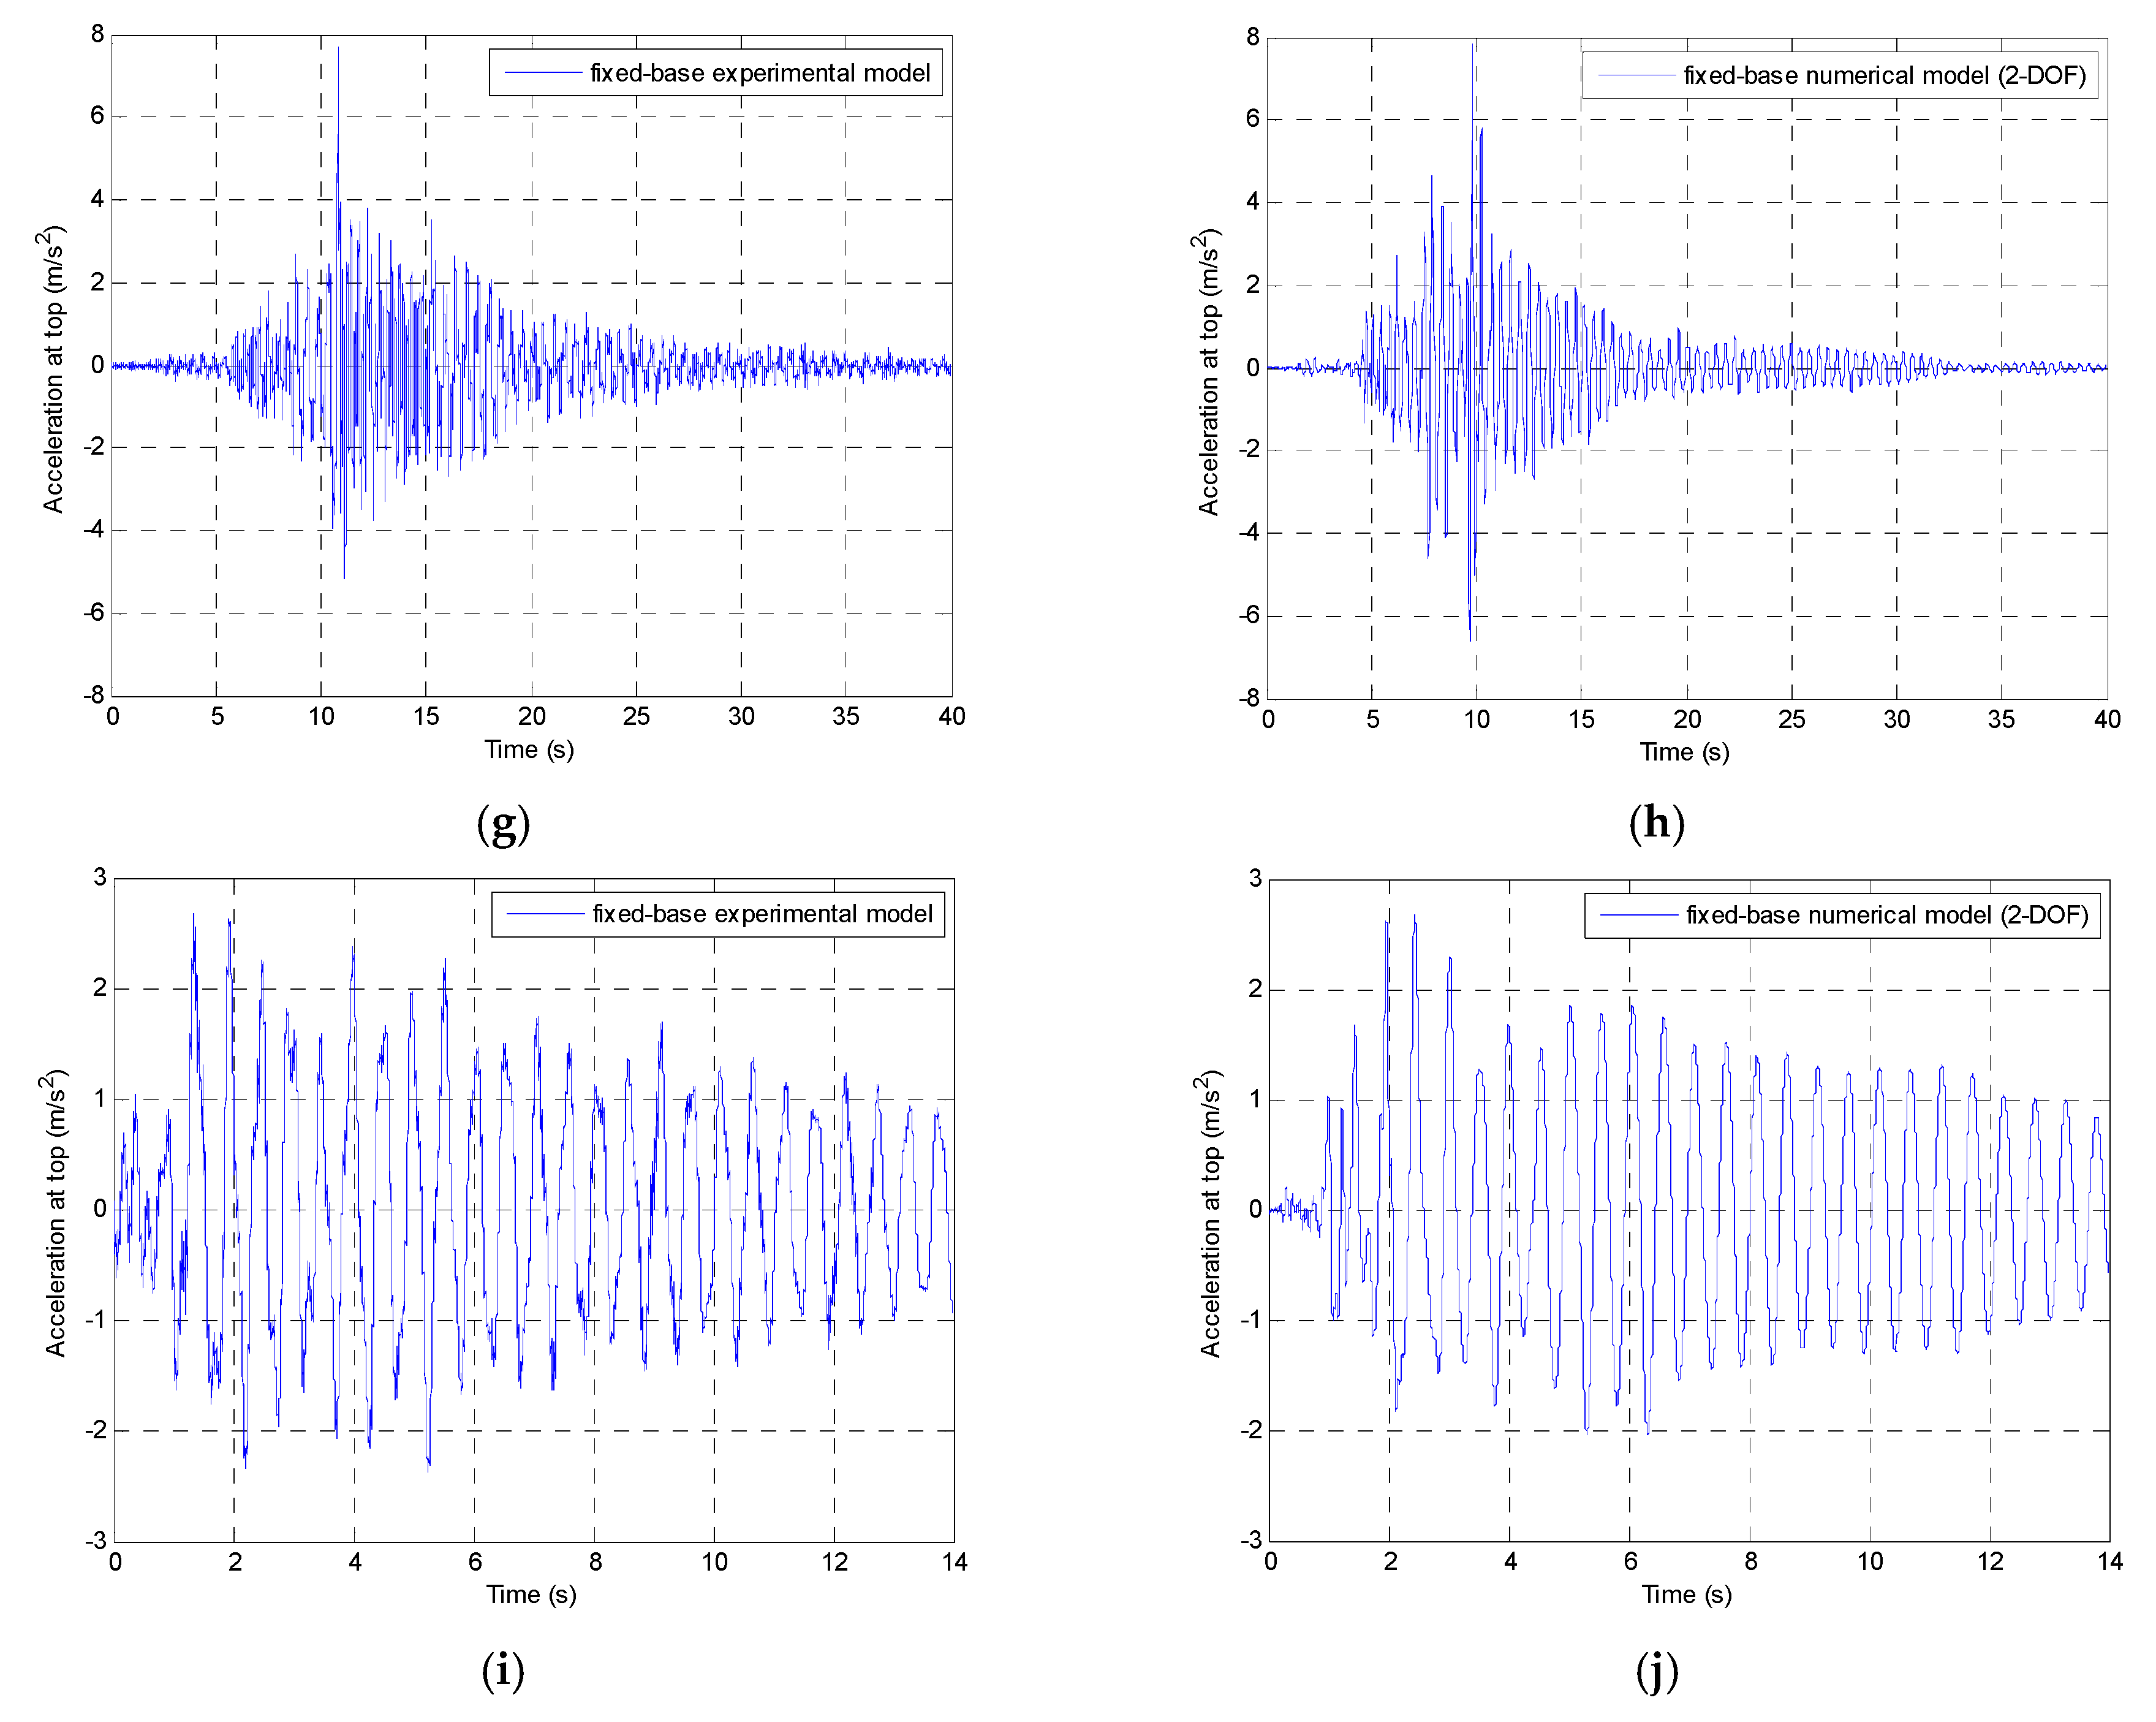
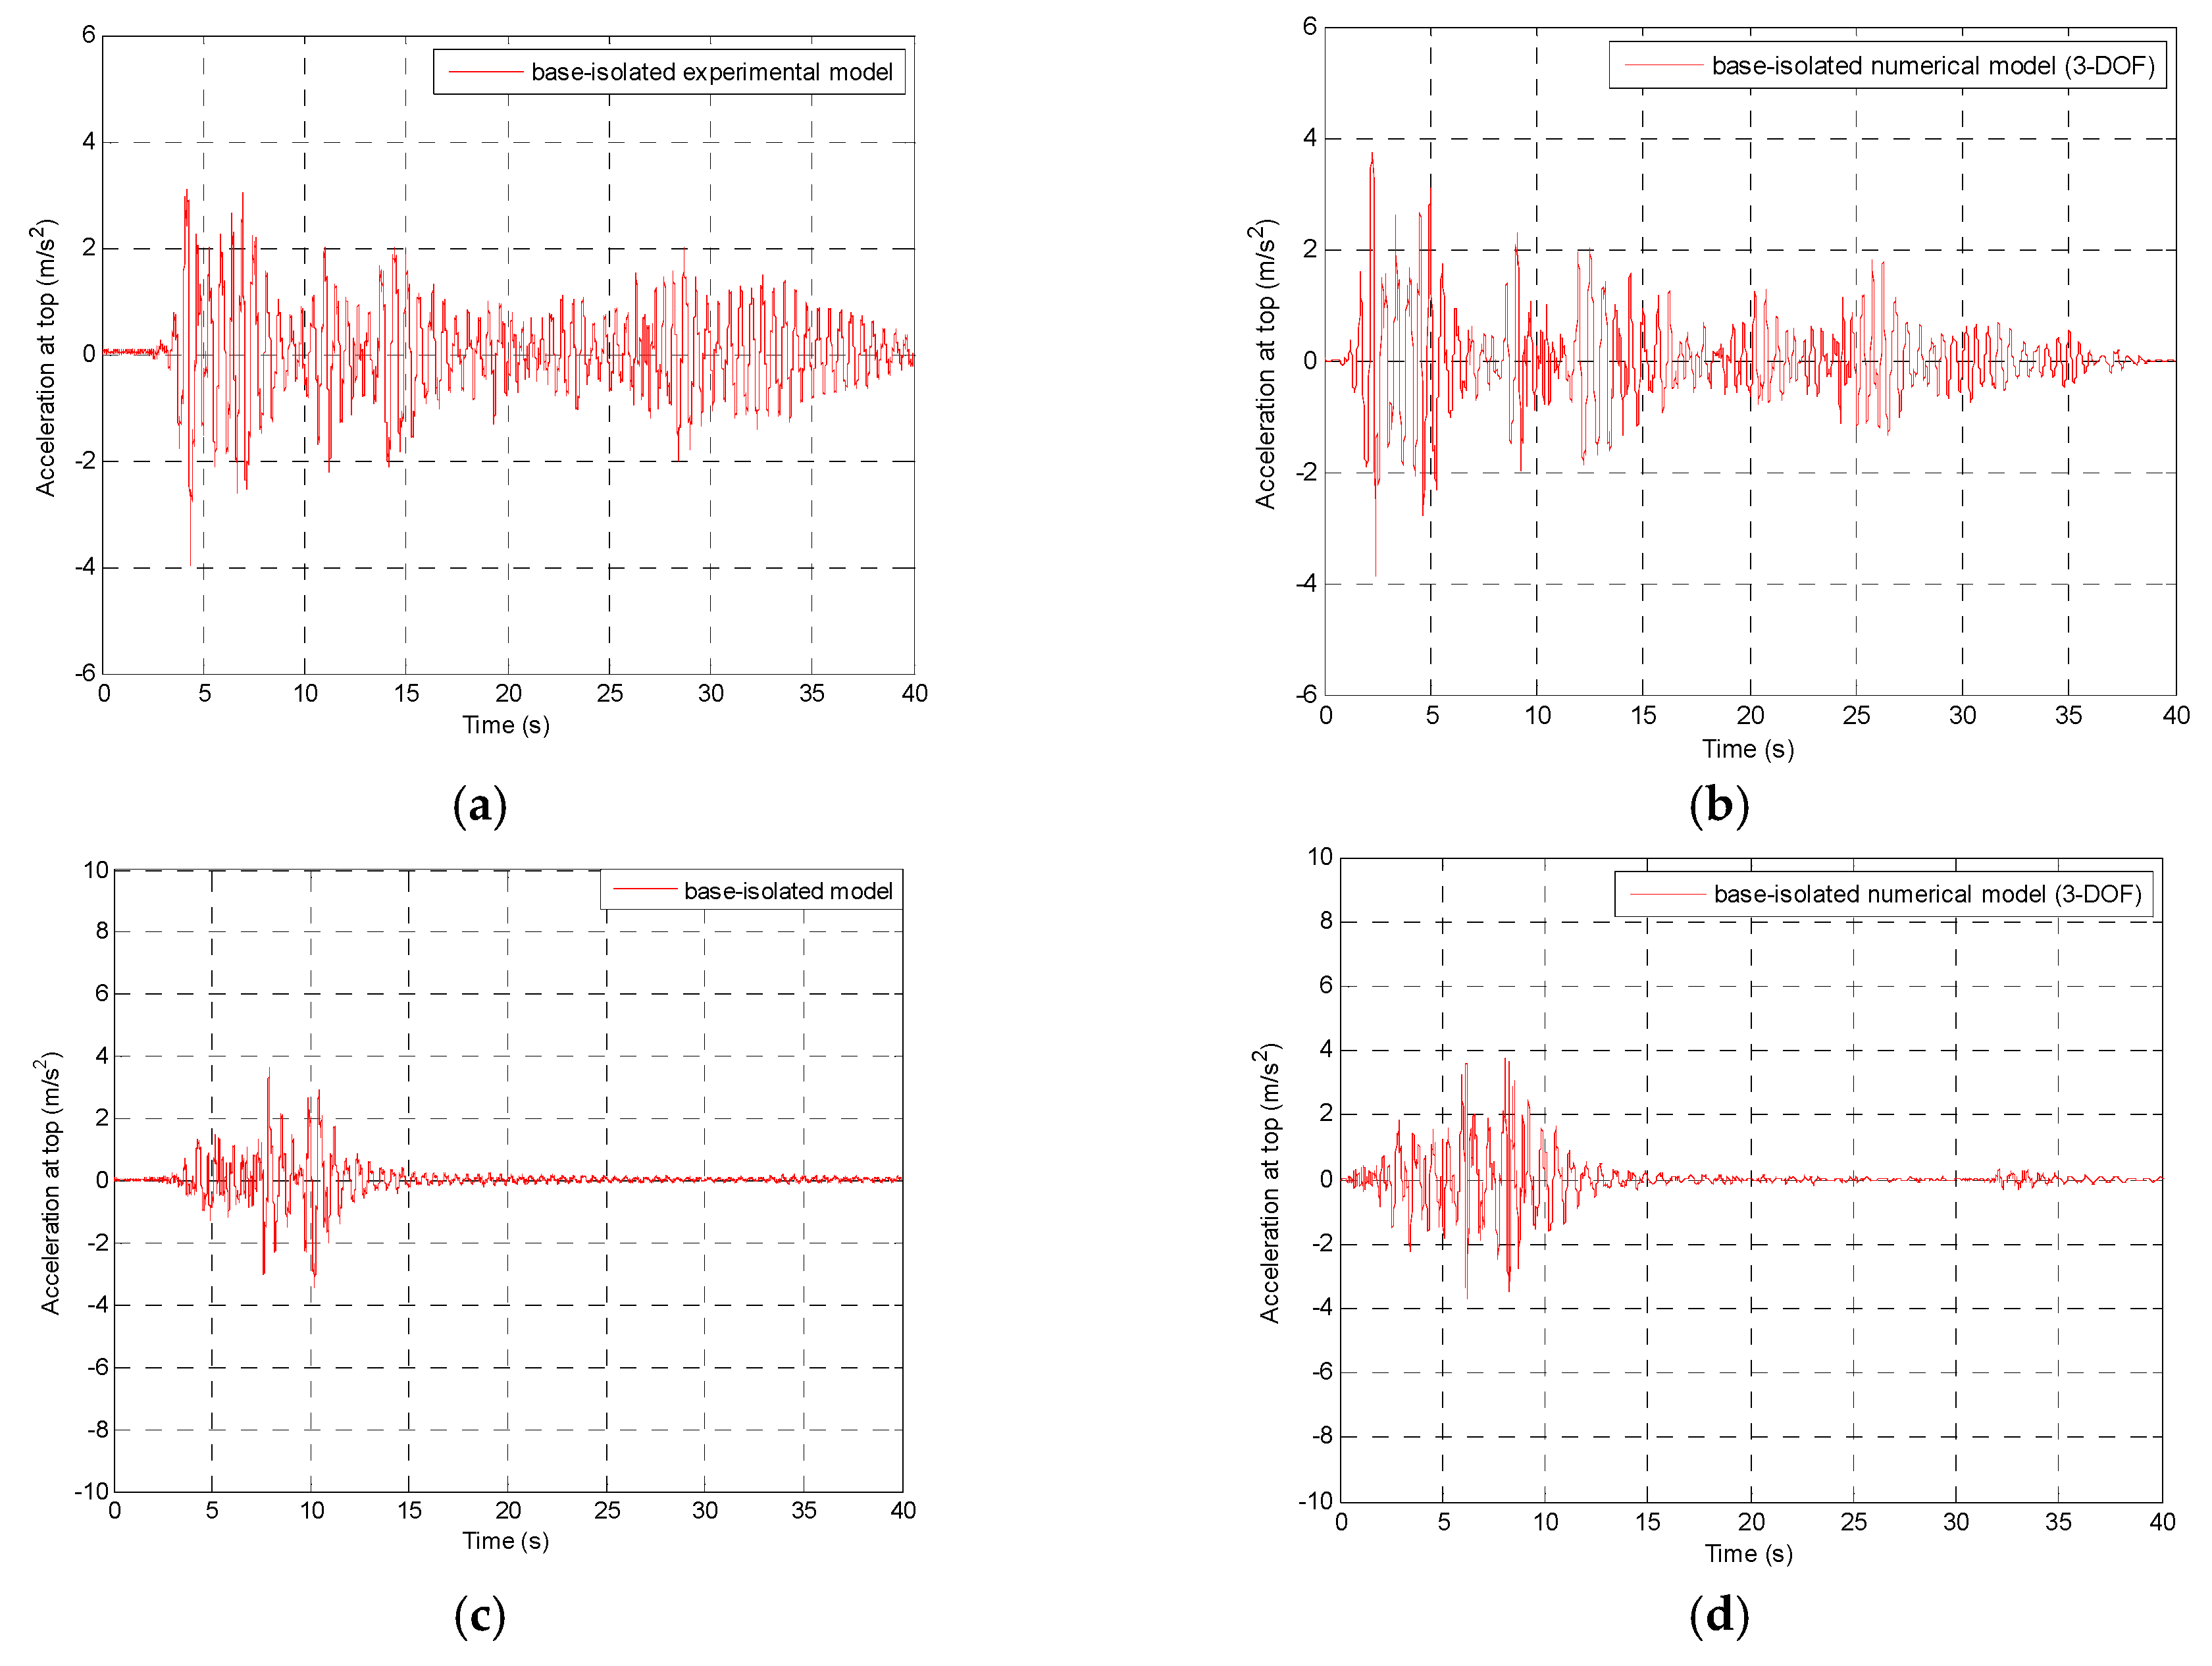
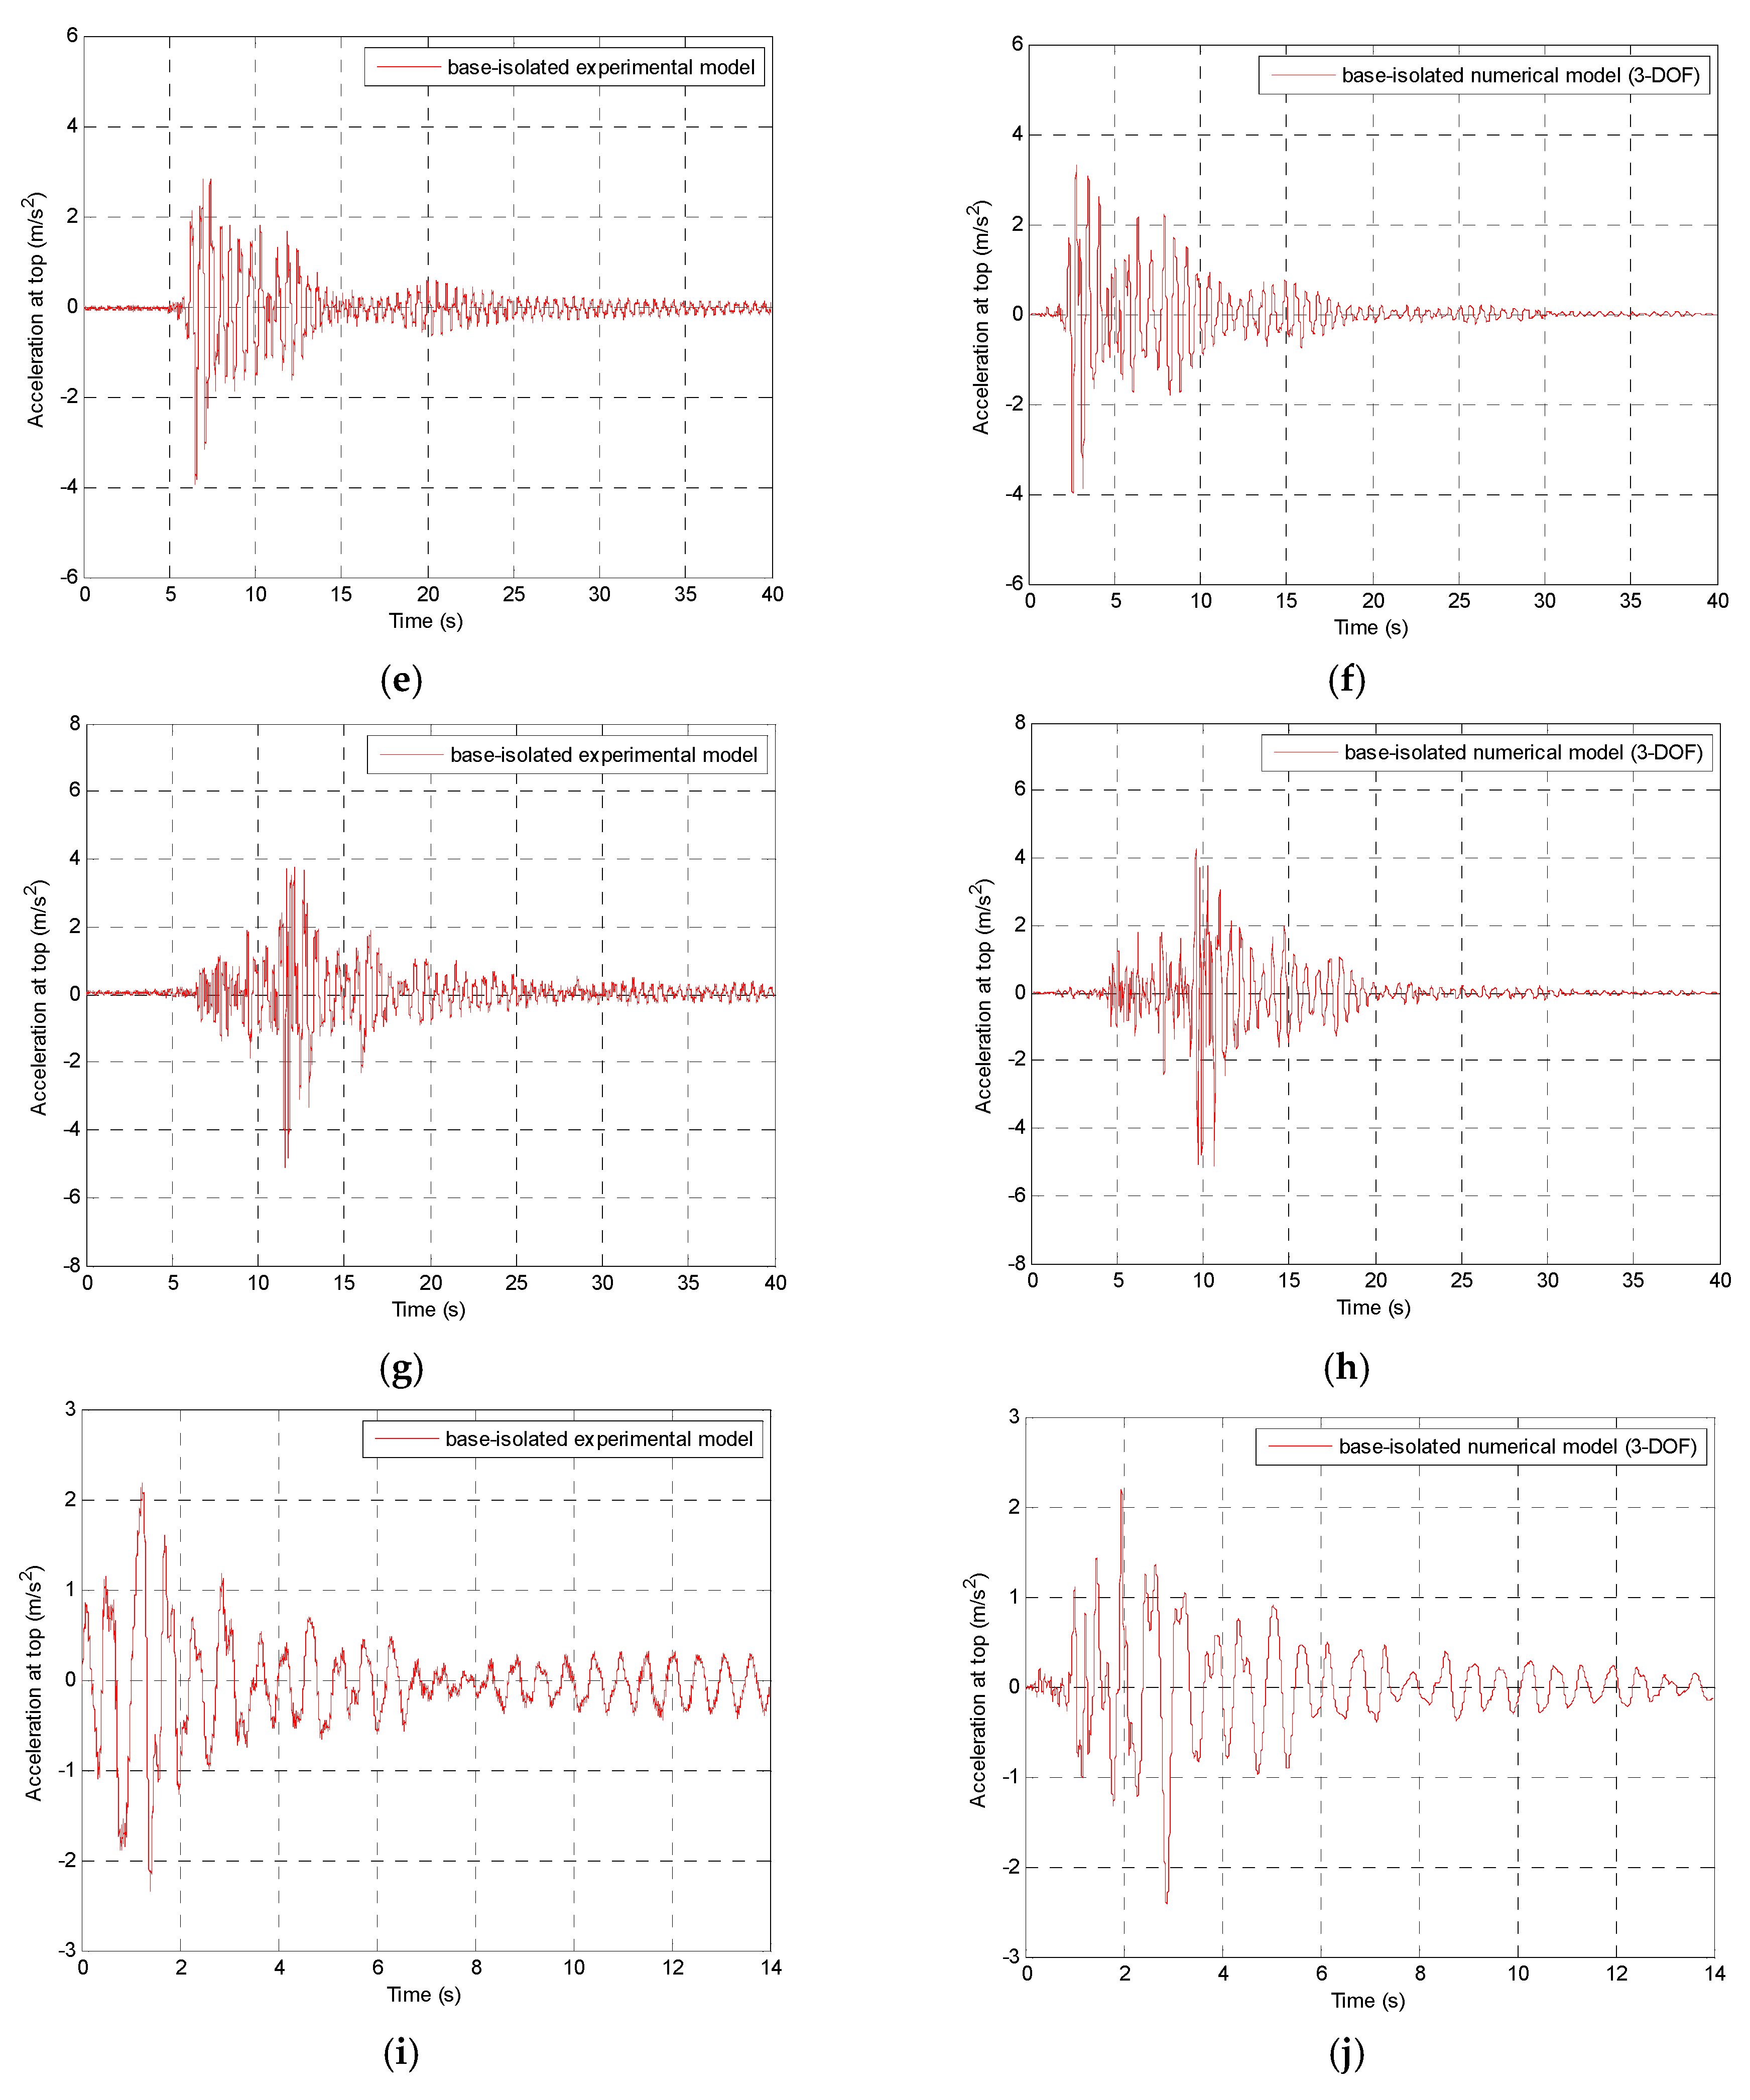
Numerically obtained acceleration-time history plots for the two-storey structure model, both fixed-base and base-isolated considered as 2-DOF and 3-DOF systems, respectively, are compared with the experimental data (see [
28]) in
Figure 7 and
Figure 8. Computed peak lateral accelerations recorded at the top of the analyzed two-storey structure model, with and without the PBs, are briefly reported in
Table 4. Additionally, reduction levels in lateral accelerations are also presented and compared with the results of the previously performed shaking table investigation [
28].
As indicated by
Figure 5,
Figure 6,
Figure 7 and
Figure 8 and
Table 3 and
Table 4, the results of the numerical analysis explicitly confirm high effectiveness of the developed mathematical model in simulating complex hysteretic behaviour of the prototype base isolation system made of PBs. Close inspection of
Table 3 and
Table 4 demonstrates that the reduction levels in peak lateral accelerations, which were calculated based on both numerical results and previously obtained experimental data (see [
28]), are very similar for every ground motion analyzed. In the case of the base-isolated single-storey model, the largest difference between numerical and experimental peak lateral acceleration has been obtained for the 1971 San Fernando earthquake (difference of 7.74%), while the lowest one for the 2002 Polkowice mining tremor (difference of 0.46%). On the other hand, in the case of the base-isolated two-storey model, the largest difference between numerical and experimental peak lateral acceleration has been obtained for the 1971 San Fernando earthquake (difference of 3.86%), while the lowest one for the 1994 Northridge earthquake (difference of 0.78%).
In addition to the peak lateral acceleration values, the whole time-acceleration records (
Figure 5,
Figure 6,
Figure 7 and
Figure 8) were also compared and the difference between numerical and experimental results was assessed using the normalized mean square error. The error calculated for the base-isolated single-storey model for the 1940 El Centro, 1971 San Fernando, 1989 Loma Prieta, 1994 Northridge, and 2002 Polkowice ground motions is as low as 4.56%, 5.21%, 5.59%, 2.41% and 6.21%, respectively. On the other hand, the normalized mean square error calculated for the base-isolated two-storey model for the same suite of dynamic excitations is 7.26%, 5.88%, 7.89%, 6.71%, and 7.53%, respectively. The above results concerning the whole time-acceleration records indicate that the accuracy of the developed mathematical model somewhat drops for the two-storey structure model, which is believed to be triggered by more complex modelling related to the increased number of degrees of freedom. It should also be underlined that the set of function parameters a
1–a
5 (incorporated in the numerical model) was evaluated to provide the best fit for the frequency range of 1 Hz to 5 Hz, which was taken as the most representative range for all ground motions considered in the present study. That approach has produced satisfactory results as the normalized mean square error has not exceeded 10% for all the earthquakes and the mining tremor analyzed in the research.
6. Conclusions
The paper reports the results of the comprehensive investigation designed to verify the effectiveness of an advanced mathematical model in simulating complex hysteretic behaviour of a prototype base isolation system made of PBs in numerical analysis. High effectiveness of PBs in reducing structural vibrations due to seismic excitations has already been experimentally confirmed during previously conducted shaking table investigation [
28]. In the present paper, an advanced hysteretic model was developed to capture mechanical behaviour of PBs in numerical analysis. The effectiveness of the mathematical model was verified by comparing the previously obtained shaking table investigation data (i.e., seismic response of a single-storey and two-storey structure models under various ground motions) with the results of the detailed lumped-parameter analysis.
The results obtained from the investigation explicitly confirmed that the proposed mathematical model can be successfully adopted to accurately capture complex mechanical behaviour of PBs in numerical studies. They show that the reduction levels in peak lateral accelerations between numerical and experimental results are very similar for all ground motions considered in the study. Moreover, relatively low normalized mean square errors were obtained when the whole time-acceleration numerical and experimental records were compared. It has to be also added that the results of the study indicated that the accuracy of the numerical analysis somewhat decreases as the number of DOFs increases.
The calibration procedure presented in the current investigation (performed by curve-fitting the general form of the developed mathematical model into the experimentally obtained hysteresis loops) was conducted for the prototype seismic isolation system made of PBs. Nevertheless, the preliminary experimental results obtained from the full-scale PBs, indicate that very similar shape of hysteresis loops can be observed. Therefore, the general form of the proposed mathematical model is expected to be also suitable for different PBs, regardless of their dimensions or scale factors. However, curve-fitting procedure has to be performed to evaluate a new set of function parameters for each specific PB.
Further development of the seismic isolation system made of full-scale PBs is to be performed. More studies are necessary to be conducted in order to fully verify the effectives of full-scale multi-dimensional PBs as a base isolation system for real structures. These should include detailed numerical simulations as well as experimental tests conducted on a large six degrees-of-freedom shaking table.


