Article

Effects of Individual and Environmental Factors on GPS-Based Time Allocation in Urban Microenvironments Using GIS

by
Audrius Dėdelė
*,
Auksė Miškinytė
,
Irma Česnakaitė
and
Regina Gražulevičienė
Department of Environmental Sciences, Faculty of Natural Sciences, Vytautas Magnus University, Vileikos Street 8, 44404 Kaunas, Lithuania
*
Author to whom correspondence should be addressed.
Appl. Sci. 2018, 8(10), 2007; https://doi.org/10.3390/app8102007
Submission received: 17 September 2018 / Revised: 11 October 2018 / Accepted: 18 October 2018 / Published: 22 October 2018
(This article belongs to the Section Environmental Sciences)

Abstract

:
Time-activity patterns are an essential part of personal exposure assessment to various environmental factors. People move through different environments during the day and they have different daily activity patterns which are significantly influenced by individual characteristics and the residential environment. In this study, time spent in different microenvironments (MEs) were assessed for 125 participants for 7 consecutive days to evaluate the impact of individual characteristics on time-activity patterns in Kaunas, Lithuania. The data were collected with personal questionnaires and diaries. The global positioning system (GPS) sensor integrated into a smartphone was used to track daily movements and to assess time-activity patterns. The study results showed that behavioral and residential greenness have a statistically significant impact on time spent indoors. These results underline the high influence of the individual characteristics and environmental factors on time spent indoors, which is an important determinant for exposure assessment and health impact assessment studies.

1. Introduction

Exposure assessment is essential for determining the relationship between various environmental factors and health effects [1,2]. One of the biggest challenges facing environmental epidemiology recently is the dynamic nature of exposure [3]. Individuals constantly move in time and space and a better understanding of time-activity patterns according to different demographic, socioeconomic and environmental variables is relevant to improve health impact assessment [4,5]. Several studies comparing time-activity patterns and the role of individual-level characteristics on these patterns have revealed significant variations between demographic and socioeconomic factors such as age, gender, employment status, income, education, and race/ethnicity [6,7]. Recently, Matz et al. [8] have found significant differences in the daily time-activity patterns between rural and urban populations. Therefore, in order to avoid exposure measurement errors and more accurately determine the relationship between environmental factors and health effects, it is necessary to take into account time-activity patterns.
Recent epidemiological research focuses on sensor technologies such as smartphones, global positioning system (GPS) devices and accelerometers to assess individual-level exposures and biological responses [9,10]. The use of these technologies helps to capture individuals’ time-activity data considering all microenvironments (MEs) in which people spend their time [11]. GPS device allows to track and to monitor people’s daily movements and commuting patterns and provides information about geographic coordinates, time, distance, speed, altitude [12]. GPS tracking devices are used in combination with travel/activity diaries or accelerometer to improve the measurements of daily movement patterns and exposure assessment [13,14]. GPS technology reduces the measurement bias and collects more precise data of time-activity patterns compared to traditional self-reported surveys [15].
One of the approaches to assessing human exposure is based on the concept of microenvironments suggested by Duan [15]. People spend their daily time in various MEs and they are exposed to different environmental exposures in each of them, so it is necessary to classify MEs into categories. The most frequently used MEs categories for exposure studies are home, work/ school, other indoor, outdoor, and transport [16,17,18]. According to the World Health Organization many European citizens spend, on average, 90% of their time indoors: at home (two-thirds of this time), at work, at school and in public places [19]. A study by Schweizer et al. [20] investigated time-activity patterns in seven regions across Europe and the results showed that more than 90% of the variance in indoor time-activity patterns originated from differences between subjects rather than between cities. Therefore, this study is more focused on indoor MEs, where people tend to spend most of their time and we aim to determine the most important factors influencing time spent indoors.
Previous studies have emphasized the importance of taking into account time-activity patterns for assessing physical activity, exposure to environmental factors, and health effects, but there is a lack of research linking behavioral characteristics and environmental factors to time spent indoors. It is also important to find out which factors are most important and which subgroups of the population are more susceptible to exposure misclassification. Residential greenness and noise concentration were selected as environmental factors to evaluate how they may influence peoples’ behavior and time-activity patterns. We have a preliminary hypothesis that green spaces may promote people to spend more time outdoors. On the contrary, a higher outdoor noise level can cause people to spend more time indoors.
In this paper, we present the results on the use of GPS integrated into smartphones that continuously records an individual’s time and location data and allows us to assess time-activity patterns. The main aim of this paper is to evaluate the impact of individual characteristics and environmental factors on time-activity patterns and time spent indoors among the urban adult population in Kaunas, Lithuania.

2. Materials and Methods

2.1. Selection of Study Population and Study Design

A total of 4672 adults were randomly selected and invited by mail to fill out a postal questionnaire and to participate in the study in Kaunas city, Lithuania. Responses to the postal questionnaires were received from 1141 individuals.
The data were collected in two steps in the study population: a questionnaire survey among all participants and a subsample of 125 people (smartphone study) who had completed the questionnaire survey as well. A total of 125 participants were randomly selected from all study population of Kaunas cohort (n = 1141) aged 20–85 years to participate in a smartphone study using objective measures and standardized questionnaires to assess their individual daily time-activity patterns using GPS data and geographic information system. The survey was conducted between May and October. The schematic design of this study is shown in Figure 1. Ethics approval was obtained for all aspects of the study by the Kaunas Regional Biomedical Research Ethics Committee (Approval No. BE-2-16).

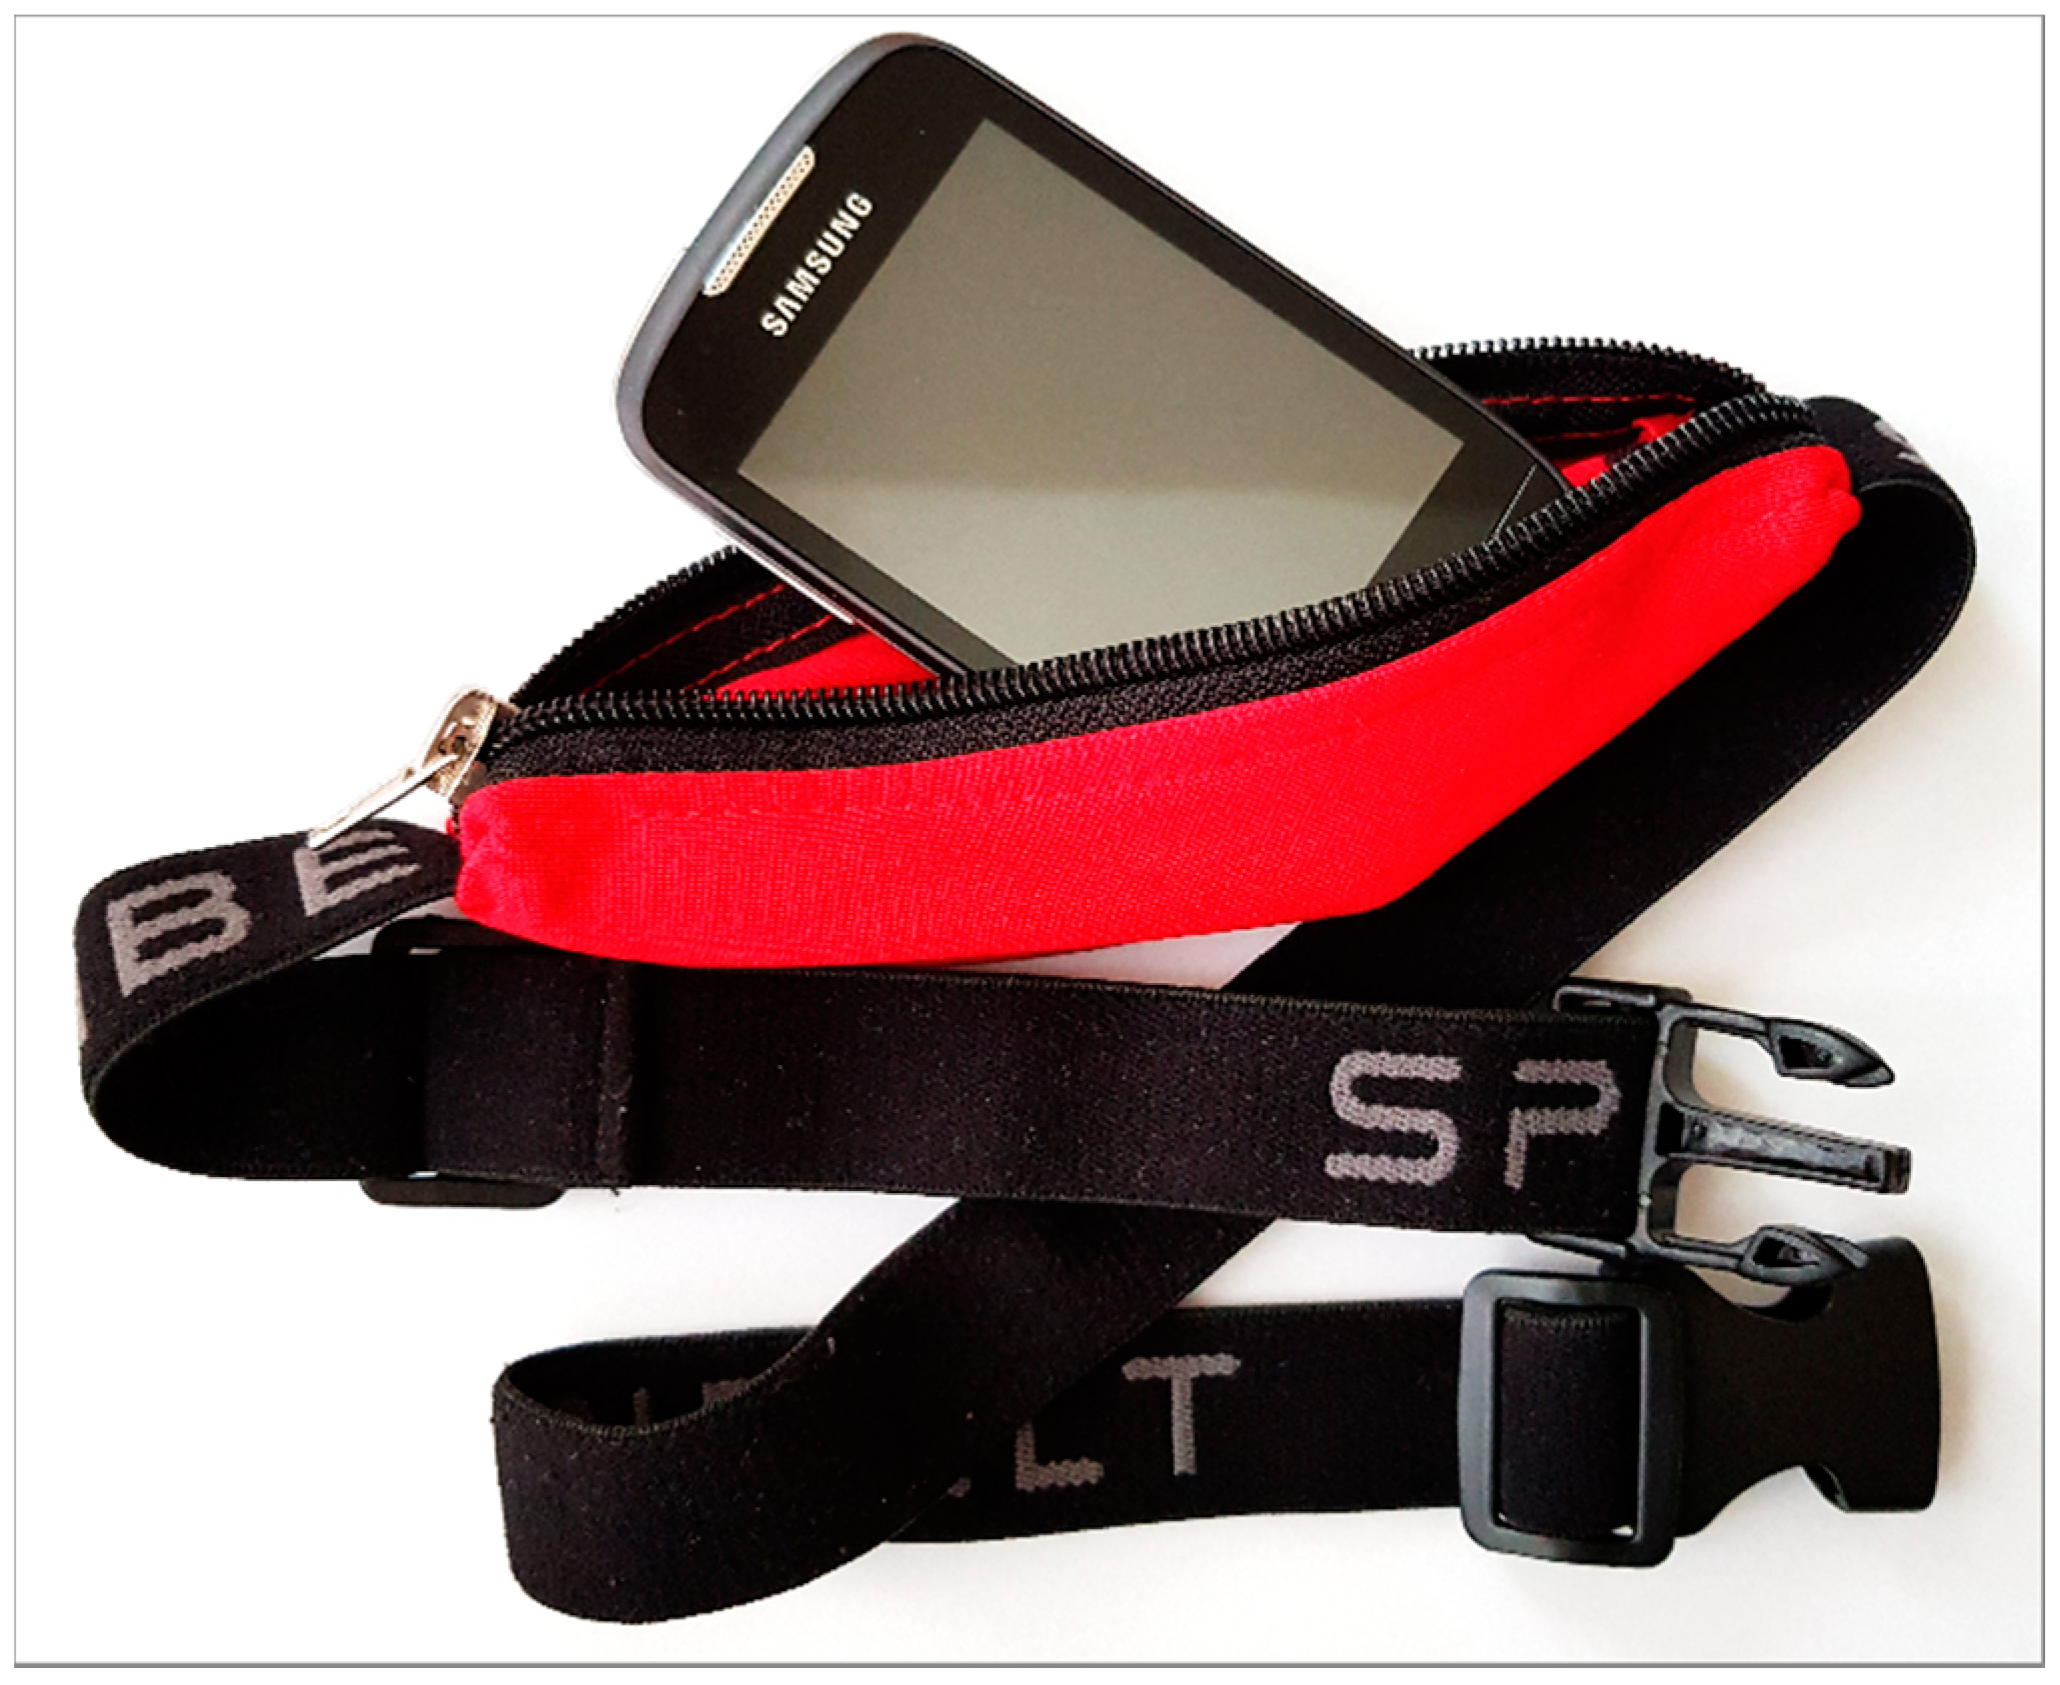
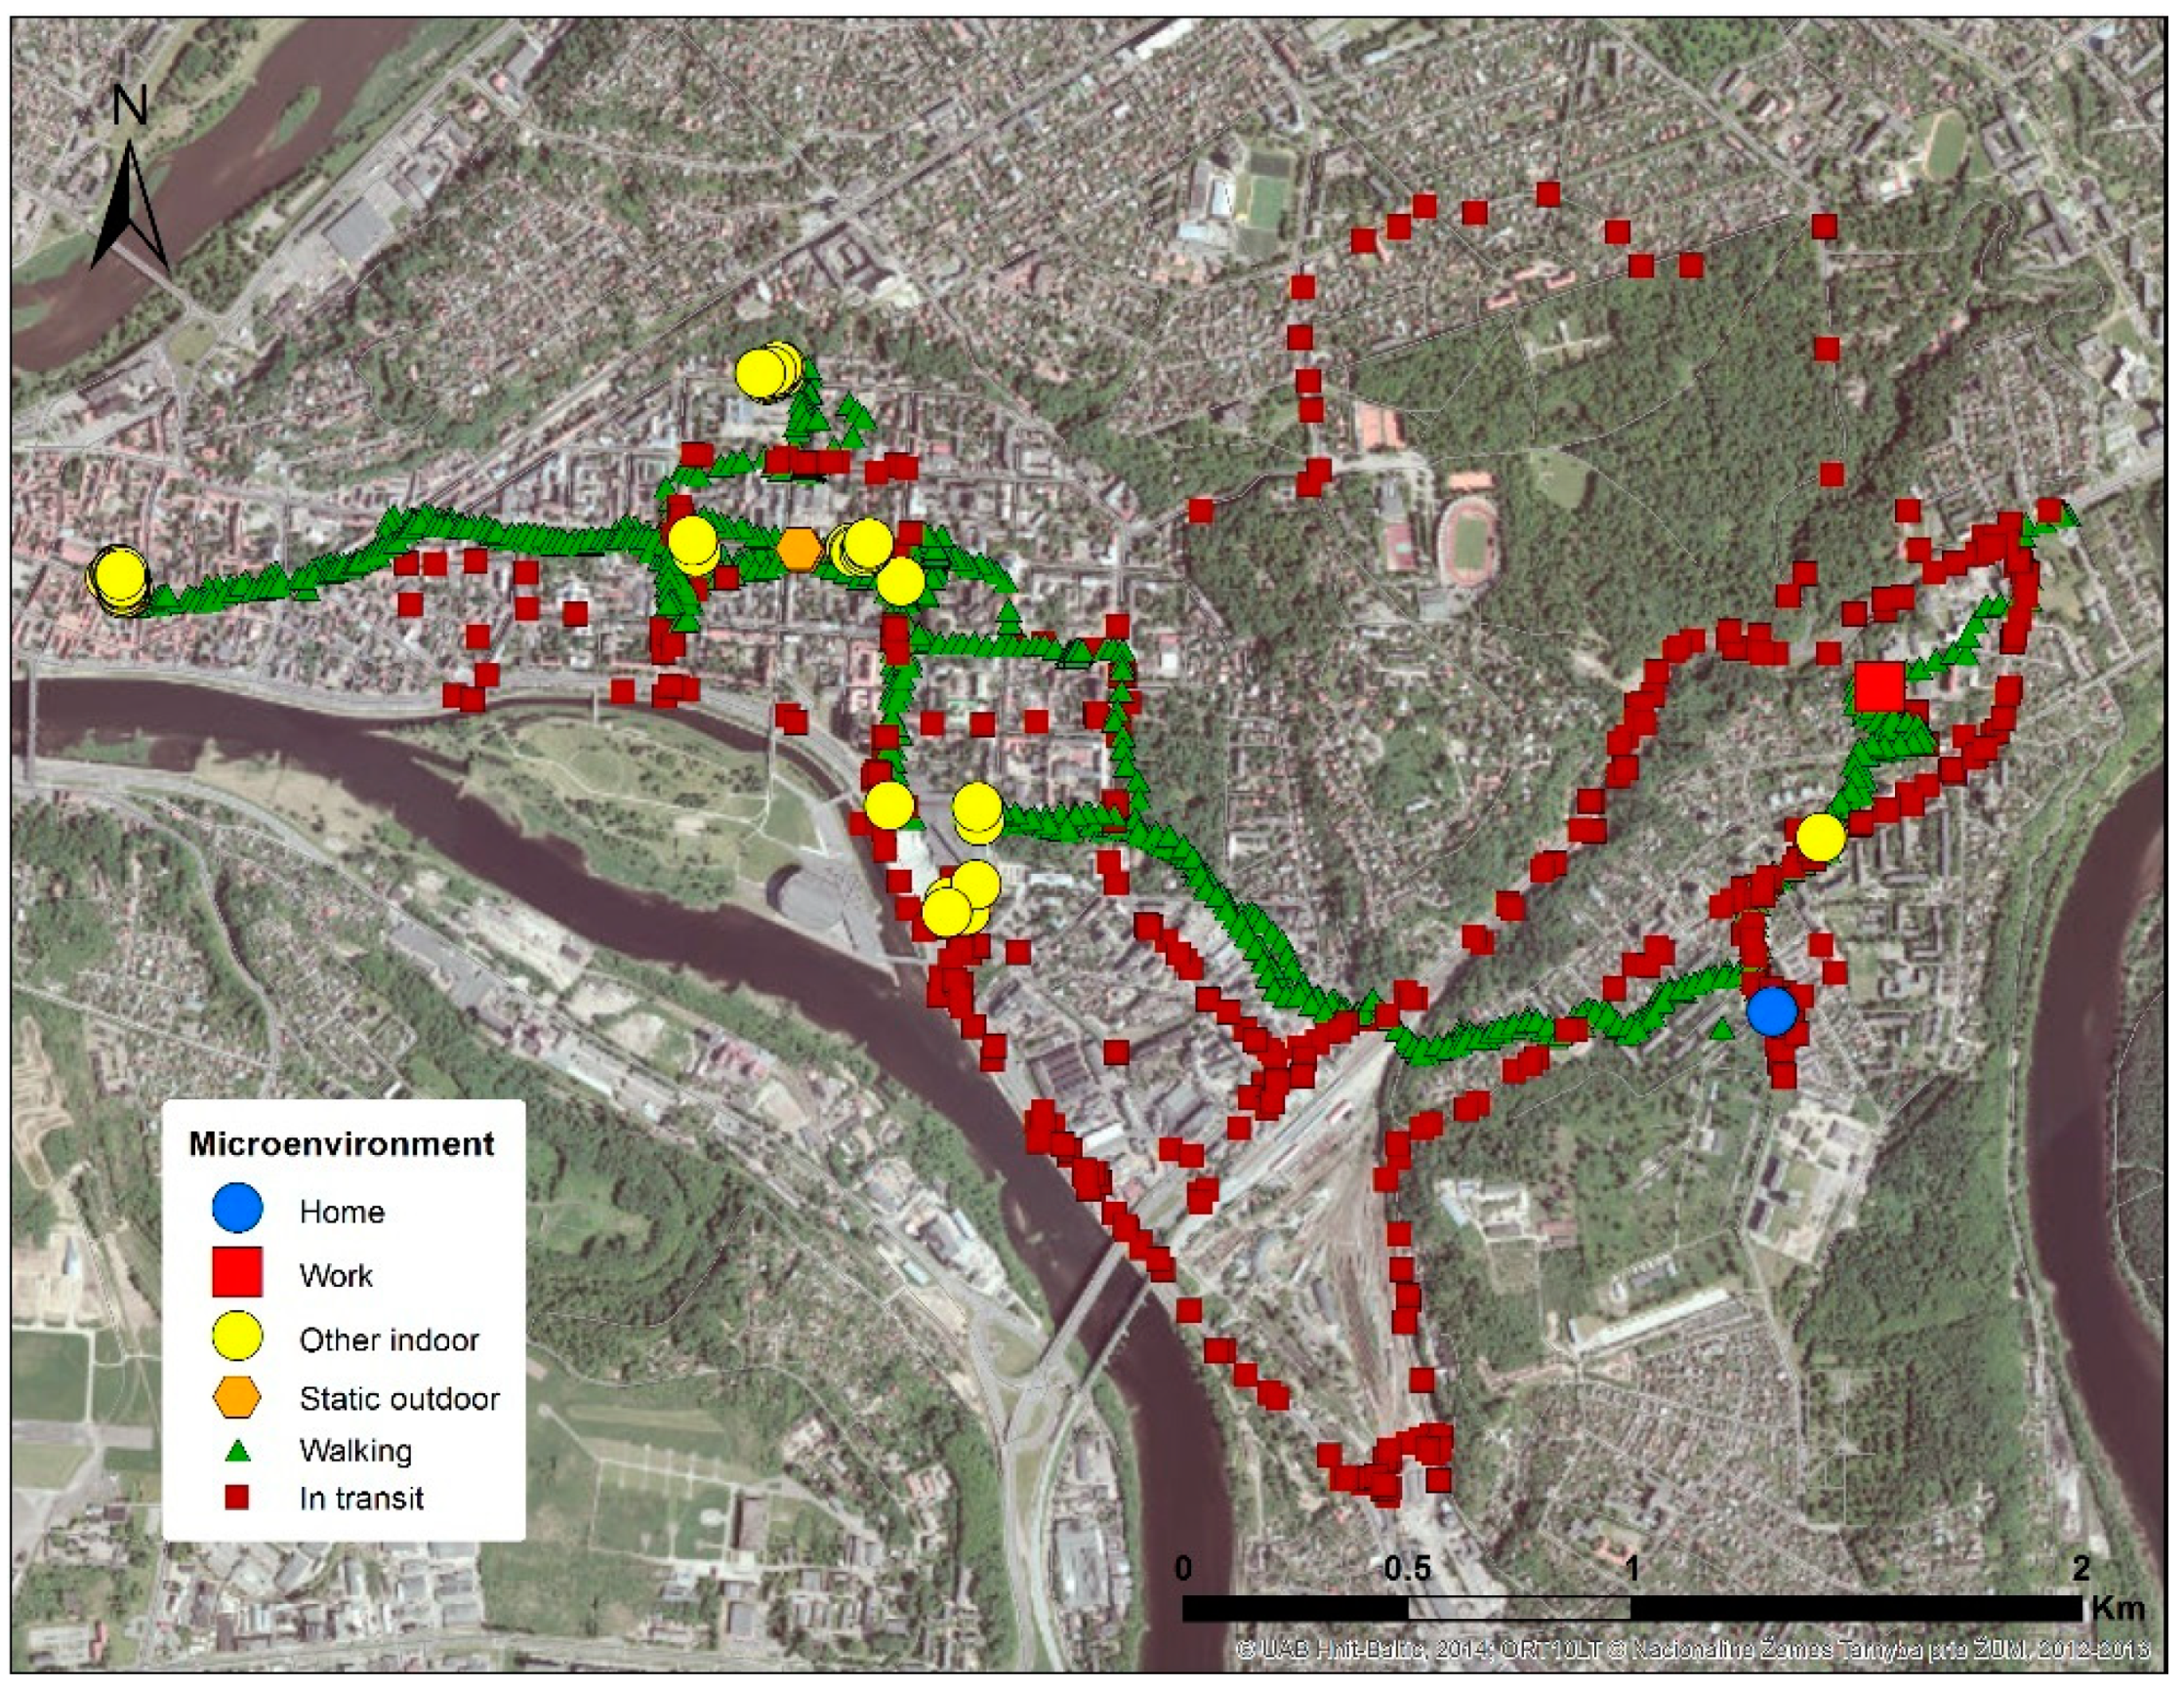
2.2. Time-Activity Pattern Assessment

The participants carried a compact waist belt with a smartphone (Samsung Galaxy Mini, developed by the Korean manufacturer Samsung Electronics) with integrated GPS sensor, which did not restrict movement and did not result in any bias. After finishing the study, none of the participants mentioned that the device had any impact on their daily activities, interfered with them or alter their behavior. The only activities during which the device was not wearied was sleeping, workout and bathing and these non-wear intervals and other relevant information were identified and reported on the weekly diary. GPS data were reviewed before collecting the devices from the study participants as well as the weekly activity and the wear time of the device of each participant were checked. There were 3 participants who needed to repeat the survey due to improper data collection.
The smartphone with an integrated GPS sensor was used to track the time and location data of the study participants for 7 consecutive days (Figure 2). The Android operating system of smartphones is well-suited for localization due to its support of diverse sensors and hardware which enable localization and can collect data on the geographical location through GPS to obtain information on time spent in different environments (Figure 3). GPS satellite data were recorded using the triangulation method (data recorded once per second (1 Hz)). The file with summary information was displayed every 10 s and stored on the phone’s memory card.
Participants were asked to complete a daily diary for one week to record the time they put on or take the phone off, the reasons for not having the phone on and the type of activity that they were doing. In the analysis, these data were used to determine the wear time of the device, to avoid mistakes and inaccuracies when the device is left or not wearied.
GPS coordinates, time, locations, and activities were analyzed and reviewed manually to ensure that the correct activity was assigned. Each individual data point was assigned to one of the six locations/activities and additional contextual information such as MEs was added. Based on the GPS data analysis, six locations/activities (home, work, other indoor, static outdoor, walking, in transit) were identified for each study participant to assess individual time–activity patterns [3,9,12,21,22].
The home and work addresses of the participants were obtained from a questionnaire survey and were geocoded using ArcGIS. Geocoding was performed to obtain latitude and longitude coordinates for each participant’s home and work addresses. Initially, 95% of the records were matched and 5% were left unmatched. All unmatched records were reviewed and corrected, leading to another 5% matched addresses. Data of geographic coordinates and time from smartphones were transferred to ArcGIS software and used for the MEs analysis. A spatial join was performed to assign the attributes of one data layer (geographic coordinates point) to the attributes of the other layers (buildings, streets, pathways). A spatial analysis of the collected data was performed using ArcGIS 10.3 software, topographic and orthophoto maps (http://www.maps.lt/en/) and building (Open Street Map (2014)) layers.
The indoor time was determined by analyzing GPS data with ArcGIS software using buildings, transport network, orthophotos, and other layers. In the analysis, when a person enters a building, the GPS signal disappears, thus setting the starting time indoors and when the person leaves the building, the GPS signal starts up again, thus, setting the end time indoors. A GPS signal is lost in all indoor MEs and while analyzing the building layer it was determined that a person was inside the building.
The time data were summarized to 1-min intervals for each microenvironment (ME) and then one-week (7 days) weekday and weekend average daily minutes spent in each ME were computed. Time indoors as an outcome was categorized into two groups: lower than the median (a reference group) and higher than the median. The median value was 22.3 h, the minimum and maximum time spent indoors was 12.28 and 23.54 h, respectively. There was no missing data in the outcome.

2.3. The Assessment of Individual Characteristics and Other Factors among Adults

The standardized questionnaire included questions on demographics, socioeconomic factors, physical activity (walking in leisure time, bicycle use), car disposal, smoking habits, health status (chronic diseases), and other variables. Questions were derived from existing and validated questionnaires, some of which were adapted for specific study objectives. We also asked the study participants to report their age (<45; 45–64; 65+), gender, marital status (married, divorced, single, or widowed), educational level (secondary school or university degree), occupational status (working full-time; working part-time, student; or unemployed, retired, others), income (lower than average, or higher than average; average income in 2013 in Kaunas city was 825 Eur), body mass index (<25 kg/m2, 25–30 kg/m2, or >30 kg/m2), chronic disease, smoking (non-current smoker, or current smoker), walking in leisure time, bicycle use and car disposal. Residential greenness was identified by questionnaire response about the amount of greenery in the living environment. This variable was coded into binary as very/fairly green living environment and little/not at all.
The noise concentration of each ME for the study participants was assigned using the ArcGIS software. Geographic coordinate data of MEs were spatially joined with average annual noise concentration and noise level for each ME was computed. The Spatial Analyst tool was used for this analysis. The noise concentration values of a raster noise map were extracted based on the GPS points of each MEs and were recorded in the attribute table of an output feature class. The modeled noise map was obtained from Kaunas city municipality. The continuous variables of noise concentration for each ME were categorized into two groups: (1) lower than the median; (2) higher than the median. The median noise concentration value of the home was 49.7 dBA, work = 51.8 dBA, other indoor = 55.9 dBA, outdoor = 56.6 dBA, walking = 55.7 dBA, in transit = 61.4 dBA. Indoor MEs (home, work and other indoor locations) noise concentration was also divided into two groups: (1) lower than the median = <52.6 dBA; (2) higher than the median >52.6 dBA.

2.4. Statistical Analysis

To compare the means for two or more than two groups t-tests, ANOVA and, in the case of small samples or if the data were not normally distributed, a Mann–Whitney U test or Kruskal–Wallis test were performed.
Pre-processing was performed to manage multi-collinearity between independent variables. Firstly, a correlation analysis was performed and the correlation coefficients among the variables were used to identify the presence of multicollinearity. The high correlation coefficients indicate that there is a multicollinearity between variables. Secondly, the collinearity statistics (variance inflation factor and tolerance) were calculated using linear regression models. Thirdly, from two independent variables between which the collinearity was detected and the correlation coefficient was greater than 0.6, only the variable with a stronger correlation with the dependent variable was left in the analysis. Logistic regression models were used to investigate the association between the time spent in different microenvironments, the time spent indoors, and independent variables (gender, age, occupational status, BMI, chronic disease, walking in leisure time, bicycle use, car disposal, residential greenness, noise concentration). The results are presented as odds ratios (ORs) with 95% confidence intervals (CIs). The testing of the statistical hypothesis was done at 0.05 significance level. In this study, the factor was considered a confounder if it changed the adjusted OR estimate from the crude estimate by approximately 10% and based on the significance criterion [23,24,25]. All statistical analyses were performed using the IBM SPSS software version 22.0 (IBM Corp., Armonk, NY, USA, 2013).
The creation of the map, the combination of the data layers, and the other spatial analyses of the collected data were performed using the ArcGIS software (version 10.3) (Esri, Redlands, CA, USA).

3. Results

3.1. Characteristics of Study Participants

Table 1 shows the characteristics of study participants and the percentage distribution of the individual variables. Of the 125 participants who agreed to participate in the smartphone study, 56.0% were women, 37.6% were younger than 45 years of age, and 43.2% were between 45–65 years of age. According to the marital status, 58.4% of participants were married. Participants were highly educated (72.0% with a university degree), 37.6% were working full-time, 28.8% were working part-time, and 33.6% were unemployed, retired, or other, and 58.4% had higher incomes than average. In this sample, 54.1% of the participants had normal BMI, 29.5% were overweight and 16.4% were obese.

3.2. Time-Activity Patterns among the Urban Adult Population

Table 2 shows the average time spent in microenvironments by individual characteristics. By analyzing the time spent in each ME by gender, we found that women spent almost 3% more time (70.9%) at home compared to men (68.1%). This difference may have a substantial impact for exposure assessment, so it should be taken into account in such type of studies and researches. Meanwhile, men were found to spend more time (17.2%) than women (14.2%) at work. The amount of time spent in transit was higher among men than women, 3.6% and 2.5%, respectively. There was a statistically significant difference in the time spent in transit found between genders (U = 1117; p = 0.001).
We also evaluated daily time-activity patterns by different age groups. Tukey HSD test showed that there were statistically significant differences in time spent at home between the oldest age group and the two younger age groups (p < 0.05). People between 45–64 years spent the largest amount of time at work compared to other age groups and this difference was statistically significant compared to those adults who were younger than 45 years (p = 0.0002).
We compared the differences in time spent in each ME among individuals by occupational status. The statistically significant differences in time spent at home, work, outdoor, and walking by occupational status was assessed. A Tukey HSD test showed that differences in time spent at work were statistically significant between all occupational status groups (p < 0.001).
The use of active transport like walking in leisure time and bicycle use had a statistically significant impact on time-activity patterns and are important determinants for assessing exposure.
Average time spent in microenvironments by environmental and other factors is presented in Table 3. A higher noise concentration was statistically significantly associated with less time spent outdoors and in transit (p < 0.05). The day type was statistically significantly (p < 0.05) associated with time spent at home.
Table 4 shows the ORs for the time spent indoors by the different individual variables. A statistical analysis for each independent variable was done separately and adjusted for all statistically significant confounders. After adjustment, the time spent indoors was statistically significantly associated with walking in leisure time, bicycle use, and residential greenness. The highest odds of time spent indoors was found among those adults who did not or rarely engaged in physical activity, such as walking in leisure time (OR = 2.77; CI 1.09–7.05) and bicycle use (OR = 3.86; CI 1.28–11.66) and those who reported that in their living environment there is little or no greenery (OR = 2.84; CI 1.33–6.05).

4. Discussion

The impact of individual characteristics and environmental factors on the daily time-activity patterns and time spent indoors was assessed in an urban population in Kaunas, Lithuania. We examined randomly selected participants from the study population of Kaunas cohort according to their demographic, socioeconomic, environmental, behavioral, and health factors. Our analysis showed that individual-level characteristics have a significant impact on peoples’ behaviors and time-activity patterns. The study results showed that age, occupational status, and gender were the most significant individual factors influencing time-activity patterns. Such behavioral characteristics as walking in leisure time, bicycle use, and car disposal had a statistically significant effect on the time spent walking and in transit. We determined that the most significant environmental variable influencing time spent outdoors and in transit was noise concentration. Overall, the results provide evidence that time management related behavior is influenced by both individual characteristics and environmental factors, thus, these variables should be taken into account when assessing exposure to various factors and evaluating health risks associated with this exposure. Similar results related with factors influencing residential indoor time was obtained by Reference [6]. Day type in both studies was associated with residential indoor time. Yang et al. [6] found that employed, higher age, higher income and male participants spent significantly less time at home on the weekday. The present study results showed similar patterns that men, unemployed, and eldest people tend to spend most of their time at home. However, our study was more focused on the different aspects of behavioral and environmental factors that may influence time-activity patterns, while previous studies restrictively focused on a few microenvironments or evaluated only the influence of demographic and socio-economic factors on time-activity patterns. This is one of the main strengths of this study that the impact of behavioral and environmental factors on time-activity patterns and time spent indoors were evaluated. Additionally, the other strength of this study was that the time-activity patterns were objectively measured using GPS data and tracking participants’ movement continuously throughout the week. Human activities and the characteristics of time-activity patterns are important determinants for personal exposure to environmental factors and future studies are needed to understand these relationships and its effect on exposure assessment.
The study findings indicate that participants, on average, spent 93% of their daily time indoors (70% was spent at home) and only 7% of their time in other MEs such as outdoors, walking, and in transit. These results coincide with Canadian and American human activity pattern surveys [26,27]. Spinazze et al. [28], in a study conducted in Italian urban area, found that people spent most of their time indoors at home. Women spent more of their time in other indoor MEs and at home, whereas men spent more time at work and in transit.
In this study, the factors that influenced the time spent indoors were more explored. The results revealed that behavioral characteristics such as walking in leisure time and bicycle use and residential greenness were highly associated with time spent indoors. These results suggest that the development of green spaces, bicycle paths, and their infrastructure, bicycle-sharing systems, and providing the facilities and open spaces for an active life could increase the time spent outdoors. Therefore, the development of these elements and the improvement of existing ones should be a priority in urban planning and design seeking to ensure an active lifestyle, which is associated with an improvement in overall quality of life and health status.
In term of exposure assessment, the study results suggest that men, younger individuals, and those who work part-time, are unemployed, live active lifestyle, or those who live in better environmental conditions with more greenness and less noise, are more susceptible to exposure misclassification, because these subgroups of the population spend less time indoors and their lifestyle is more active.

Author Contributions

A.D. conceptualized the research and collected data. A.D. and A.M. processed and analyzed data and drafted the manuscript; A.D. contributed in geospatial data capturing, processing and analysis; A.M. analyzed the results and wrote the paper with A.D.; I.Č. helped in data analysis and write-up; R.G. supervised the research and contributed in manuscript improvement.

Funding

This research was funded by the Research Council of Lithuania (grant number: S-MIP-17-14; research project “The impact of sustainable mobility, physical activity and environmental factors on urban population health” in the frame of the Researcher teams’ projects).

Conflicts of Interest

The authors declare no conflict of interest.

References

  1. Nieuwenhuijsen, M.; Paustenbach, D.; Duarte-Davidson, R. New developments in exposure assessment: The impact on the practice of health risk assessment and epidemiological studies. Environ. Int. 2006, 32, 996–1009. [Google Scholar] [CrossRef] [PubMed]
  2. Semple, S. Assessing occupational and environmental exposure. Occup. Med. 2005, 55, 419–424. [Google Scholar] [CrossRef] [PubMed] [Green Version]
  3. Steinle, S.; Reis, S.; Sabel, C.E.; Semple, S.; Twigg, M.M.; Braban, C.F.; Leeson, S.R.; Heal, M.R.; Harrison, D.; Lin, C.; et al. Personal exposure monitoring of PM2.5 in indoor and outdoor microenvironments. Sci. Total Environ. 2015, 508, 383–394. [Google Scholar] [CrossRef] [PubMed]
  4. Buonanno, G.; Stabile, L.; Morawska, L. Personal exposure to ultrafine particles: The influence of time-activity patterns. Sci. Total Environ. 2014, 468–469, 903–907. [Google Scholar] [CrossRef] [PubMed]
  5. Dewulf, B.; Neutens, T.; Lefebvre, W.; Seynaeve, G.; Vanpoucke, C.; Beckx, C.; Van de Weghe, N. Dynamic assessment of exposure to air pollution using mobile phone data. Int. J. Health Geogr. 2016, 15, 1–14. [Google Scholar] [CrossRef] [PubMed] [Green Version]
  6. Yang, W.; Lee, K.; Yoon, C.; Yu, S.; Park, K.; Choi, W. Determinants of residential indoor and transportation activity times in Korea. J. Expo. Sci. Environ. Epidemiol. 2011, 21, 310–316. [Google Scholar] [CrossRef] [PubMed]
  7. Spalt, E.W.; Curl, C.L.; Allen, R.W.; Cohen, M.; Williams, K.; Hirsch, J.A.; Adar, S.D.; Kaufman, J.D. Factors influencing time-location patterns and their impact on estimates of exposure: The Multi-Ethnic Study of Atherosclerosis and Air Pollution (MESA Air). J. Expo. Sci. Environ. Epidemiol. 2016, 26, 341–348. [Google Scholar] [CrossRef] [PubMed]
  8. Matz, C.J.; Stieb, D.M.; Brion, O. Urban-rural differences in daily time-activity patterns, occupational activity and housing characteristics. Environ. Health 2015, 14, 88. [Google Scholar] [CrossRef] [PubMed]
  9. Nethery, E.; Mallach, G.; Rainham, D.; Goldberg, M.S.; Wheeler, A.J. Using Global Positioning Systems (GPS) and temperature data to generate time-activity classifications for estimating personal exposure in air monitoring studies: An automated method. Environ. Health 2014, 13, 33. [Google Scholar] [CrossRef] [PubMed]
  10. Nieuwenhuijsen, M.J. Urban and transport planning, environmental exposures and health-new concepts, methods and tools to improve health in cities. Environ. Health 2016, 15, 38. [Google Scholar] [CrossRef] [PubMed]
  11. De Nazelle, A.; Seto, E.; Donaire-Gonzalez, D.; Mendez, M.; Matamala, J.; Nieuwenhuijsen, M.J.; Jerrett, M. Improving estimates of air pollution exposure through ubiquitous sensing technologies. Environ. Pollut. 2013, 176, 92–99. [Google Scholar] [CrossRef] [PubMed] [Green Version]
  12. Breen, M.S.; Long, T.C.; Schultz, B.D.; Crooks, J.; Breen, M.; Langstaff, J.E.; Isaacs, K.K.; Tan, Y.M.; Williams, R.W.; Cao, Y.; et al. GPS-based microenvironment tracker (MicroTrac) model to estimate time-location of individuals for air pollution exposure assessments: Model evaluation in central North Carolina. J. Expo. Sci. Environ. Epidemiol. 2014, 24, 412–420. [Google Scholar] [CrossRef] [PubMed]
  13. Kelly, P.; Krenn, P.; Titze, S.; Stopher, P.; Foster, C. Quantifying the Difference Between Self-Reported and Global Positioning Systems-Measured Journey Durations: A Systematic Review. Transp. Rev. 2013, 33, 443–459. [Google Scholar] [CrossRef] [Green Version]
  14. Houston, D.; Luong, T.T.; Boarnet, M.G. Tracking daily travel; Assessing discrepancies between GPS-derived and self-reported travel patterns. Transp. Res. C Emerg. Technol. 2014, 48, 97–108. [Google Scholar] [CrossRef]
  15. Ribeiro, M.D.; Larrañaga, A.M.; Arellana, J.; Cybis, H.B.B. Influence of GPS and Self-reported Data in Travel Demand Models. Procedia Soc. Behav. Sci. 2014, 162, 467–476. [Google Scholar] [CrossRef]
  16. Duan, N. Models for human exposure to air pollution. Environ. Int. 1982, 8, 305–309. [Google Scholar] [CrossRef]
  17. Lim, S.; Salmond, J.A.; Dirks, K.N. Influence of Differing Microenvironments on Personal Carbon Monoxide Exposure in Auckland, New Zealand. Open Atmos. Sci. J. 2015, 9, 1–8. [Google Scholar] [CrossRef]
  18. Rabinovitch, N.; Adams, C.D.; Strand, M.; Koehler, K.; Volckens, J. Within-microenvironment exposure to particulate matter and health effects in children with asthma: A pilot study utilizing real-time personal monitoring with GPS interface. Environ. Health. 2016, 15, 96. [Google Scholar] [CrossRef] [PubMed]
  19. Sarigiannis, D.A. Combined or multiple exposure to health stressors in indoor built environments. In Proceedings of the An Evidence-based Review Prepared for the WHO Training Workshop “Multiple Environmental Exposures and Risks”, Bonn, Germany, 16–18 October 2013; World Health Organization Regional Office for Europe: Copenhagen, Denmark, 2014; p. 82. [Google Scholar]
  20. Schweizer, C.; Edwards, R.D.; Bayer-Oglesby, L.; Gauderman, W.J.; Ilacqua, V.; Jantunen, M.J.; Lai, H.K.; Nieuwenhuijsen, M.; Künzli, N. Indoor time–microenvironment–activity patterns in seven regions of Europe. J. Expo. Sci. Environ. Epidemiol. 2006, 17, 170–181. [Google Scholar] [CrossRef] [PubMed] [Green Version]
  21. Kim, T.; Lee, K.; Yang, W.; Yu, S.D. A new analytical method for the classification of time-location data obtained from the global positioning system (GPS). J. Environ. Monit. 2012, 14, 2270–2274. [Google Scholar] [CrossRef] [PubMed]
  22. Wu, J.; Jiang, C.; Houston, D.; Baker, D.; Delfino, R. Automated time activity classification based on global positioning system (GPS) tracking data. Environ. Health 2011, 10, 101. [Google Scholar] [CrossRef] [PubMed]
  23. Groenwold, R.H.H.; Klungel, O.H.; Grobbee, D.E.; Hoes, A.W. Selection of confounding variables should not be based on observed associations with exposure. Eur. J. Epidemiol. 2011, 26, 589–593. [Google Scholar] [CrossRef] [PubMed] [Green Version]
  24. Lee, P.H. Is a Cutoff of 10% Appropriate for the Change-in-Estimate Criterion of Confounder Identification? J. Epidemiol. 2014, 24, 161–167. [Google Scholar] [CrossRef] [PubMed] [Green Version]
  25. Lee, P.H. Should we adjust for a confounder if empirical and theoretical criteria yield contradictory results? A simulation study. Sci Rep. 2014, 4, 6085. [Google Scholar] [CrossRef] [PubMed]
  26. Klepeis, N.E.; Nelson, W.C.; Ott, W.R.; Robinson, J.P.; Tsang, A.M.; Switzer, P.; Behar, J.V.; Hern, S.C.; Engelmann, W.H. The National Human Activity Pattern Survey (NHAPS): A resource for assessing exposure to environmental pollutants. J. Expo. Sci. Environ. Epidemiol. 2001, 11, 231–252. [Google Scholar] [CrossRef] [PubMed]
  27. Matz, C.J.; Stieb, D.M.; Davis, K.; Egyed, M.; Rose, A.; Chou, B.; Brion, O. Effects of Age, Season, Gender and Urban-Rural Status on Time-Activity: Canadian Human Activity Pattern Survey 2 (CHAPS 2). Int. J. Environ. Res. Public Health 2014, 11, 2108–2124. [Google Scholar] [CrossRef] [PubMed]
  28. Spinazze, A.; Cattaneo, A.; Peruzzo, C.; Cavallo, D.M. Modeling Population Exposure to Ultrafine Particles in a Major Italian Urban Area. Int. J. Environ. Res. Public Health 2014, 11, 10641–10662. [Google Scholar] [CrossRef] [PubMed] [Green Version]
Figure 1. The study design.
Applsci 08 02007 g001
Figure 2. The waist belt for the smartphone.
Applsci 08 02007 g002
Figure 3. The GPS tracking data of one participant (different colors represents different microenvironments); background shading is the orthophoto map of Kaunas city.
Applsci 08 02007 g003
Table 1. The characteristics of the study participants (N = 125).
CharacteristicNumberPercentage
Age
 <454737.6
 45–645443.2
 65+2419.2
Gender
 Male5544.0
 Female7056.0
Marital status
 Married7358.4
 Divorced1713.6
 Single2721.6
 Widowed86.4
Education level
 Secondary school3528.0
 University degree9072.0
Occupational status
 Working full-time4737.6
 Working part-time, student3628.8
 Unemployed, retired, or other4233.6
Income
 Lower than average5241.6
 Higher than average7358.4
Ethnic group
 Lithuanian12196.8
 Other43.2
Body mass index
 Normal weight (<24.9)6654.1
 Overweight (25.0–29.9)3629.5
 Obese (>30.0)2016.4
Chronic disease
 No5846.4
 Yes6753.6
Table 2. The average time (%) spent in microenvironments by individual characteristics.
VariableHomeWorkOther IndoorOutdoorWalkingIn Transit
Gender
 Men68.117.27.01.72.43.6
 Women70.914.28.41.42.62.5
p between groups0.8430.1450.4560.046 *0.3630.001 *
Age
 <4571.912.18.41.82.83.0
 45–6465.819.77.71.22.23.4
 65+77.38.76.92.02.82.3
p between groups0.012 *0.000 *0.6090.4720.049 *0.075
Occupational status
 Working full-time64.320.28.91.02.13.3
 Working part-time74.810.17.41.92.93.0
 Unemployed, retired, others83.40.08.42.13.03.1
p between groups0.000 *0.000 *0.8980.009 *0.037 *0.709
BMI
 <3070.314.87.71.62.73.1
 ≥3067.717.58.21.52.13.0
p between groups0.4430.7860.7430.9420.2960.982
Chronic diseases
 No70.114.58.51.62.52.8
 Yes69.216.57.11.52.53.2
p between groups0.4330.2080.5160.8270.8900.191
Walking in leisure time
 Yes70.814.27.71.62.82.9
 No67.618.37.41.41.93.5
p between groups0.9880.035 *0.8630.3350.004 *0.432
Bicycle use
 Often66.717.07.42.02.74.2
 Seldom70.614.97.91.42.52.7
p between groups0.6420.4710.9360.0760.7840.000 *
Car disposal
 No70.613.58.91.43.02.5
 Yes69.516.27.21.62.23.3
p between groups0.2950.2730.3990.9290.003 *0.119
* p < 0.05
Table 3. The average time (%) spent in microenvironments by environmental and other factors.
VariableHomeWorkOther IndoorOutdoorWalkingIn Transit
Residential greenness
 Very/fairly68.915.97.21.72.83.5
 Little/not at all70.814.78.31.52.32.6
p between groups0.2400.8720.4750.5520.0980.056
Noise concentration
 Lower than median74.215.08.92.12.63.6
 Higher than median70.416.67.21.12.62.7
p between groups0.1620.4630.1970.009 *0.8800.032 *
Day type
 Working day66.218.97.51.82.43.2
 Weekend67.316.59.21.62.62.8
p between groups0.000 *0.4230.0830.3340.4210.551
* p < 0.05
Table 4. The crude and adjusted odds ratios and 95% confidence intervals for time spent indoors and associated factors.
VariableCrude OR95% CIAdjusted OR95% CI
Gender
 Men1 1
 Women1.440.70–2.941.110.47–2.58
Age
 <451 1
 45–640.890.41–1.950.880.39–2.01
 65+1.150.42–3.181.200.41–3.51
Occupational status
 Working full-time 1 1
 Working part-time 0.650.27–1.550.790.30–2.06
 Unemployed, retired, others0.810.35–1.880.890.36–2.20
BMI
 <301 1
 ≥300.800.31–2.100.600.19–1.84
Chronic disease
 No1 1
 Yes0.610.30–1.250.380.14–1.04
Walking in leisure time
 Yes1 1
 No2.140.94–4.882.77 *1.09–7.05
Bicycle use
 Often1 1
 Seldom3.32 *1.20–9.183.86 *1.28–11.66
Car disposal
 No1 1
 Yes0.960.46–2.001.360.59–3.16
Residential greenness
 Very/fairly1 1
 Little/not at all2.80 *1.35–5.822.84 *1.33–6.05
Noise concentration
 Lower than median1 1
 Higher than median1.970.97–4.011.760.84–3.72
* p < 0.05; adjusted for: age, bicycle use, residential greenness, noise concentration.

