Article

Microscopic Elastic and Plastic Inhomogeneous Deformations and Height Changes on the Surface of a Polycrystalline Pure-Titanium Plate Specimen under Cyclic Tension

Graduate School of Natural Science and Technology, Okayama University, 3-1-1 Tsushimanaka, Kita-ku, Okayama 700-8530, Japan
*
Author to whom correspondence should be addressed.
Appl. Sci. 2018, 8(10), 1907; https://doi.org/10.3390/app8101907
Submission received: 18 August 2018 / Revised: 7 October 2018 / Accepted: 9 October 2018 / Published: 13 October 2018
(This article belongs to the Special Issue Multiscale Fatigue Design)

Abstract

:

Featured Application

Evaluation of critical parts of the mechanical components in polycrystalline metals, including thin sheets and wires. Application to ceramics, coatings, and various types of composites is under investigation.

Abstract

A cyclic tensile test was carried out using a plate specimen of commercial pure titanium on a digital holographic microscope stage. Microscopic deformation of the grains was observed, and their height distribution was measured on the specimen surface. Each grain showed nanoscopic movement up and down, as well as reverse movement corresponding to specimen loading and unloading. We suggest that the different grain-specific changes in height were caused by microscopic inhomogeneities in the material, such as differences in the crystal orientation and geometries of both the surface and subsurface grains. Changes in grain height increased with tensile load, and a strong relationship was found between the height changes that occurred under elastic and plastic conditions. This suggests that microscopic plastic deformation is predictable from microscopic elastic deformation. In order to investigate the plastic deformation of grains in more detail, slip-line angles were measured after the tensile test. We found slip lines with similar angles in neighboring grains, suggesting that the plastic deformation of grains was not independent, but rather was related to that of surrounding grains and influenced by the deformation of subsurface grains.

1. Introduction

Because industrial metals are usually composed of a large number of crystal grains with anisotropic elasticity and plasticity, an inhomogeneous microscopic deformation occurs as a result of external mechanical loads and internal thermal stresses. The development of inhomogeneous deformation causes various damages, such as localized plastic deformation, surface roughness, microcracking, and necking. It is therefore important to investigate microscopic elastic and plastic deformation behaviors. Recently, experimental and analytical methods for inhomogeneous deformation of metals have progressed remarkably. The first is the electron backscatter diffraction (EBSD) method, by which the distribution of crystal orientation on the surface of the specimen is acquired [1]. The misorientation of each grain and the Schmid factor, which is defined as the normalized shear stress on a slip plane assuming that the stress is uniform throughout the material, are good indicators of the activity of crystallographic slip. The second one is the digital image correlation (DIC) method. The strain on surface grains can be evaluated based on the digital images acquired before and after deformation [2]. Currently, DIC is widely used as a powerful contactless method for the evaluation of the deformation of materials. The third method is crystal plasticity finite element (CPFE) analysis [3]. If the geometry and crystal orientation of grains are known, it is possible to simulate their elastic and plastic deformation with CPFE analysis, where the elastic deformation is expressed by the generalized Hooke’s law, and the plastic deformation is assumed to occur by a combination of crystallographic slips on planes with high-resolved shear stress.
Several studies have used these methods. For example, Zhao et al. carried out tensile tests on dog-bone aluminum specimens with enlarged crystal grains, and simulated the microscopic deformation behavior using the three-dimensional CPFE analysis [4]. As the number of grains in the specimen was not very large, the crystal orientation and geometry of all grains in the specimen were measured and modeled. Deformation and surface roughness were well simulated by the analysis, but the agreement was not perfect. The main reason for the difference seems to be imperfect modeling of grain geometry inside the specimen, which caused variable stress distribution in the material.
Regarding normal polycrystalline metals, complete three-dimensional measurement and analysis of grains is still very difficult. Wang et al. simulated the heterogeneous deformation of pure titanium using the CPFE method [5,6]. The crystal orientation of surface grains was measured using the EBSD method, and a quasi-three-dimensional model was generated. Microscopic plastic deformation and slip activities were also simulated. However, the agreement was unsatisfactory because the simulation did not consider the crystal orientation or geometries of grains underneath the specimen surface. The importance of subsurface grains in the deformation of surface grains has also gained attention due to precursory finite element analyses by Abe et al. [7]. More-accurate comparisons between the CPFE method and experiments, using high-resolution DIC, were performed for small specimens of tantalum oligocrystals by Lim et al. [8]. It was concluded that an accurate reproduction of the initial microstructure and proper modeling of the grain boundary properties are very important for simulating the deformation behavior of oligocrystals, including the regions adjacent to the grain boundaries.
Recently, DIC has been used for small specimens deformed in the scanning electron microscope (SEM) [9,10,11,12]. High-resolution SEM images enable us to evaluate the in-plane strain tensors of specimen surfaces during loading. Further, crystallographic investigations are also possible, with the help of EBSD data. Various methods for minimization of image distortion and noise reduction have been proposed, which have greatly improved accuracy. Both plastic and elastic strain have been evaluated on the surface of a nickel-based superalloy [12]. However, the high-resolution method can be applied to a specimen loaded in the vacuum chamber of an SEM.
On the other hand, optical-DIC has also been used to identify the deformation of various materials in air. Meso-scale plastic deformations of carbon steel [13] and pure titanium [14] specimens were investigated in detail. Strain heterogeneity and localization were evaluated and the effect of the representative volume element (RVE) size on the results was discussed. Furthermore, the three-dimensional digital image correlation (3D-DIC) method was applied to biological specimens [15] and the carbon fiber reinforced composite [16]. Though application of the conventional (two-dimensional) DIC is limited to the materials with negligible out-of-plane motion, 3D-DIC is applicable when considerable out-of-plane displacements are present.
Similar analysis has been applied to the development of surface roughness during metal forming by Furusawa et al. [17]. Two- and three-dimensional finite element simulations, using a number of square and cubic grains with different flow stresses, were performed. The results showed that surface roughness increased with an equivalent strain in both uniaxial and biaxial tensions, and analyses were well simulated. It was also found that grain size and the distribution of flow stress strongly influenced the development of surface roughness. In this case, the drastic simplification of the shapes and constitutive equations of grains made it possible to carry out simulations of whole polycrystalline specimens.
Combined, recent studies on the inhomogeneous deformation and surface roughness of polycrystalline metals indicate that it is still difficult to investigate grain deformation when considering the three-dimensional geometries and crystal orientation of subsurface and interior grains. In an attempt to address this, we measured the changes in the nanoscopic height distribution of grains on the surface of pure titanium [18,19] and pure copper [20] specimens under monotonic tension in air. We found that the microscopic inhomogeneity of surface grains appeared as a small change in the height distribution, and that this shift in height distribution under plastic deformation was strongly correlated with that under elastic deformation. A new non-destructive method, using a change in surface profile caused by a small external load, was also proposed [21,22,23], which is expected to facilitate the detection of small cracks initiated on the inner surface of the cooling passage of a turbine blade.
In this paper, a cyclic tensile test is performed using a plate specimen of commercial pure titanium on a digital holographic microscope stage, and the height distribution is measured in a fixed area on the specimen surface. The results obtained are compared with those from a monotonic tension test [19]. We confirm that the strong correlation between elastic and plastic microscopic deformations seen under monotonic tension was also observed under cyclic tension. In addition, grain slip lines were observed after the test, and we discuss the overall plastic deformation behavior of surface grains.

2. Experimental Procedures

2.1. Specimen and Tensile Test

A plate of commercial pure titanium (CP-Ti) with a purity of 99.5 wt% was used. The shape and size of the specimen is shown in Figure 1. The length and width of its parallel segment were 18 mm and 3 mm, respectively. The surface of the specimen was mechanically polished using emery paper of #800 to #1500, heat-treated at 1143 K (870 °C) for 2 h in a vacuum, then subjected to furnace cooling. Finally, the specimen was electropolished at 218 K (−55 °C) with methanol solution (300 mL), 2-butoxyethanol (180 mL), and 70% perchloric acid (30 mL), then chemically etched with a solution of distilled water (20 mL), nitric acid (1 mL), and hydrofluoric acid (2 mL). The final cross-sectional area of the specimen was 2.81 mm2. The tensile test was performed using a compact-type tension–compression material-testing machine IMC-90F1 with a load capacity of 2 kN, manufactured by Imoto Machinery Co., Ltd., Kyoto, Japan. The machine was set up on the digital holographic microscope stage, and the height distribution on the specimen surface was acquired during tension hold and the following unloading conditions: The tensile load was increased and decreased manually by turning a handle, and kept constant during measurements; and the load was increased stepwise to the values shown in Table 1. Tensile load and load-point displacement were measured using a load cell and dial gauge, respectively. In order to evaluate the macroscopic strain around the observation area, two pairs of grain-boundary triple points, separated by a distance of about 500 μm, were chosen, and the average nominal strain between them was evaluated. The strain evaluated, using these triple-point pairs, was less than 0.2% at the fourth step, but increased greatly at the fifth step, as shown in Table 1. It was considered that the specimen was under elastic conditions until the fourth load step, and then transitioned into the plastic condition on the fifth step.

2.2. Digital Holographic Microscope and Digital Height Correlation Method (DHCM)

The height distribution on the surface of the specimen was acquired using a reflection-configured digital holographic microscope, the R1100, manufactured by Lyncee Tec, Lausanne, Switzerland. The location of the evaluation area at different load steps was identified using the digital height correlation method (DHCM) [14,15,16], which identifies the same location before and after deformation, with reference to nanoscopic natural undulations. Because such undulations exist on most material surfaces, even after surface treatments such as very fine mechanical polishing and electropolishing, this method can be used for location identification in a wide range of cases.

2.3. Observation Area and Average Height of Grains

The specimen surface after the tensile test is shown in Figure 2. A fixed square area of 816 × 816 μm2 was set on the specimen’s surface for observation and measurement of the height distribution at each load step. The average grain diameter, as assessed using the planimetric procedure, was 78.1 μm. We chose 81 grains for observation (Figure 2).
The average height (hm) was evaluated for 61 out of 81 grains in the observation area using the following equation:
h m = 1 n 2 i = 1 n j = 1 n h ( x i , y j ) ,
where hm is the average height of a region of 21 × 21 pixels set around the center grain. The red squares in Figure 2 indicate the evaluation points. The reason for excluding 20 grains was that the location of their height evaluation point was not well identified in one of the load steps. The height distribution obtained at each load step was standardized so that the average height in the total 816 × 816 μm2 area became zero. A simple tilt correction was also applied. Therefore, the height in the present study was not absolute, but relative, in which the macroscopic sink due to the Poisson effect in the elastic deformation and the conservation of volume in the plastic deformation was eliminated.
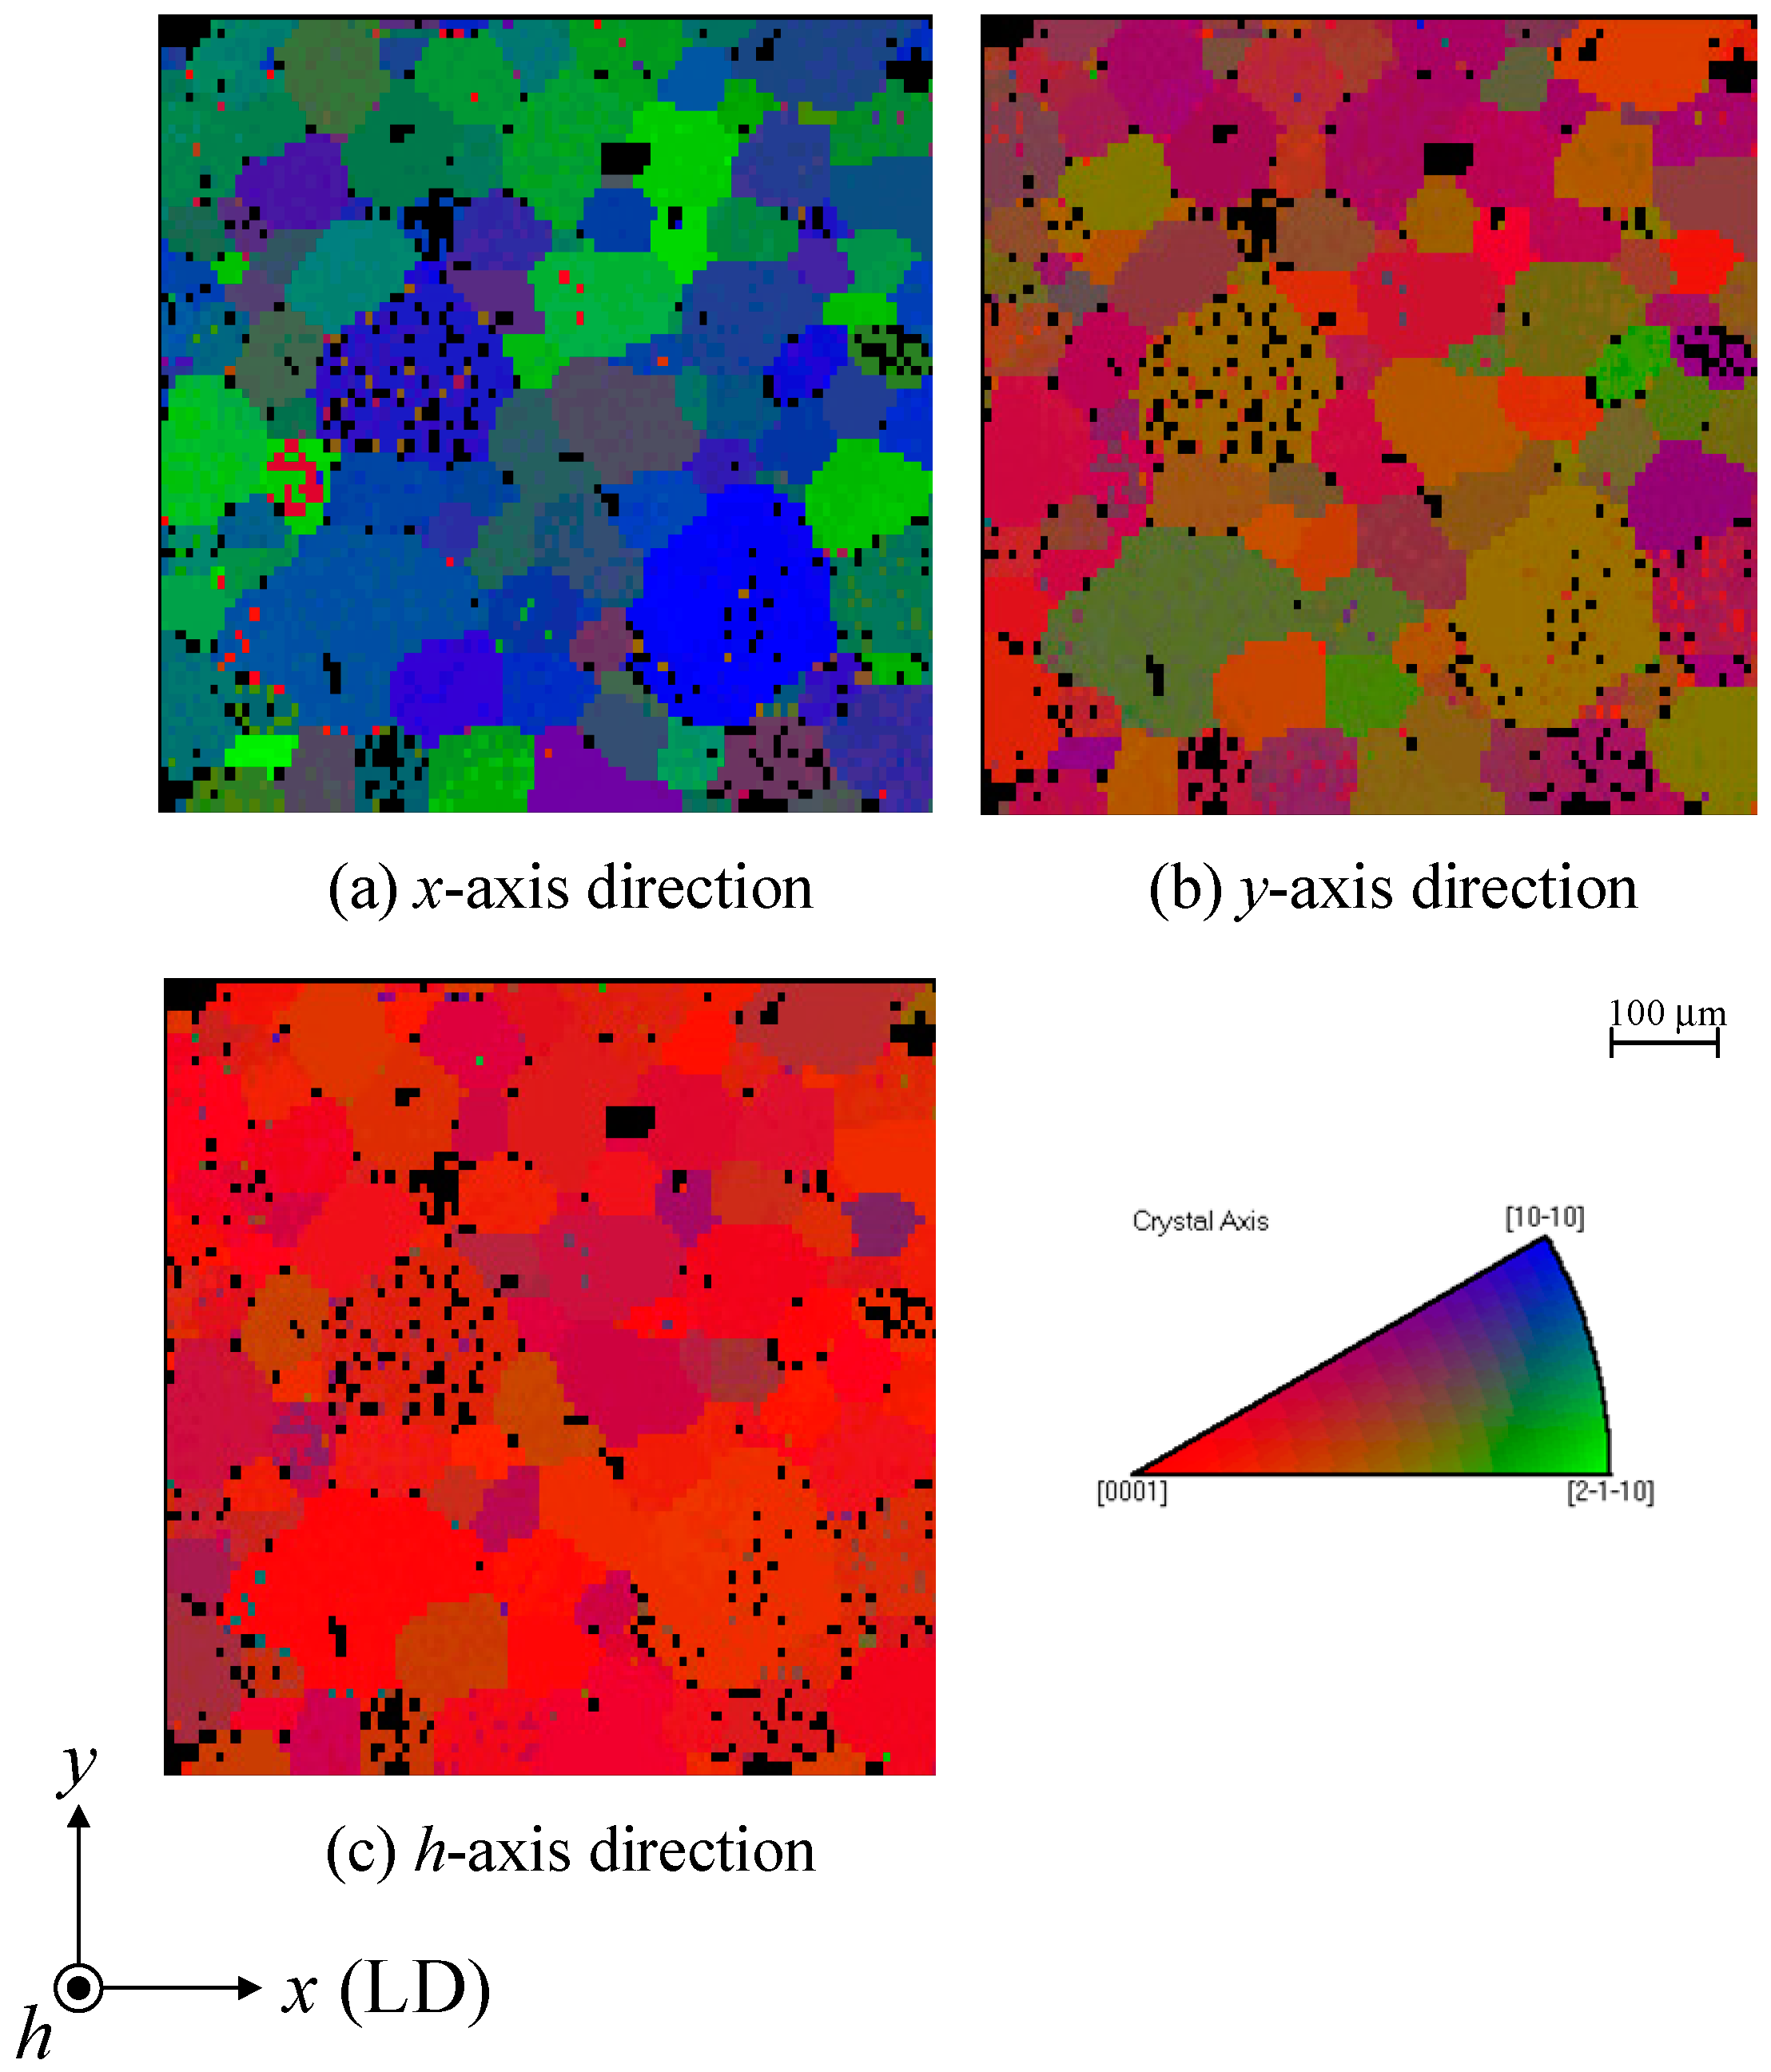
The crystal-orientation map after the tensile test, which was acquired using an S-3500N SEM (Hitachi, Tokyo, Japan) and the Link OPAL System (Oxford Instruments, Abingdon, Oxon, UK), is shown in Figure 3. The c-axis of the hexagonal closed-pack structure was nearly perpendicular to the specimen surface, which is a common rolling texture of pure titanium.

3. Results and Discussion

3.1. Height Distribution in the Observation Area

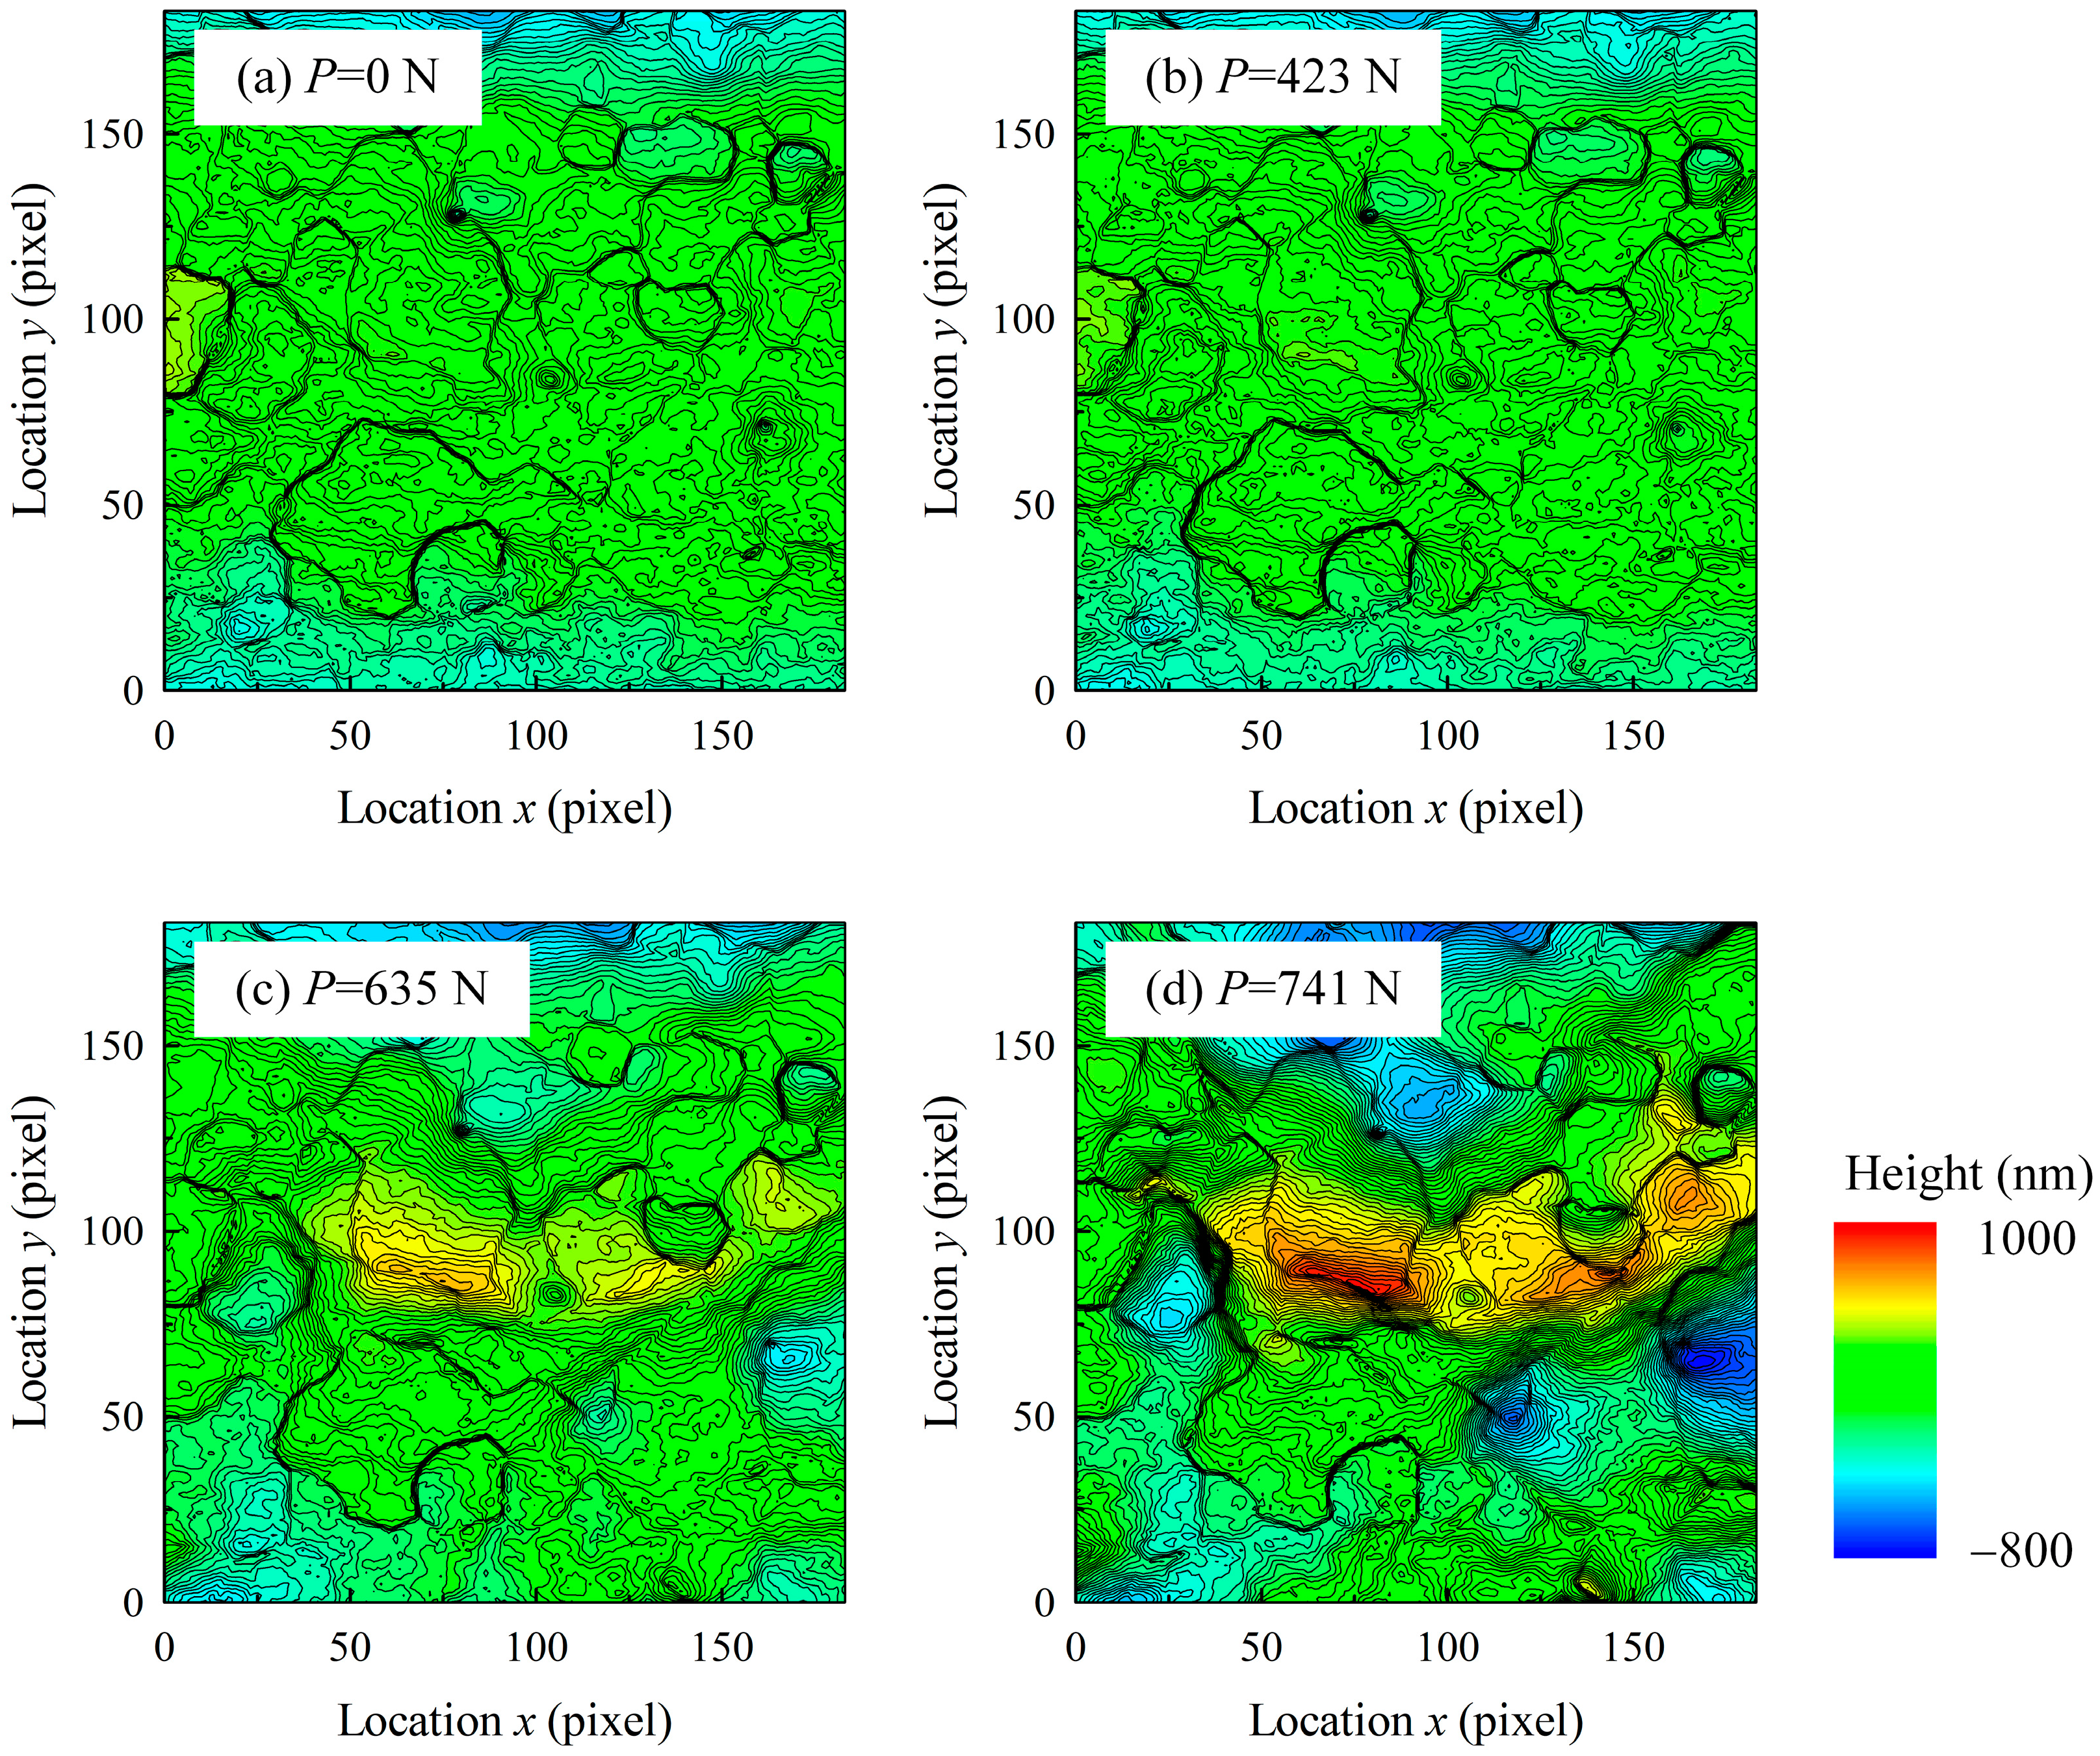
The height distribution in the observation area of the specimen surface at four of the tension-hold load steps is shown in Figure 4. To enhance the visualization, the heights of 3 × 3 pixels were averaged and unified into one pixel. The first (P = 317 N) and third (P = 423 N) load steps were macroscopically elastic conditions, while the fifth (P = 635 N) and seventh (P = 741 N) steps were plastic conditions, as previously mentioned. Little change was observed between the zero (P = 0 N) and third (P = 423 N) load steps. However, a large change was observed at the fifth (P = 635 N) and seventh (P = 741 N) load steps, where raised and sunken regions are indicated as red and blue areas in Figure 4, respectively. The large undulations generated at the fifth and seventh load steps reflect the inhomogeneous microscopic plastic deformation of the specimen surface. Because the microscopic inhomogeneity at the first and third load steps was very small, and is not very clear in Figure 4, it was examined in the next section using the change in average height, as defined by Equation (1).

3.2. Change in Average Height of Grains under Elastic and Plastic Conditions

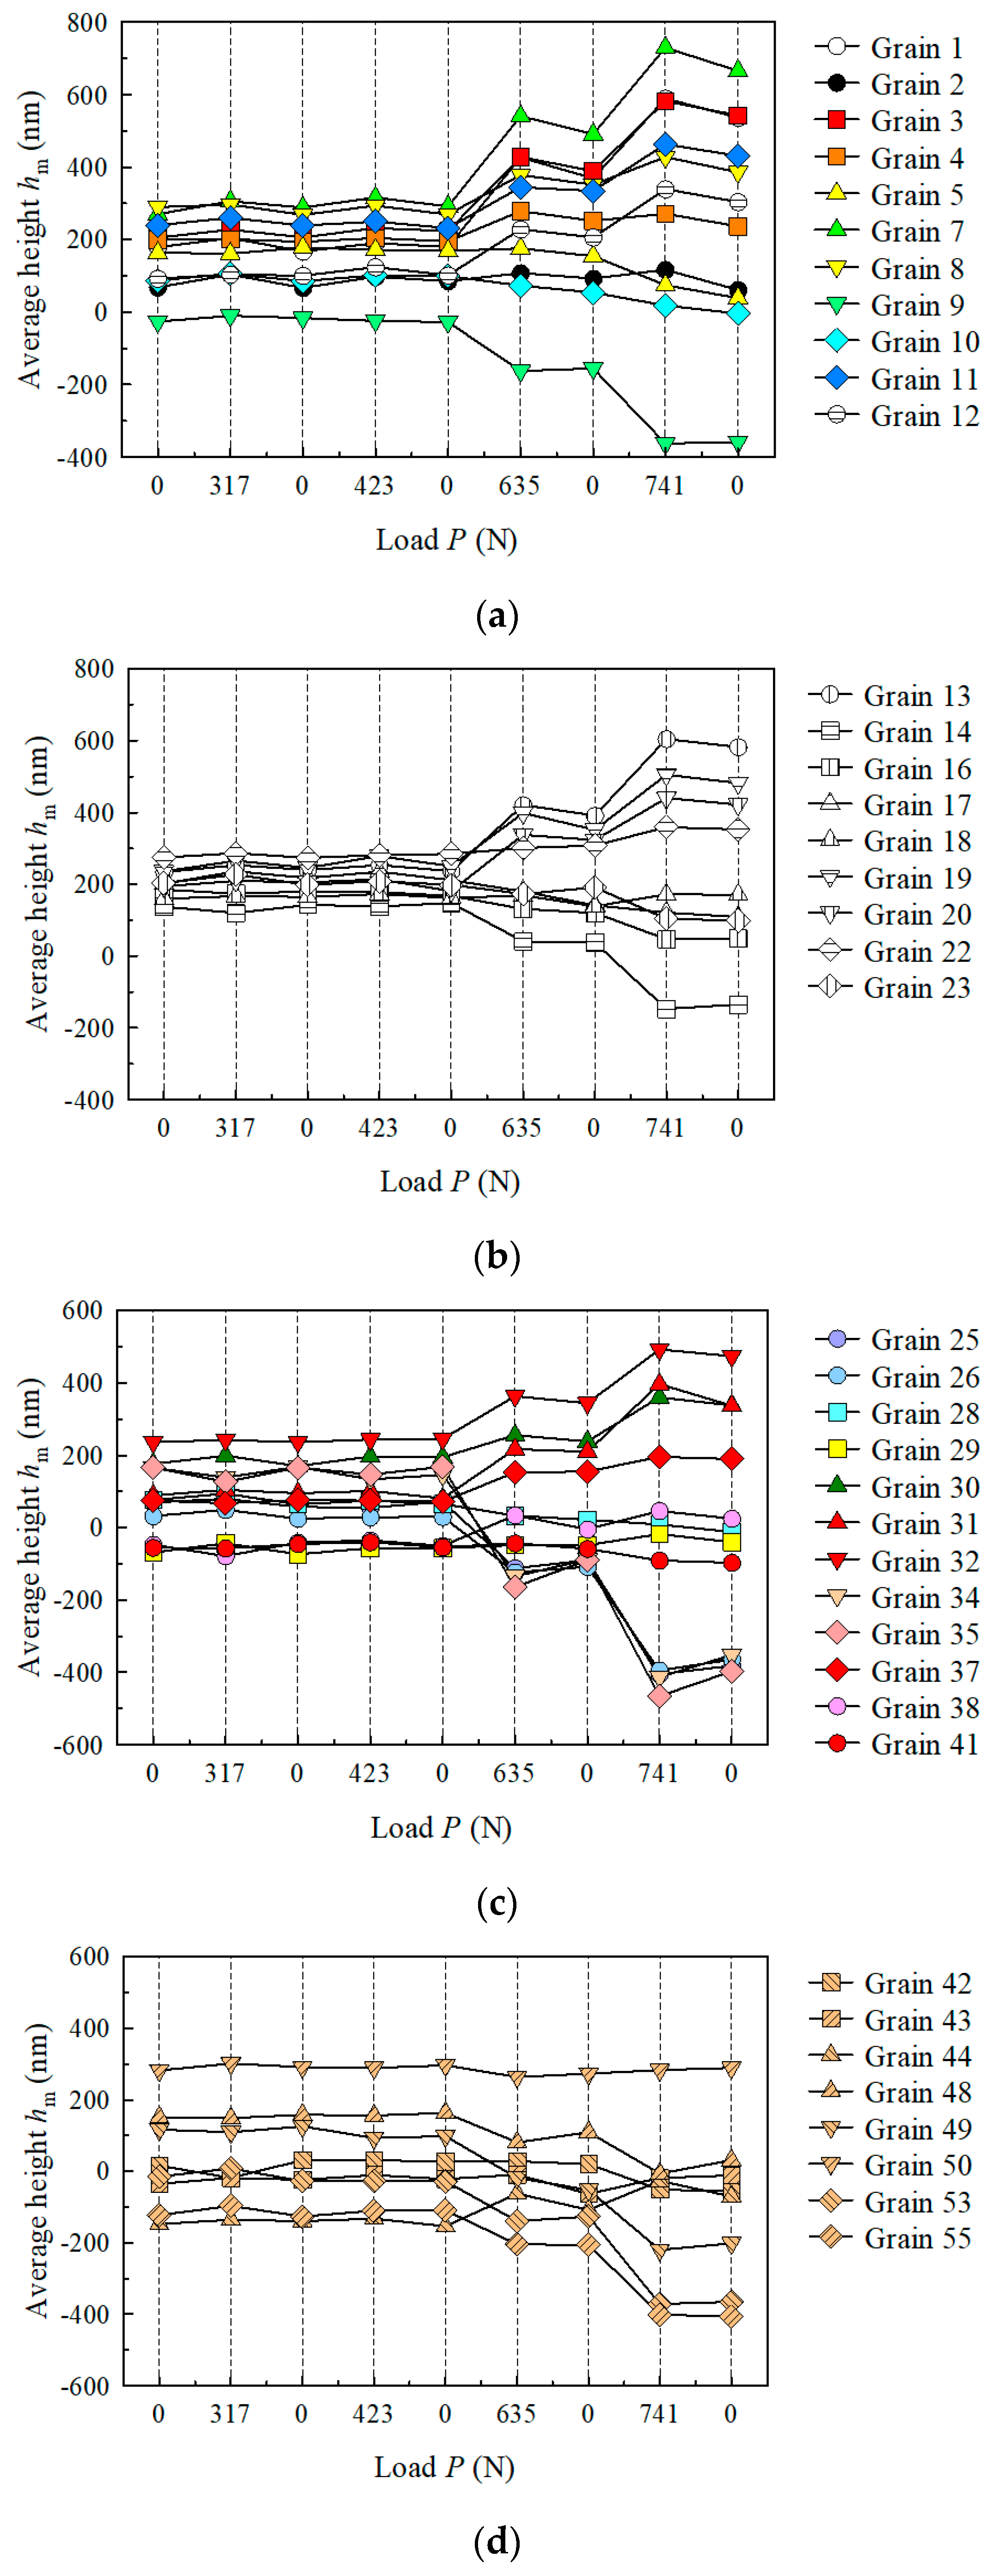
The change in the average height of each grain is shown in Figure 5. The initial average height was varied, because of the surface treatment before the tensile test. Small increases and decreases occurred until the fourth elastic load step, but hm values changed substantially at, and after, the fifth load step, which corresponded to the macroscopic plastic conditions. With respect to the change in height between loading and unloading, all grains showed opposite movements (rising and then sinking or vice versa) during loading and unloading, respectively, and this continued under the macroscopic plastic loading conditions. The extent of these movements increased substantially at the beginning of the plastic deformation stage. These random height-change behaviors of the grains were caused by microscopic inhomogeneous elastic and plastic deformations. The microscopic inhomogeneity was attributed to the crystal orientation and geometry of both surface and subsurface grains.
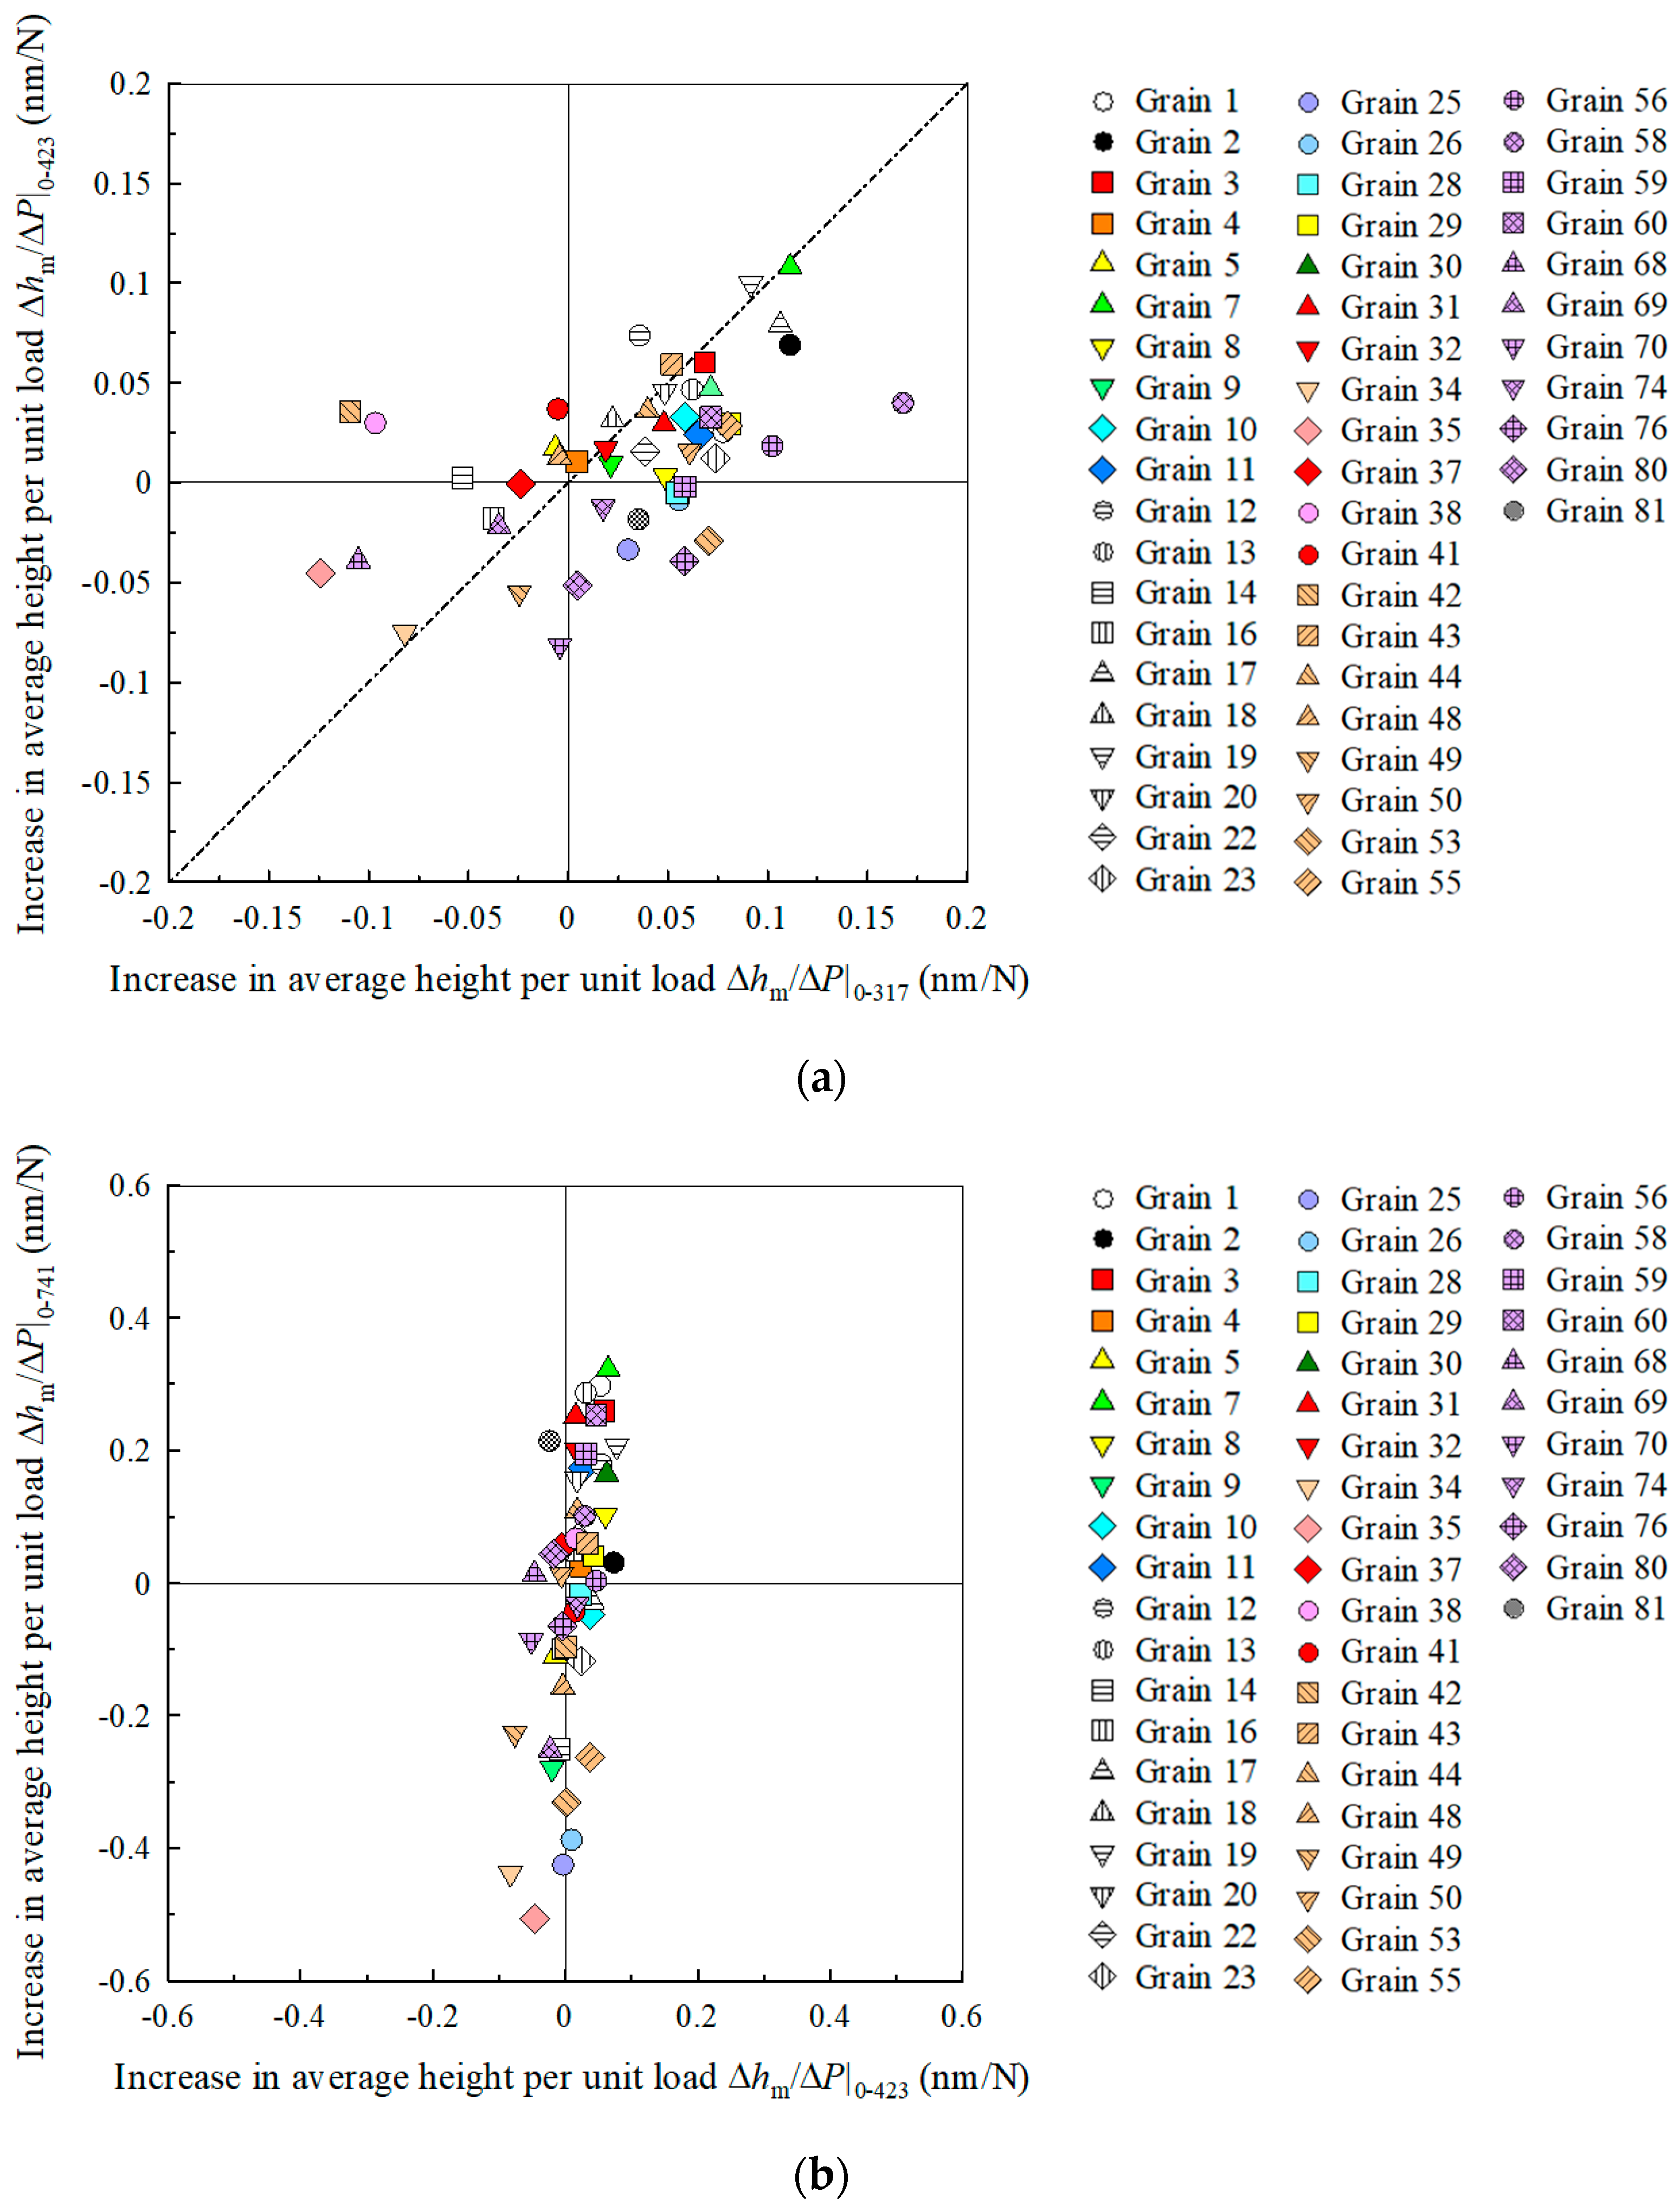
The change in the average height per unit load, ΔhmP, is shown in Figure 6 for different combinations of load steps. Figure 6a shows the relationship between the first (P = 317 N) and third (P = 423 N) load steps, and Figure 6b shows the relationship between the third and seventh (P = 741 N) load steps. The term Δhm is the difference between the height at the tension-hold and during the unloaded conditions immediately prior to that. Although there was a certain amount of scatter in the plots, there was a positive correlation in ΔhmP between the two load steps represented in Figure 6a. The relatively large scatter was due to measurement error and inhomogeneous deformation within the grains. The following outcomes arose from this result: (a) Grains on the surface did not deform uniformly, even under elastic conditions, which was caused by anisotropic elasticity based on crystal orientation and grain geometry; and (b) each grain deformed linearly under elastic conditions, which was easily predicted by linear elastic theory. Figure 6b shows there was a similar strong correlation between ΔhmP at the third and seventh load steps. Considering that the abscissa and the ordinate represent the data under elastic and plastic conditions, respectively, it can be concluded that microscopic inhomogeneity under plastic conditions was related to that under elastic conditions. Similar results were obtained for monotonic tensile tests of pure titanium [19] and pure copper [20] specimens. The average height change per unit tensile load is thought to reflect all the microstructural factors influencing microscopic deformation, such as the geometries and crystal orientation of surface and subsurface grains, and grain boundary properties. In addition, considering that localization of plastic deformation and fracture first occur in a stress–strain concentrated area, the strong relationship between the microscopic height change under elastic and plastic conditions seems to be reasonable. This positive relationship between elastic and plastic height change will be useful for predicting plastic behavior or fatigue crack initiation from elastic height change [25].

3.3. Plastic Deformation of Grains, and Slip Line Angles

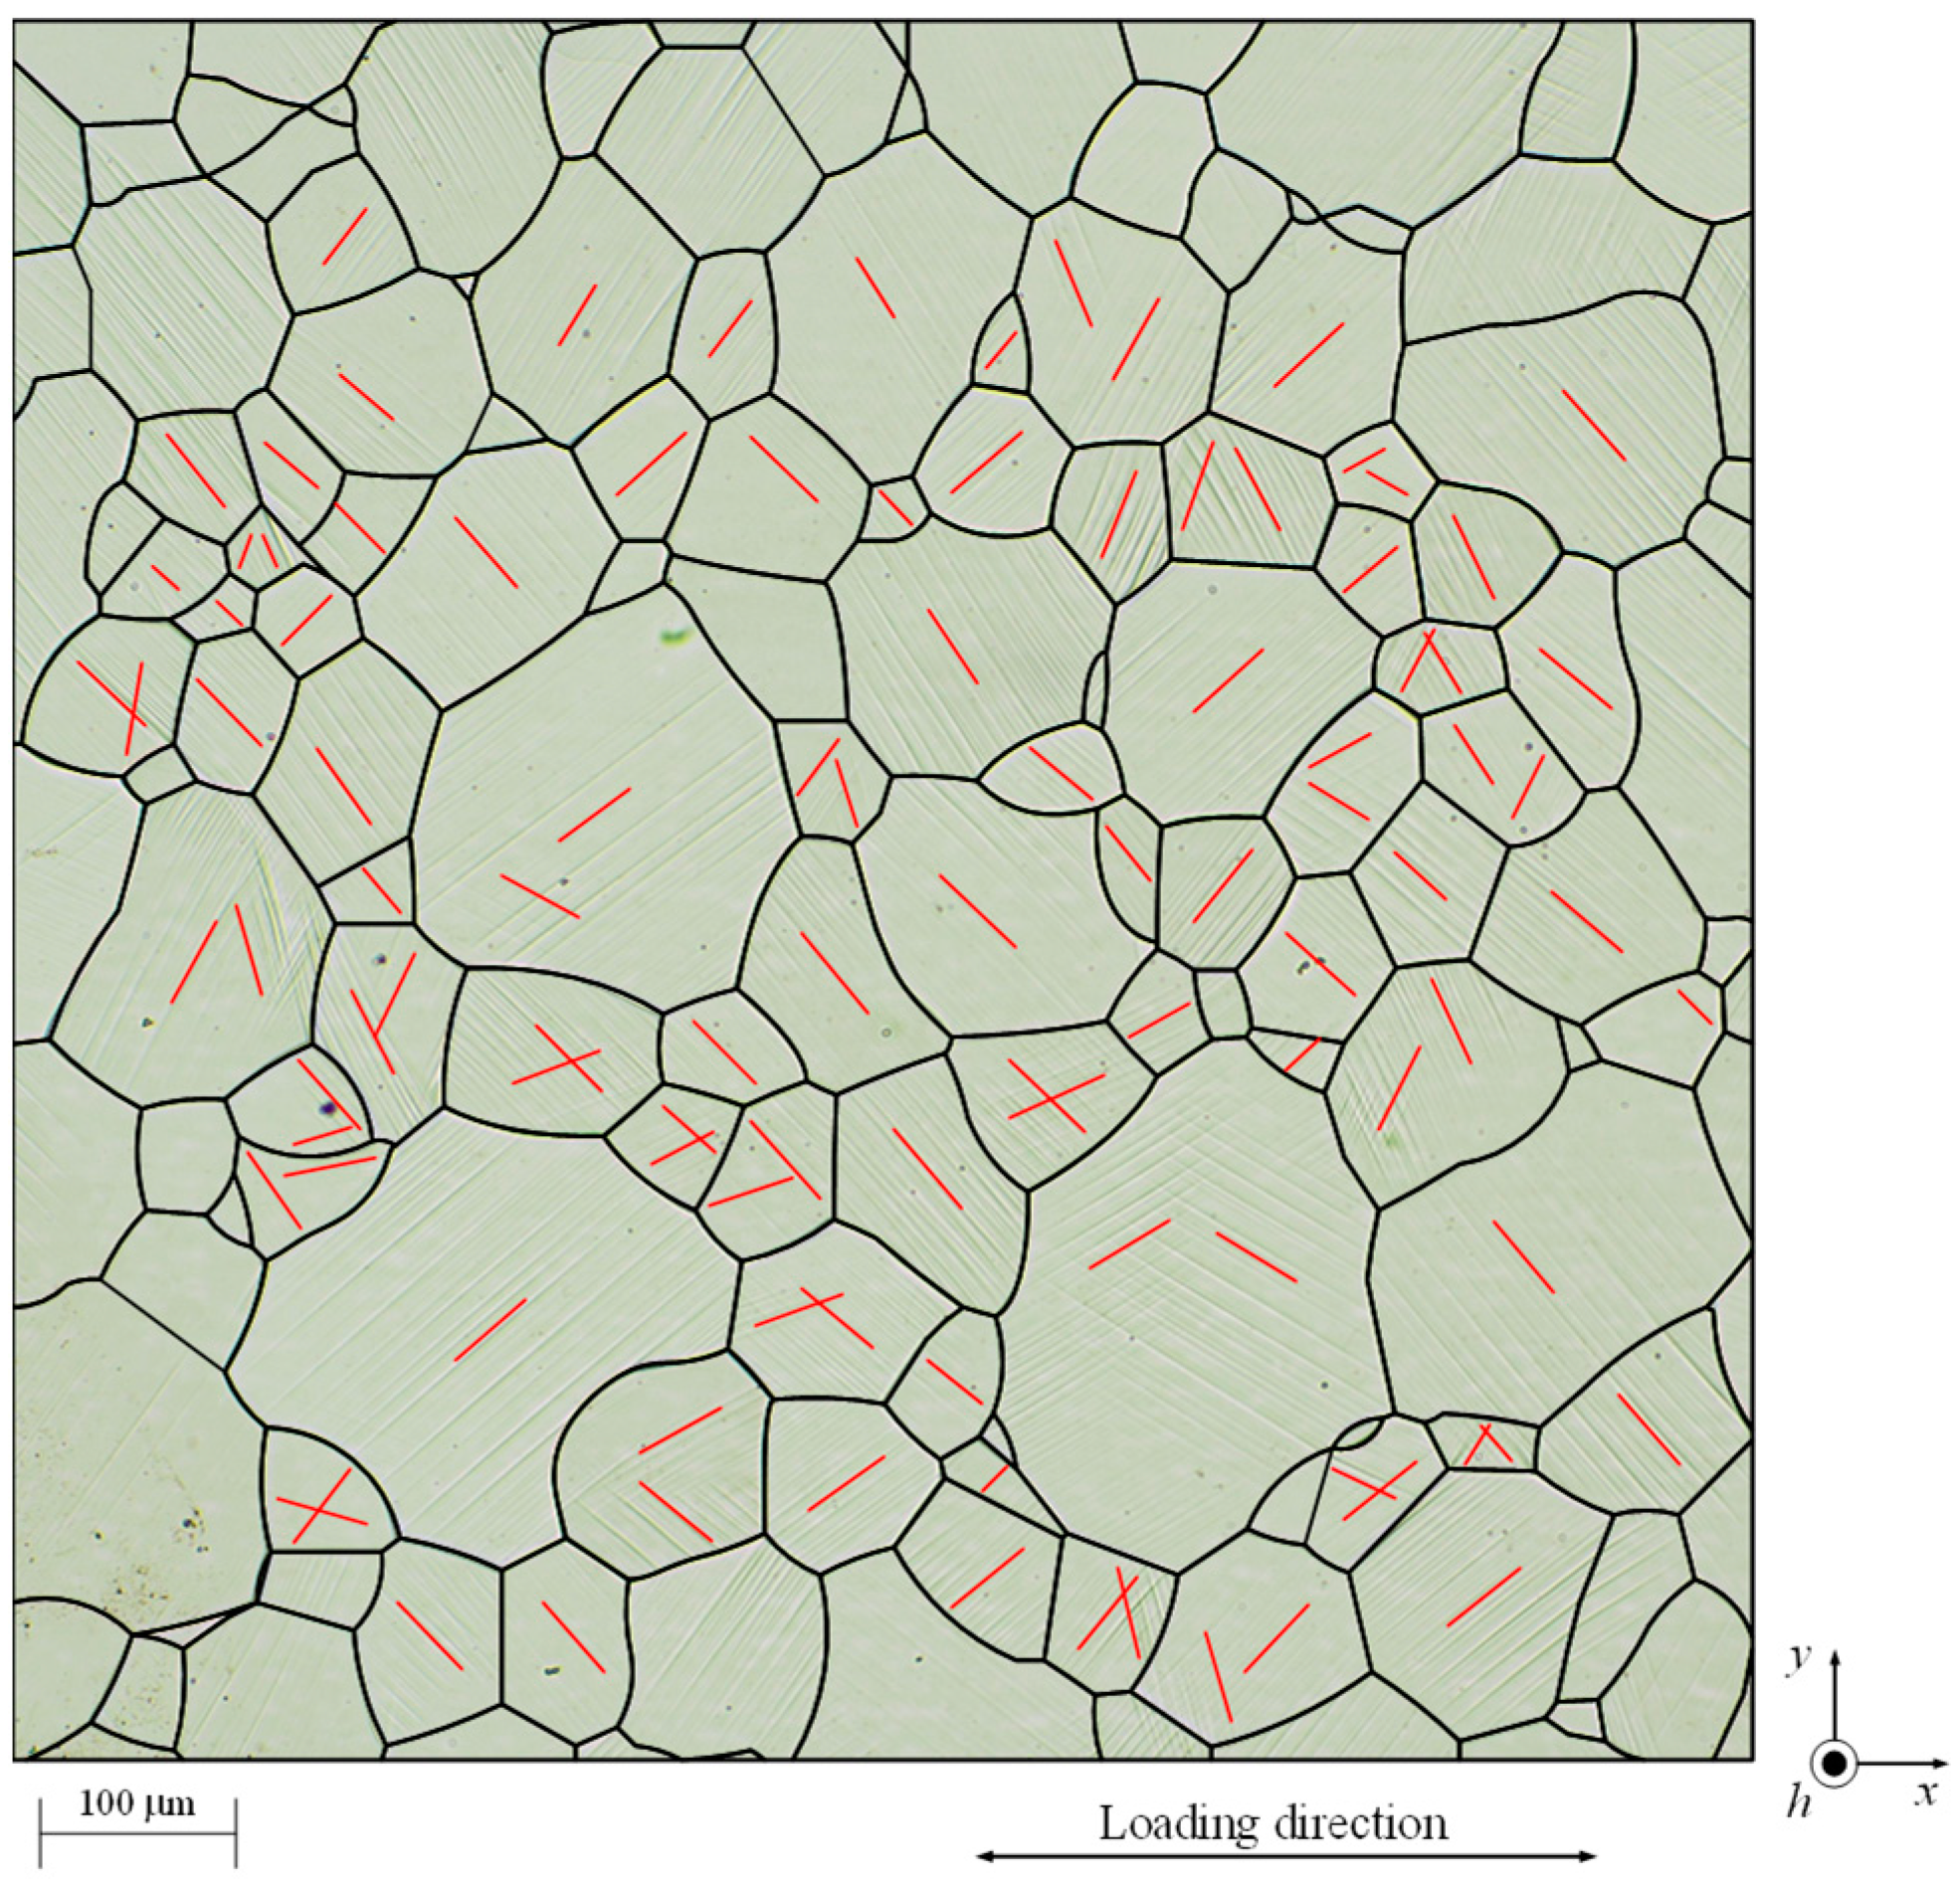
The angles of slip lines were measured after the test. In Figure 7 the straight red lines represent the direction of the parallel slip lines in each grain. As can be seen, slip lines were found in most grains, and some grains had two sets of slip lines with different angles. However, no mechanical twinning, which is usually observed as a lenticular region, was found. In the present specimen, therefore, we suspect that plastic deformation mainly occurred via crystallographic slip.
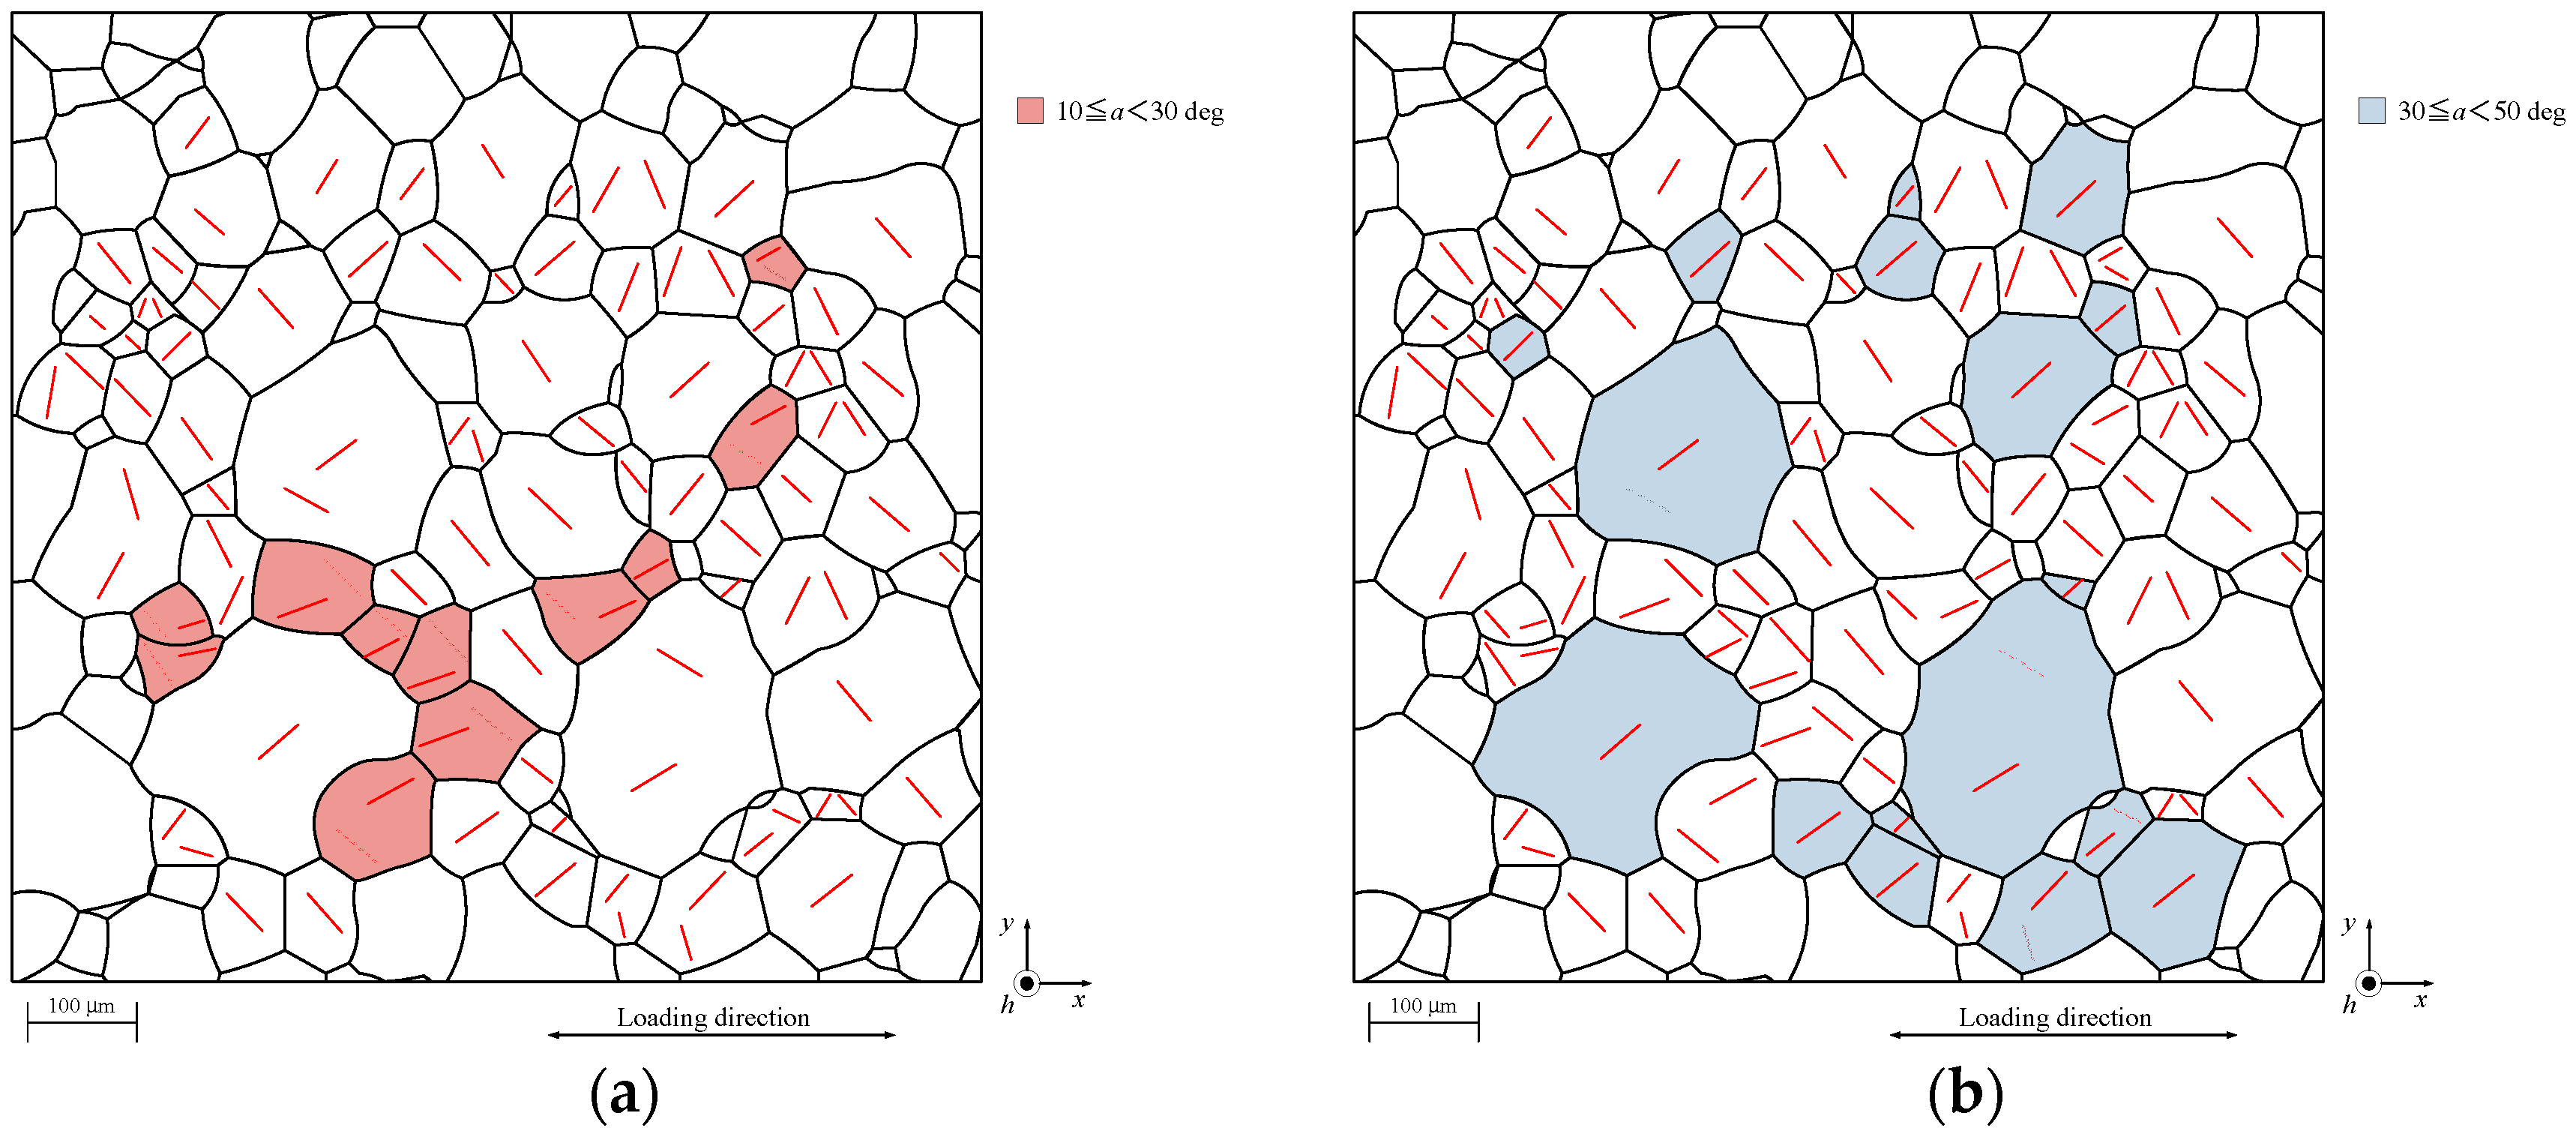
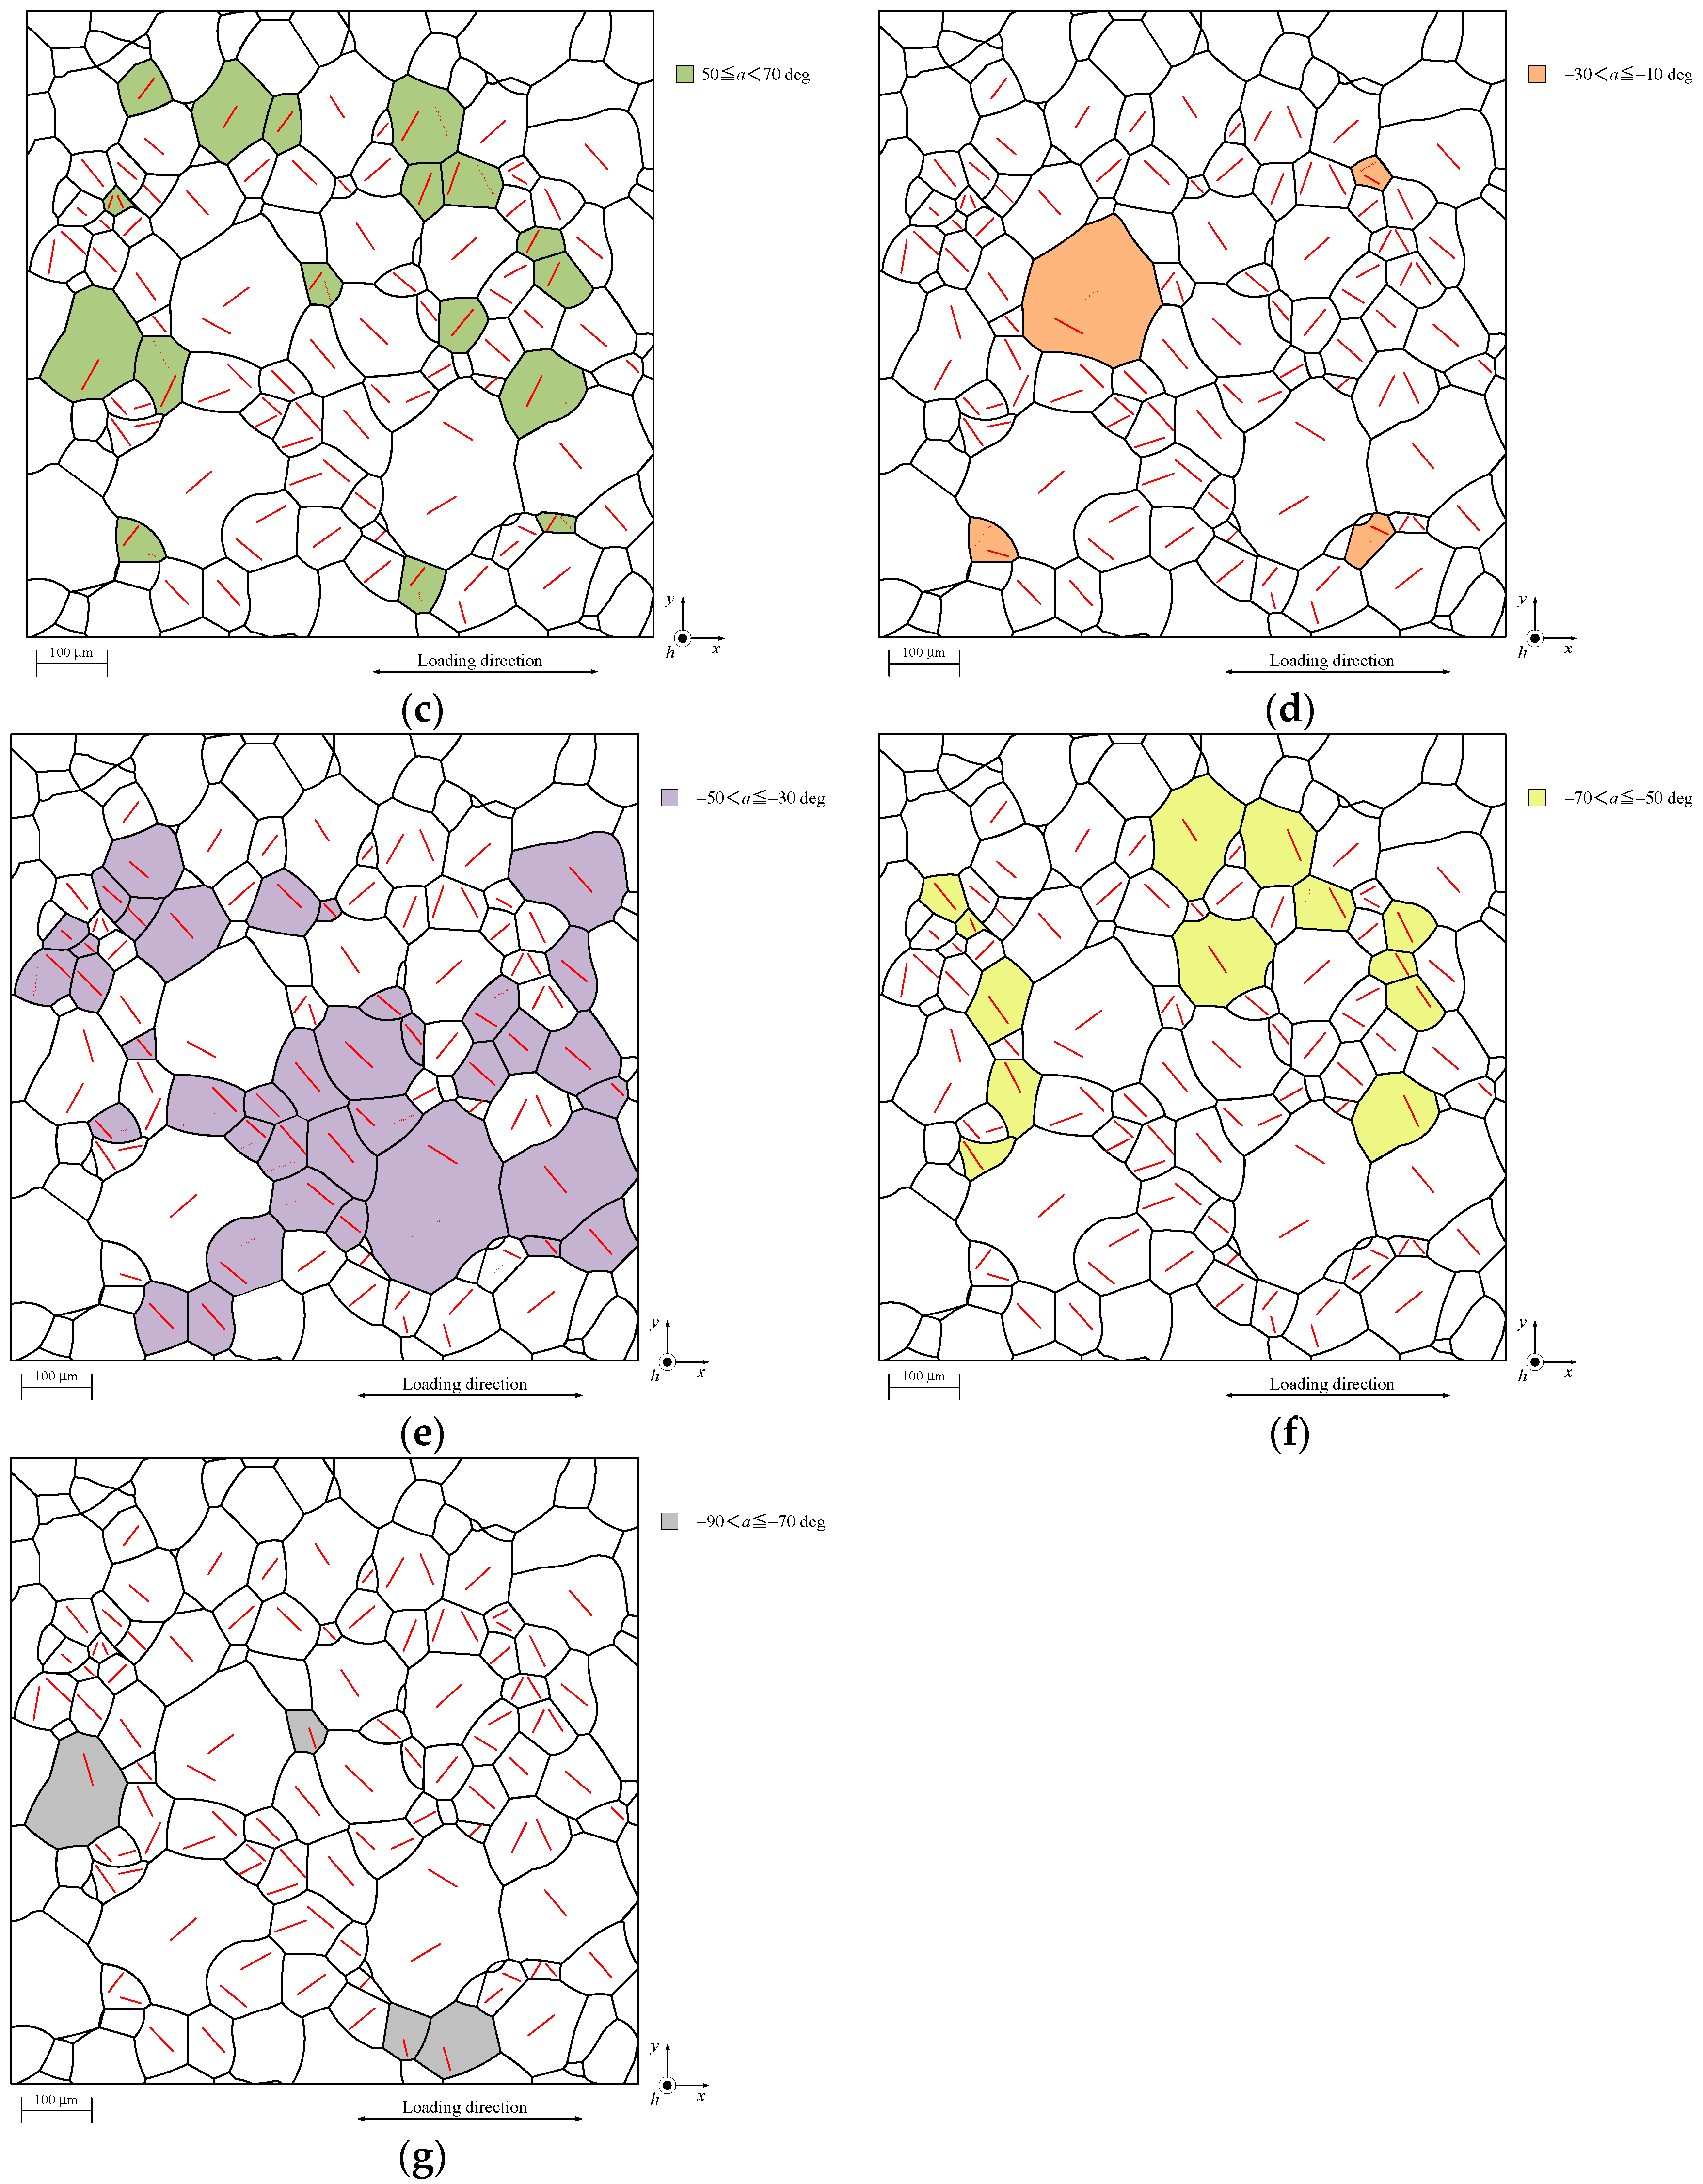
In order to investigate the collective behavior of the grains under plastic deformation, the slip lines were categorized according to their angle relative to the loading direction, as shown in Figure 8. The angle ranges were (a) 10° ≤ θ < 30°, (b) 30° ≤ θ < 50°, (c) 50° ≤ θ < 70°, (d) −10° ≤ θ < −30°, (e) −30° ≤ θ < −50°, (f) −50° ≤ θ < −70°, and (g) −70° ≤ θ < −90°, with the anticlockwise direction set as positive. Since there were no grains with a slip-line angle between 70° and 90°, the corresponding figure is omitted. As Figure 8 shows, slip lines with similar angles were found in neighboring grains, which suggests that the plastic deformation of each grain was interdependent on that of the others, and that the deformation occurred collectively. We found that a large proportion of the grains had slipped at an angle between ±30° ≤ θ < ±50°, implying that slip mainly occurred near the maximum shear direction.

3.4. Slip Lines and Active Slip Systems

The critical resolved shear stress (CRSS) of pure titanium has been discussed in several papers, based on experimental results [26,27,28]. However, it is still difficult to assess the values for each slip system accurately (basal, prismatic, pyramidal, and 2nd order pyramidal) and for tensile/compressive twins, for the following reasons: (1) It is difficult to make single-crystal specimens for tensile tests in order to realize the uniform stress–strain state and to obtain the CRSS value for each individual slip system; (2) the stress in each grain of a polycrystalline specimen is significantly affected by the shape, size, and crystal orientation of neighboring grains. In addition, the stress is not uniform, as is often assumed when evaluating the Schmid factor; (3) the stress and deformation of surface grains are influenced by subsurface and interior grains. Therefore, the Schmid factor, normalized by CRSS, gives only a rough indication of the slip activity of polycrystalline metals. A combination of experiments and the crystal plasticity finite-element method is known to be one of the best methods [29,30,31,32,33,34]. However, since it is not possible to know the geometries and crystal orientation of subsurface and interior grains, modeling is limited to two dimensions or quasi-three dimensions.
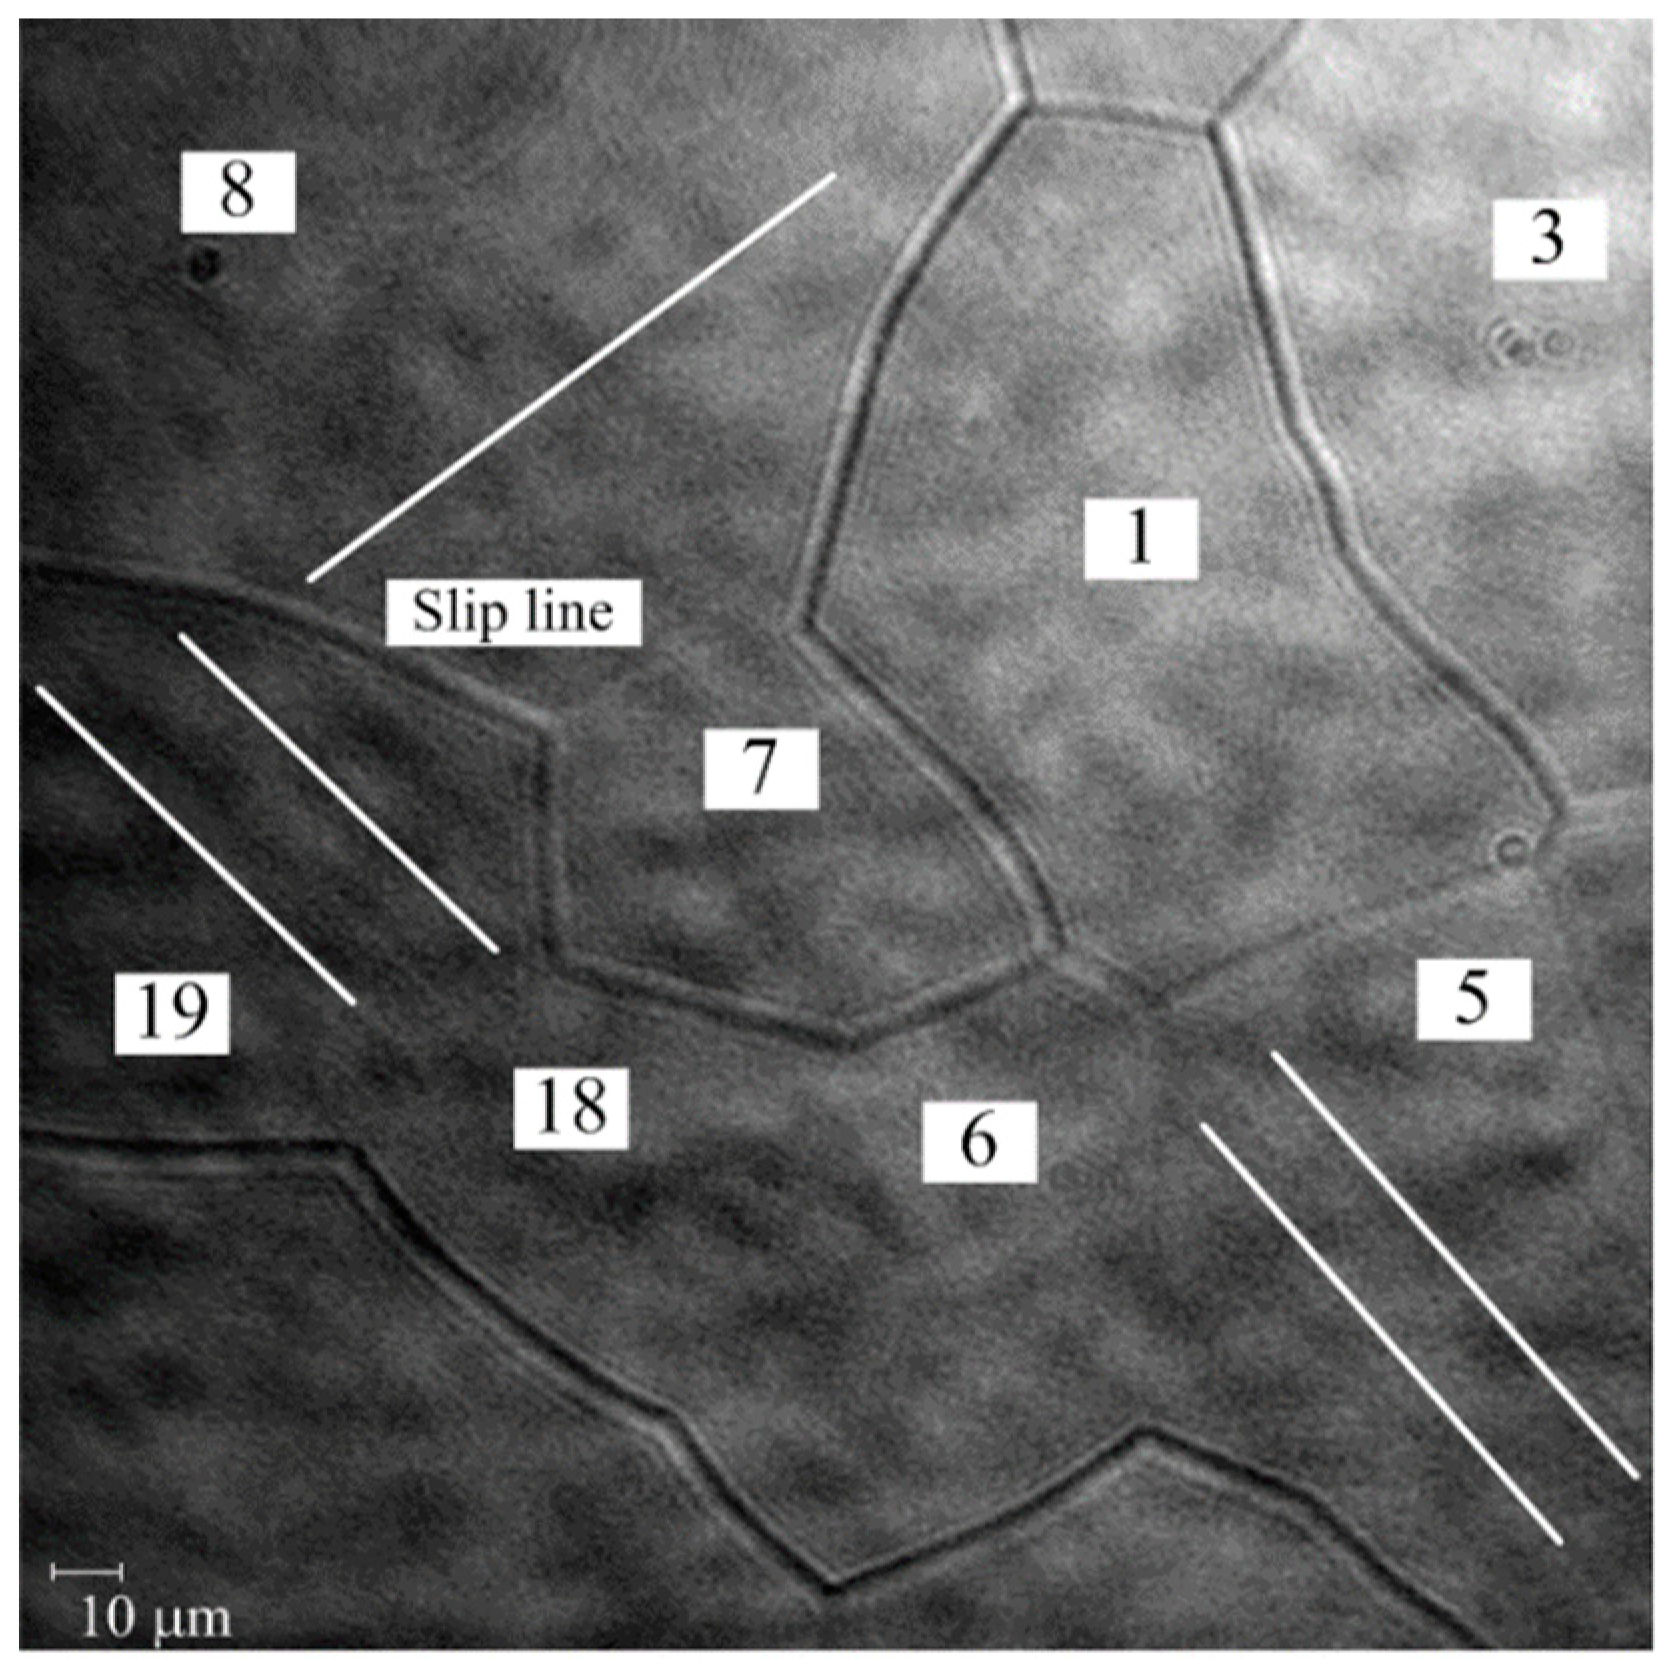
Figure 9 shows slip lines observed in the intensity image of the digital holographic microscope, using an objective with 5 magnification, at P = 635 N. Slip lines were found in grains 5, 8, and 19, within a square observation area of 242 × 242 μm2. The angles with respect to the loading direction were −49.39, 36.50, and −45.00°, respectively, where the anticlockwise direction was positive. Plastic deformation occurred by slip in these surface grains, and other grains were thought to have maintained elastic conditions. Trace analysis was performed based on the slip-line angles and crystal orientation of slipped grains. The results suggest that pyramidal slip was activated in grains 5 and 19, which had high Schmid factors of 0.487 and 0.440, respectively, and that second-order pyramidal slip was activated in grain 8, which had a very low Schmid factor of 0.094. Since the CRSS value of the pyramidal-slip system is much higher than that of the basal- and prismatic-slip systems [26,27,28], the second-order pyramidal slip in grain 8 would barely have been activated if the Schmid law were simply applied under a uniform stress assumption. Thus, we found that the deformation of surface grains did not follow the Schmid law, as previously shown. The effects of neighboring and subsurface grains, as well as non-uniform stress–strain conditions in grains, were considered to be the primary reasons for this.

3.5. Elastic and Plastic Deformation and Height Changes of Grains

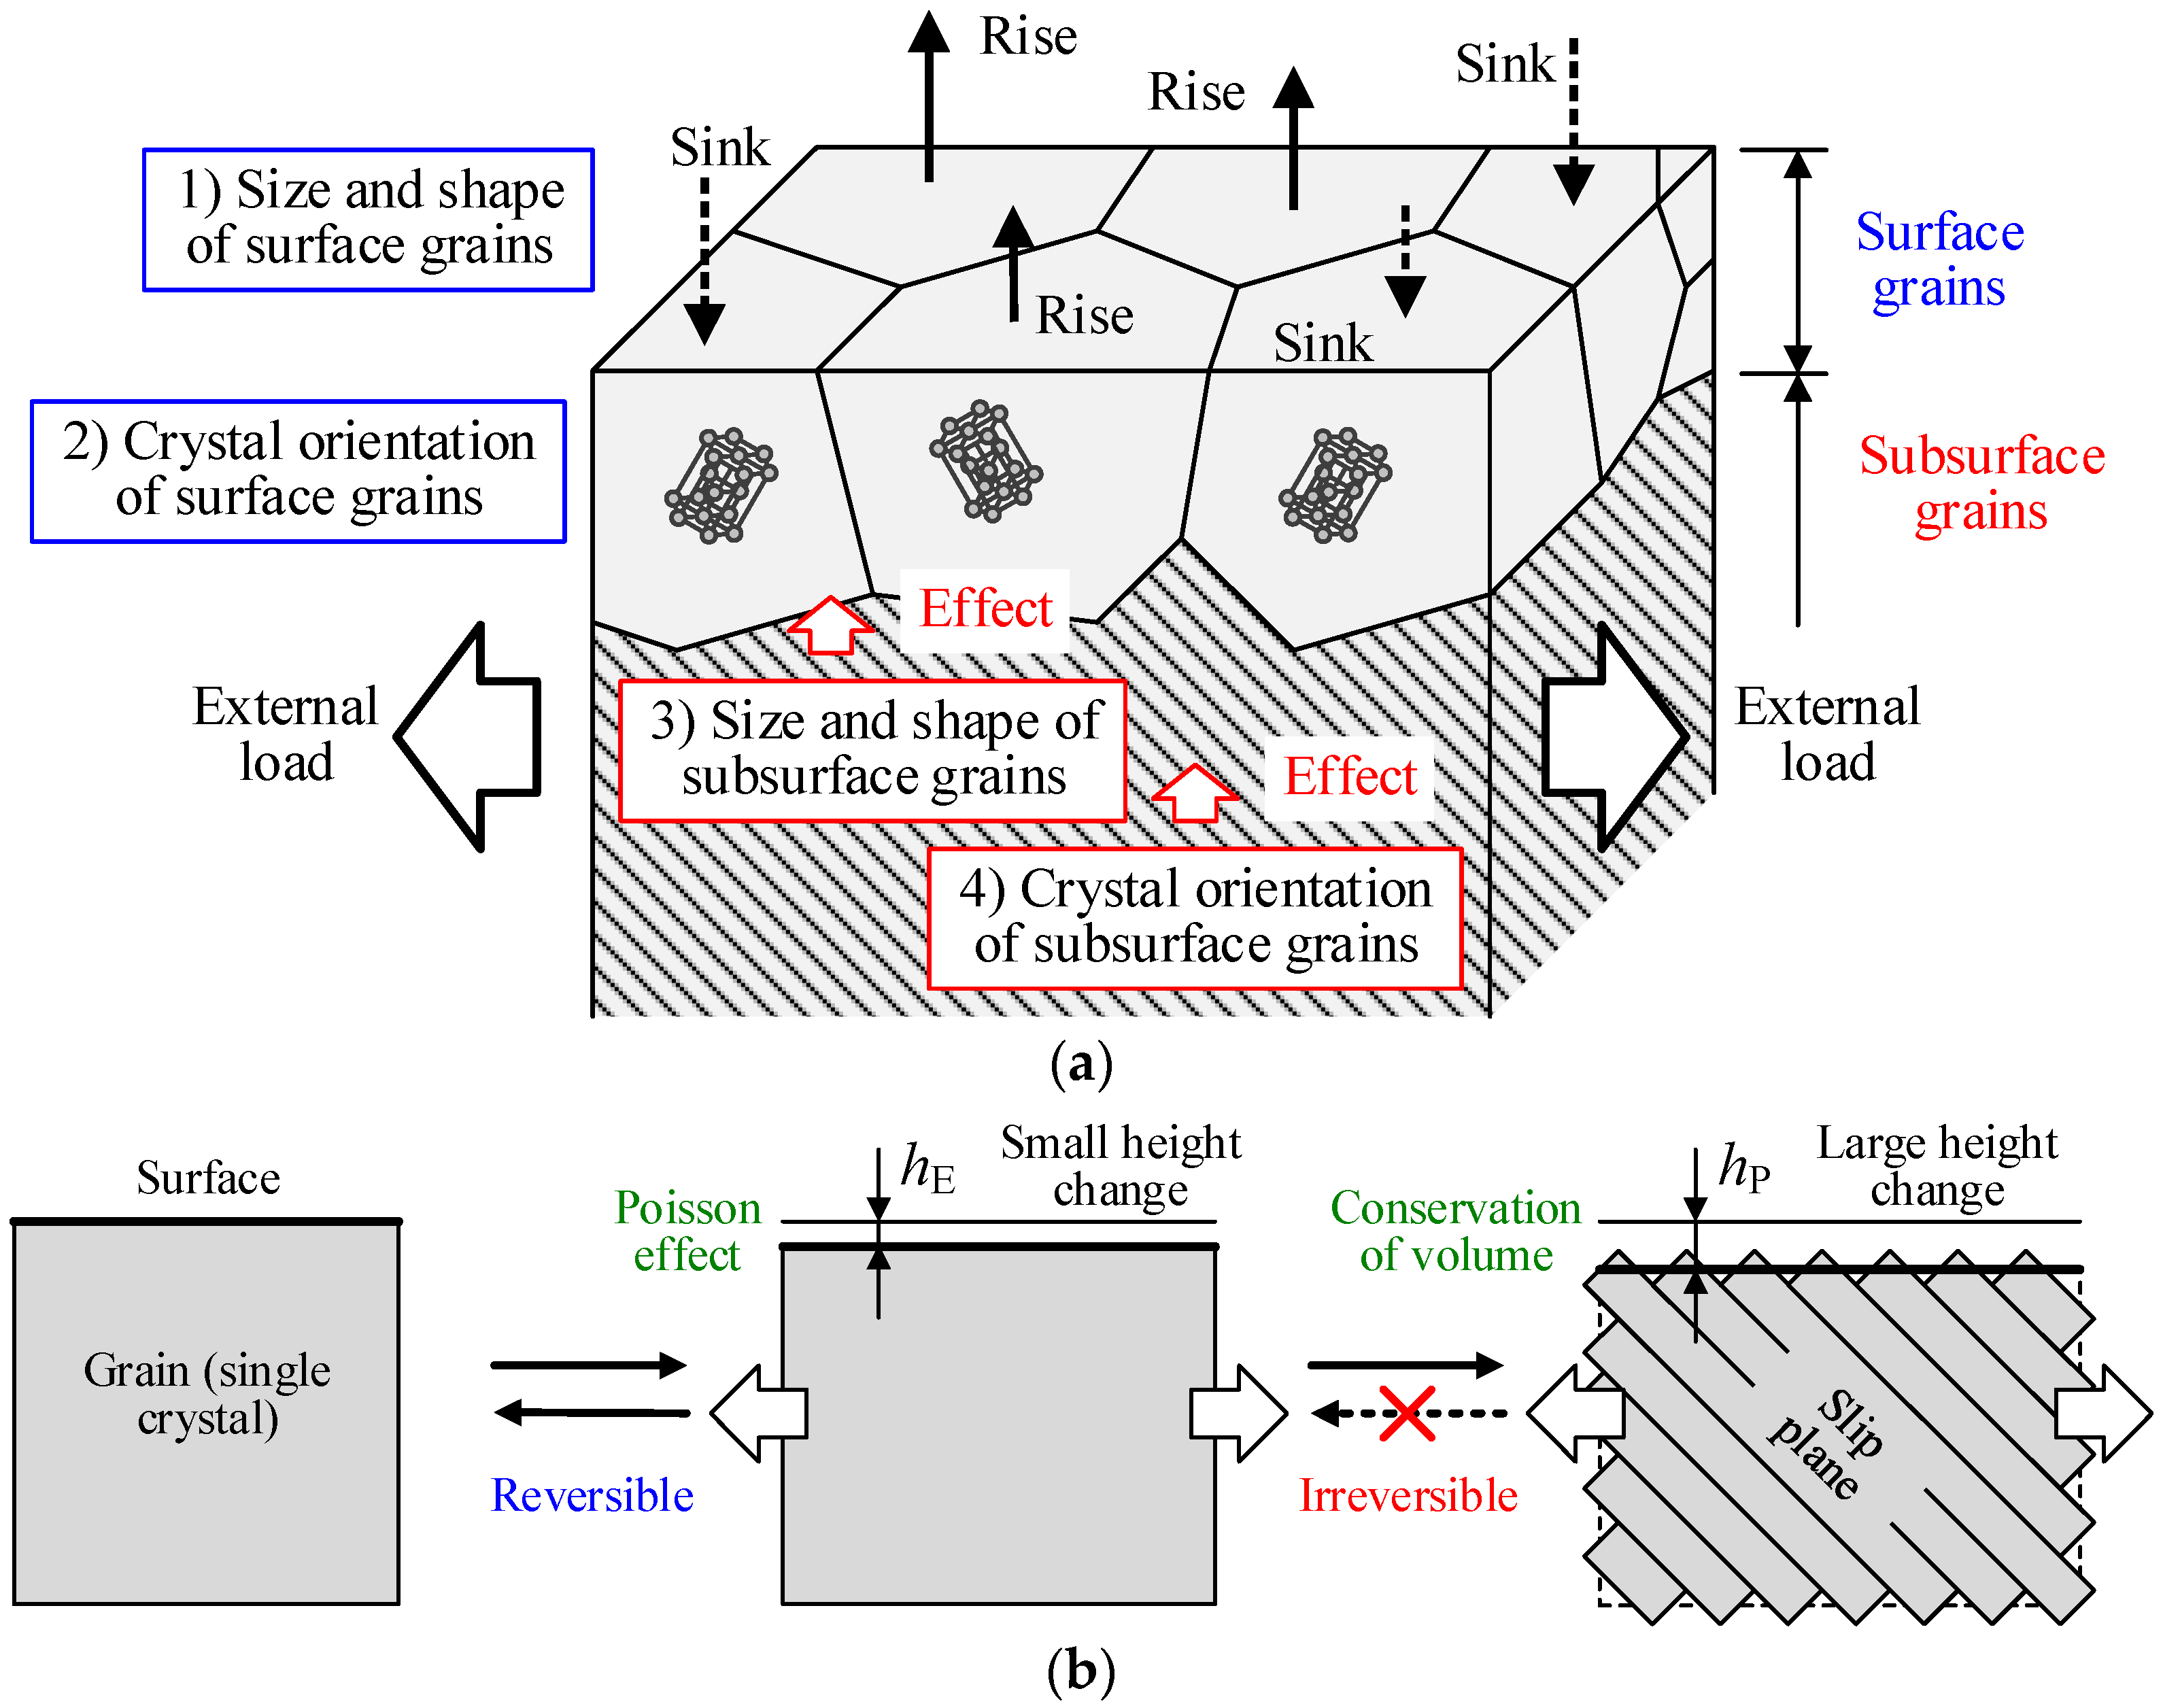
Figure 10a schematically illustrates the microscopic deformation of surface grains. Under small stress–strain conditions, all grains (including both surface and subsurface grains) deformed elastically. The deformation of surface grains depended on their own geometries and crystal orientation. It is also easily understood that the geometries and crystal orientation of the subsurface and interior grains exerted a large influence on the deformation of the surface grains. Under elastic conditions, grain orientation and anisotropic elastic properties, which are usually provided by the elastic constants (c11, c33, c44, c12, and c13), were major causes of elastic inhomogeneity. The result was that inhomogeneous sinks and rises in the surface grains appeared. The linear correlation of the increase in average height per unit load ΔhmP between two small load steps, shown in Figure 6a, suggested that linear elasticity held in each crystal grain of polycrystalline pure titanium. The location of each grain on the plot indicated its own elastic properties, considering all factors such as the geometries and crystal orientation of neighboring, subsurface, and interior grains. However, localized plastic deformation may take place below the macroscopic yield stress, where the stress and strain are highly concentrated. It should be noted that the macroscopic yield stress was different from the microscopic one, as suggested by previous researches [4,14], and the localized plastic region gradually extended with increasing external load.
Figure 10b schematically illustrates the elastic and plastic deformation of a single-crystal grain, which was initially shown by Tada et al. [19]. Under a small stress–strain, each grain in the polycrystalline titanium deformed according to the anisotropic elastic properties of a single crystal, while the surface generally sank, because of the Poisson effect. By increasing the stress–strain, plastic deformation occurred in a direction similar to the elastic deformation, and enhanced its elastic properties. It was therefore reasonable to obtain a strong correlation between the increase in average height per unit load ΔhmP occurring in both small elastic and large plastic load steps (Figure 6b). The large values of ΔhmP under plastic deformation compared with those under elastic deformation (i.e., the large scale of the ordinate axis in Figure 6b) corresponded to large plastic strain in the single-crystal grains.
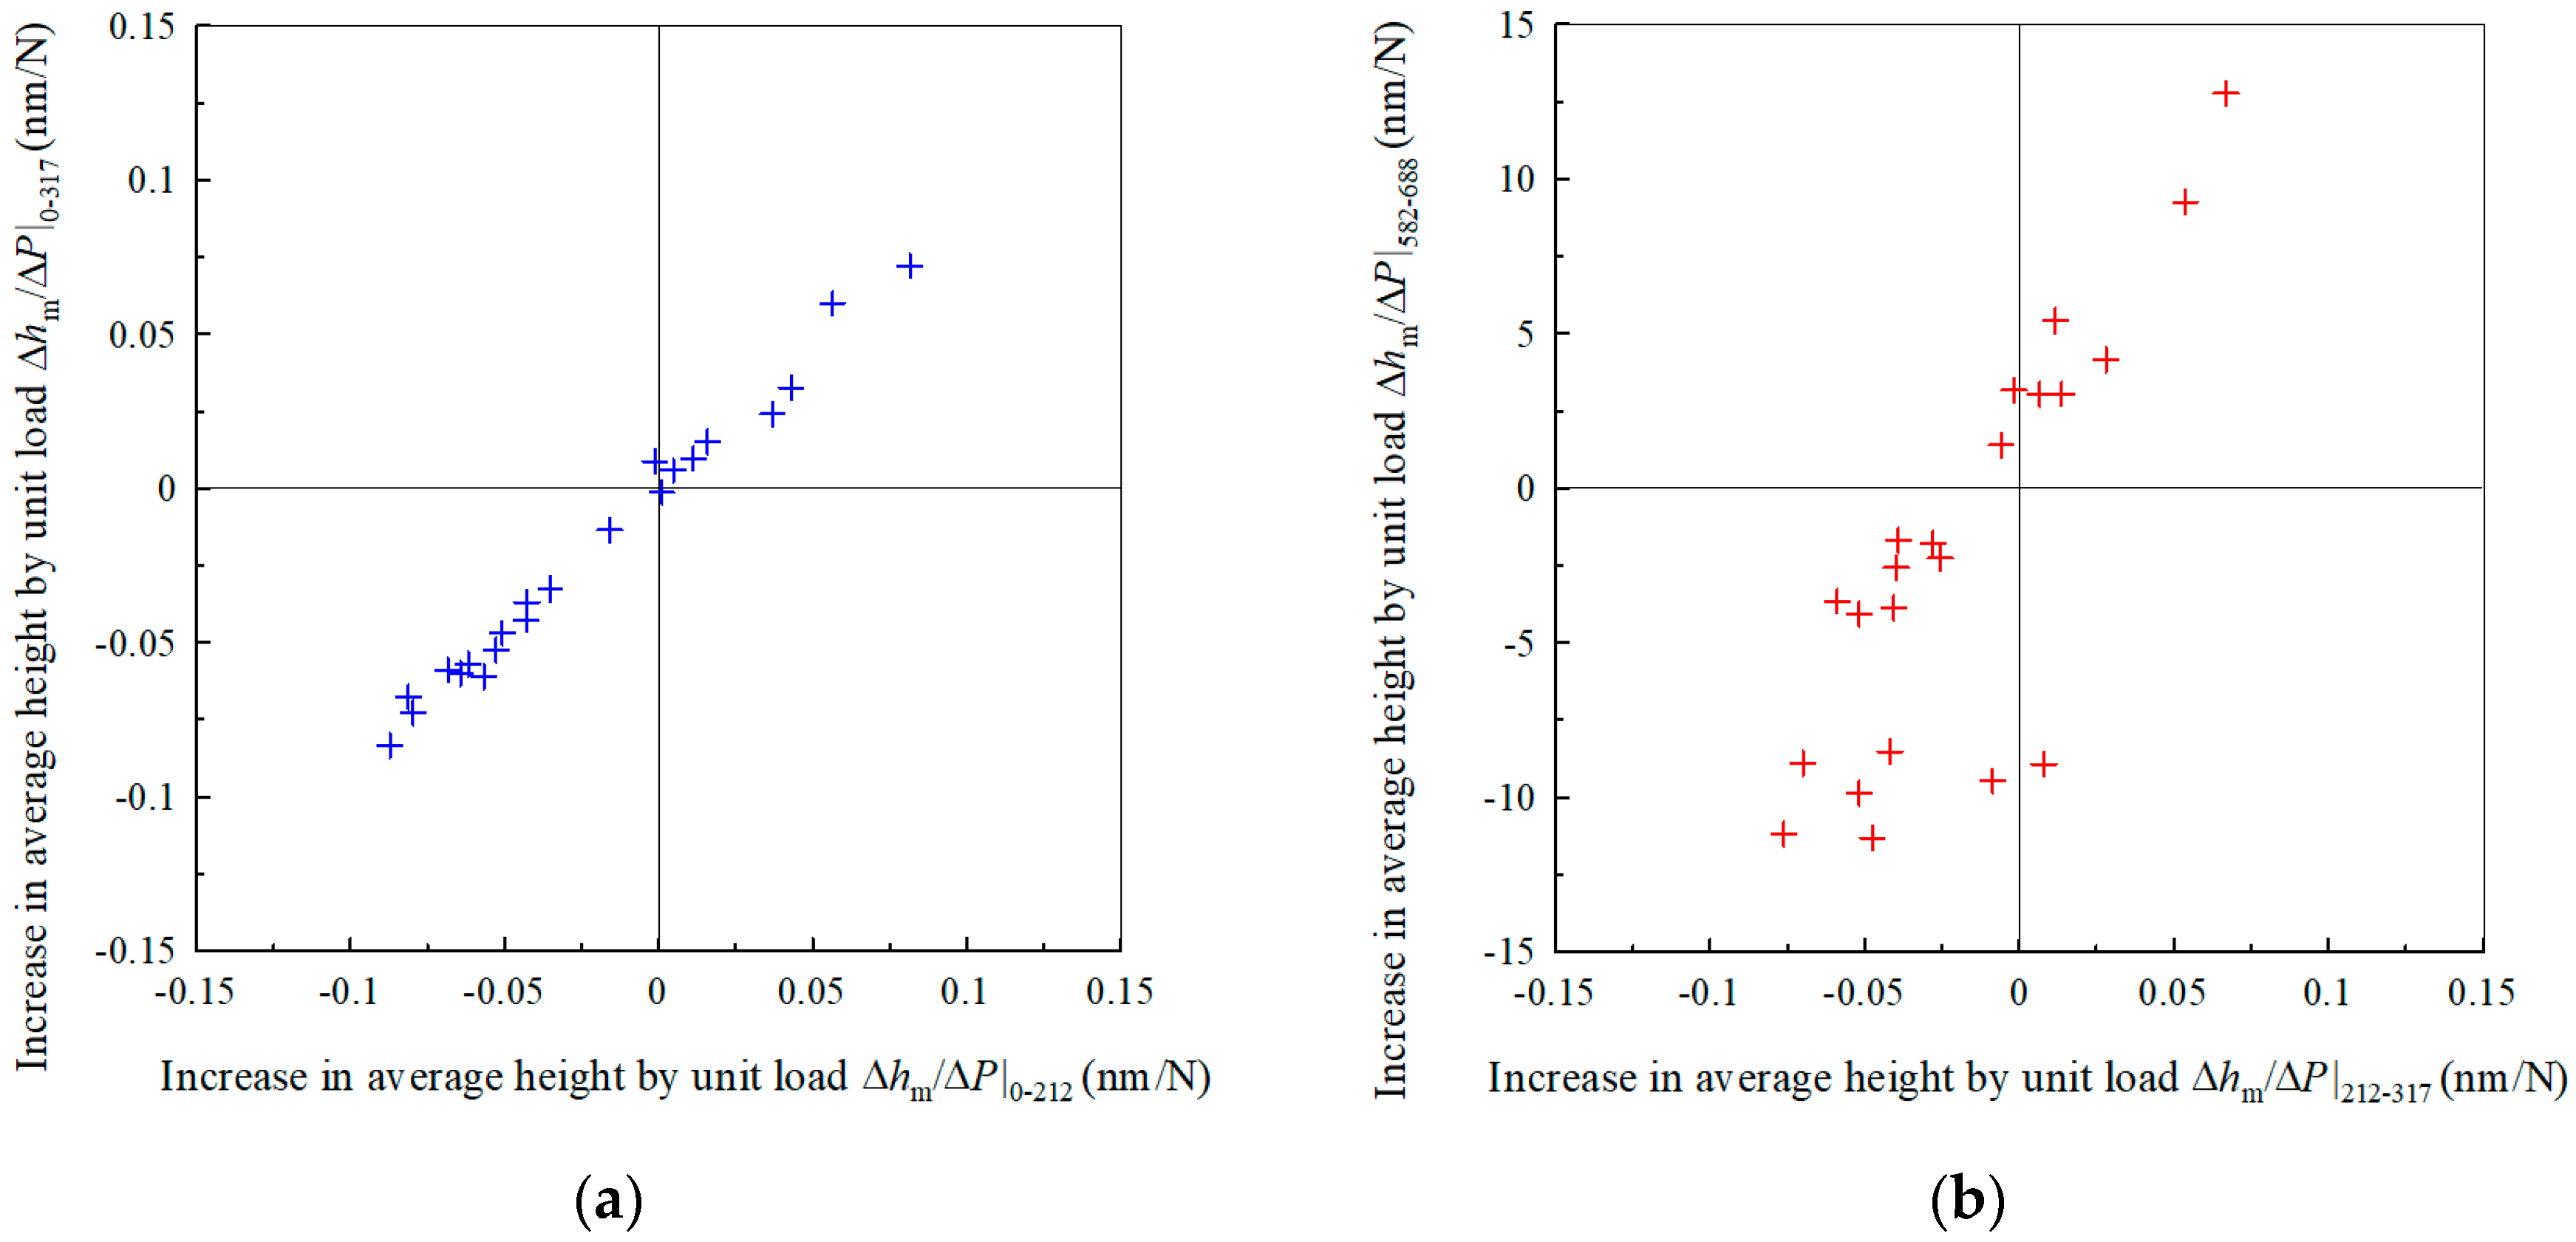
For reference, the change in average height per unit load, ΔhmP, that was obtained for pure titanium under monotonic tension, is shown in Figure 11 [19]. Figure 11a is the correlation between two small load ranges and Figure 11b is that between small and large load ranges. Figure 6a and Figure 11a show similar positive correlations, but the scatter was larger for cyclic than for monotonic tension. One possible reason for this is that the change in average height under cyclic tension was evaluated between a certain tension-hold load and a zero load immediately prior to that. When the load was released, the position of the specimen may have changed slightly. In contrast, the change in average height under monotonic tension was evaluated without unloading, and the position of the specimen was extremely stable during the test.
Concerning the correlation between small and large load ranges, we obtained similar results under monotonic and cyclic tension, as shown in Figure 6b and Figure 11b. However, there was a large difference in the distribution range in the ordinate direction between the two figures. This may have been caused by the difference in microscopic deformation with and without unloading, in addition to the unstable positioning of the specimen under cyclic tension, as stated above. The effect of unloading on the microscopic plastic deformation is an interesting topic that requires further study.
Because the actual microscopic deformation of each grain on the surface was not uniform, but instead was more complicated, it is necessary to investigate the effect of neighboring and subsurface grains on the deformation behavior of central grains based on CPFE analyses of known polycrystalline structures.

4. Conclusions

Microscopic deformation of grains was observed on the surface of a pure titanium plate specimen during a cyclic tensile test, and the nanoscopic height distribution was measured using a digital holographic microscope. Slip lines were also observed, to investigate the interdependence of the inhomogeneous plastic deformation of neighboring grains. Deformation inhomogeneity was observed as non-uniform height change in grains under elastic conditions, and this inhomogeneity increased under plastic conditions. A strong relationship was found between the elastic and plastic microscopic height changes of each grain, which is an important result, suggesting that surface roughness after plastic deformation can be predicted from surface undulation under elastic deformation. These were similar to previous results obtained for monotonic tension. The larger scatter observed in the cyclic tension correlation was likely caused by unstable positioning of the specimen under cyclic unloading. It was confirmed, by the measurement of slip-line angles, that the plastic deformation of each grain was not independent, but that it occurred collectively via crystallographic slips with similar angles in neighboring grains. This collective deformation behavior demonstrates the importance of considering the properties of neighboring and subsurface crystal grains. Finally, the mechanism of the rise and sink of surface grains was investigated. These behaviors appeared as a result of the inhomogeneous elastic and plastic deformation of the surface grains, under the influence of the geometries and crystal orientation of neighboring and subsurface grains. A large-scale crystal orientation analysis and crystal plasticity finite element analysis are required for further understanding of the microstructurally inhomogeneous deformation of polycrystalline metals.

Author Contributions

N.T. conceived, designed, and performed the experiments; N.T. and T.U. analyzed the data and wrote the paper.

Funding

This research was funded by JSPS KAKENHI Grant Number JP18H01337.

Acknowledgments

The authors are grateful to Yudai Yamamoto for his support in the experiments. Assistance with the DHM setup by Tanida (Digital Micro Systems Co., Ltd., Kyoto, Japan) and the useful discussions on DHM with Emery (Lyncee Tec, Lausanne, Switzerland) are also appreciated.

Conflicts of Interest

The authors declare no conflicts of interest.

References

  1. Randle, V. Microtexture Determination and Its Applications; Maney: London, UK, 2003. [Google Scholar]
  2. Sutton, M.A.; Orteu, J.J.; Schreier, H. Image Correlation for Shape, Motion and Deformation Measurements; Springer: New York, NY, USA, 2009. [Google Scholar]
  3. Yang, Y.; Wang, L.; Zambaldi, C.; Eisenlohr, P.; Barabash, R.; Liu, W.; Stoudt, M.R.; Crimp, M.A. Characterization and modelling of heterogeneous deformation in commercial purity titanium. JOM 2011, 63, 66–73. [Google Scholar] [CrossRef]
  4. Zhao, Z.; Ramesh, M.; Raabe, D.; Cuitino, A.M.; Radovitzky, R. Investigation of three-dimensional aspects of grain-scale plastic surface deformation of an aluminum oligocrystal. Int. J. Plast. 2008, 24, 2278–2297. [Google Scholar] [CrossRef]
  5. Wang, L.; Barabash, R.I.; Yang, Y.; Bieler, T.R.; Crimp, M.A.; Eisenlohr, P.; Liu, W.; Ice, G.E. Experimental characterization and crystal plasticity modeling of heterogeneous deformation in polycrystalline α-Ti. Metall. Mater. Trans. A 2011, 42, 626–635. [Google Scholar] [CrossRef]
  6. Yang, Y.; Wang, L.; Bieler, T.R.; Eisenlohr, P.; Crimp, M.A. Quantitative atomic force microscopy characterization and crystal plasticity finite element modeling of heterogeneous deformation in commercial purity titanium. Metall. Mater. Trans. A 2011, 42, 636–644. [Google Scholar] [CrossRef]
  7. Abe, T.; Nagaki, S.; Akase, T. Material inhomogeneity and surface roughening during plastic deformation. Trans. Jpn. Soc. Mech. Eng. 1984, A50, 1236–1244. [Google Scholar] [CrossRef]
  8. Lim, H.; Carroll, J.D.; Battaile, C.C.; Buchheit, T.E.; Boyce, B.L.; Weinberger, C.R. Grain-scale experimental validation of crystal plasticity finite element simulations of tantalum oligocrystals. Int. J. Plast. 2014, 60, 1–18. [Google Scholar] [CrossRef]
  9. Di Gioacchino, F.; Quinta da Fonseca, J. Plastic strain mapping with sub-micron resolution using digital image correlation. Exp. Mech. 2013, 53, 743–754. [Google Scholar] [CrossRef]
  10. Kammers, A.D.; Daly, S. Digital image correlation under scanning electron microscopy: Methodology and validation. Exp. Mech. 2013, 53, 1743–1761. [Google Scholar] [CrossRef]
  11. Chen, Z.; Daly, S.H. Active slip system identification in polycrystalline metals by digital image correlation (DIC). Exp. Mech. 2017, 57, 115–127. [Google Scholar] [CrossRef]
  12. Stinville, J.C.; Echlin, M.P.; Texier, D.; Bridier, F.; Bocher, P.; Pollock, T.M. Sub-grain scale digital image correlation by electron microscopy for polycrystalline materials during elastic and plastic deformation. Exp. Mech. 2017, 56, 197–216. [Google Scholar] [CrossRef]
  13. Efstathiou, C.; Sehitoglu, H.; Lambros, J. Multiscale strain measurements of plastically deforming polycrystalline titanium: Role of deformation heterogeneities. Int. J. Plast. 2010, 26, 93–106. [Google Scholar] [CrossRef]
  14. Ravindran, S.; Koohbor, B.; Kidane, A. Experimental characterization of meso-scale deformation mechanisms and the RVE size in plastically deformed carbon steel. Strain 2016, 53, e12217. [Google Scholar] [CrossRef] [Green Version]
  15. Sutton, M.A.; Ke, X.; Lessner, S.M.; Goldbach, M.; Yost, M.; Zhao, F.; Schreier, H.W. Strain field measurements on mouse carotid arteries using microscopic three-dimensional digital image correlation. J. Biomed. Mater. Res. 2008, 84A, 178–190. [Google Scholar] [CrossRef] [PubMed]
  16. Koohbor, B.; Ravindran, S.; Kidane, A. Experimental determination of representative volume element (RVE) Size in woven composites. Opt. Lasers Eng. 2017, 90, 59–71. [Google Scholar] [CrossRef]
  17. Furusawa, T.; Masuda, T.; Manabe, K.; Alexandrov, S. Prediction of free surface roughening by 2d and 3d model considering material inhomogeneity. J. Solid Mech. Mater. Eng. 1984, 5, 978–990. [Google Scholar]
  18. Tada, N.; Yagi, N.; Shimizu, I.; Uchida, M. Regional Identification by Digital Height Correlation of Nanolevel Surface Profile. In Proceedings of the Final Program and Abstracts, SEM 2009 Fall Symposium and Workshop, Columbia, SC, USA, 5–7 October 2009; The Society for Experimental Mechanics: Bethel, CT, USA, 2009; p. 15. [Google Scholar]
  19. Tada, N.; Uemori, T.; Nakata, T. Elastic and plastic microscopic undulation on the surface of polycrystalline pure titanium under tension. J. Pressure Vessel Technol. 2017, 139, 061403. [Google Scholar] [CrossRef]
  20. Tada, N.; Matsukawa, Y.; Uemori, T.; Nakata, T. Microscopic Deformation of Polycrystalline Pure Copper Wire during Tension. In Proceedings of the 10th International Microsystems, Packaging, Assembly and Circuits Technology Conference, Taipei, Taiwan, 21–23 October 2015; pp. 420–423. [Google Scholar]
  21. Tada, N.; Hamada, S.; Teramae, T.; Yoshino, S.; Suzuki, T. A Method of Crack Detection in the Turbine Blade Using Digital Holographic Microscopy. In Proceedings of the ASME 2011 Pressure Vessels and Piping Conference, Baltimore, MD, USA, 17–21 July 2011; The American Society of Mechanical Engineers: New York, NY, USA, 2011; pp. 211–216. [Google Scholar]
  22. Tada, N.; Uchida, M.; Uenoyama, Y. Non-Destructive Crack Detection by Nanometric Change in Surface Profile Using Digital Holographic Microscope. In Proceedings of the ASME 2012 Pressure Vessels and Piping Conference, Toronto, ON, Canada, 15–19 July 2012; The American Society of Mechanical Engineers: New York, NY, USA, 2012; pp. 251–257. [Google Scholar]
  23. Tada, N.; Uchida, M.; Matsukawa, Y. Non-Destructive Detection of Crack in HDPE Plate by Nanometric Change in Surface Profile. In Proceedings of the ASME 2013 Pressure Vessels and Piping Conference, Paris, France, 14–18 July 2013; The American Society of Mechanical Engineers: New York, NY, USA, 2013. [Google Scholar]
  24. Tada, N. Microscopic Height Change on the Surface of Polycrystalline Pure Titanium under Cyclic Tension. In International Digital Imaging Correlation Society, Proceedings of the First Annual Conference, Philadelphia, PA, USA, 7–10 November 2016; The Society for Experimental Mechanics: Bethel, CT, USA, 2017; pp. 267–271. [Google Scholar]
  25. Haghshenas, A.; Khonsari, M.M. Damage accumulation and crack initiation detection based on the evolution of surface roughness parameters. Int. J. Fatigue 2018, 107, 130–144. [Google Scholar] [CrossRef]
  26. Akhtar, A. Basal slip and twinning in a-titanium singe crystal. Metall. Trans. A 1975, 6A, 1105–1113. [Google Scholar] [CrossRef]
  27. Gong, J.; Wilkinson, A.J. Anisotropy in the plastic flow properties of single-crystal titanium determined from micro-cantilever beams. Acta Mater. 2009, 57, 5693–5705. [Google Scholar] [CrossRef]
  28. Sun, Q.; Guo, Q.; Yao, X.; Xiao, L.; Greer, J.R.; Sun, J. Size effects in strength and plasticity of single-crystalline titanium micropillars with prismatic slip orientation. Acta Mater. 2011, 65, 473–476. [Google Scholar] [CrossRef]
  29. Warwick, J.L.; Jones, N.G.; Rahman, K.M.; Dye, D. Lattice strain evolution during tensile and compressive loading of CP Ti. Acta Mater. 2012, 60, 6720–6731. [Google Scholar] [CrossRef]
  30. Salem, A.A.; Kalidindi, S.R.; Semiatin, S.L. Strain hardening due to deformation twinning in α-titanium: Constitutive relations and crystal-plasticity modeling. Acta Mater. 2005, 53, 3495–3502. [Google Scholar] [CrossRef]
  31. Zambaldi, C.; Yang, Y.; Wang, L.; Bieler, T.R. Orientation informed nanoindentation of α-titanium: Indentation pileup in hexagonal metals deforming by prismatic slip. J. Mater. Res. 2012, 27, 356–367. [Google Scholar] [CrossRef]
  32. Lie, H.; Mason, D.E.; Bieler, T.R.; Boehlert, C.J.; Crimp, M.A. Methodology for estimating the critical resolved shear stress ratios of α-phase Ti using EBSD-based trace analysis. Acta Mater. 2013, 61, 7555–7567. [Google Scholar] [CrossRef]
  33. Bieler, T.R.; Crimp, M.A.; Yang, Y.; Wang, L.; Eisenlohr, P.; Mason, D.E.; Liu, W.; Ice, G.E. Strain heterogeneity and damage nucleation at grain boundaries during monotonic deformation in commercial purity titanium. JOM 2009, 61, 45–52. [Google Scholar] [CrossRef] [Green Version]
  34. Hemery, S.; Nait-Ali, A.; Villechaise, P. Combination of In-situ SEM tensile test and FFT-based crystal elasticity simulations of Ti-6Al-4V for an improved description of the onset of plastic slip. Mech. Mater. 2017, 109, 1–10. [Google Scholar] [CrossRef]
Figure 1. Shape and size of the plate specimen (in mm) [24].
Applsci 08 01907 g001
Figure 2. The specimen surface after the tensile test. The red squares indicate the evaluation areas for the average height of the grains. [24].
Applsci 08 01907 g002
Figure 3. Crystal-orientation map of the specimen.
Applsci 08 01907 g003
Figure 4. Height distribution at four load steps (1 pixel = 4.443 μm) [24].
Applsci 08 01907 g004
Figure 5. Change in height distribution with load P at each load step. (a) Grains 1 to 12; (b) grains 13 to 23; (c) grains 25 to 41; (d) grains 42 to 55; and (e) grains 56 to 81.
Applsci 08 01907 g005aApplsci 08 01907 g005b
Figure 6. Relationship between average height change per unit load under elastic and plastic loading conditions. (a) Between the first (abscissa) and third (ordinate) load steps; and (b) between the third (abscissa) and seventh (ordinate) load steps [24].
Applsci 08 01907 g006
Figure 7. Slip-line directions in each grain.
Applsci 08 01907 g007
Figure 8. Distribution of grains with similar slip-line directions. (a) 10° ≤ θ < 30°; (b) 30° ≤ θ < 50°; (c) 50° ≤ θ < 70°; (d) −10° ≤ θ < −30°; (e) −30° ≤ θ < −50°; (f) −50° ≤ θ < −70°; and (g) −70° ≤ θ < −90°.
Applsci 08 01907 g008aApplsci 08 01907 g008b
Figure 9. Digital holographic-microscope intensity image of grains 1, 3, 5, 6, 7, 8, 18, and 19, at P = 635 N.
Applsci 08 01907 g009
Figure 10. Height change of surface grains as a result of elastic and plastic deformation. (a) Rise and sink of surface grains, and deformation of subsurface grains; and (b) elastic and plastic deformation of each grain [19].
Applsci 08 01907 g010
Figure 11. Relationship between average height change per unit load under elastic and plastic loading conditions [19]. (a) Between P = 0 N and P = 212 N (abscissa) and P = 0 N and P = 317 N (ordinate) load steps; and (b) between P = 212 N and P = 317 N (abscissa) and P = 582 N and P = 688 N (ordinate) load steps.
Applsci 08 01907 g011
Table 1. Load at each step.
StepLoad P (N)Nominal Stress σn (MPa)Nominal Strain εn (%)
0 (before test)000
13171130.129
2000
34231510.258
4000.129
56352260.873
6000.515
77412641.36
8 (after test)001.23