1. Introduction
The precast concrete structure is one of the most important structural forms of modern architecture. A precast concrete structure has advantages over a cast-in-place concrete structure that include less wet work on site, better control of component quality, rapid construction, and good economic and environmental benefits. However, there are challenges posed to the application of precast concrete structures, such as poor connection reliability and structural integrity, that limit its use in seismic zones.
A precast concrete frame structure is distinguished from a cast-in-place structure by the connection method of columns, beams, and floors, and especially by the connection method of the beam–column joints. These joints significantly affect the seismic performance of the whole structure. The design principle of “strong joint weak component” is realized by ensuring that the assembled part of the beam–column joint region has sufficient strength, rigidity, and ductility to meet the requirements of bearing capacity and deformation capacity under the conditions of normal use and during earthquakes. The precast concrete frame joints must effectively transmit the bending moment and shear force between the precast components, and they also should have good ductility and energy dissipation capacity. Research on precast concrete structures mainly focused on the connection mode of joints, the mechanical properties of joints, and the seismic performance of prefabricated structures for different connection modes [
1,
2,
3,
4,
5,
6,
7,
8,
9,
10,
11,
12,
13,
14,
15,
16,
17].
Maya et al. [
1] studied precast elements that were joined by high-performance fiber reinforced concrete and short steel bars. The studies by Liu et al. [
2] and Lee et al. [
3] investigated precast concrete beam–column joints connected by sleeves and with anchor plates. Choi et al. [
4] and Lu et al. [
5] both proposed beam–column joints in which steel plates or U-shaped steel bars were placed in the joint zone and engineered cementitious composite (ECC) materials were poured. An improved hybrid H-steel-precast concrete beam system was proposed by Yang et al. [
6], and tests of five fixed-end beam specimens under reversed cyclic one-point concentrated top loads at the mid-span were performed to determine their bending capacity and ductility. Ersoy et al. [
7] studied the seismic behavior of welded joints in a frame beam. Five specimens with welded joints and two monolithic reference specimens were tested to study their behavior under seismic action. Aninthaneni et al. [
8] and Li et al. [
9] developed joints with steel plates embedded at the precast beam ends and bolted to the precast columns. The precast joints with T-section steel plates that were pre-buried in the beam ends and connected by welded steel plates with post-pouring concrete at the joints were studied by Ketiyot et al. [
10]. The works by Kim et al. [
11] and Wu et al. [
12] determined the performance of the joints with precast columns and steel beams. Yekrangnia et al. [
13] evaluated the performance of a proposed steel connected precast concrete joint by experimental and numerical analysis. A precast concrete beam–column joint with energy-absorbing ductile connectors was developed by Englekirk et al. [
14]. Ozturan et al. [
15] performed a comparative test for four ductile, moment-resisting precast concrete frame connections and one monolithic concrete connection for high seismic zones. The studies of Vidjeapriya et al. [
16] and Naik et al. [
17] proposed a precast concrete beam–column joint with corbel and cleat angle, and a reversed cyclic loading test of the scaled model was performed.
In the above researches, the precast members were connected by steel bars or steel plates through overlapping, welding, or bolting. The seismic performance of most of these joints is comparable to the conventional cast-in-place joints. However, the introduction of prestressing on the precast concrete structure allows for the full use of the tensile and compressive strength of the member, improves the shear capacity of the structure, reduces the section height of the member, reduces the deformation, and ensures good crack closure and deformation recovery performance of the structure. Priestley et al. [
18] studied the precast beam–column joints of partially unbonded prestressing tendons where the prestressing tendons were non-bonded within a certain range of the joint zone and the beam end. The results showed that the self-recovery ability of the joints was strong and the shear capacity was improved. The seismic behavior of prestressed prefabricated beam–column joints with energy-dissipation steel bars was investigated by Cheok et al. [
19] and Wang et al. [
20]. The self-recovering force was shown to be provided by the prestressing tendons and the energy consumed by the ordinary steel bars. Morgen et al. [
21], Song et al. [
22], and Rodgers et al. [
23] proposed an unbonded post-tensioned precast concrete structure using dampers to supplement energy dissipation. The research of post-tensioned precast beam-to-column connections was conducted by Kaya et al. [
24], and the performance of the joints at different stress levels through experiments were analyzed. Liu et al. [
25] conducted pseudo-dynamic and quasi-static tests on a two-story precast prestressed concrete frame. The seismic performance of the post-tensioned prestressed joints was determined by performing reversed cyclic loading tests on two specimens with bonded tendons and two specimens with unbonded tendons by Xun et al. [
26]. The test results showed that the test piece consumed less energy, but the residual deformation was smaller, and it had better recovery performance. Ha et al. [
27] studied the performance of structures with U-shaped prestressed steel strands, precast columns, precast slabs, and topping concrete by testing three interior and three exterior joint specimens. Cai et al. [
28,
29] conducted reversed cyclic loading tests on precast prestressed concrete frame beam–column joints with different lengths of service hole. A steel-strand-anchored precast frame joint with embossed anchors was proposed by Guan et al. [
30]. Parastesh et al. [
31] introduced a ductile moment-resisting connection intended for high-intensity seismic zones. Im et al. [
32] studied the parameters of a reinforced-concrete-emulated beam–column connection of a precast concrete moment frame with a U-shaped beam shell at the end of the beam. Eom et al. [
33] proposed three plastic hinge relocation methods to improve the earthquake resistance of emulative precast concrete beam–column connections using PC (precast concrete) U-shell beams.
These studies show that the prestressing enhances the self-recovery ability of the joints, but some post-tensioned prestressed joints have poor energy dissipation capacity. Moreover, the connection of precast prestressed members, the interface treatment of the new–old concrete interfaces, the concrete strength, and their influences on the seismic performance of joints were not discussed comprehensively. Therefore, a precast prestressed concrete frame structure was studied in this paper. The reversed cyclic loading testing of three joints with different parameters was performed to observe the behavior and to obtain the hysteresis curve and skeleton curve of the joints. The stiffness, bearing capacity, ductility, and energy dissipation capacity of the joints were analyzed to investigate whether the seismic performance of the precast prestressed concrete frame joints met the requirements of the equivalent monolithic system. The influence of concrete strength in the keyway area on the performance of precast prestressed concrete joints was investigated. The reliability of the interface treatment method of the new–old concrete interface was studied. The force mechanism of precast prestressed concrete joints was analyzed. The reliability of transmitting force through the steel bar in the plastic hinge area was determined.
2. Model Structure
2.1. Test Specimens
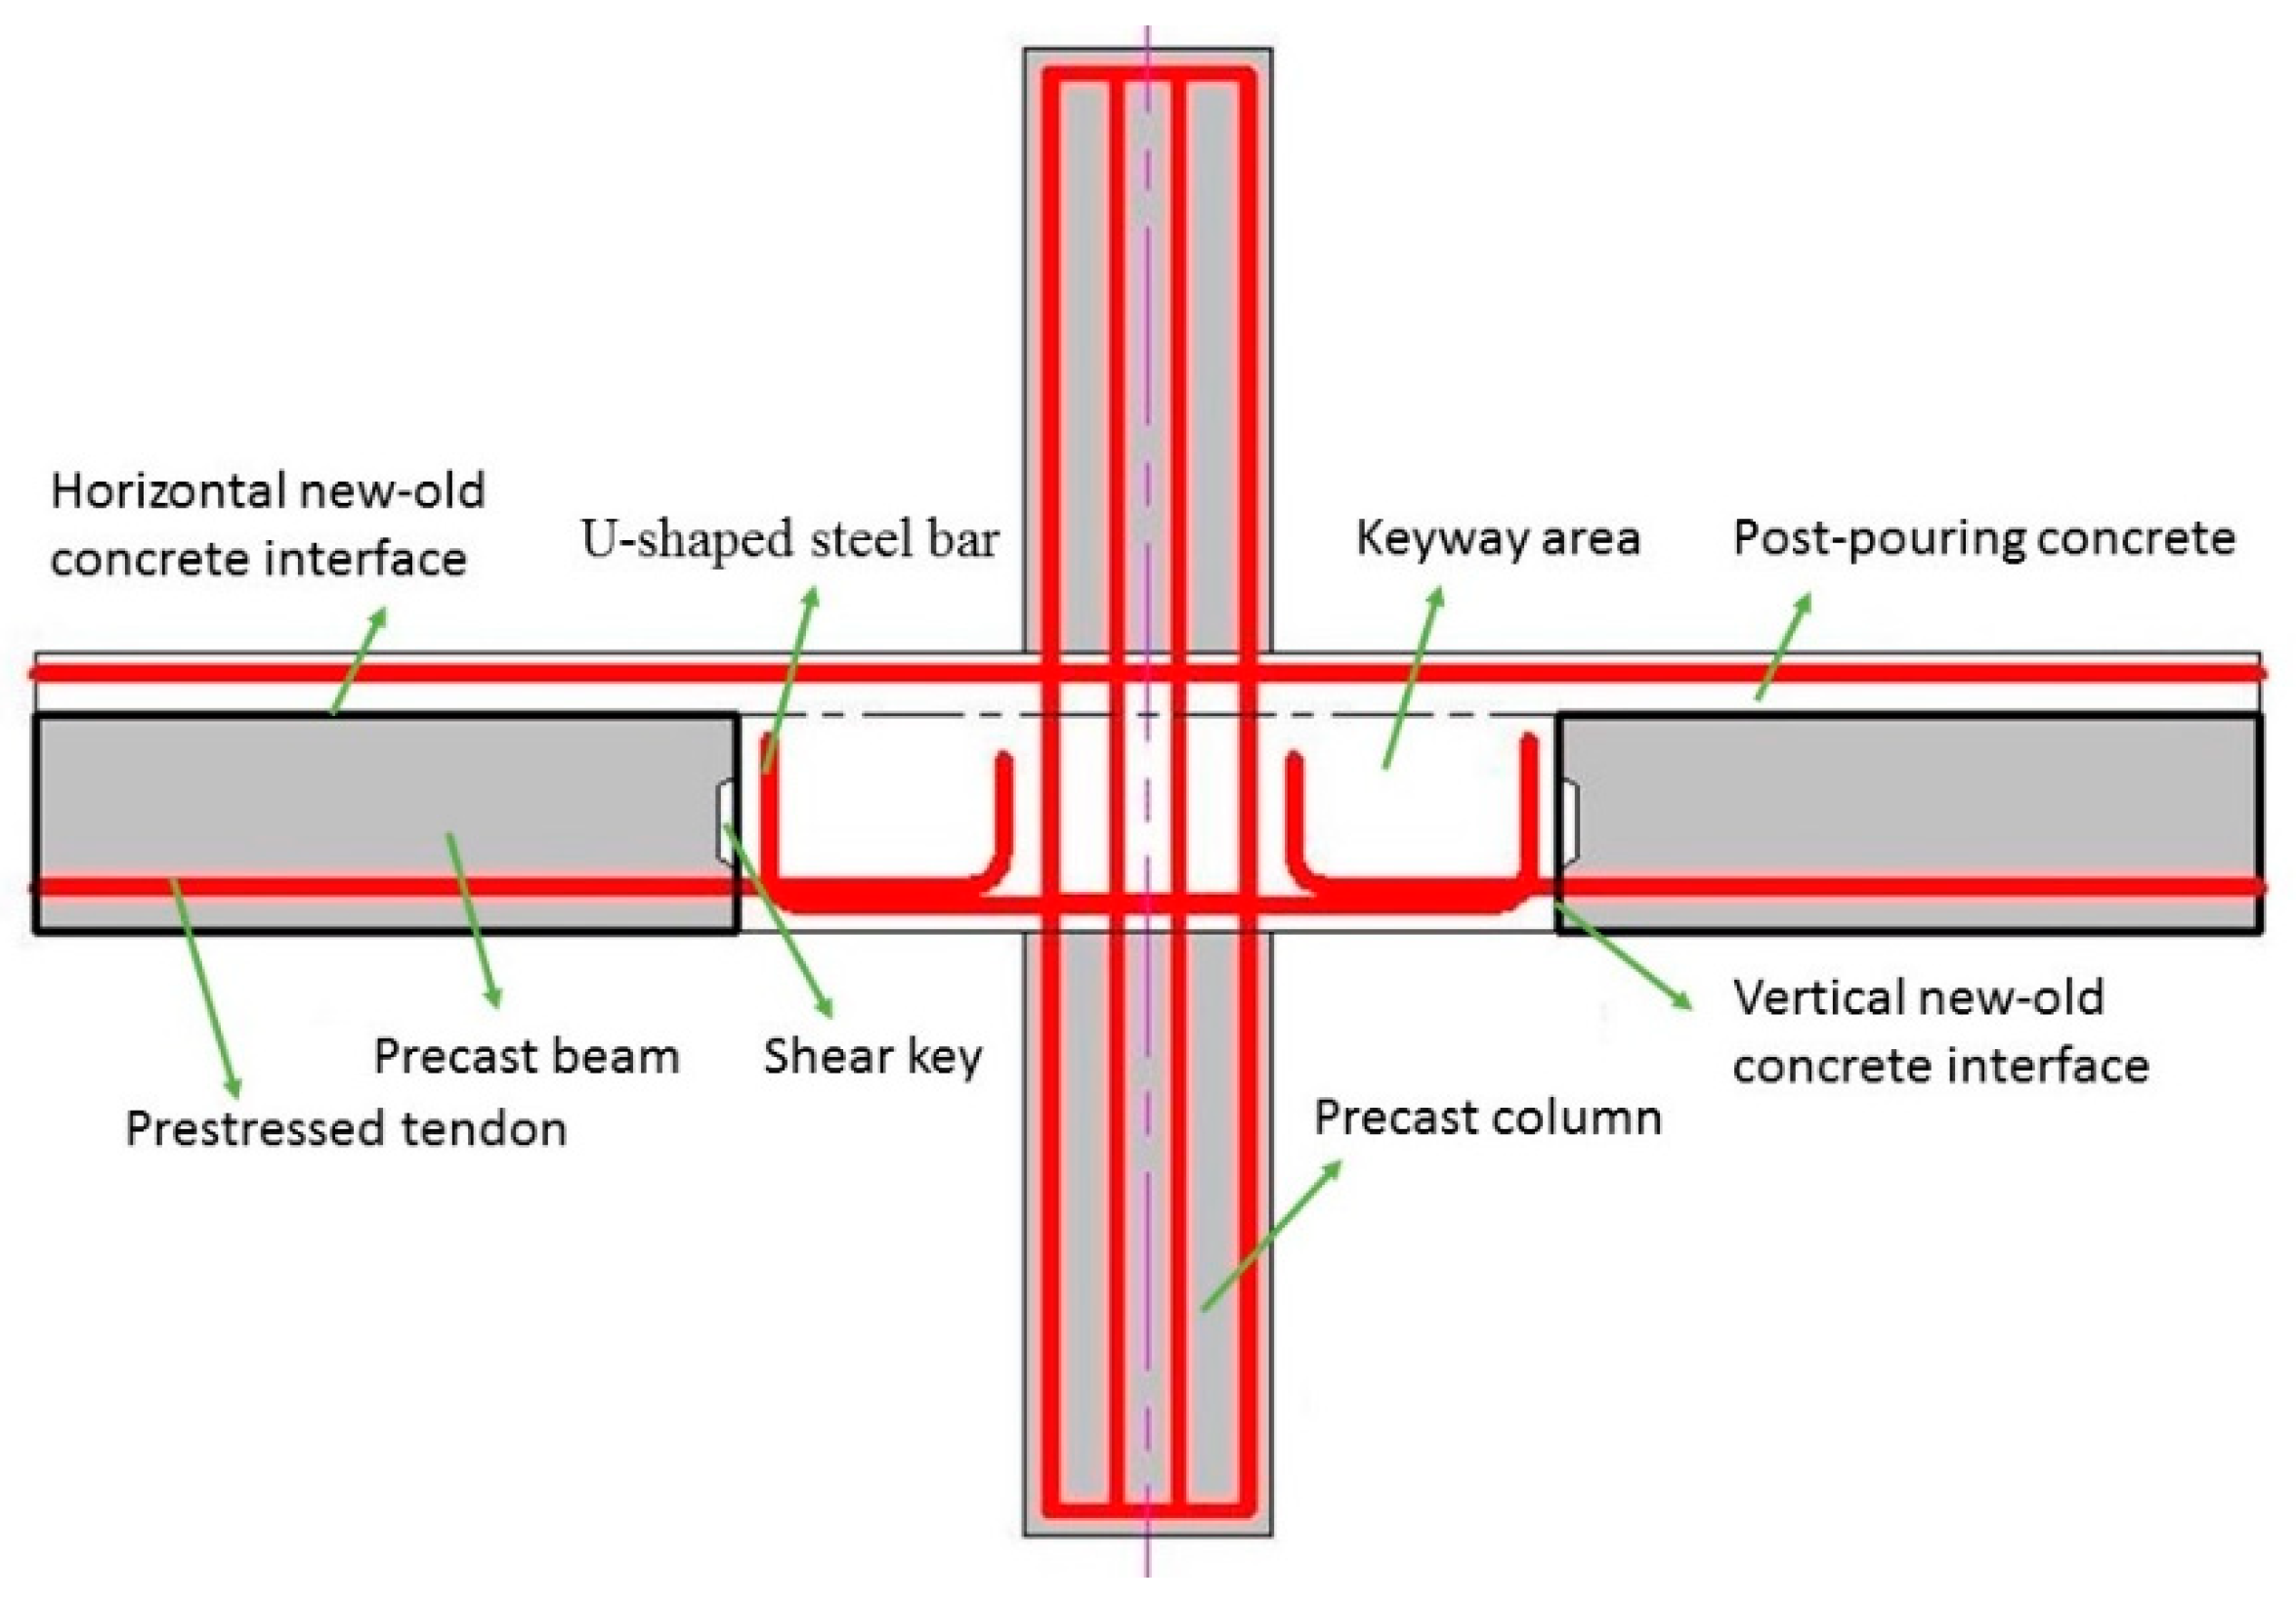
The precast components of the precast prestressed concrete frame structure studied in this paper include the precast prestressed concrete laminated beams, precast concrete laminated slabs, and precast concrete columns. The precast columns can also be changed to cast-in-place concrete columns. The specialty of the precast prestressed concrete structure lies in its joint construction. The joints are composed of keyways, U-shaped steel bars, and cast-in-place concrete. When the beam–column joints are connected, the U-shaped steel bars passing through the core area overlap with the prestressing tendons in the keyway area at the end of the beam, and the precast beam and column are connected by post-pouring concrete. This design is conducive to joint construction, but the bar lap connection of the beam end is not ideal for the seismic resistance of the joint. Thus, the frame joint is a primary focus of seismic research on precast prestressed concrete structures. The structural form of the precast prestressed concrete joint is shown in
Figure 1. This post-pouring integrated connection forms a new–old concrete interface between the precast beam and the post-pouring concrete. The integrity of the prefabricated structure was ensured by applying “manual chiseling” to the horizontal new–old concrete interface. The “shearing key” was applied to the vertical new–old concrete interface of the keyway area to enhance the adhesion of the precast member surface and the post-pouring concrete.
The presence of the keyway wall increases the difficulty of setting the concrete cover. The lap bars are not sufficiently in contact with the post-pouring concrete which results in a reduced bonding effect. In this paper, three joints were designed and tested; two were precast prestressed concrete joints, labeled PPCJ1 and PPCJ2, the third was a cast-in-place joint, labeled CIPJ. The joints PPCJ1 and PPCJ2 were placed in the keyway area with C40 and C50 concrete, respectively.
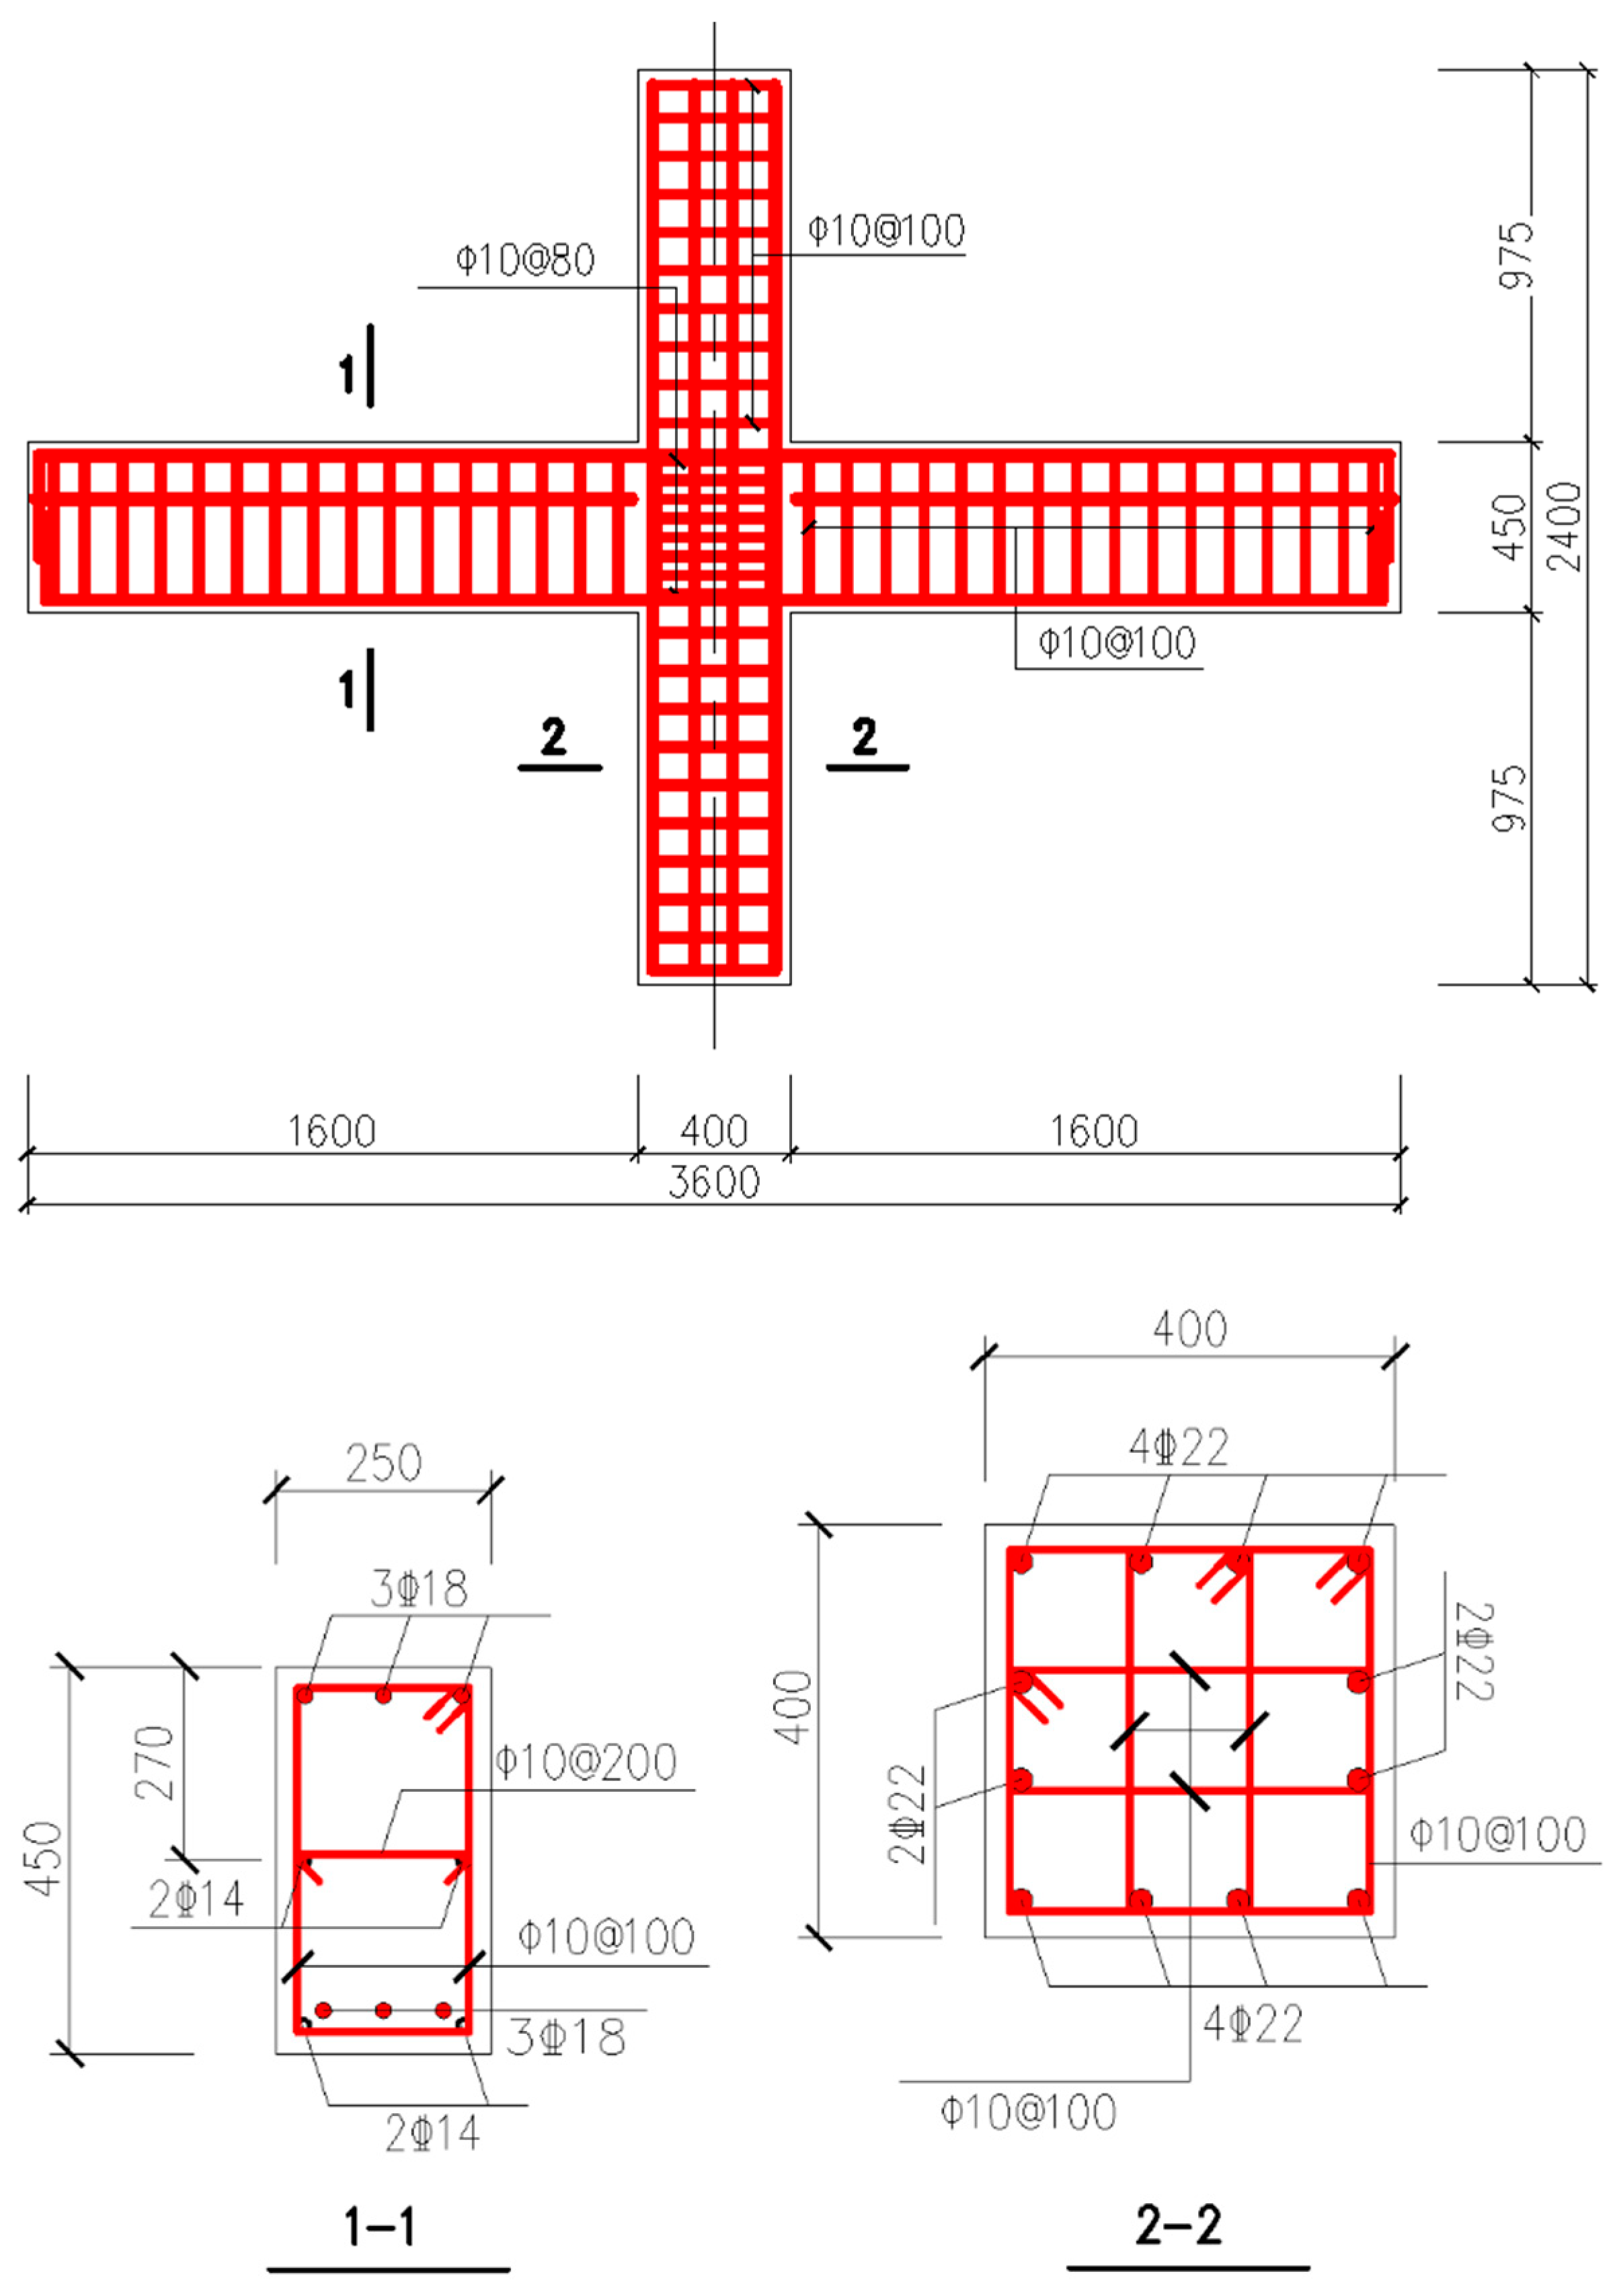
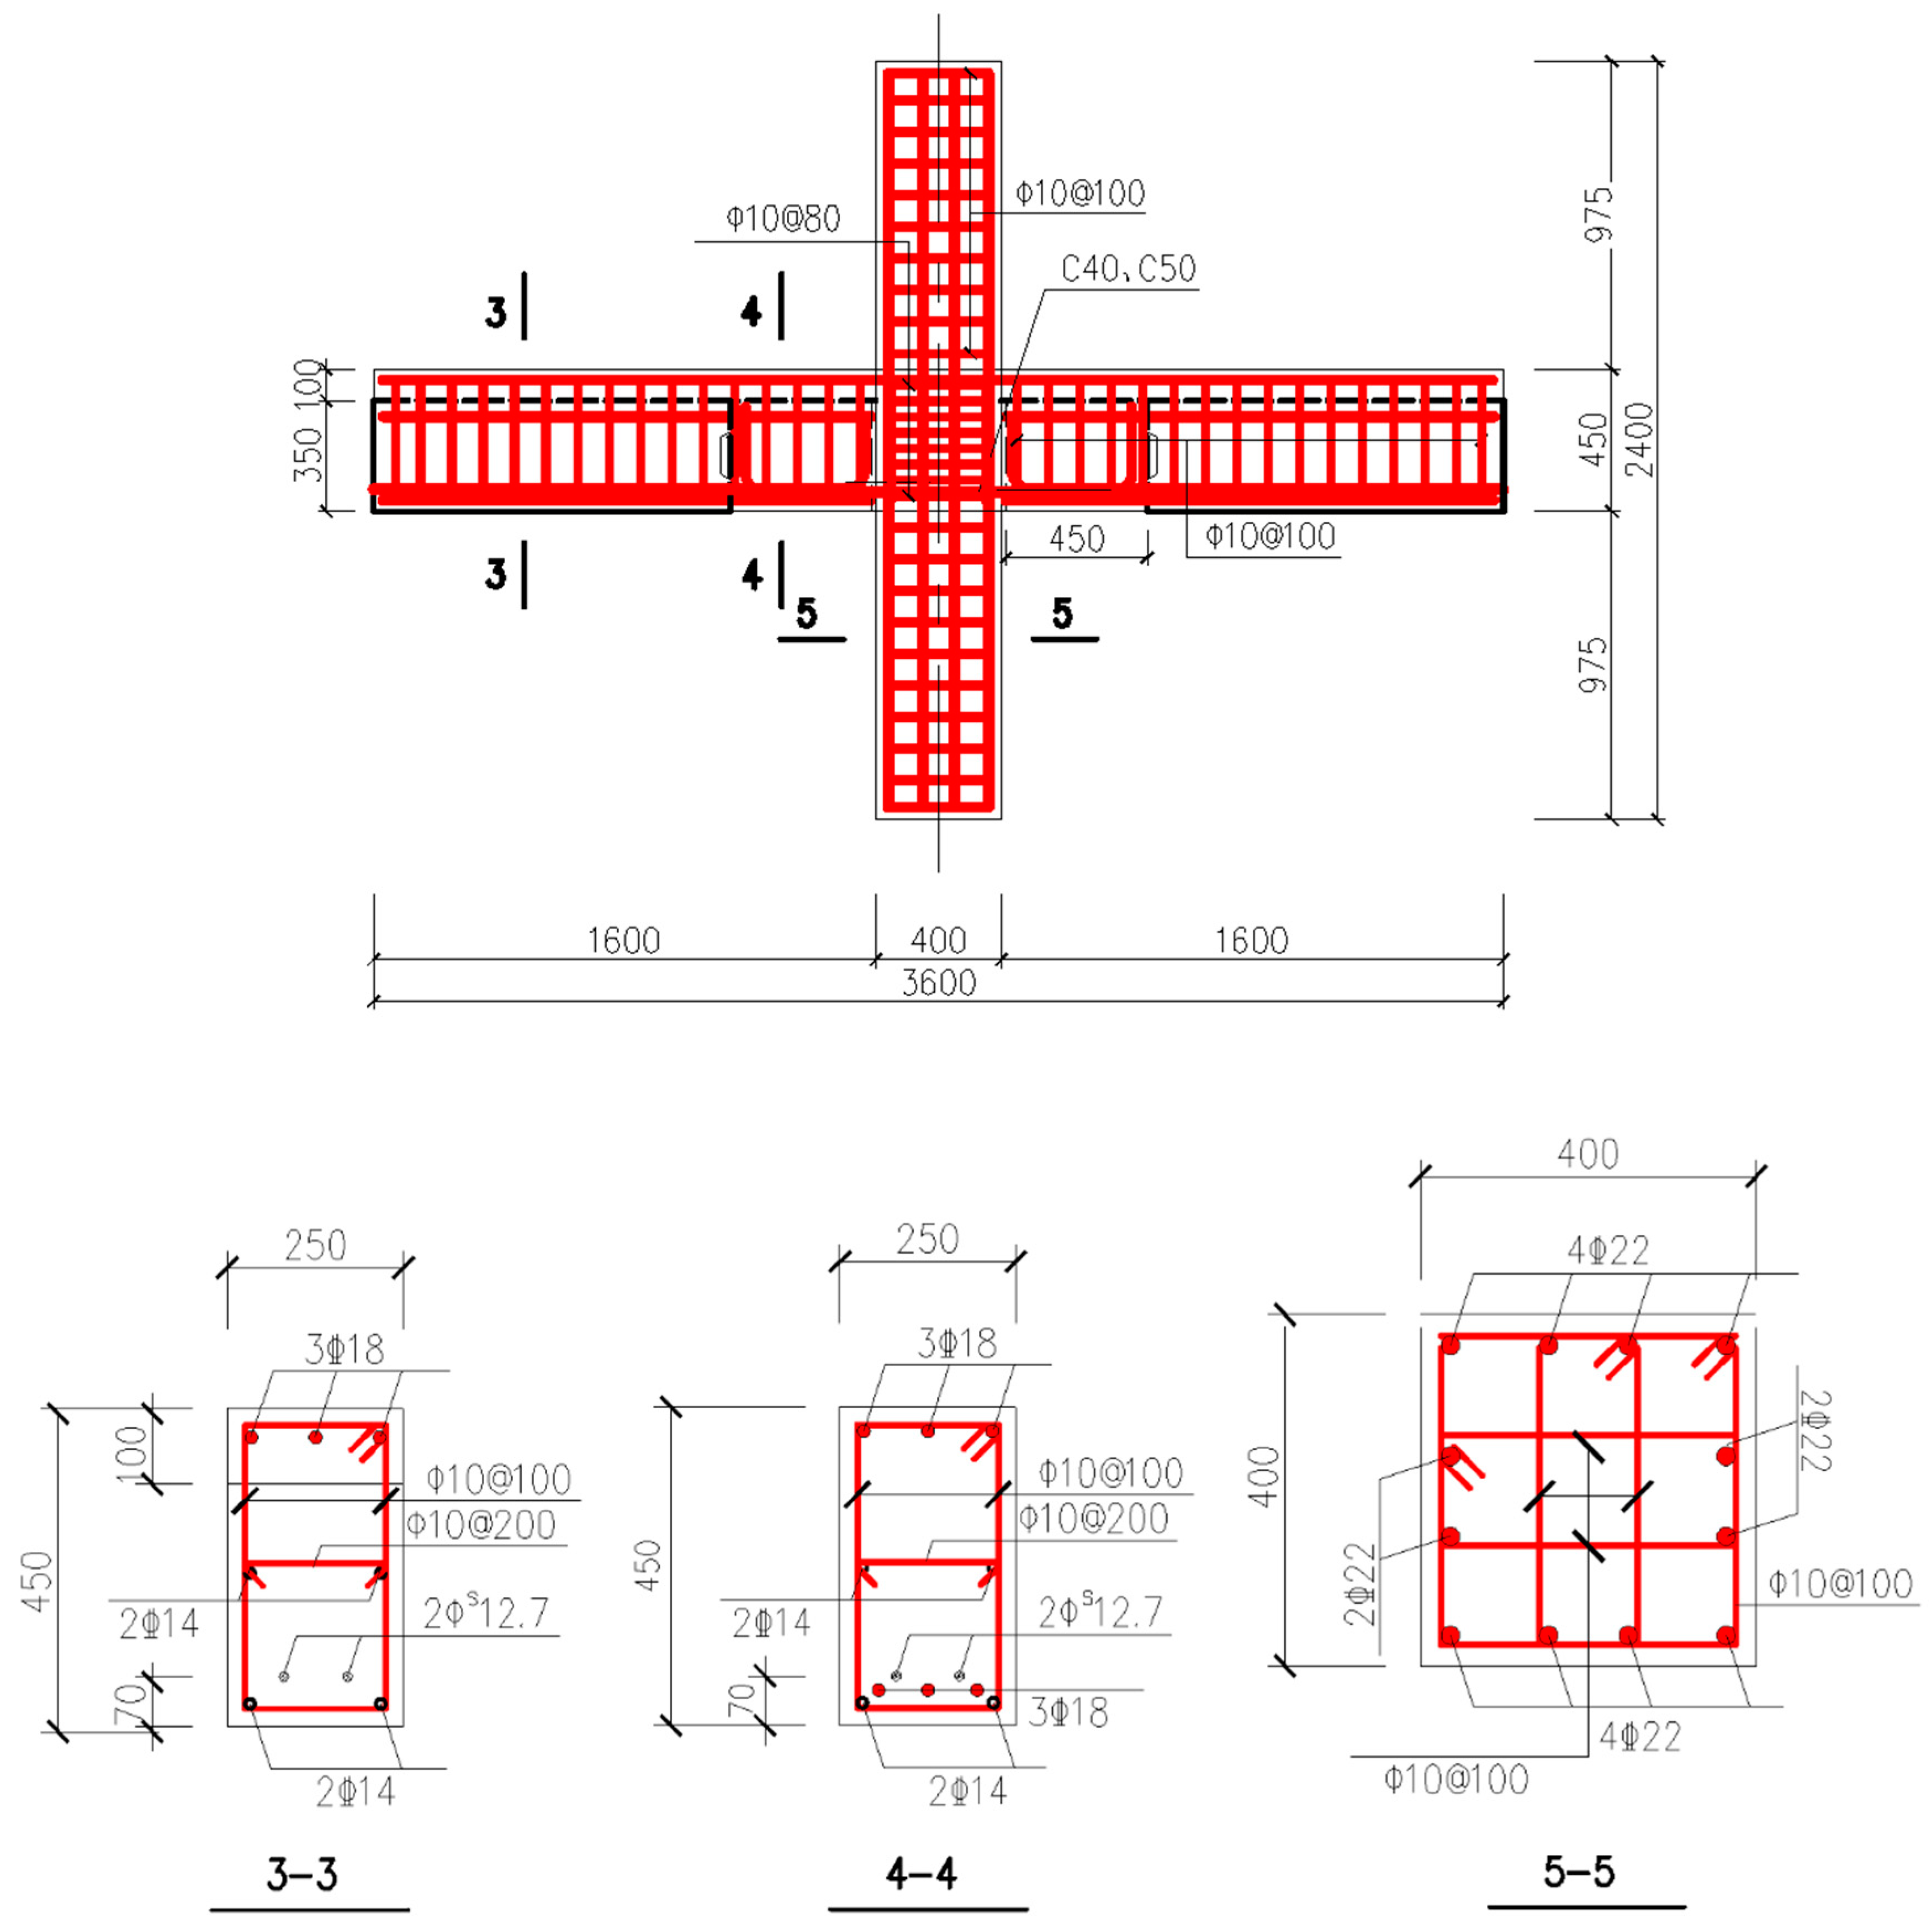
The precast prestressed concrete joints had the same reinforcement and section dimensions as the cast-in-place joint. The cross-section dimensions and reinforcement of the cast-in-place joint and precast prestressed concrete joints are shown in
Figure 2 and
Figure 3. The thickness of the concrete-laminated layer for the precast prestressed concrete joints was 100 mm, and this was the same as the thickness of the floor. The keyway area of the precast prestressed concrete joints was the area from the end of the precast beam to the edge of the column, and it had a length of 450 mm in this design to meet the requirements of steel anchoring. The keyway area did not reserve the keyway wall, and the U-shaped groove was formed by the formwork during construction with the beam end reinforcement being overlapped here. The prestressing tendon of the precast beam extended from the beam body to the edge of the column and had a hook that overlapped the U-shaped bar crossing the core area of the joint to transfer stress.
2.2. Force Transmission Mode
The difference between a precast prestressed concrete joint and a cast-in-place joint is mainly reflected in the new–old concrete interface and the connection force transmission mode of the steel bar. The precast prestressed concrete joint had a laminated beam that had a horizontally joined surface that engaged the cast-in-place concrete, and a vertical interface with the concrete of the keyway area. The performance of the new–old concrete interface affects the overall force of the laminated beam. A poor bonding capacity of the new–old concrete interface and the lack of a reliable force transmission mechanism result in cracking or damage of the new–old concrete interface earlier than in the cast concrete, thereby reducing the bearing capacity of the laminated beam. The shear transmission mechanisms for new–old concrete interfaces are the friction force, pinning shear, and shear resistance of shear key.
The friction force at the new–old concrete interface was generated when the concrete here was sheared causing a relative movement at the interface. When the shear force is less than the maximum friction of the new–old concrete interface, the concrete at both ends of the interface will not move, and the internal force of the laminated beam is transmitted normally at the section including the interface. In this case, a laminated beam has the same performance as a cast-in-place concrete beam.
Shear resistance of the pinning bar occurs when the orthogonal reinforcements that traverse the interfaces do not have sufficient cohesive force, and the concrete surfaces at both ends of the interface cannot transfer the shear. Consequently, the steel bar which traverses the new–old concrete interface transmits the shear force by bending due to its dislocation deformation. The steel bar that produces this effect is called the pinning bar.
Shear resistance of the shear key develops from the concave and convex structure that is artificially placed at the boundary of the concrete. The shear is transmitted by the connection of the concave and convex concrete, and that limits the dislocation deformation of the boundary. The shear strength of the shear key is the smaller value between the shear force that causes the shear destruction of the keyway and the shear force that causes the compressive failure of the surface concrete for the shear key. The inclination angle of the boundary surface of the shear key has a large influence on the strength of the interface. When the inclination angle of the boundary surface is too large, the inclination surface is prone to slip failure, while, if it is too small, the convex part is prone to punching failure.
The horizontal new–old concrete interface is subjected to less shearing force and has a larger interface area. Therefore, “manual chiseling” was performed on the top of the precast beam to enhance the friction effect between the precast beam and the post-pouring concrete. The stirrup was used as an orthogonal steel bar that can act as a pinning bar when the interface has some slippage and serves as a second line of defense against shearing. The vertical new–old concrete interface of the keyway area mainly bears the vertical shearing force and bending moment of the interface. The bonding between the new and old concrete at the interface is weak, which causes the weakening of the tensile bearing capacity and shear bearing capacity of the interface. However, the compressive bearing capacity is not significantly affected. The shear key was set at the interface to bear most of the shearing force to ensure that shear bearing capacity is maintained. The structure of the keyway area is shown in
Figure 4.
2.3. Concrete and Steel Properties
The compressive strength and elastic modulus of the concrete were measured by the strength testing of standard prismatic 150 mm × 150 mm × 300 mm specimens for the same 28-day curing conditions. The results of concrete strength testing are listed in
Table 1. The properties of the steel bars were tested, and the properties are given in
Table 2.
2.4. Test Method
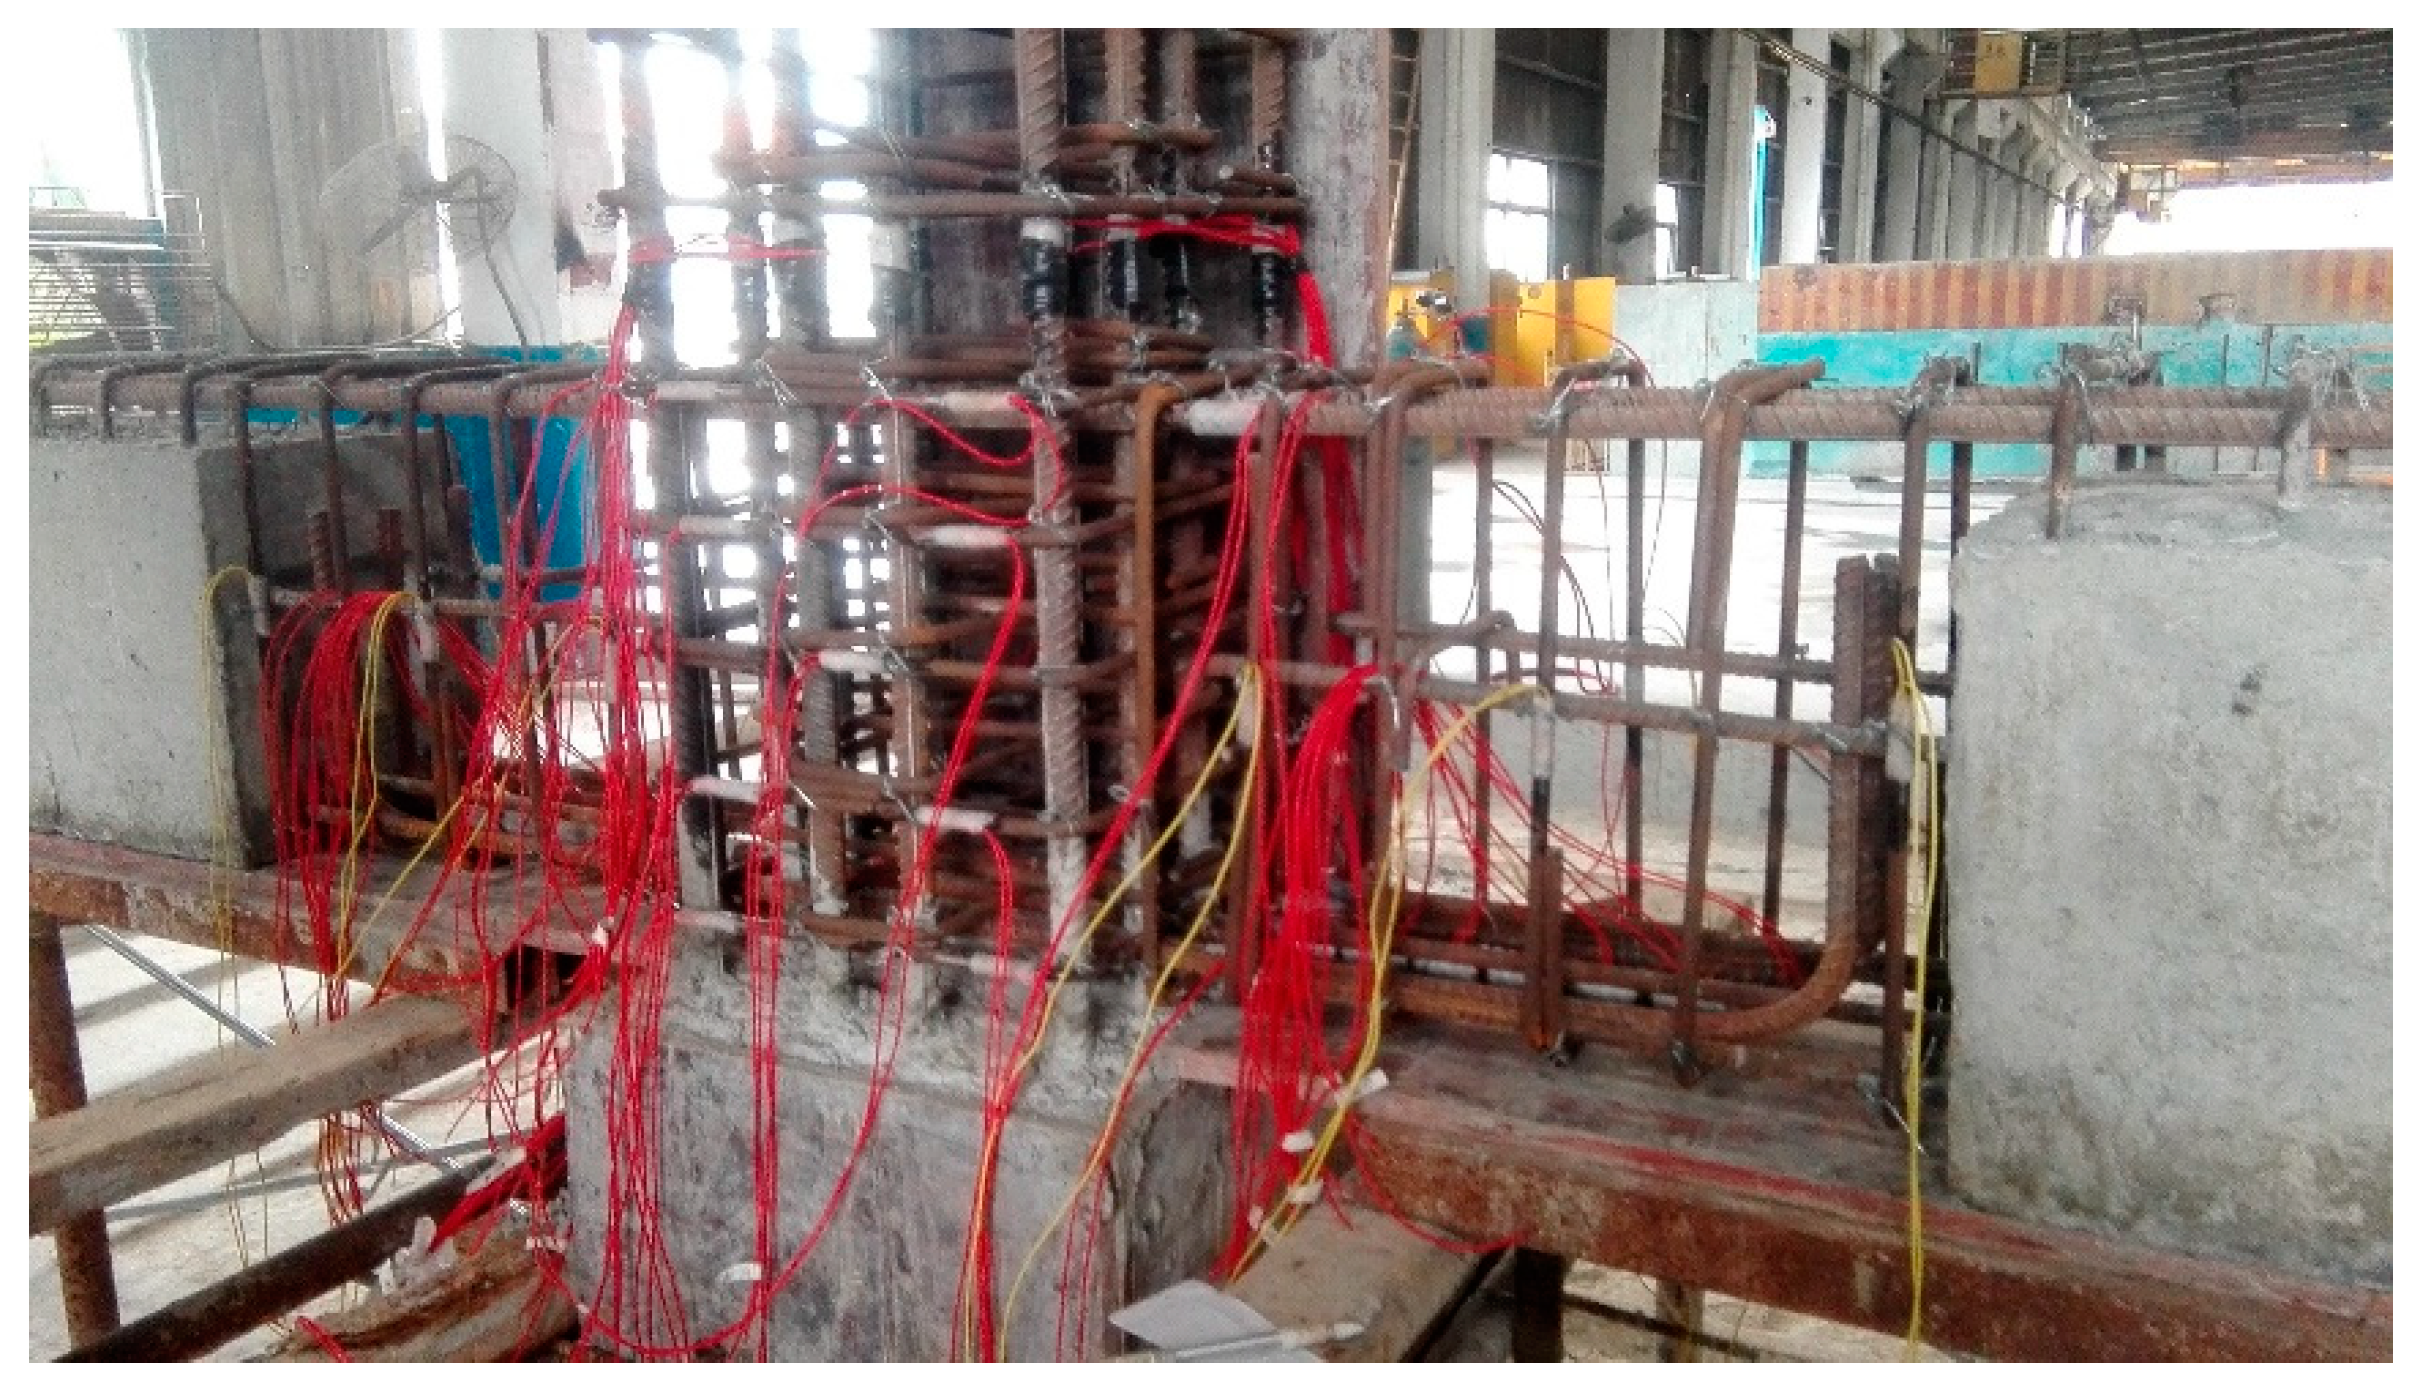
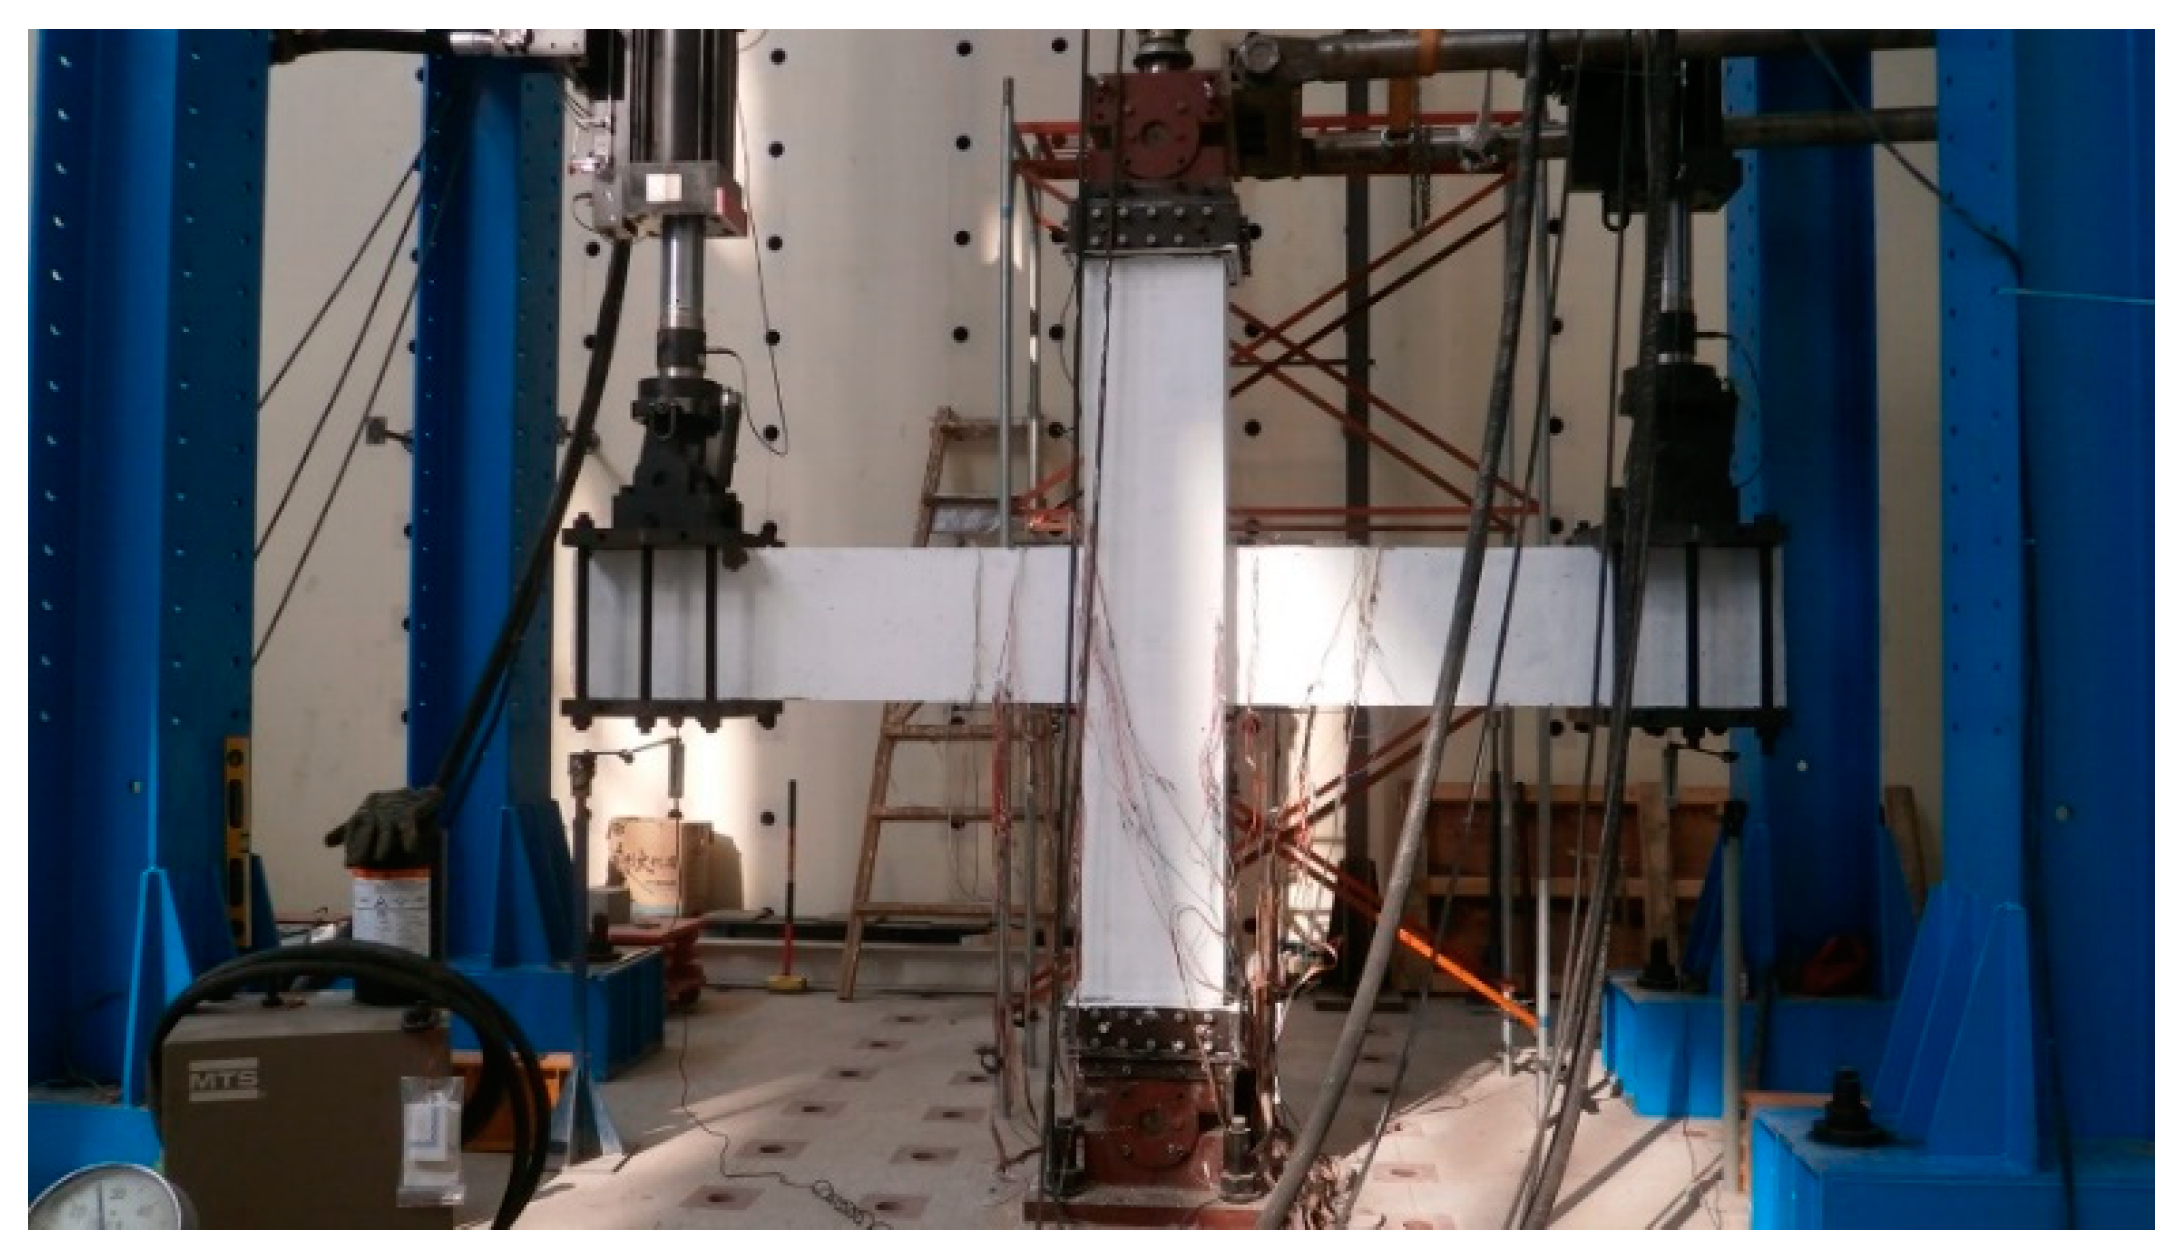
The test was performed at the Fujian Institute of Engineering on an MTS loading system using two 500-kN electro-hydraulic servo actuators with a stroke of ±20 mm for the reversed cyclic loading. The load was applied at the beam ends. A one-way rotating fixed hinge bearing was installed at the upper and lower column ends of the joint to simulate the effect of hinge restraints on the joint. The actuators were applied to two sides of the beam that caused the joint to bend under loading. The test set-up is shown in
Figure 5.
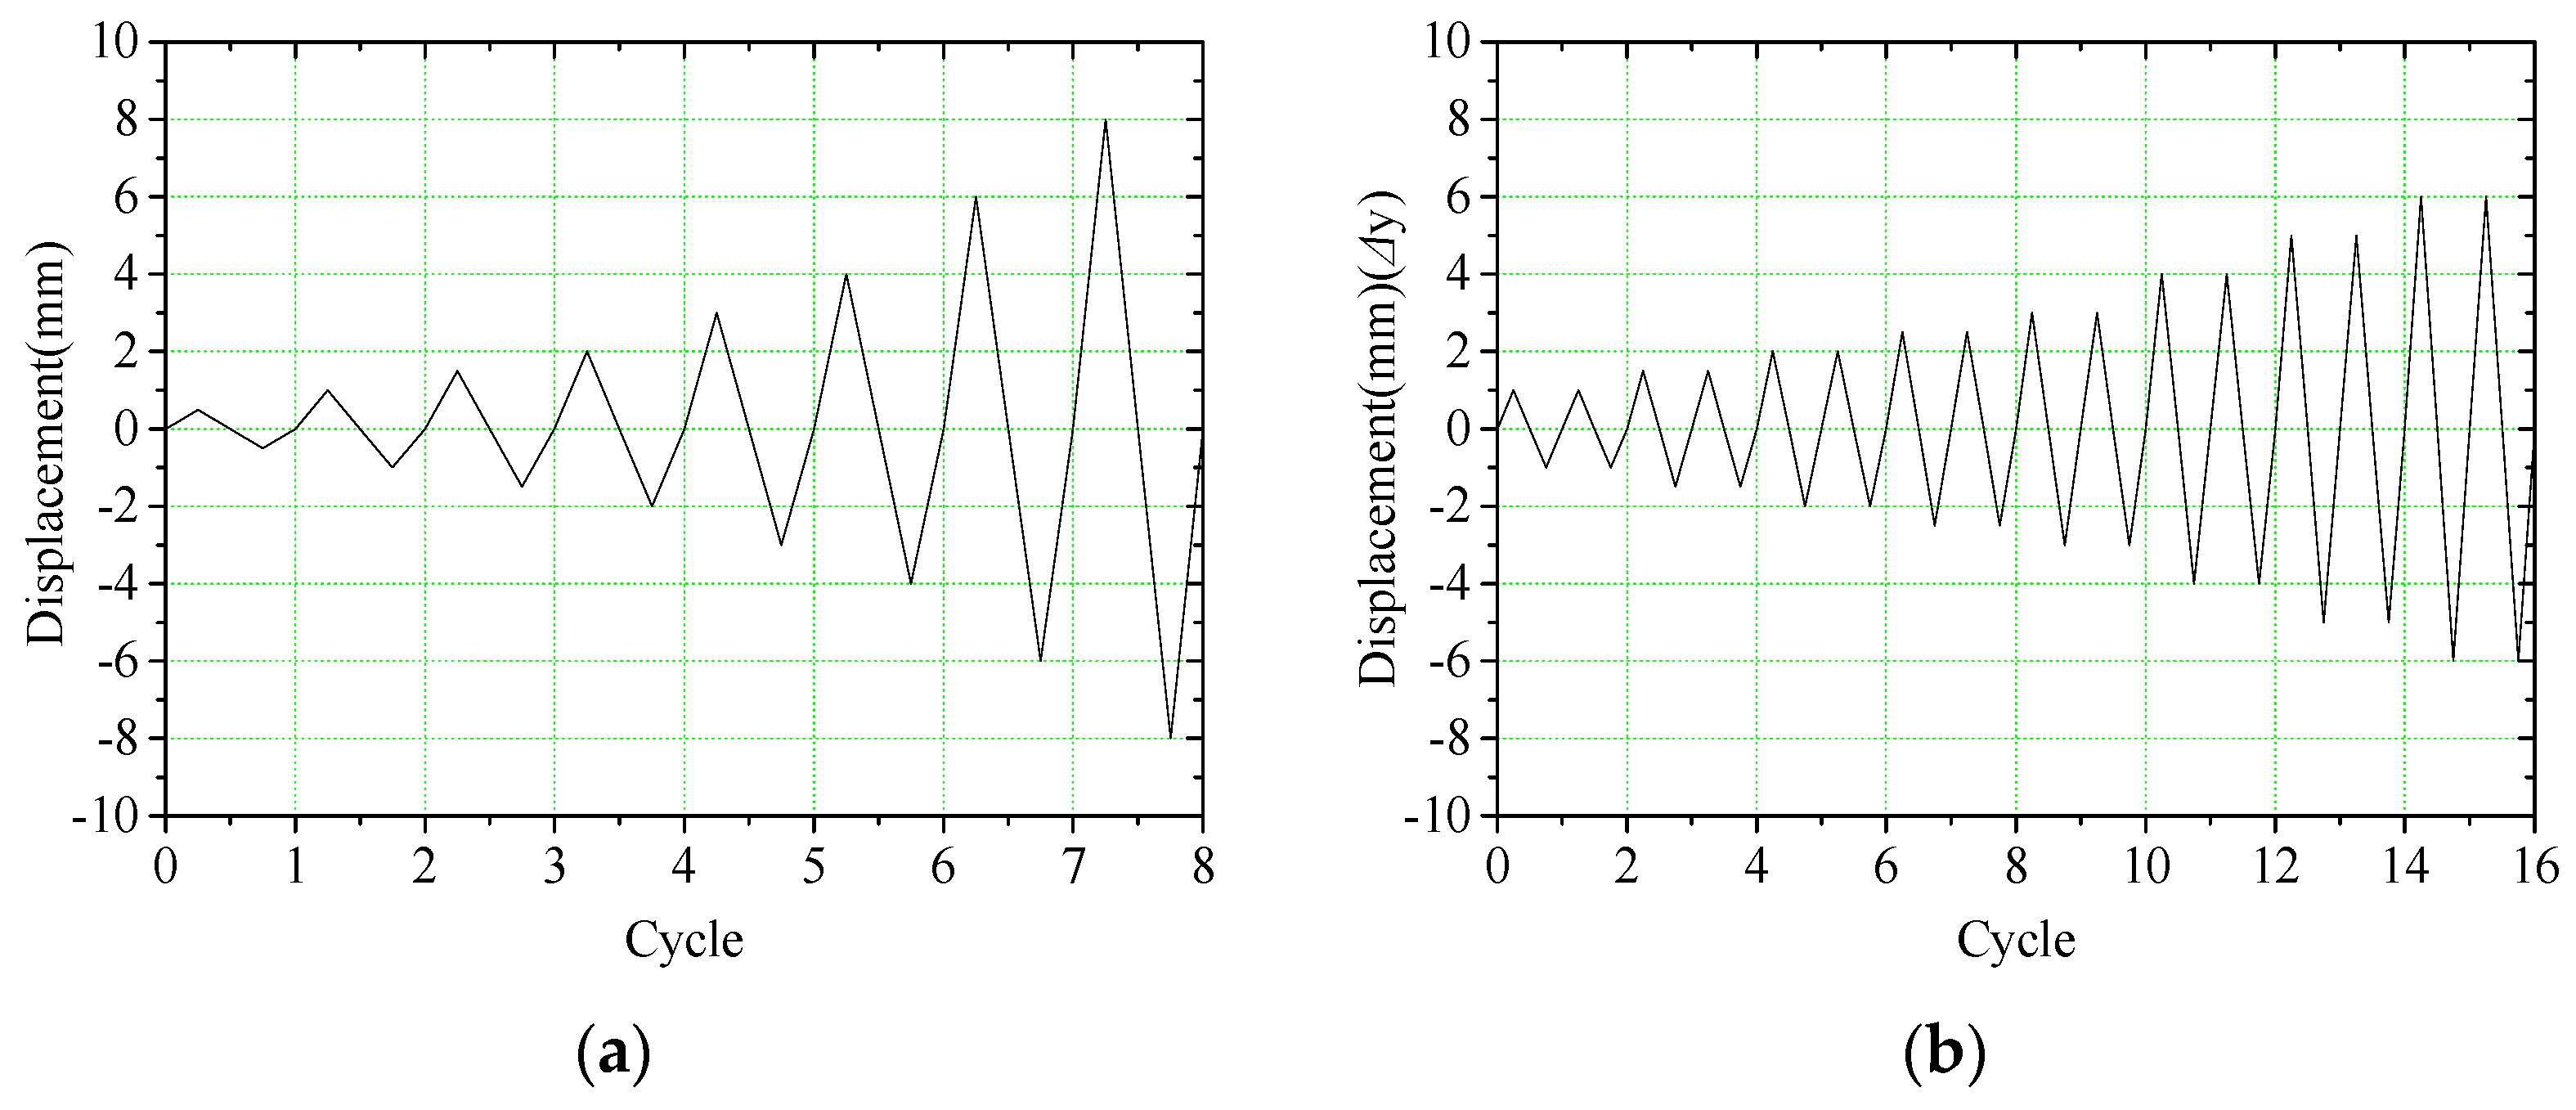
The reversed cyclic loading test of the plane frame joints also allows for investigation of the beam end and the joint core area. The difficulty in calculating the bearing capacity of the precast joints limits the accuracy of determining the yield point during the test. Thus, a situation with the loading force being greater than the yield force may occur and cause the specimen to be damaged earlier than expected. Displacement control was used for the elastic loading phase and the plastic loading phase in this test, and the loading schemes for these phases are shown in
Figure 6.
4. Hysteresis Curve and Skeleton Curve
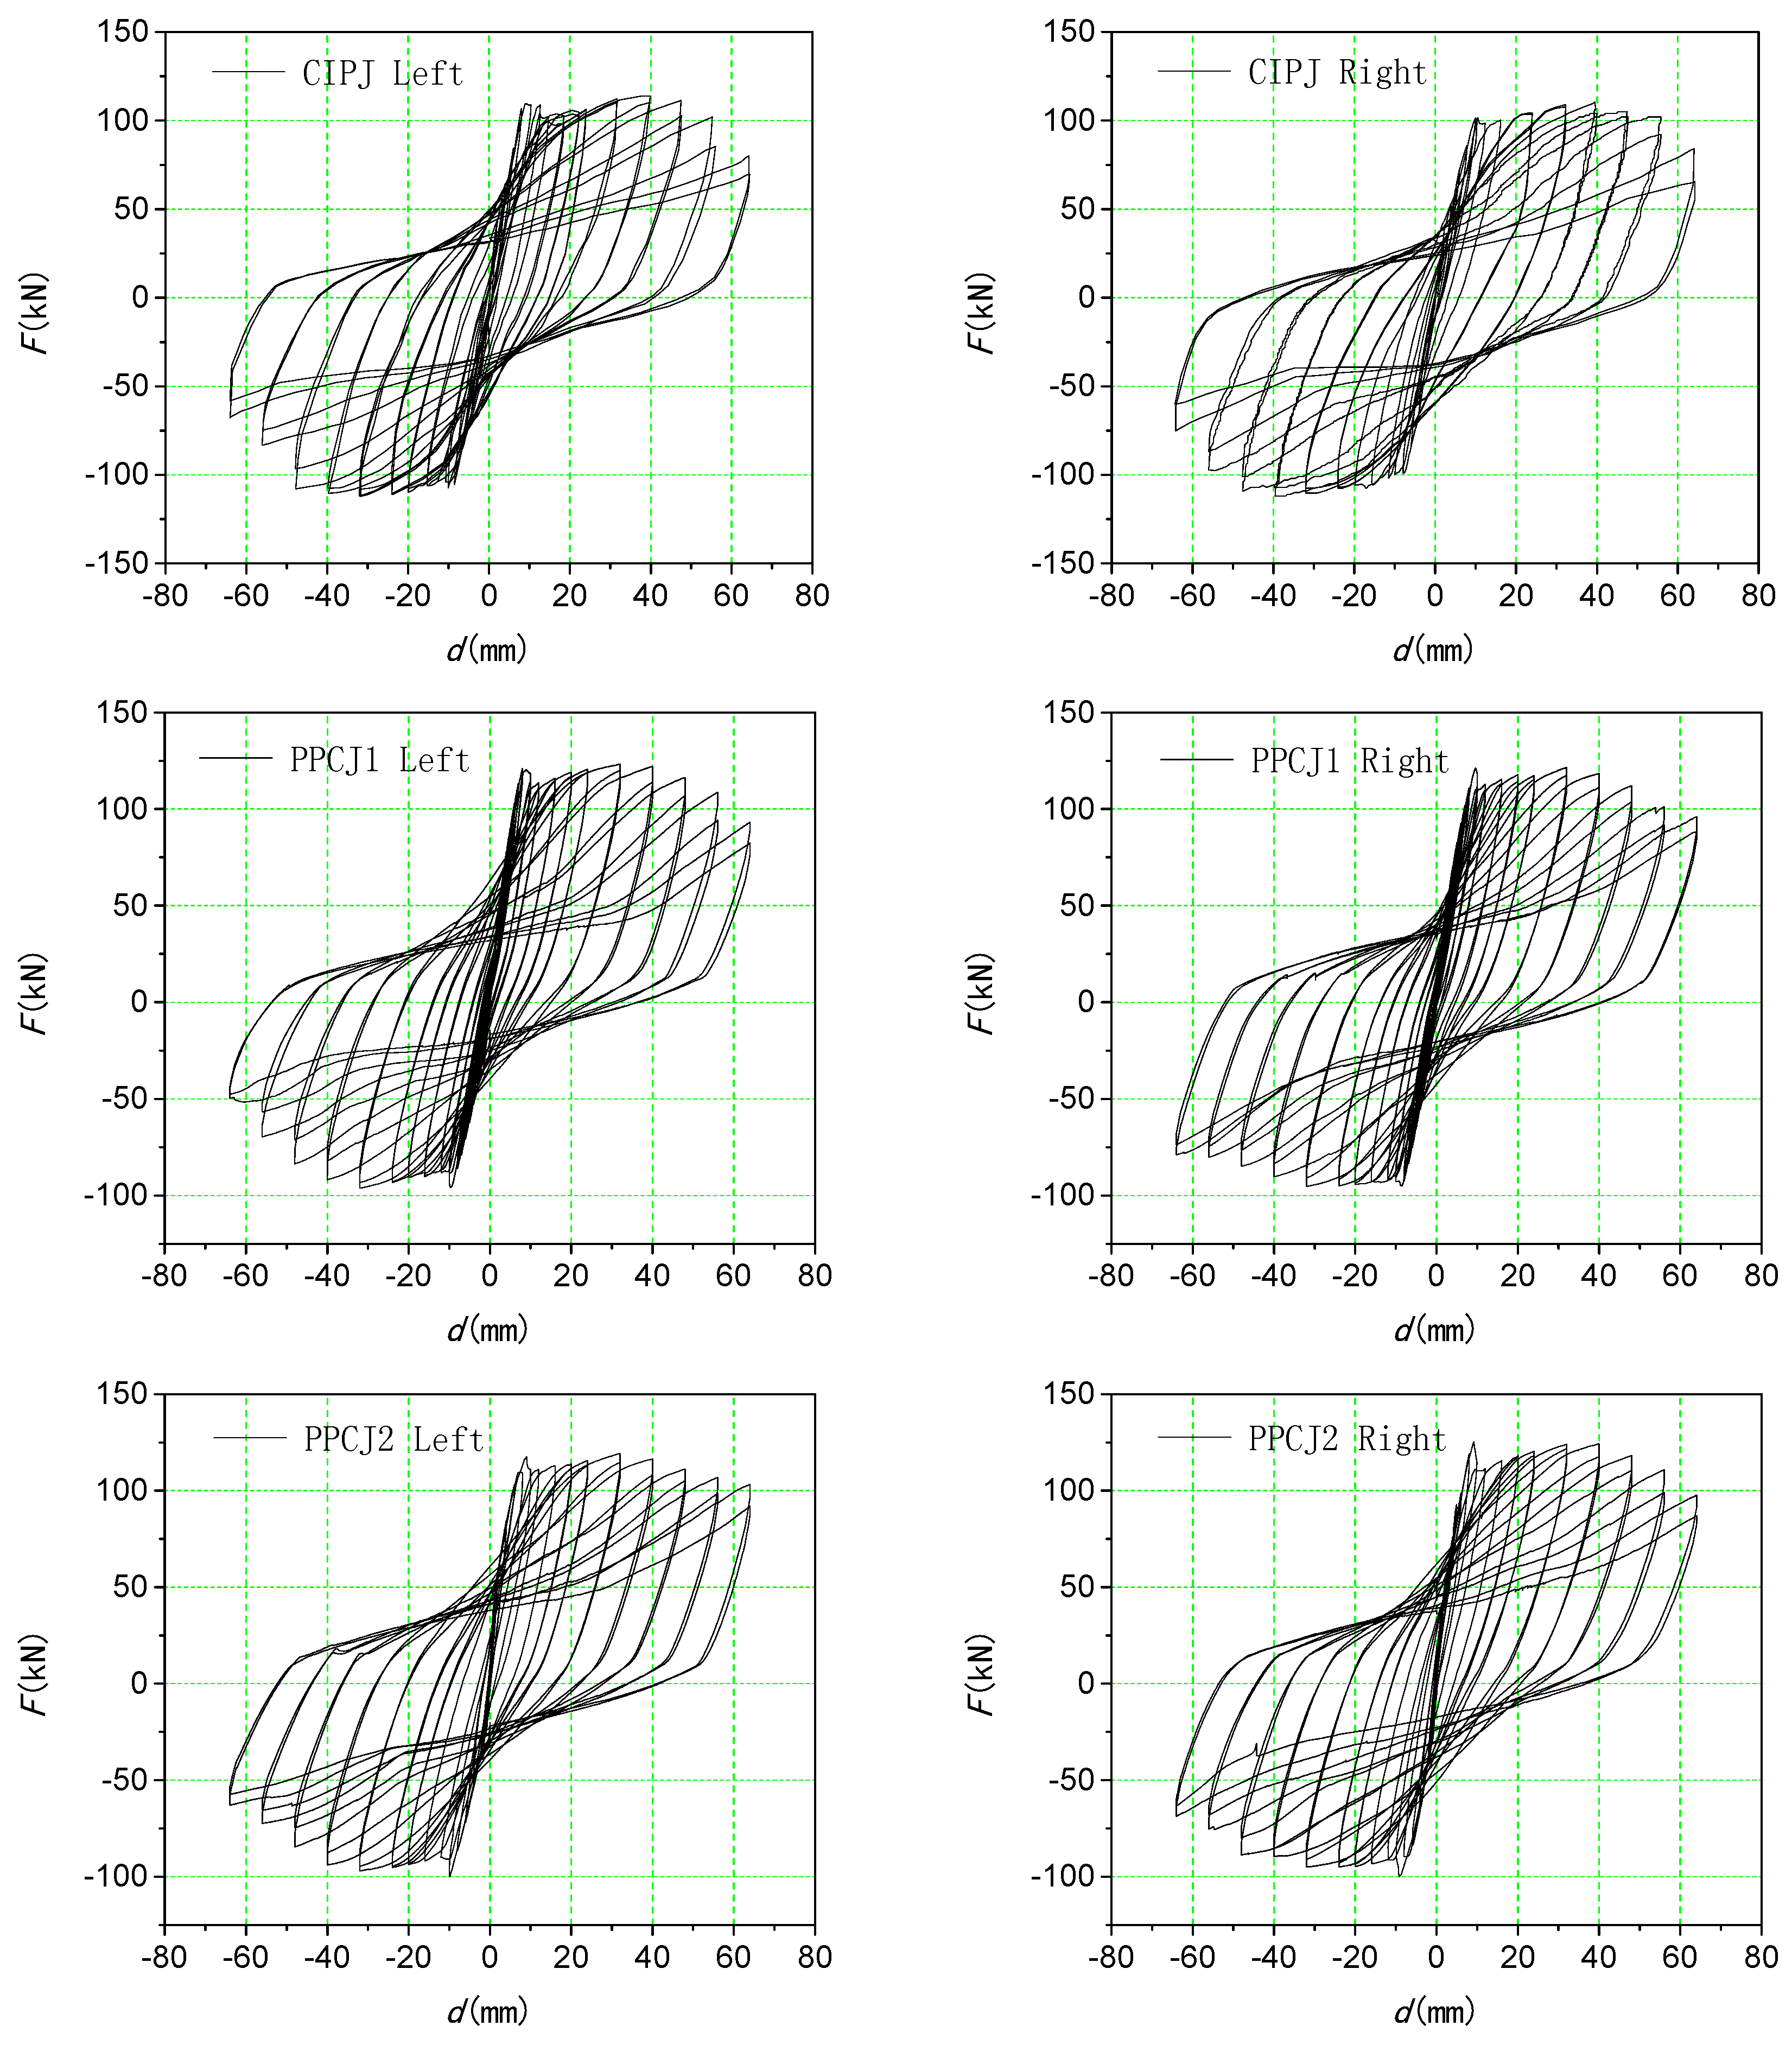
The hysteresis curves of the three joints are shown in
Figure 16. The hysteresis curves are smooth and full for all joints. At the initial stage of loading, the structures were in the elastic phase, and the forward and reverse loading curves of the hysteresis loops were almost coincident. The hysteresis curves showed nonlinearity when the joints became cracked, and the concrete was damaged. This nonlinearity was manifested by the phenomenon of non-coincidence of the loading and unloading curves and pinching of the hysteresis loops. The hysteresis loops were fusiform as the joints progressed from yielding until peak load. A “cusp” appeared in the hysteresis curves from the joint yielding to its complete yielding. These cusps were generally located between 8 and 10 mm. At this cusp, the steel bars began yielding. However, there was a lack of consistency in this yielding due to uncertainties such as the construction of the joint, and the load had to be increased before the joint could be considered fully yielded. After the joints were fully yielded, the pinching phenomenon of the hysteresis loops was seen. The later hysteresis loops gradually develop toward the “anti-S shape”, but the hysteresis loops remained full.
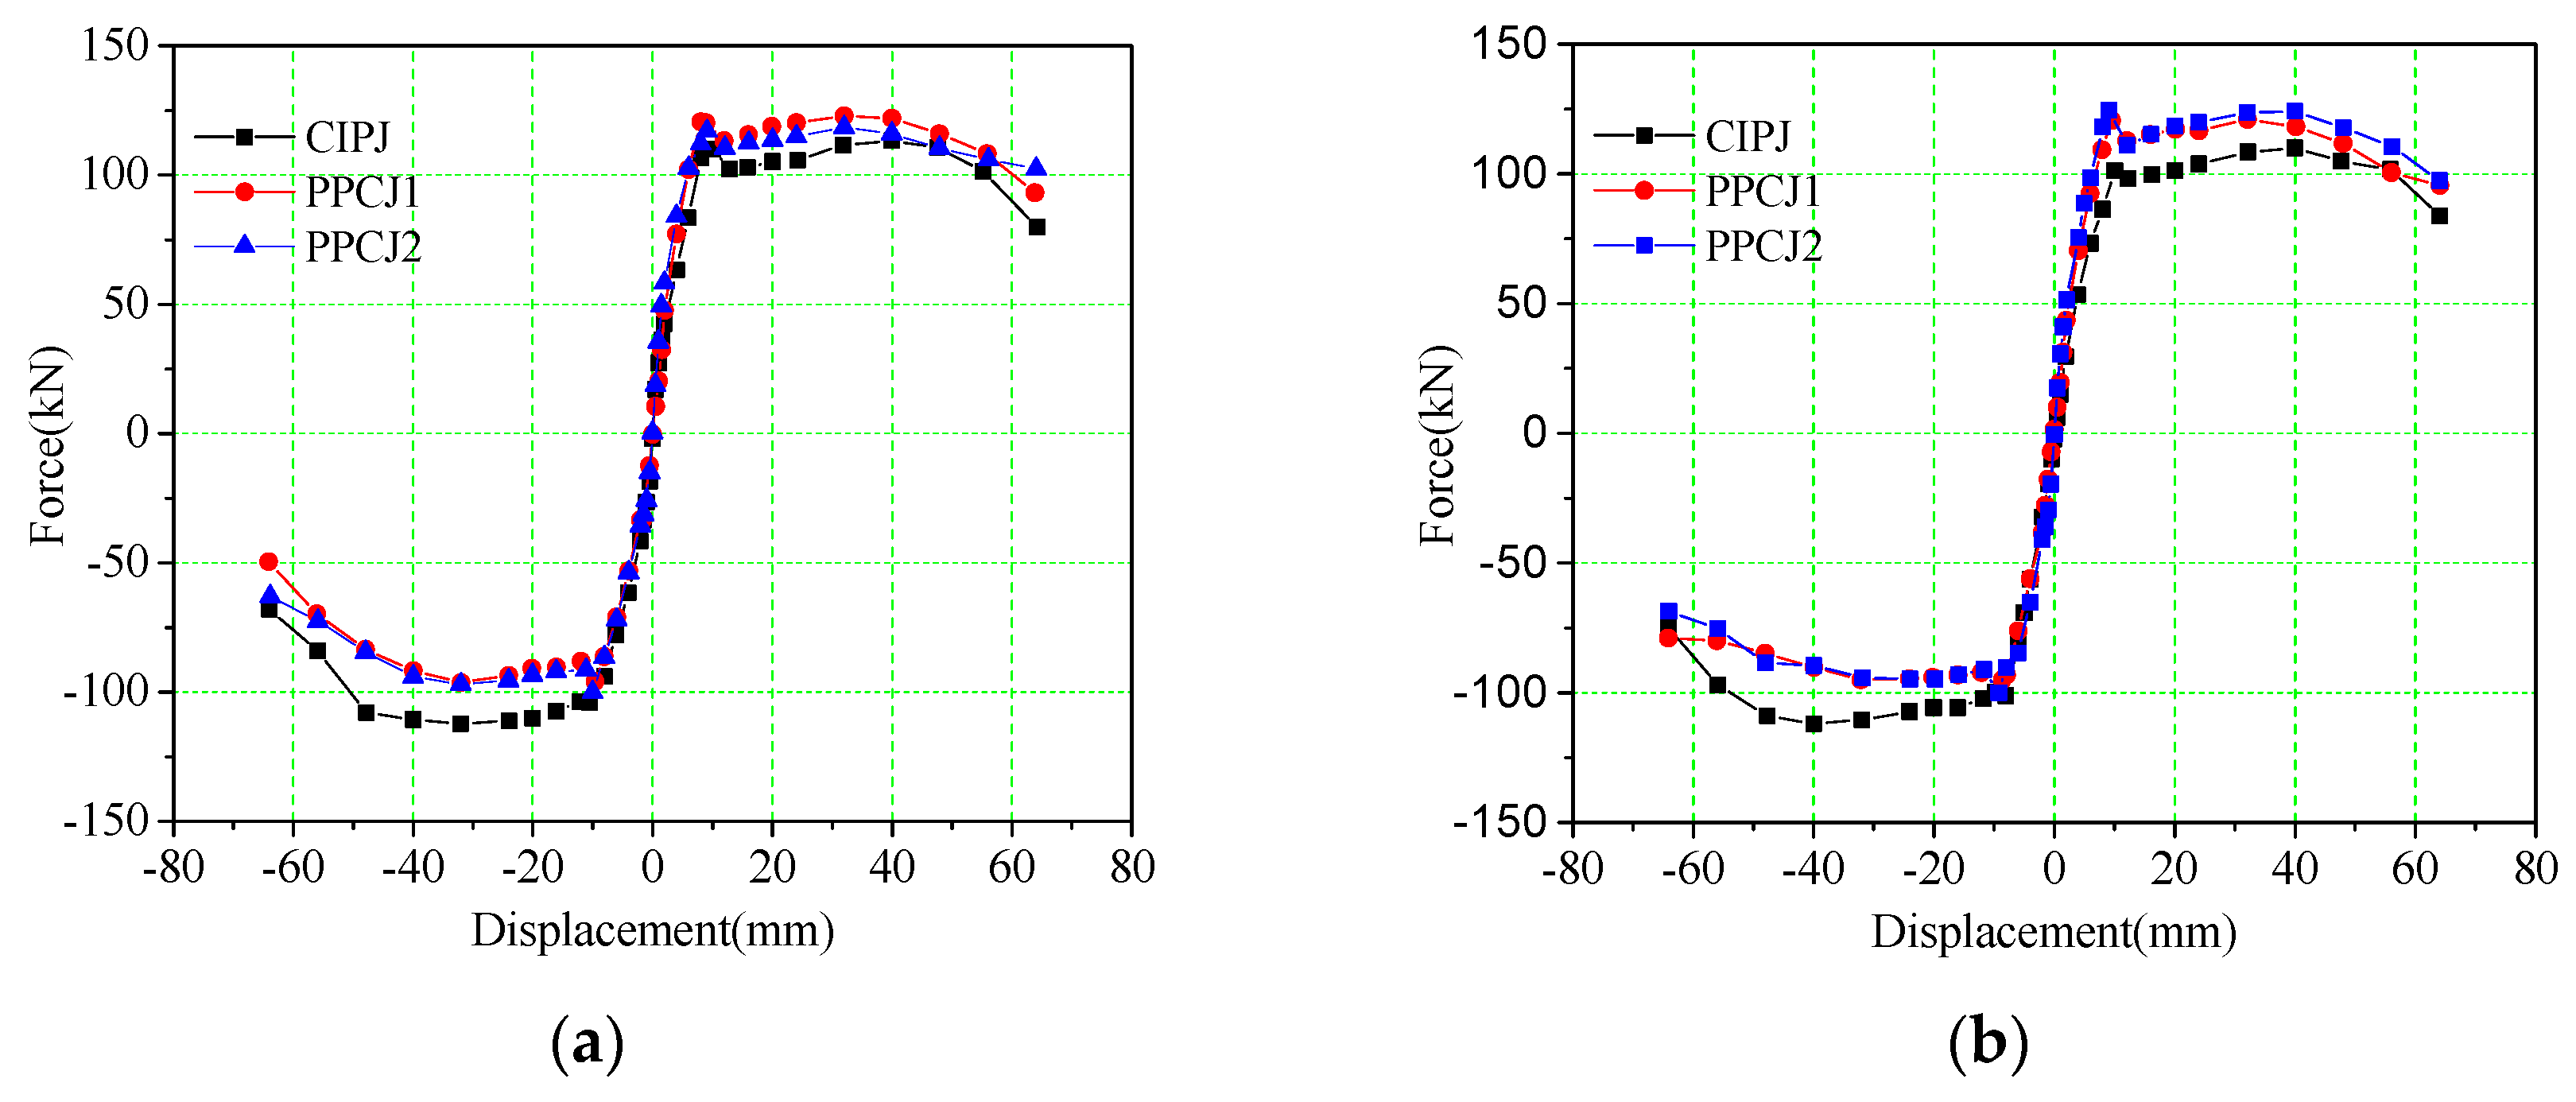
The skeleton curves of the three joints are shown in
Figure 17. The cracking point is the position on the skeleton curve where the test specimen begins to crack. The yield point is commonly determined through the energy equivalence method and geometric mapping method. The skeleton curve of each joint has a clear inflection point; thus, the inflection point was used to determine the yield point. The corresponding force and displacement values were used as the component of the “limit point” when the load on the skeleton curve dropped to 85% of the peak value. The specific values of these parameters determined from the skeleton curves are listed in
Table 3.
It can be seen from
Figure 16 and
Figure 17, and
Table 3 that the cracking displacements of the cast-in-place joint and the precast prestressed concrete joint were different. However, the cracking loads were typically between 31 kN and 42 kN. Generally, the cracking load during forward loading was greater than that during reverse loading. The yield displacement of each joint was relatively close and was about 8–10 mm. The yield point behavior was evident for all joints. The yield, peak, and limit displacements and loads of the two precast prestressed concrete joints were relatively close in both directions, though the load during forward loading was greater than that during reverse loading. The yield, peak, and limit loads of the precast prestressed concrete joint during forward loading were greater than that of the cast-in-place joint, while the loads during reverse loading were smaller than that of the cast-in-place joint. This was because reinforcements of the precast prestressed concrete joints overlap at the beam end, and the effective reinforcement ratio of the beam bottom was improved. Asymmetry of the plastic zone of the beam section was formed since the reinforcement ratio of the beam top was the same as that of the cast-in-place joint. This asymmetry caused greater resistance during forward loading and lower resistance during reverse loading.
5. Stiffness and Bearing Capacity Degradation
The development of concrete cracks and the accumulation of plastic damage during the loading degrade the mechanical properties, such as stiffness and strength, of the joints, thus affecting the ductility and energy dissipation of the joints.
5.1. Stiffness Degradation
Stiffness degradation is the phenomenon where the peak displacement increases with the number of loading cycles under the same peak load. Here, the loop stiffness is used to describe the stiffness degradation, and the loop stiffness is calculated as follows:
where
is the average loop stiffness of the joint in the
jth loading stage;
is the displacement amplitude in the
jth loading stage;
is the number of loading cycles under the same displacement amplitude;
is the peak load in the
ith cycle at the
jth displacement.
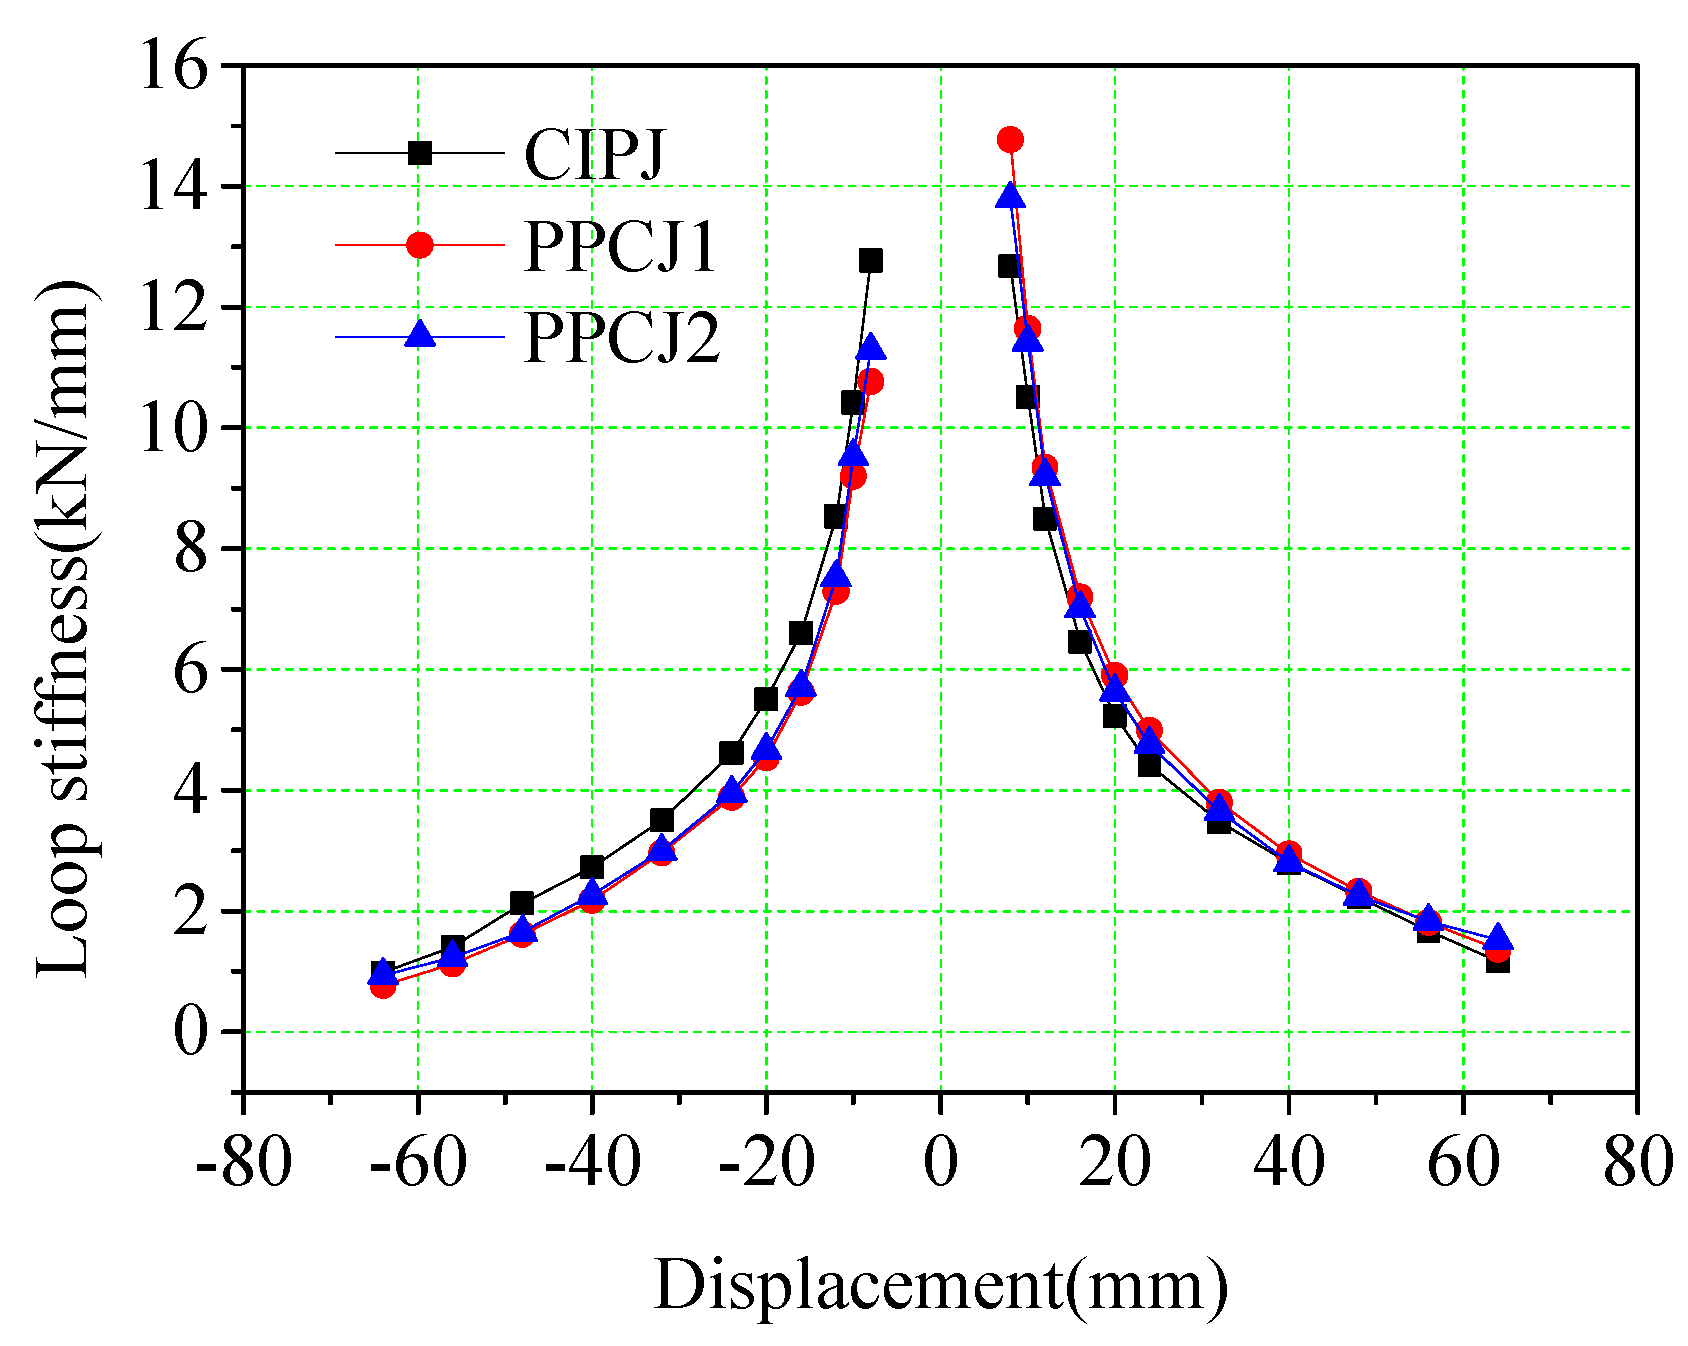
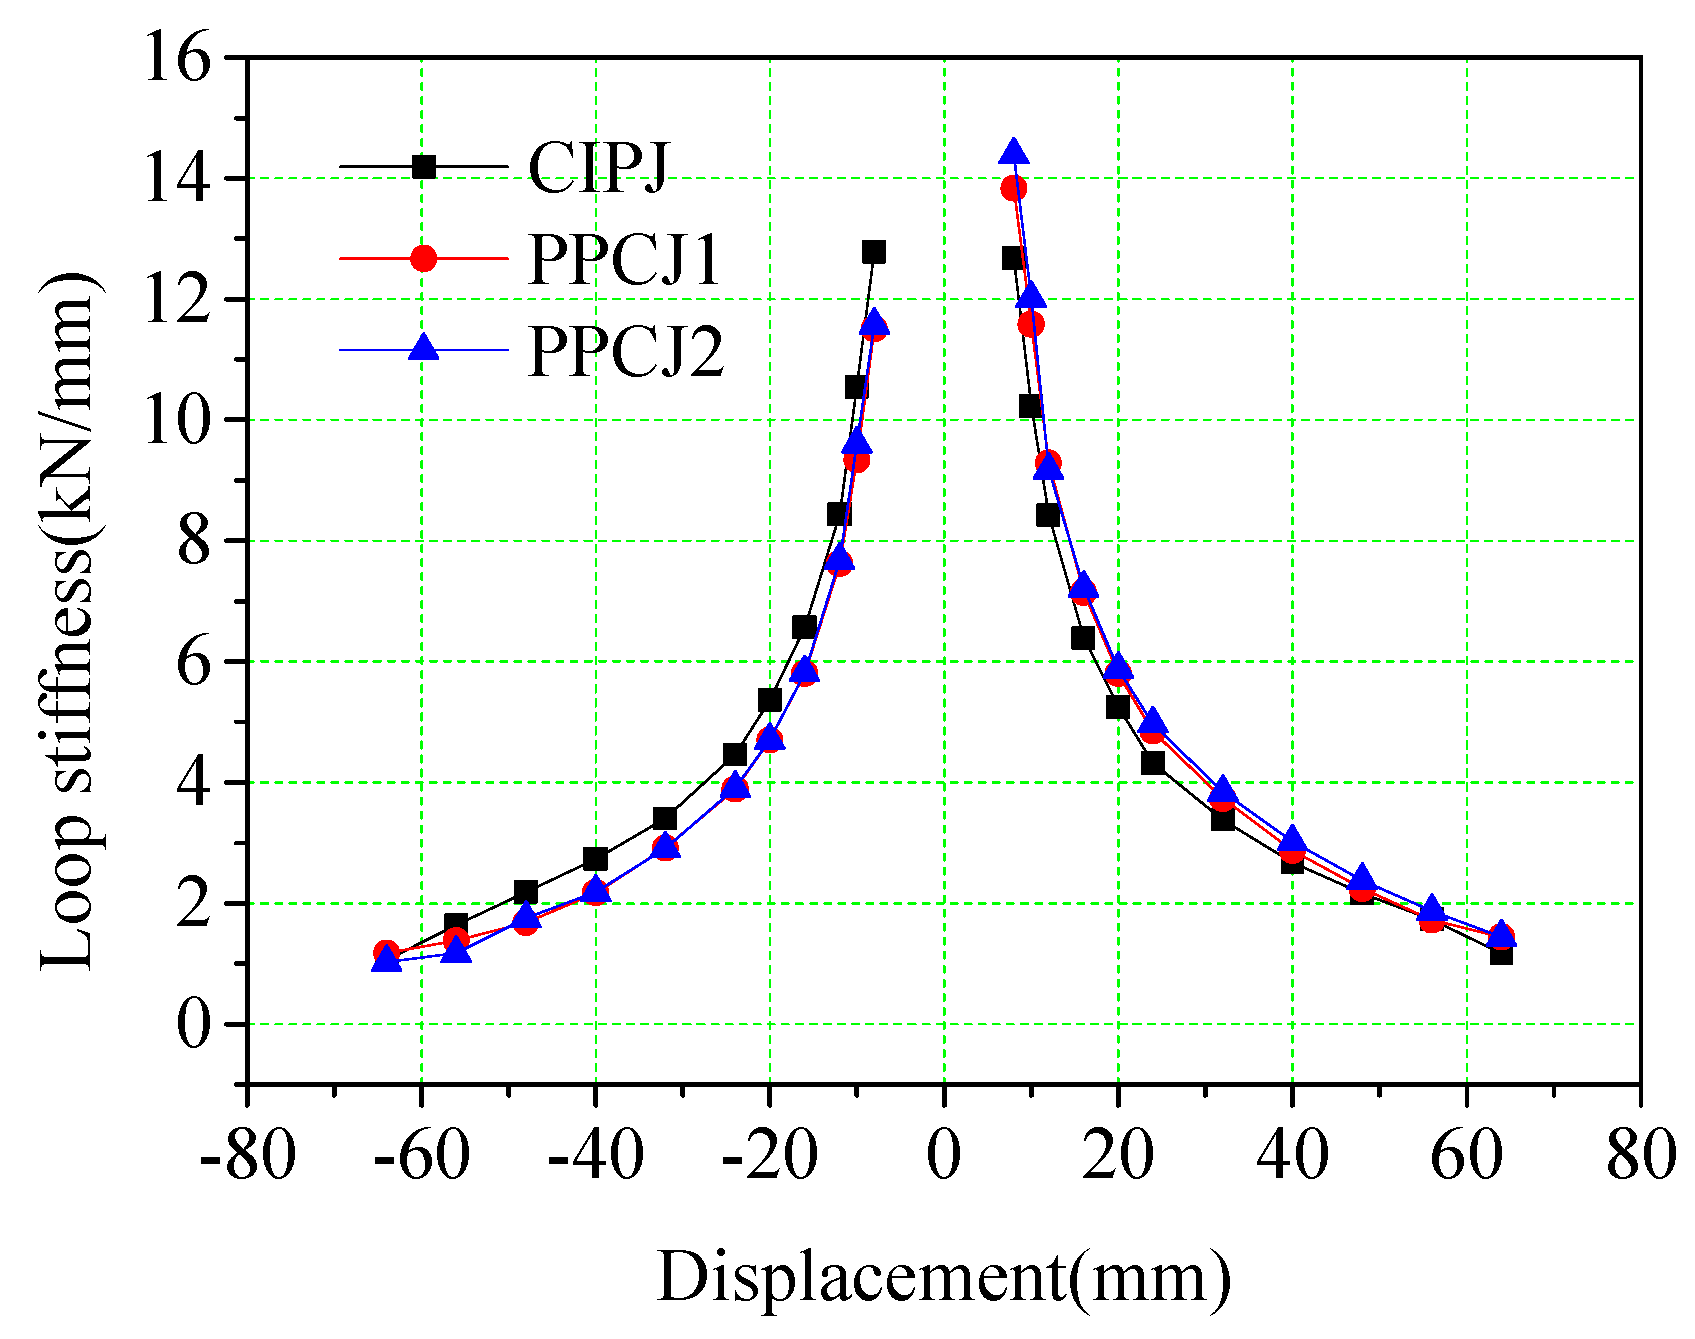
The relationship between the loop stiffness and the loading displacement of the left and right beams of each joint is shown in
Figure 18 and
Figure 19. The stiffness degradation of the three joints is seen to be similar from these figures. The rate of stiffness degradation was faster in the early stage of loading, and the stiffness degradation mainly occurred in the cracking and yielding stages. Stiffness was reduced as the cracks in the concrete expanded, and the yielding of the steel bar occurred. After the peak load, the pressed concrete on the beam was crushed, and a “plastic hinge” at the end of the beam developed, causing a low rate of stiffness degradation with further displacement. The variation of the loop stiffness during the forward and reverse loading of the left and right beams of the cast-in-place joint was almost symmetrical. However, the loop stiffness of precast prestressed concrete joints PPCJ1 and PPCJ2 in forward loading was greater than that in reverse loading. The loop stiffness values in the forward and reverse loading approach as the loading displacement reached the peak load displacement of 32 mm.
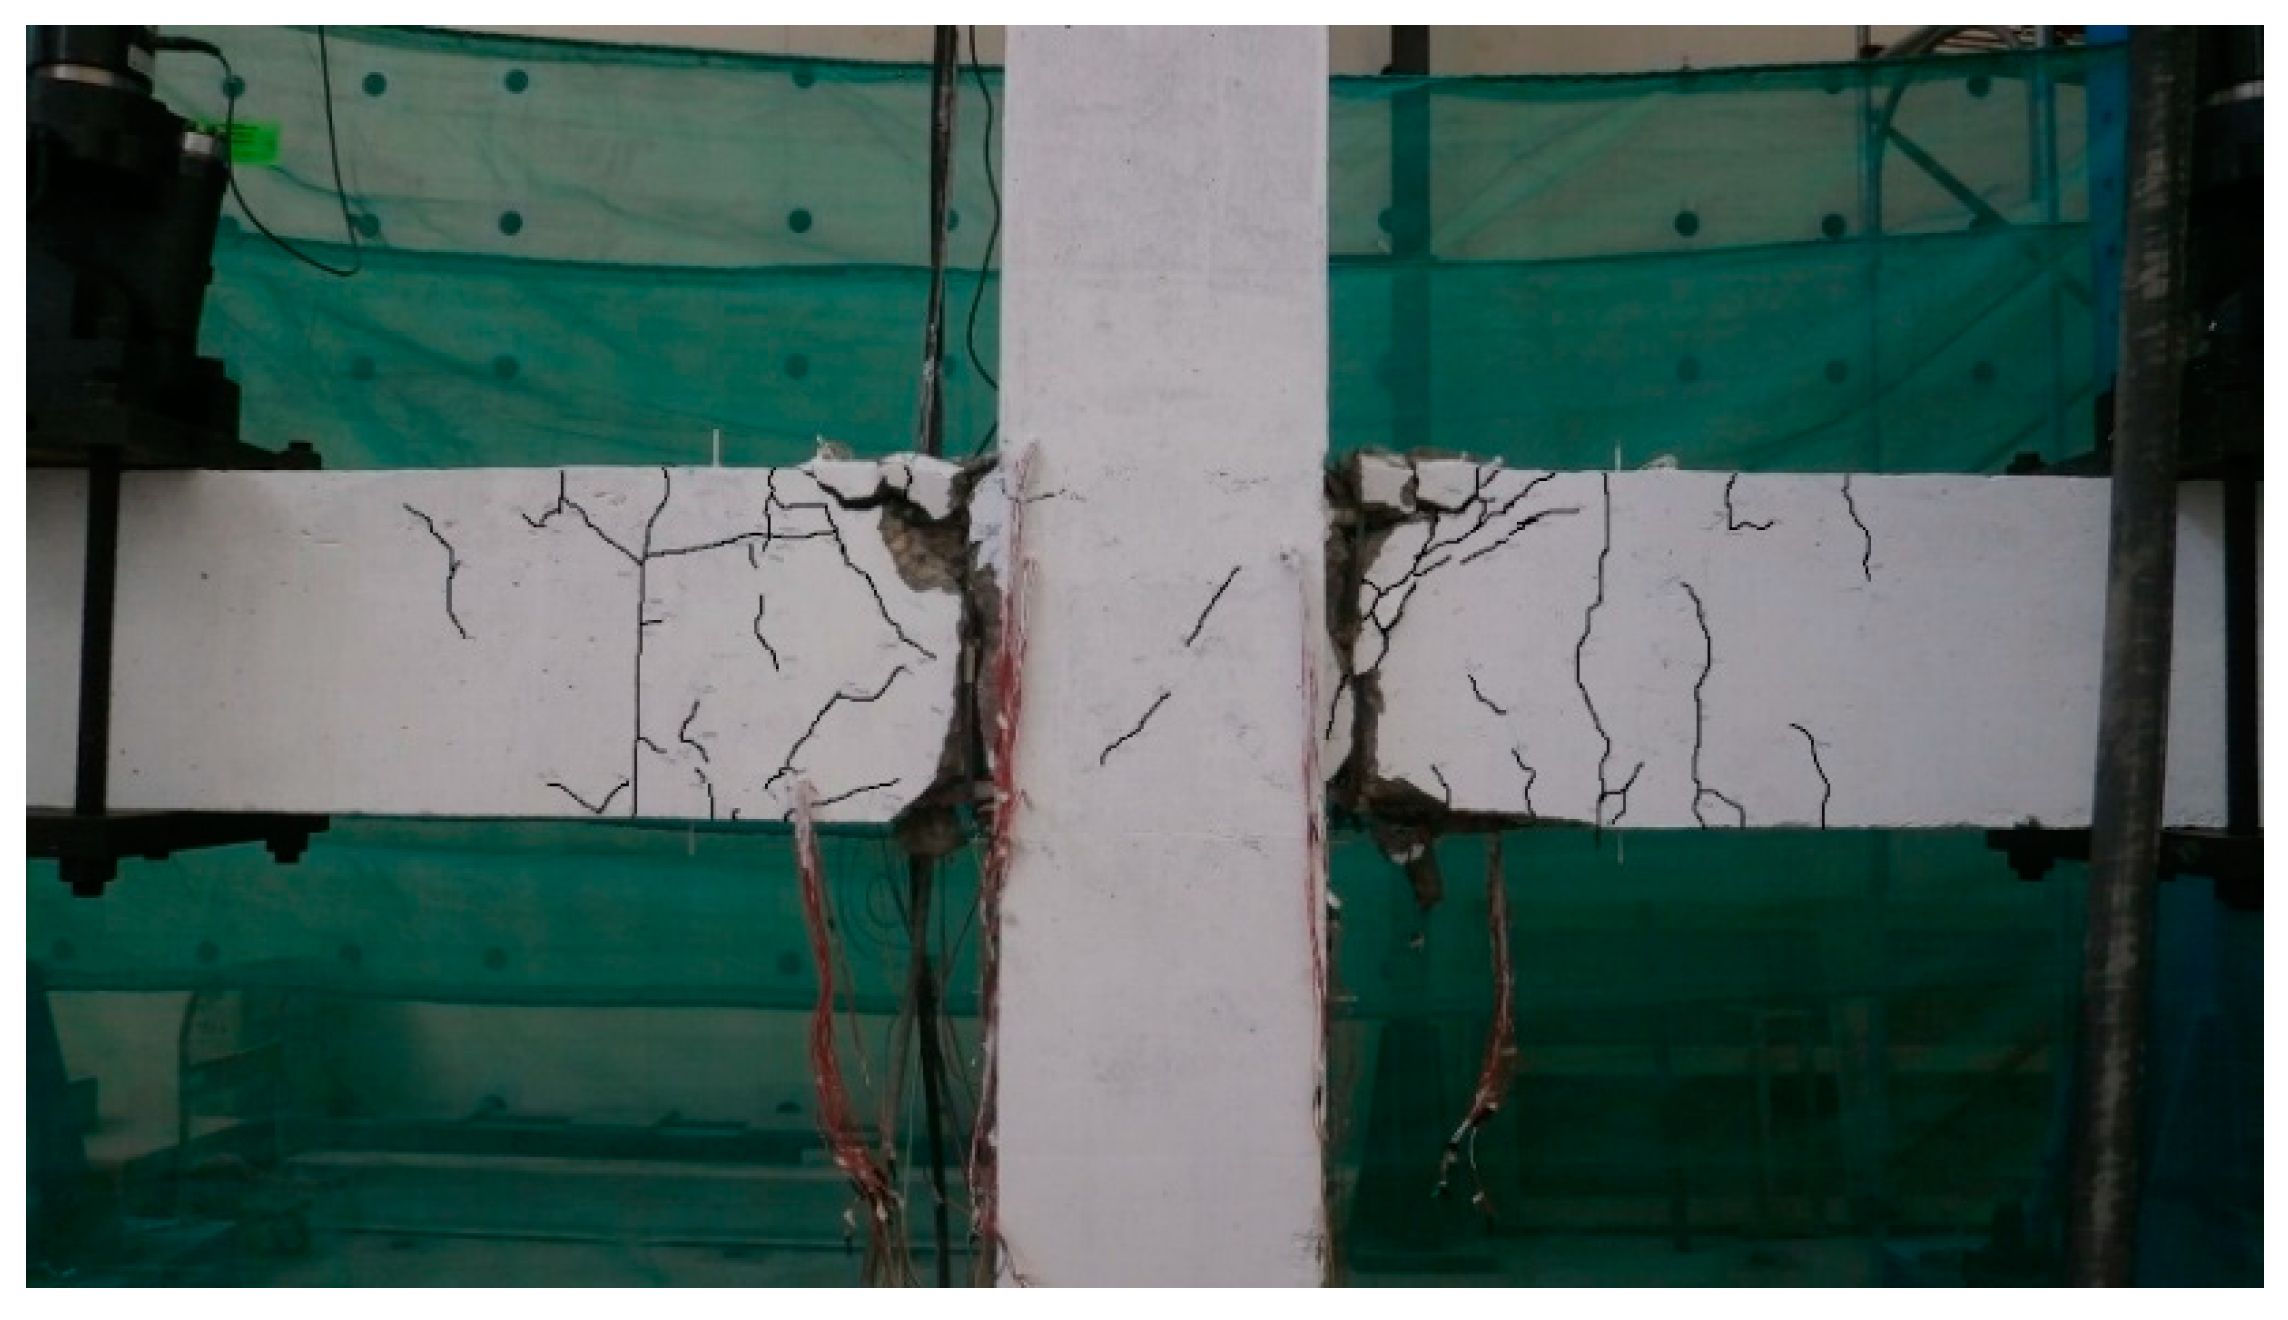
The loop stiffnesses of the precast prestressed concrete joints PPCJ1 and PPCJ2 were greater than that of the cast-in-place joint during forward loading. The loop stiffness during reverse loading of PPCJ1 and PPCJ2 was smaller than the cast-in-place joint. After peak loads, the loop stiffnesses became similar for PPCJ and CIPJ. These values approached because the reinforcement overlapping at the bottom of the keyway area increased the effective reinforcement ratio of the longitudinal reinforcement at the bottom of the beam, while the beam top reinforcement was the same as the cast-in-place joint. Increasing the loading displacement beyond yielding caused further cracking of the beam and concrete damage, and the force transmission of the overlapped reinforcements was weakened. At peak load, the concrete in the plastic hinge area of the precast prestressed concrete joint was severely damaged, and the U-shaped steel bars and prestressing tendons in the overlap area were exposed. The overlapped reinforcements could only anchor in the undamaged area of the concrete at the end of the beam. Consequently, only the U-shaped steel bars were effectively transmitting force. Thus, the force transmission at the beam ends for PPJC1 and PPJC2 at near peak load were consistent with the cast-in-place joint.
The joints PPCJ1 and PPCJ2 had similar loop stiffness during forward loading except when just yielding. For reverse loading, the loop stiffness of PPCJ2 was slightly larger than that of PPCJ1. This difference was because the joints only had concrete of different strengths in the keyway area of the beam. The concrete of the beam top was the same for PPCJ1 and PPCJ2. During forward loading, the concrete of the beam bottom was pulled in tension and the cracks appeared earlier. In this case, the main contribution to the stiffness was the bottom reinforcement and top concrete of the beam. Thus, the stiffness was similar in forward loading for PPCJ1 and PPCJ2. For reverse loading, the bottom of the keyway area was pressed compressively, and the concrete at the bottom of the beam played a significant role in determining stiffness. Therefore, the loop stiffness was greater for PPCJ2 since it used a higher strength concrete. However, the contribution to loop stiffness of the joint was limited.
5.2. Bearing Capacity Degradation
The bearing capacity degradation is the phenomenon that the peak load decreases with the increase in the number of loading cycles under the same loading displacement amplitude. The bearing capacity degradation coefficient is calculated according to
where
is the bearing capacity degradation coefficient;
is the peak load in the
nth loading cycle when the displacement amplitude is
;
is the peak load in the first loading cycle when the displacement amplitude is
.
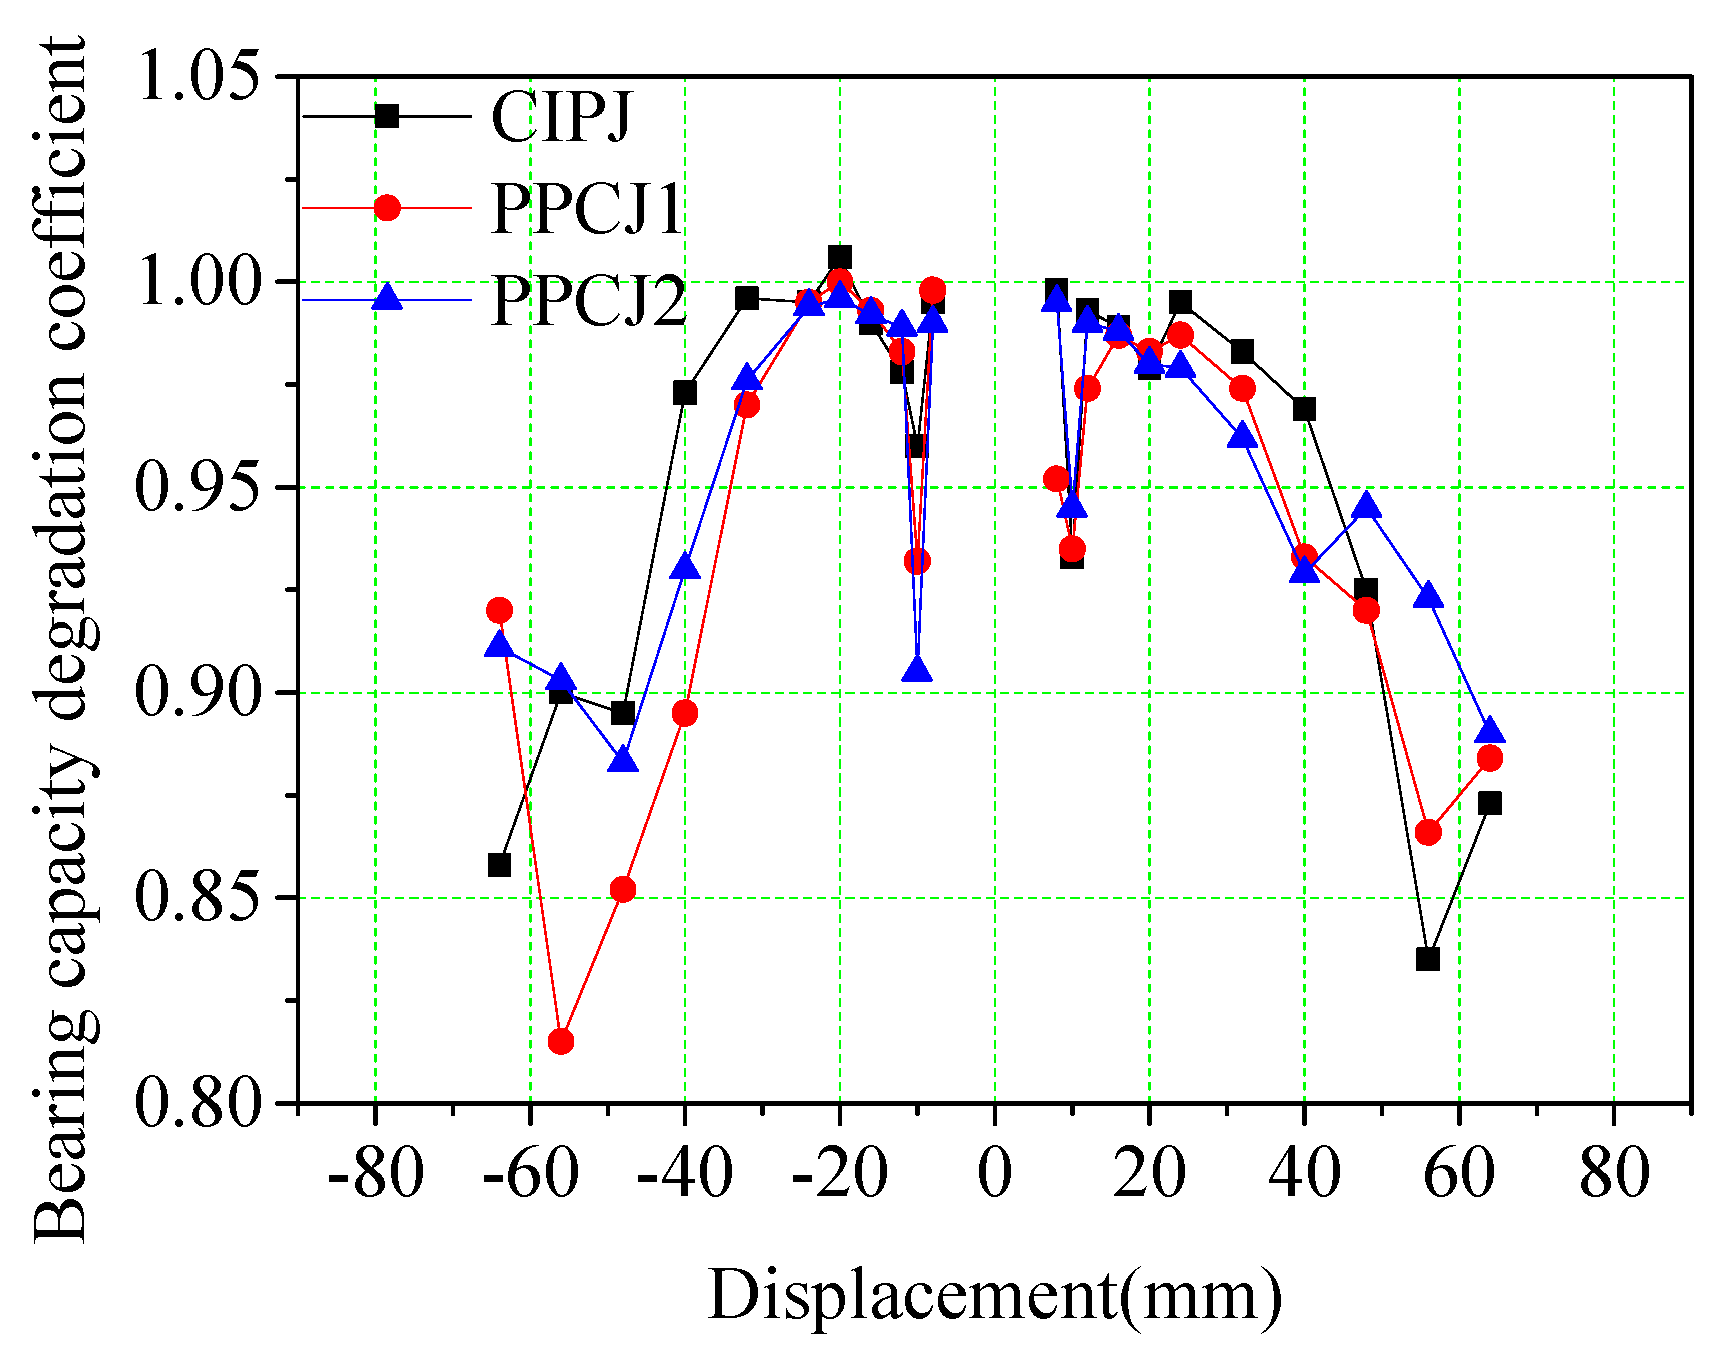
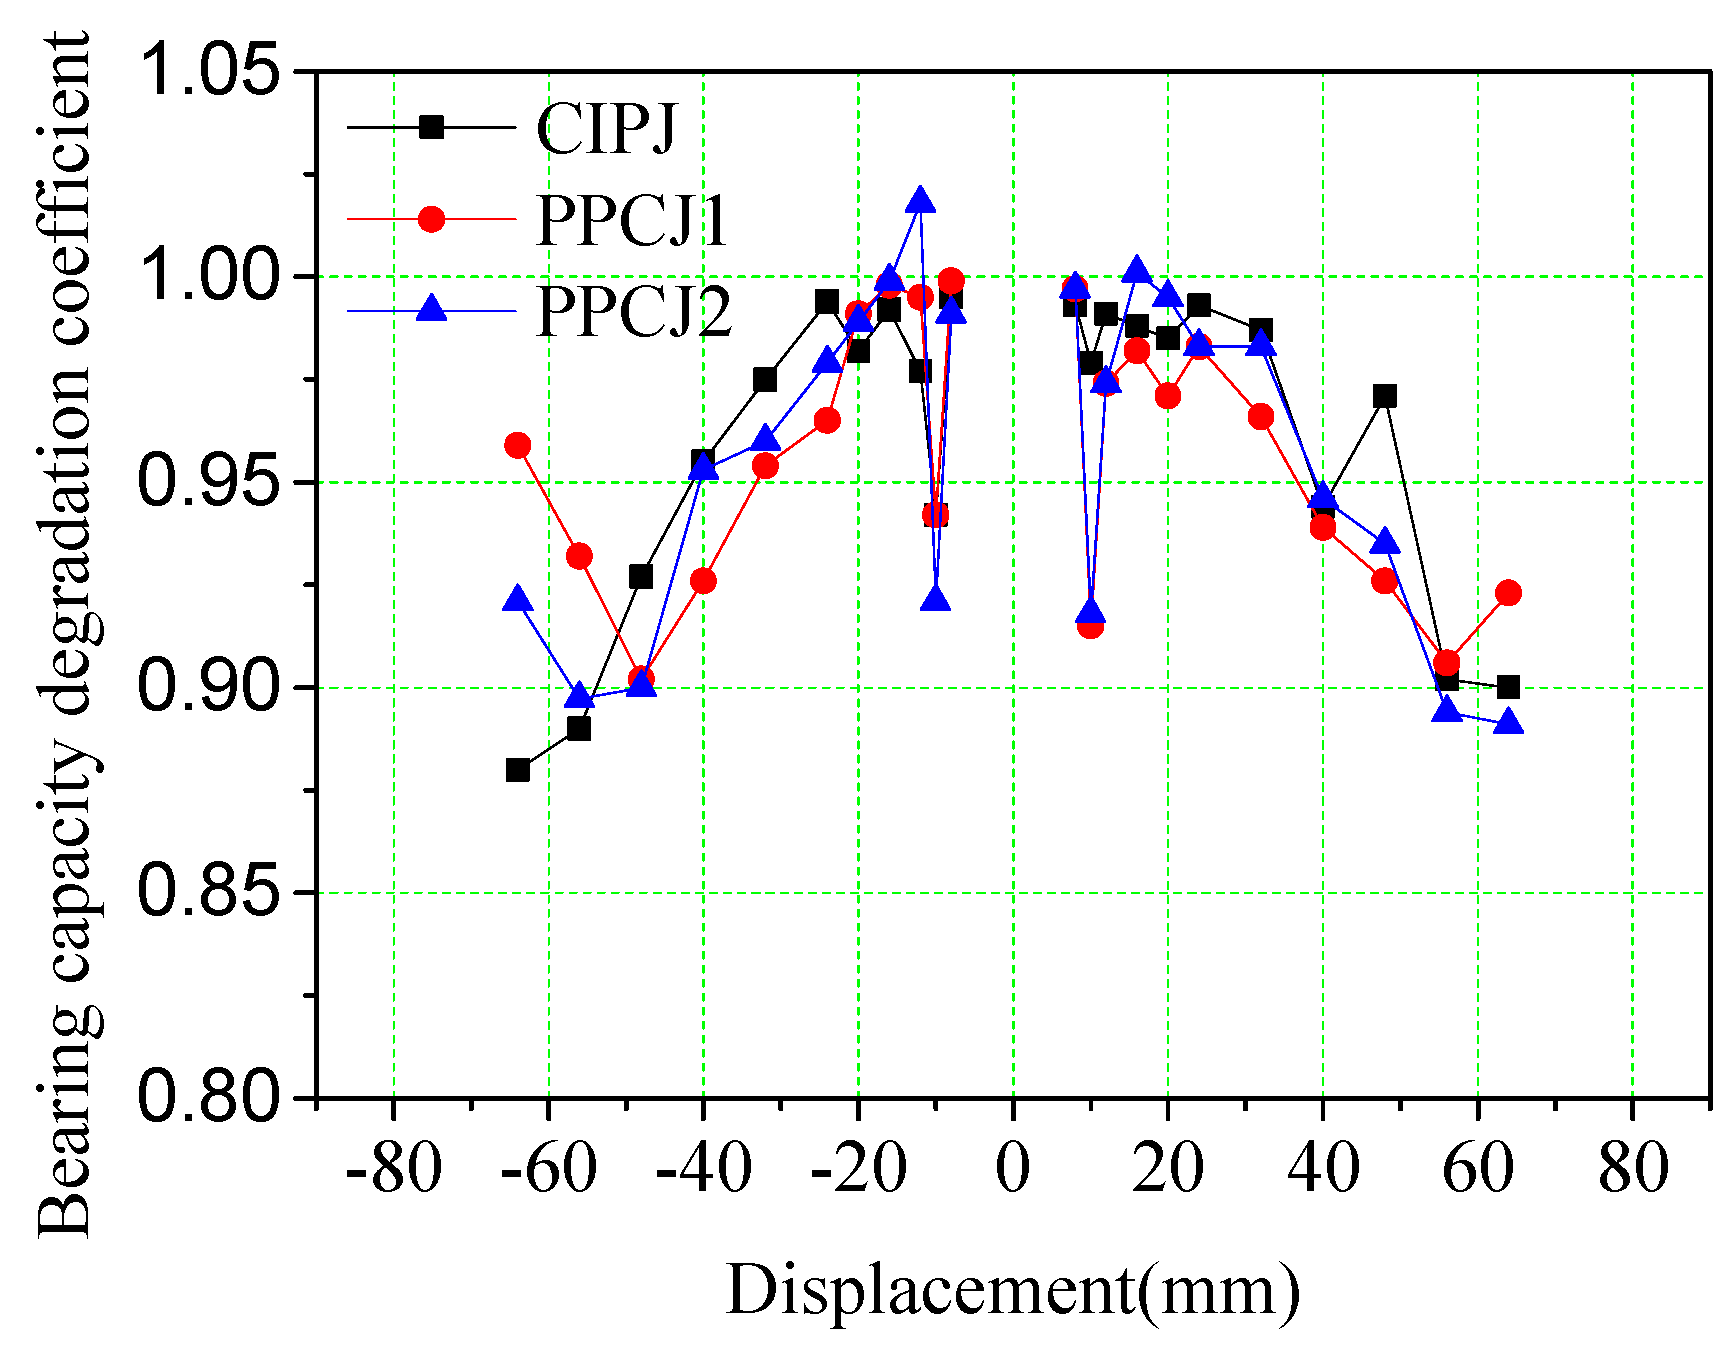
The relationship between the bearing capacity degradation coefficient and the displacement for each joint is shown in
Figure 20 and
Figure 21. These figures show that a yielding platform occurred when the joint first started yielding, and the bearing capacity degradation coefficient first dropped, and then rose. The steel bar in the beam entered the strengthening stage when the joint was fully yielded, and the joint plasticity developed normally as the stress increased gradually. In this phase, the bearing capacity degradation coefficient decreased. At the later stage of loading, the damaged concrete at the end of the beam fell off, new concrete became in contact with the column, the plasticity began developing again, and the bearing capacity degradation coefficient increased.
The bearing capacity degradation coefficient of the cast-in-place joint was slightly larger than that of the precast prestressed concrete joints. This difference was because the bearing capacity degradation coefficient was related to the development of plasticity. The plasticity of the cast-in-place joint developed symmetrically, while the plasticity of the precast prestressed concrete joint developed asymmetrically and it entered the plastic stage quickly upon loading; thus, the bearing capacity of the precast prestressed concrete joint degenerated slightly faster than the cast-in-place joint. The bearing capacity degradation coefficient of PPCJ2 was generally slightly larger than that of PPCJ1. This larger value indicates that the increase of concrete strength in the keyway area slightly reduced the bearing capacity degradation of the precast prestressed concrete joint.
6. Ductility and Energy Dissipation
Ductility refers to the ability of a structure to withstand inelastic deformation without significant reduction in its bearing capacity after the structure enters plasticity. Ductility is related to the energy dissipation capacity of the structure. The ductility of a joint can be expressed by the displacement ductility coefficient of the beam at the loading end. This coefficient is calculated as follows:
where
is the ductility coefficient of the joint; Δ
u is the ultimate displacement of the joint when it is broken, generally taken as the corresponding displacement when the bearing capacity of the joint drops to 85% of the peak load; Δ
y is the yield displacement of the joint.
The ductility coefficients of the three joints are shown in the two rightmost columns of
Table 3. The ductility coefficients of the three joints were similar, and it can be considered that the three joints had considerable ductility. The different strength of concrete in the keyway area had little influence on the ductility as seen by comparing the precast prestressed concrete joints. The ductility coefficient for each joint was between 5.3 and 6.3, and these values are greater than the ductility coefficient of 3–4 as required for seismic structure design. Thus, the joints tested have good ductility and meet the structural seismic requirements.
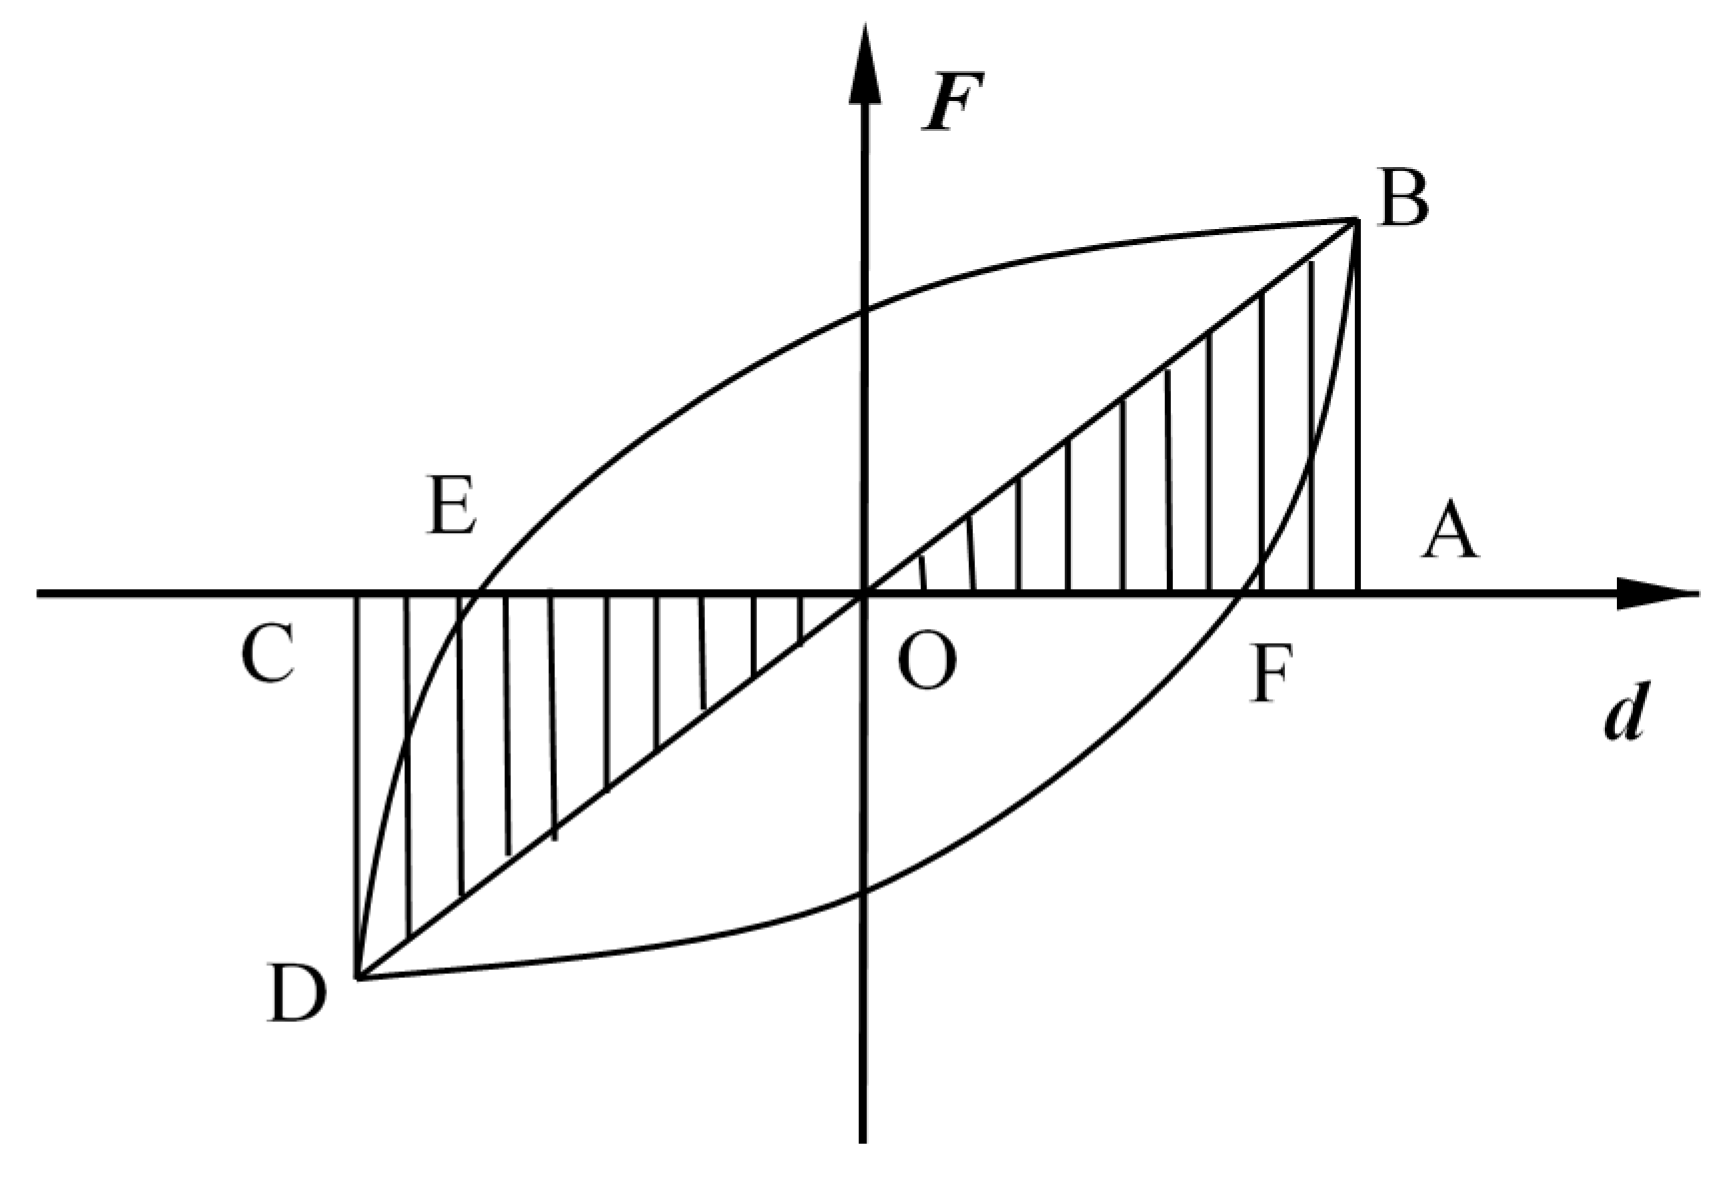
Energy dissipation is an important indicator of the seismic performance of a structure. The equivalent viscosity damping coefficient is used to describe the energy dissipation capacity of a test joint under different loading displacements. A larger equivalent viscosity damping coefficient correlates with greater energy dissipation. The calculated values of the equivalent viscous damping coefficients of the three joints are listed in
Table 4 and are calculated according to
where
he is the equivalent viscous damping coefficient;
A1 is the area of the hysteresis loop BFDE in
Figure 22;
A2 is the area of the triangle OAB in
Figure 22;
A3 is the area of the triangle OCD in
Figure 22. There average is taken when there are multiple cycles of the same level of loading displacement.
At the start of yielding, the equivalent viscous damping coefficient of each joint increased with the loading displacement. As yielding began, the plasticity of the beam developed rapidly, and the energy dissipation increased. The equivalent viscous damping coefficient had only slight fluctuations in the displacement from 20 mm to the peak displacement. The local damage of concrete lowered the energy dissipation beyond 20 mm of displacement. However, the plasticity of the joint had room for development. The plasticity development and concrete damage were in a dynamic equilibrium that caused this stable portion of the coefficient. The coefficient tended to decrease slowly after the peak load was reached. After the peak load, part of the concrete was destroyed, and the energy dissipation of the joint was reduced.
The average value of the equivalent viscous damping coefficient for the cast-in-place joint at peak load was 0.2413. The average viscous damping coefficients at peak load of the precast prestressed concrete joints PPCJ1 and PPCJ2 were 0.2340 and 0.2470, respectively. The equivalent viscous damping coefficient was close for all joints. This similarity indicates that the energy dissipation capacity of the precast prestressed concrete joint was similar to that of the cast-in-place joint. Thus, the precast prestressed concrete joint had the same energy dissipation as the equivalent monolithic system.
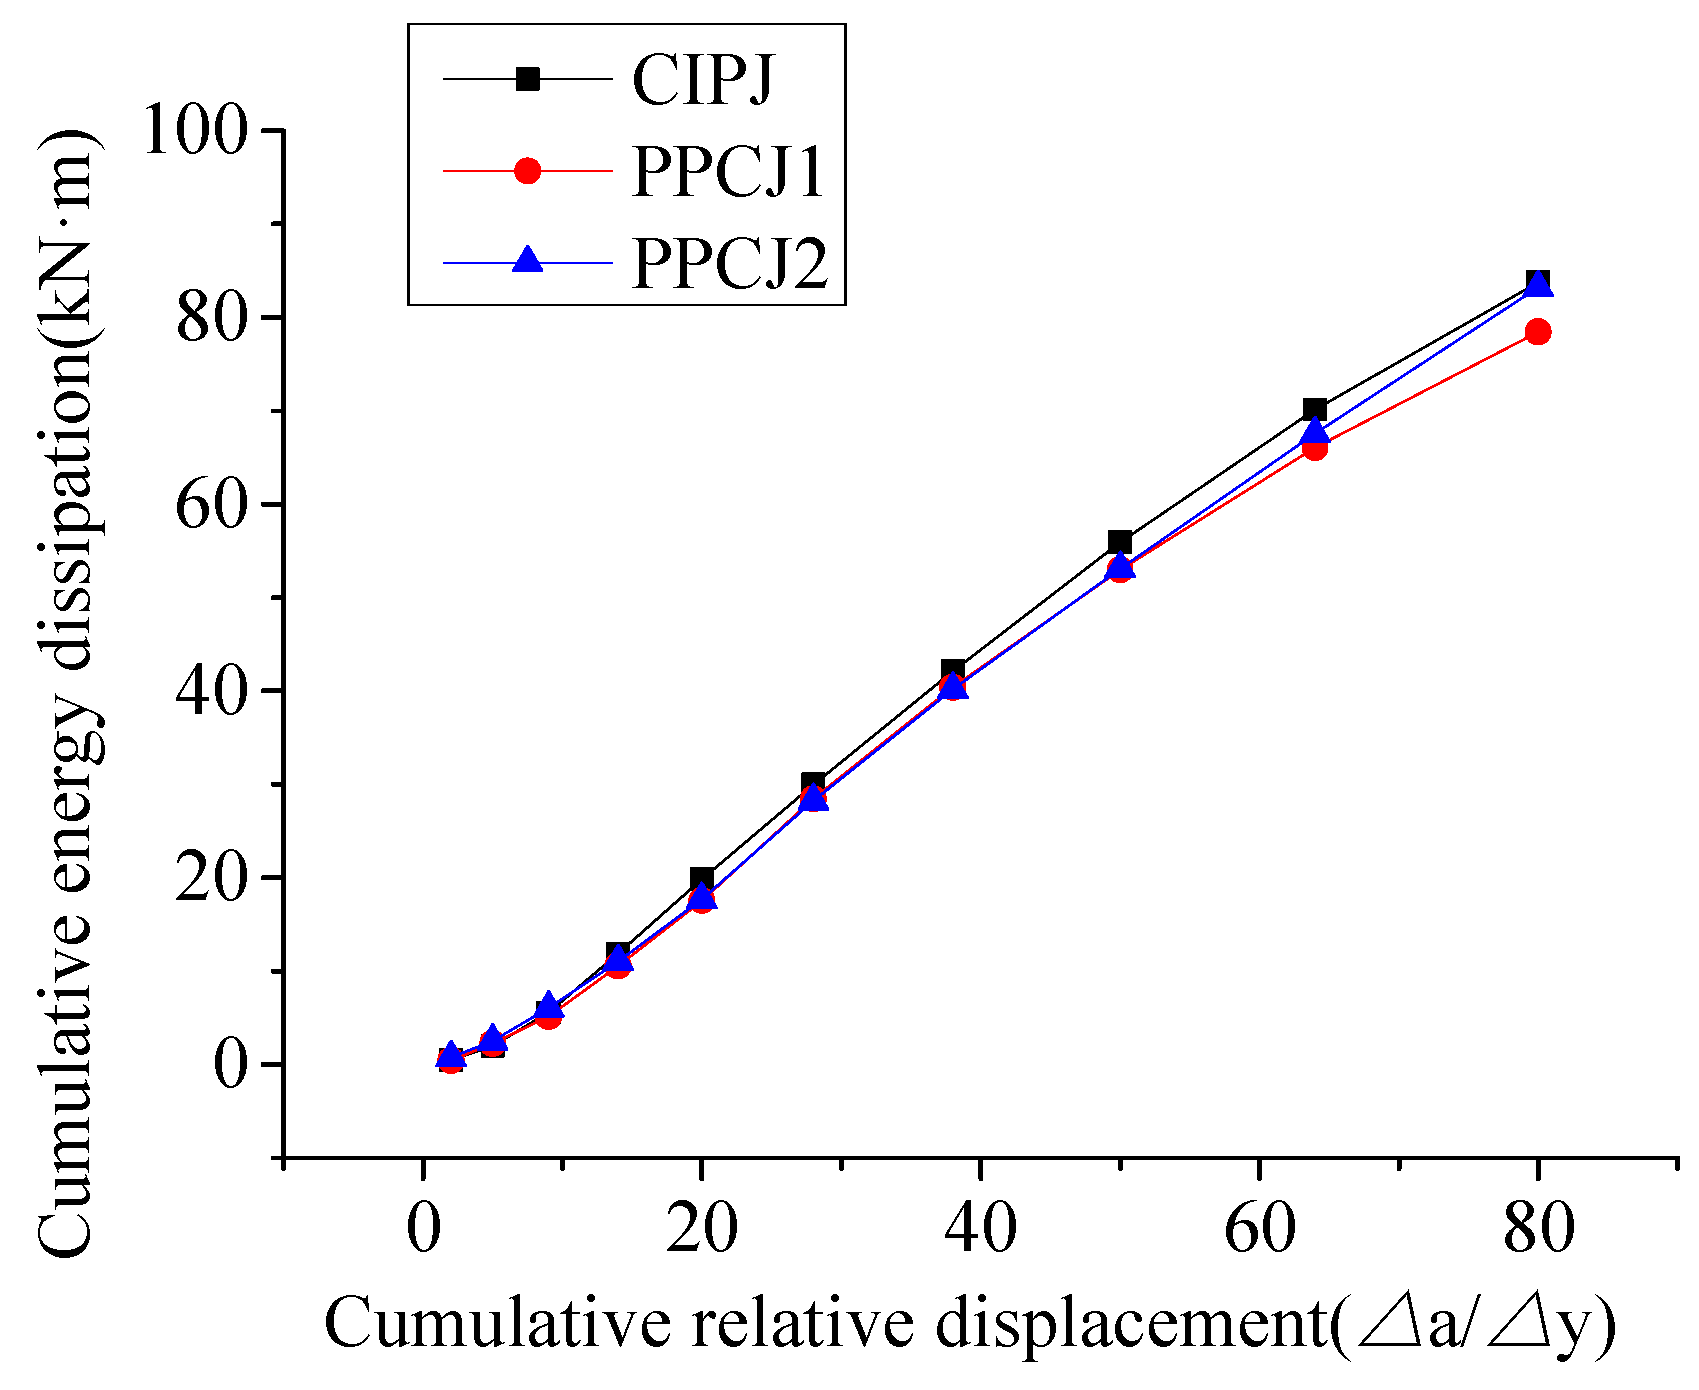
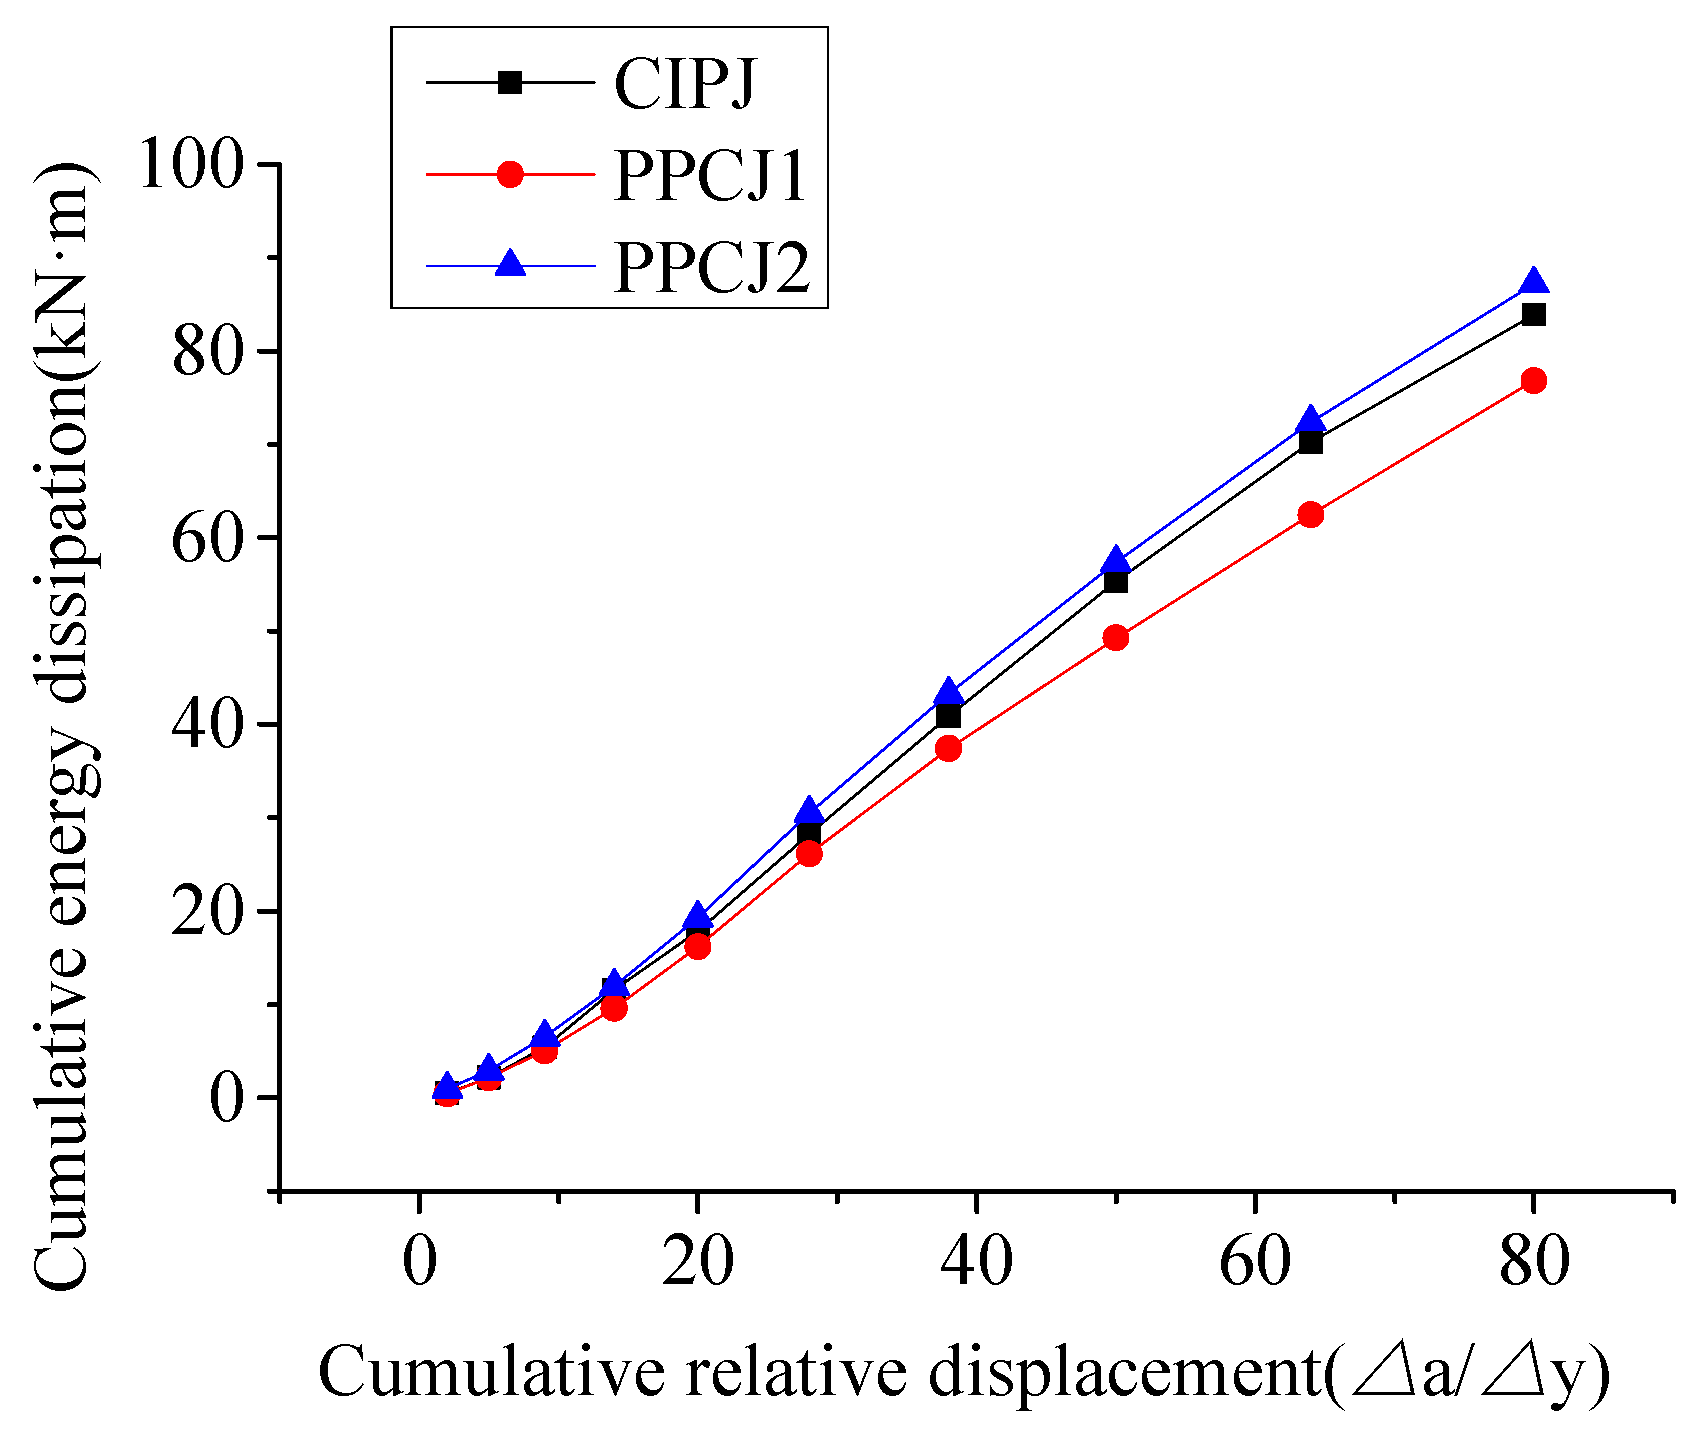
The actual energy dissipation capacity of the joints was compared using the cumulative energy dissipation index. The actual energy dissipation is the accumulated value of the envelope area
A1 of the hysteresis loop corresponding for each loading displacement. The accumulated value Δ
a of the corresponding displacement is determined and is normalized by the yield displacement Δ
y. Relationships between cumulative energy dissipation and cumulative relative displacement of each joint for the left and right beams are shown in
Figure 23 and
Figure 24.
Figure 23 and
Figure 24 show that the difference of cumulative energy dissipation between the left beam of the cast-in-place joint and the precast prestressed concrete joint was small and that the cumulative energy dissipation of the right beam of the PPCJ1 joint was slightly smaller than the other two joints. The cumulative energy dissipation of the PPCJ2 joint was slightly larger than that of the PPCJ1 joint. The energy dissipation of the right beam of the PPCJ2 joint was significantly larger than that of the PPCJ1 joint and was even larger than the cast-in-place joint. This difference may be due to the inconsistency in the construction. However, the cumulative energy dissipation of each joint was approximately linear. Thus, the energy dissipation capacity of each joint was uniform with the displacement, and the joint energy dissipation was stable.
7. Conclusions
In this paper, reversed cyclic loading tests were carried out on precast prestressed concrete joints and a cast-in-place joint. The conclusions are as follows:
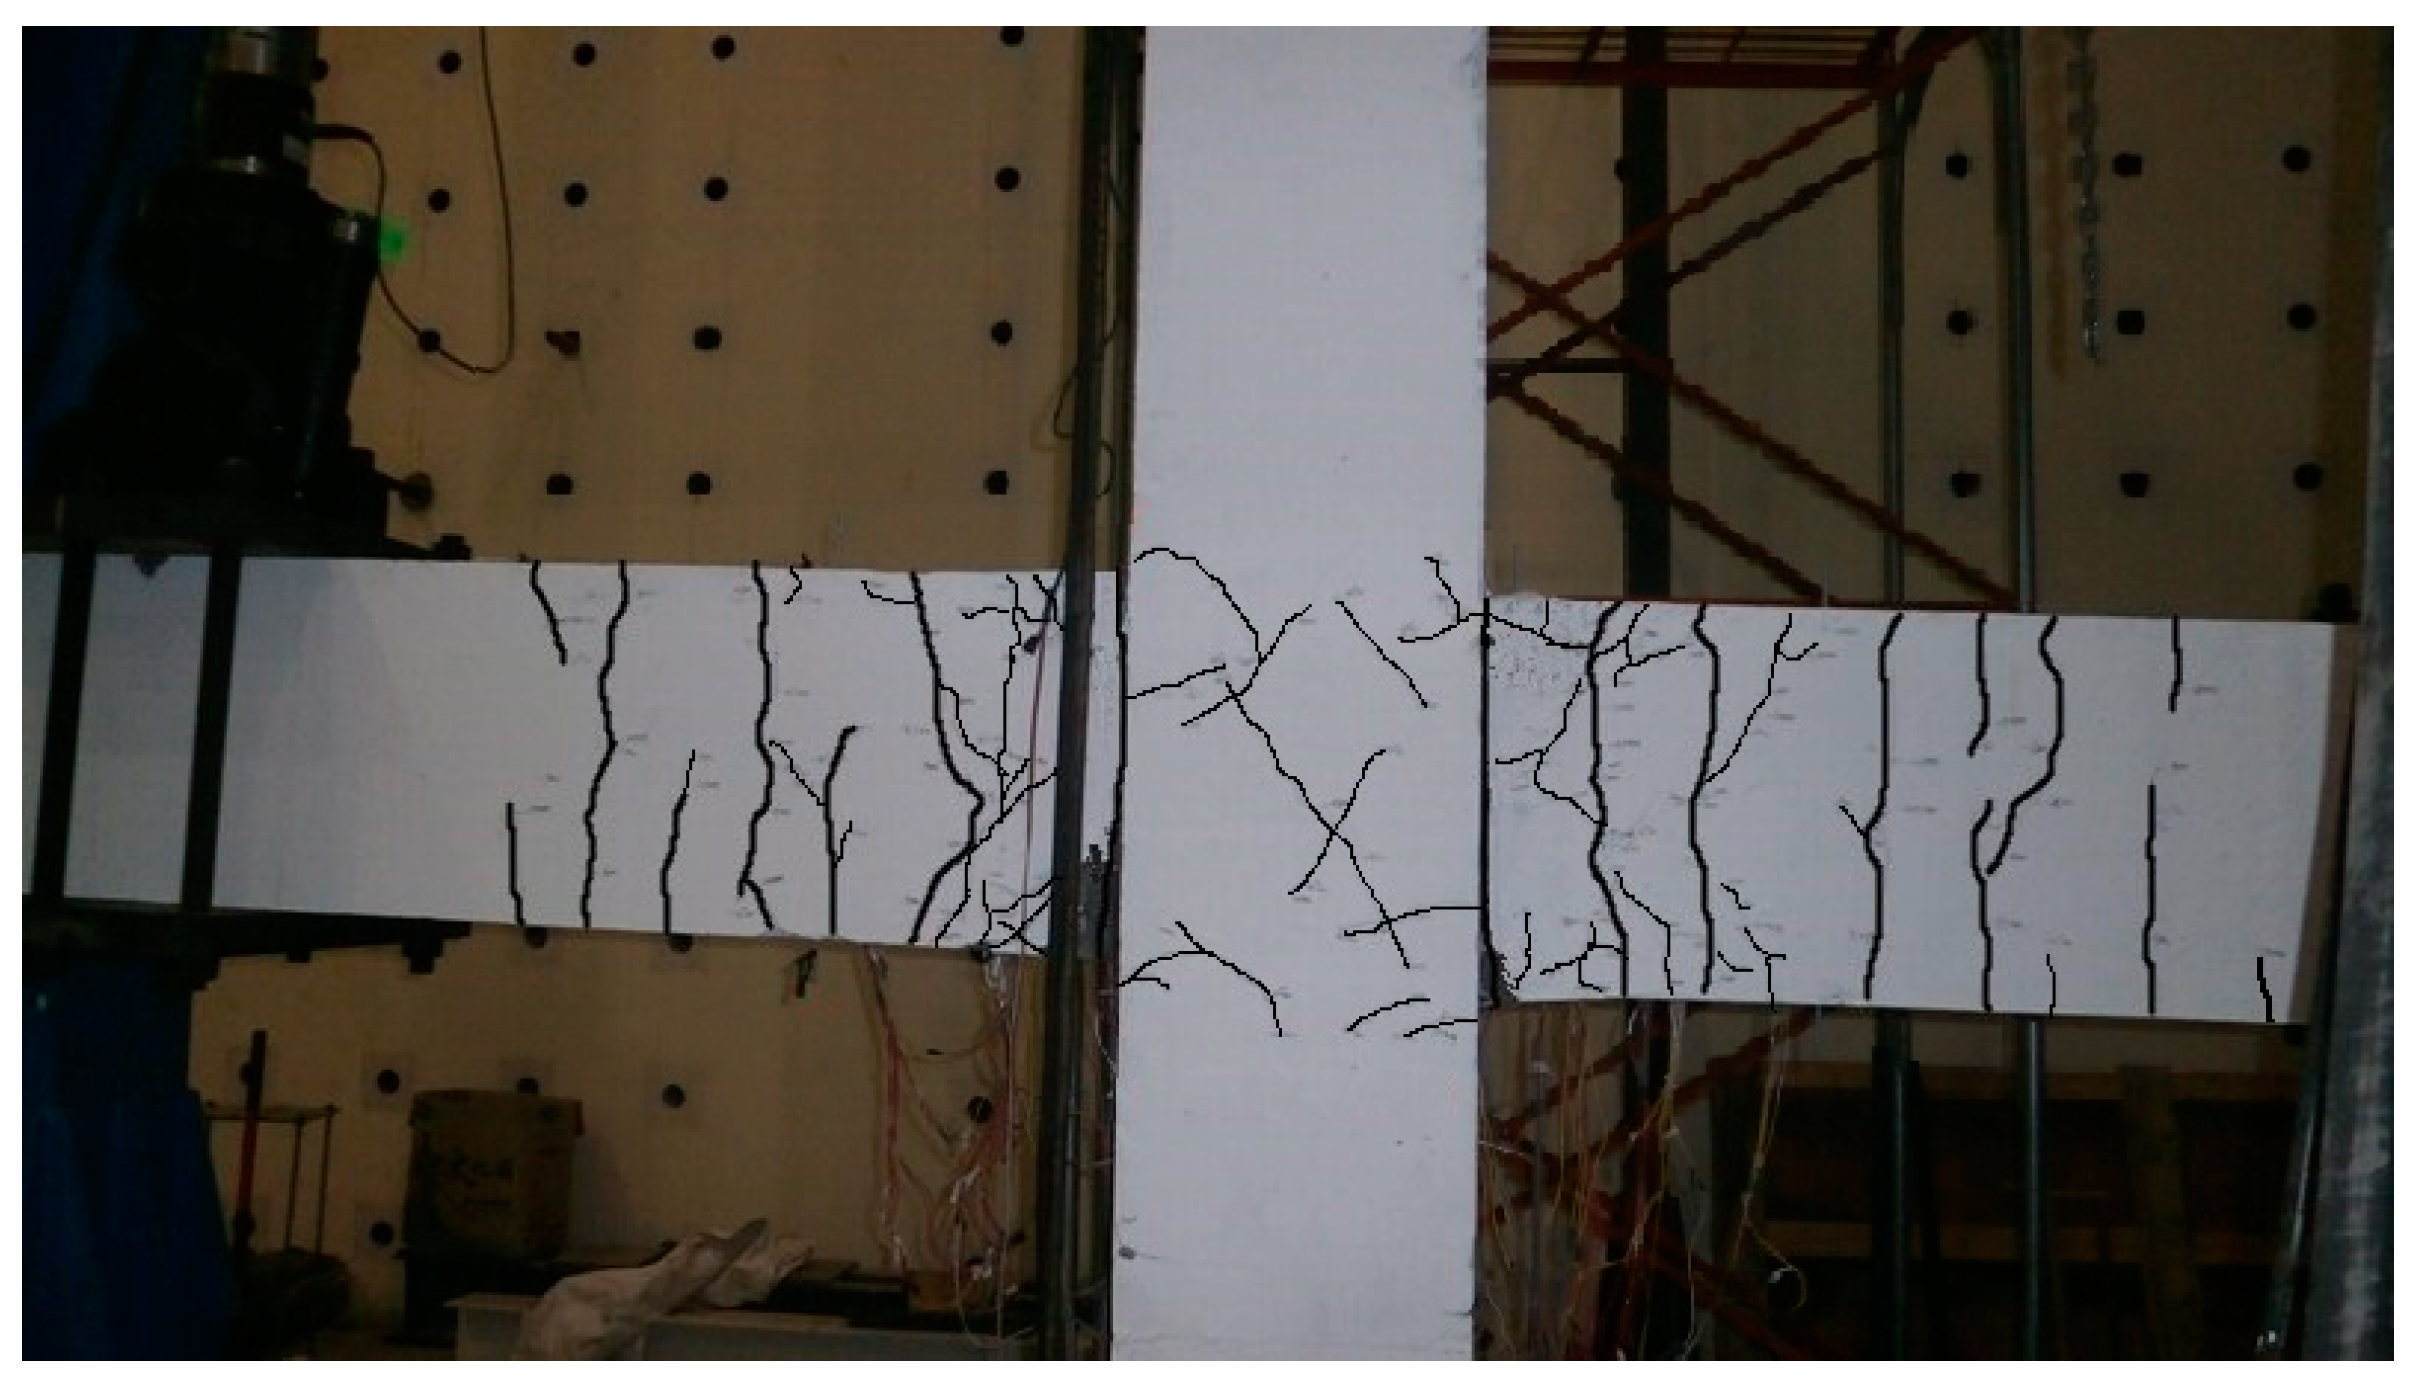
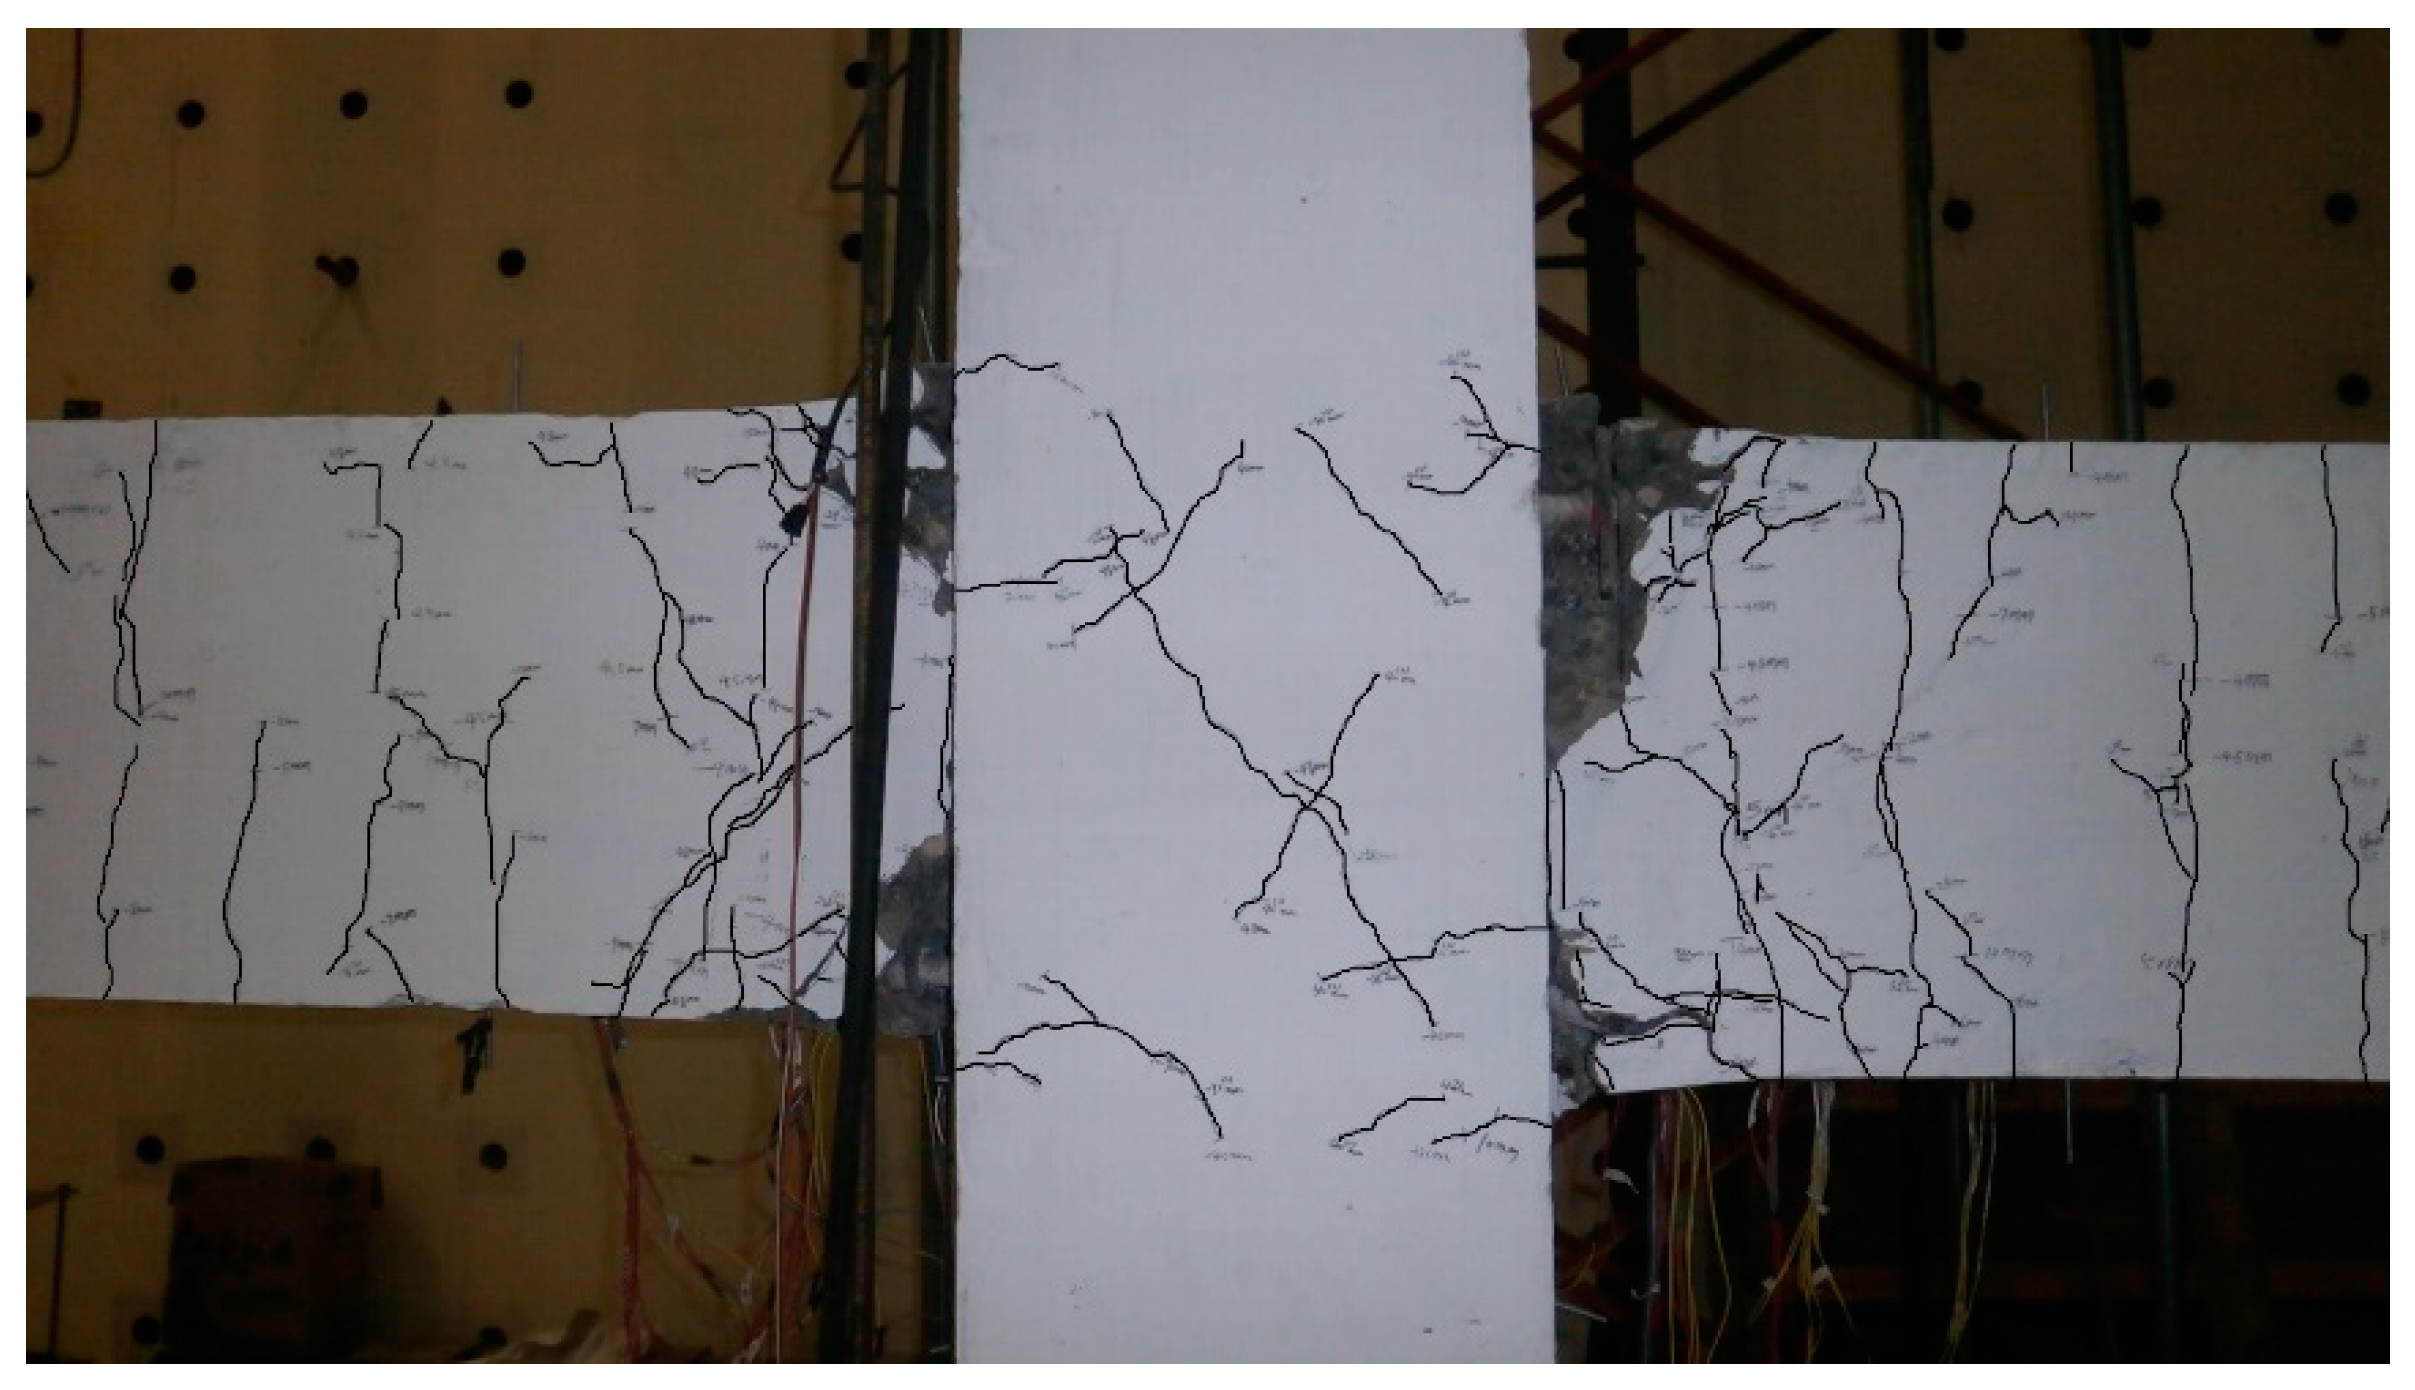
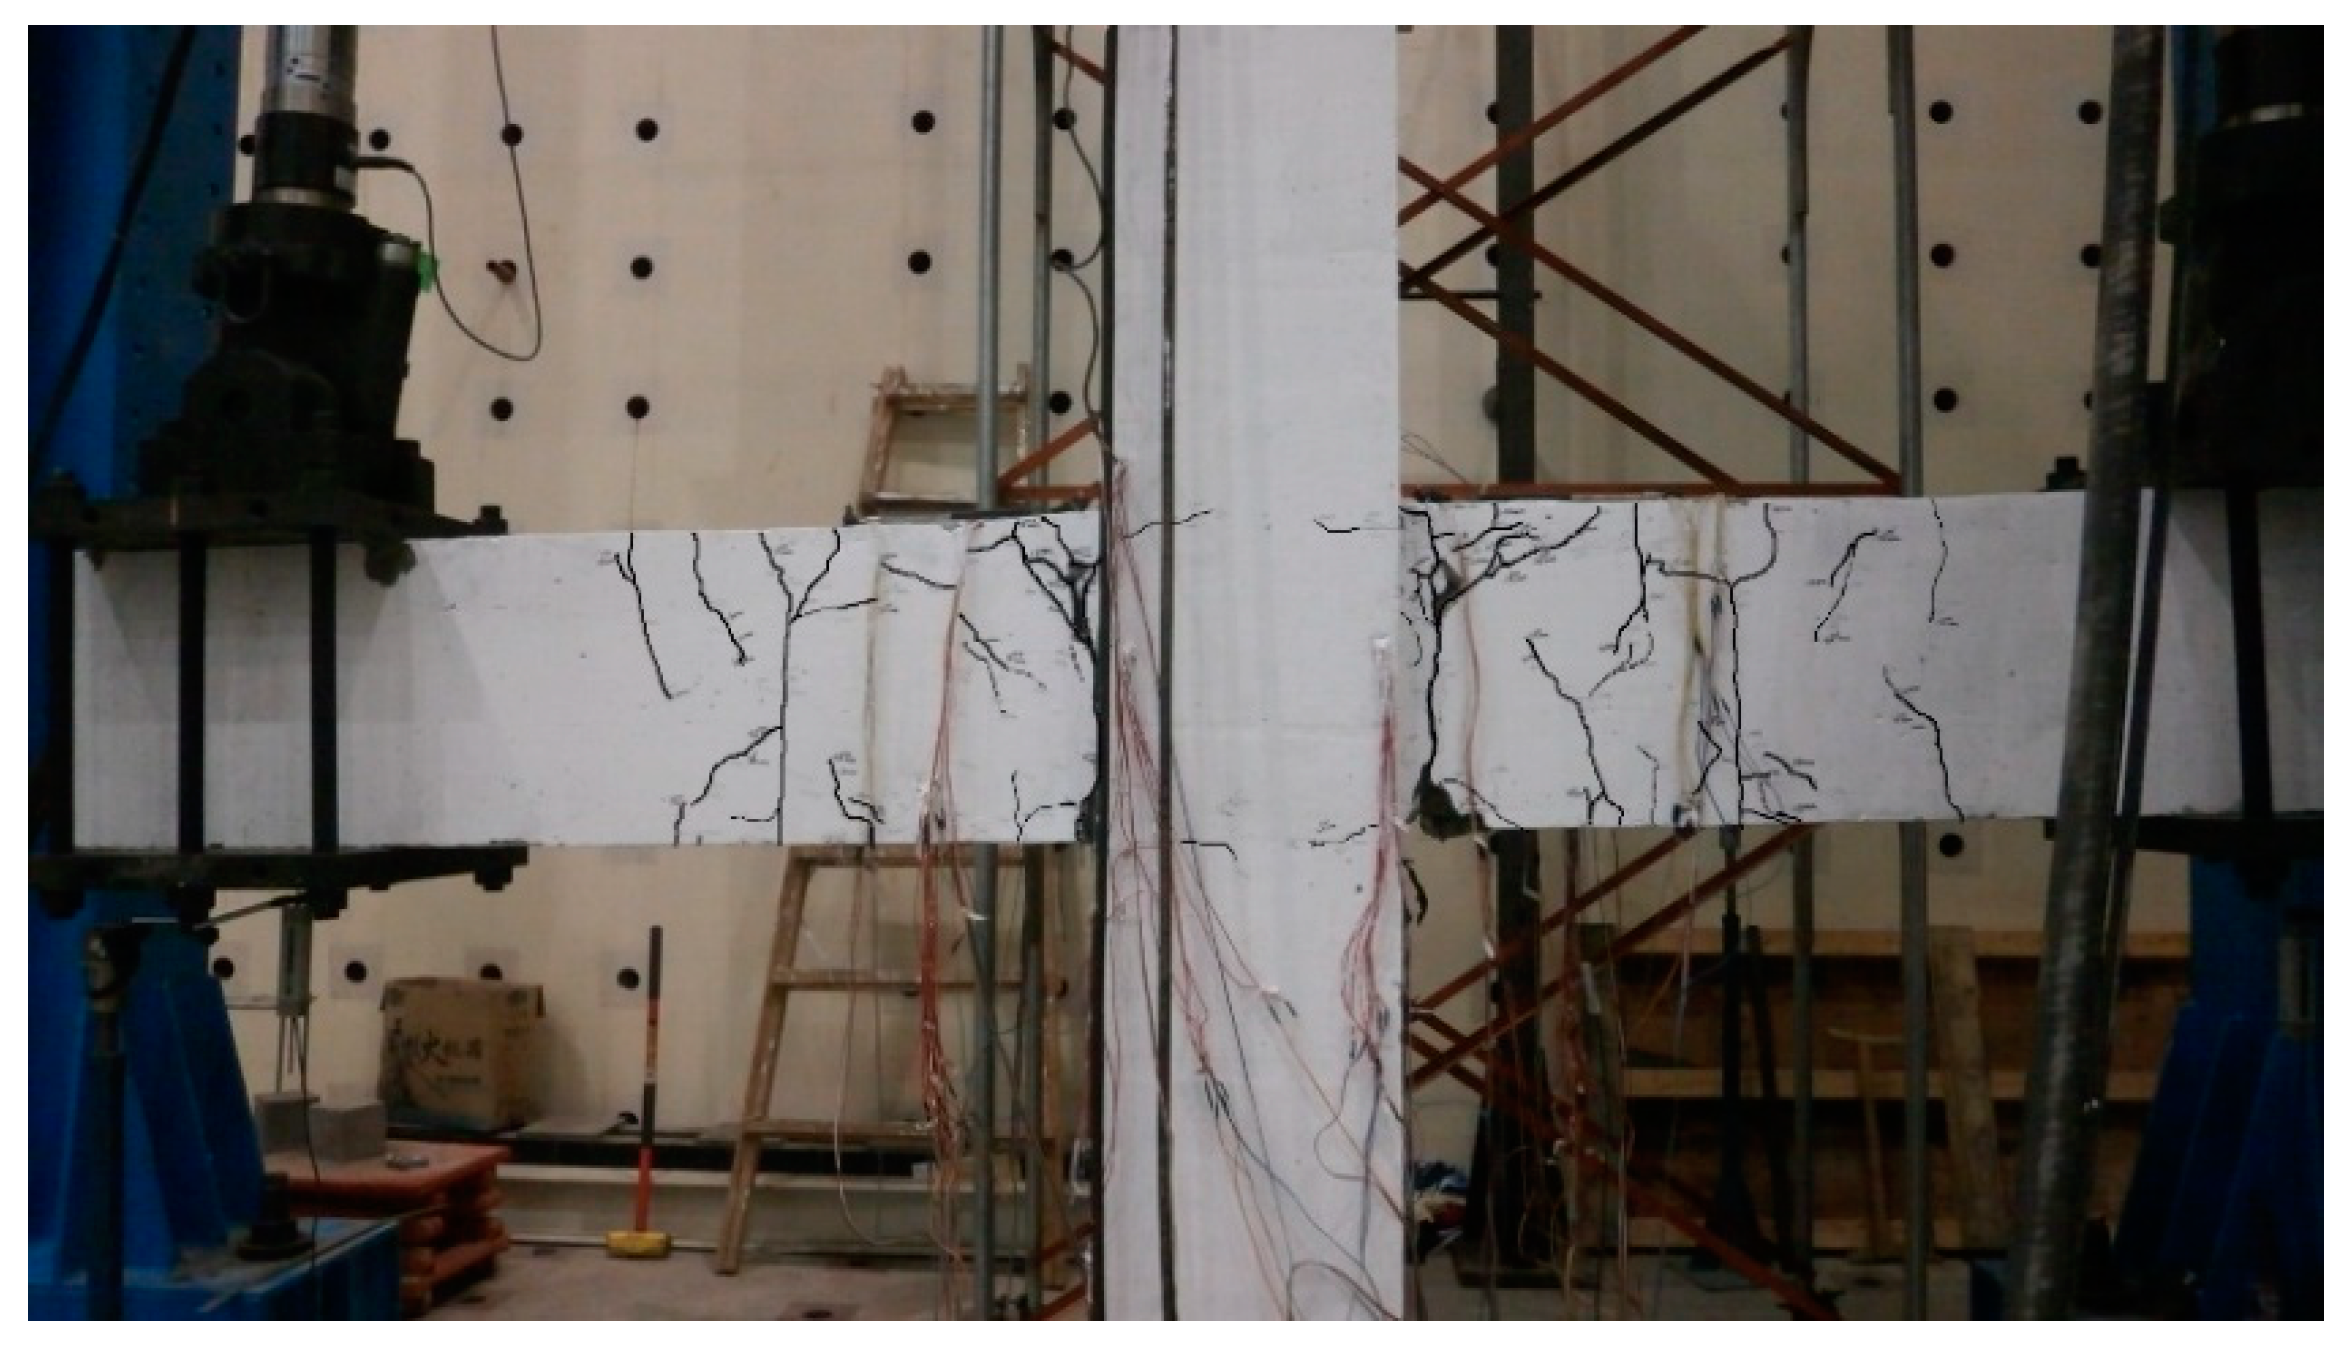
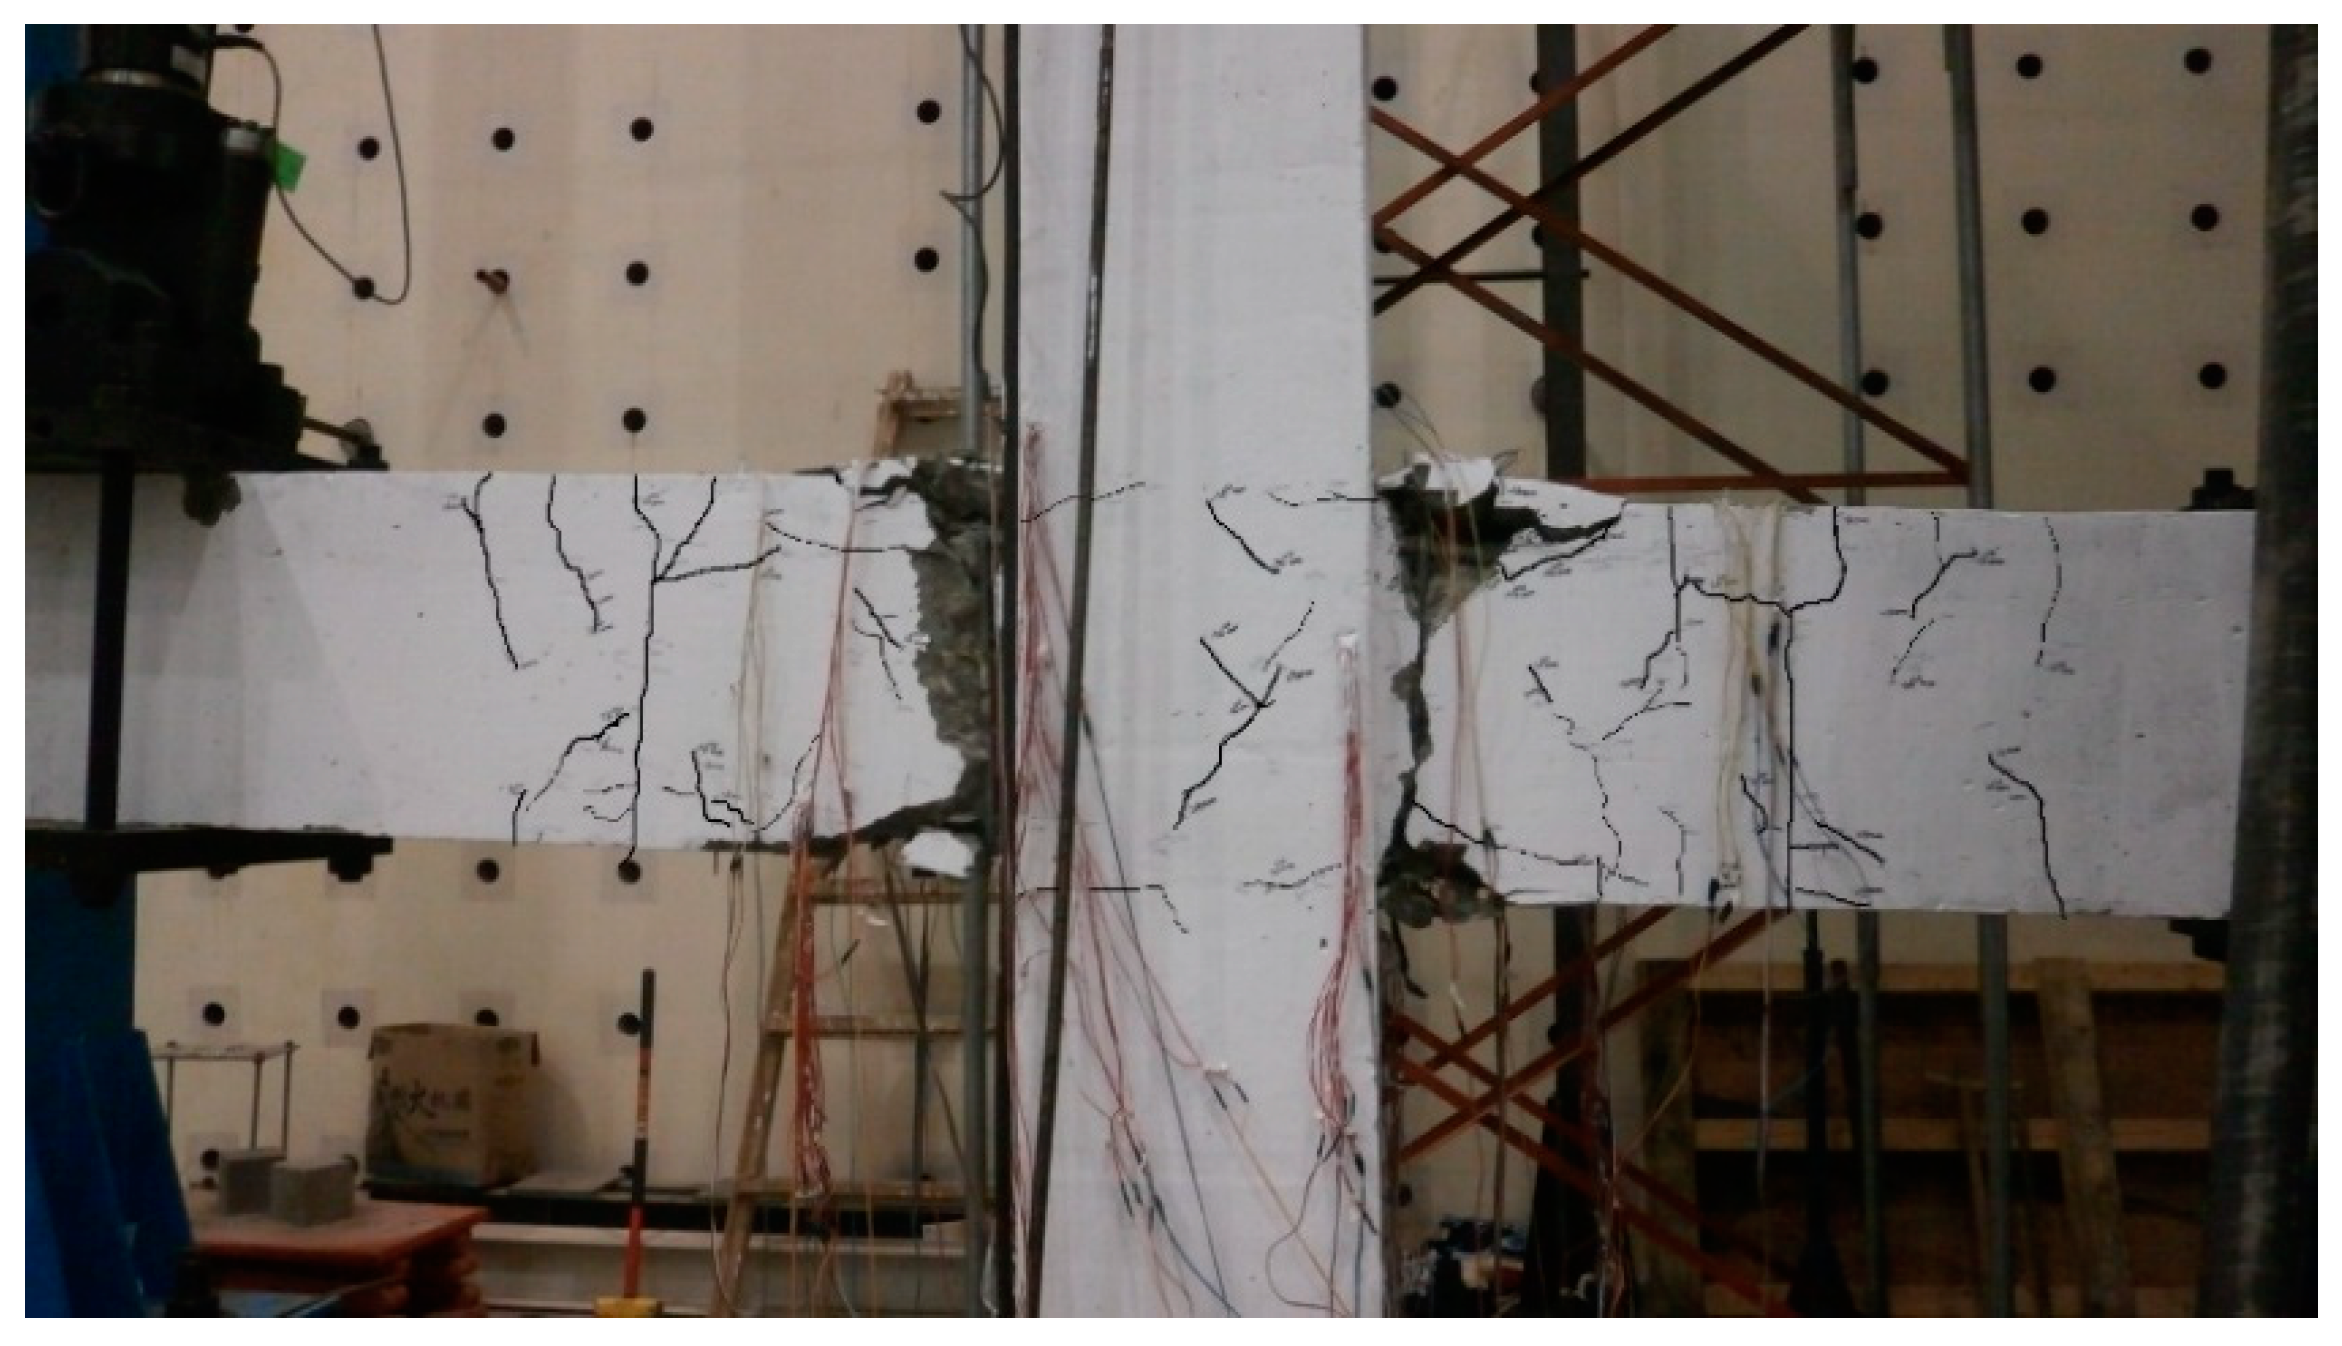
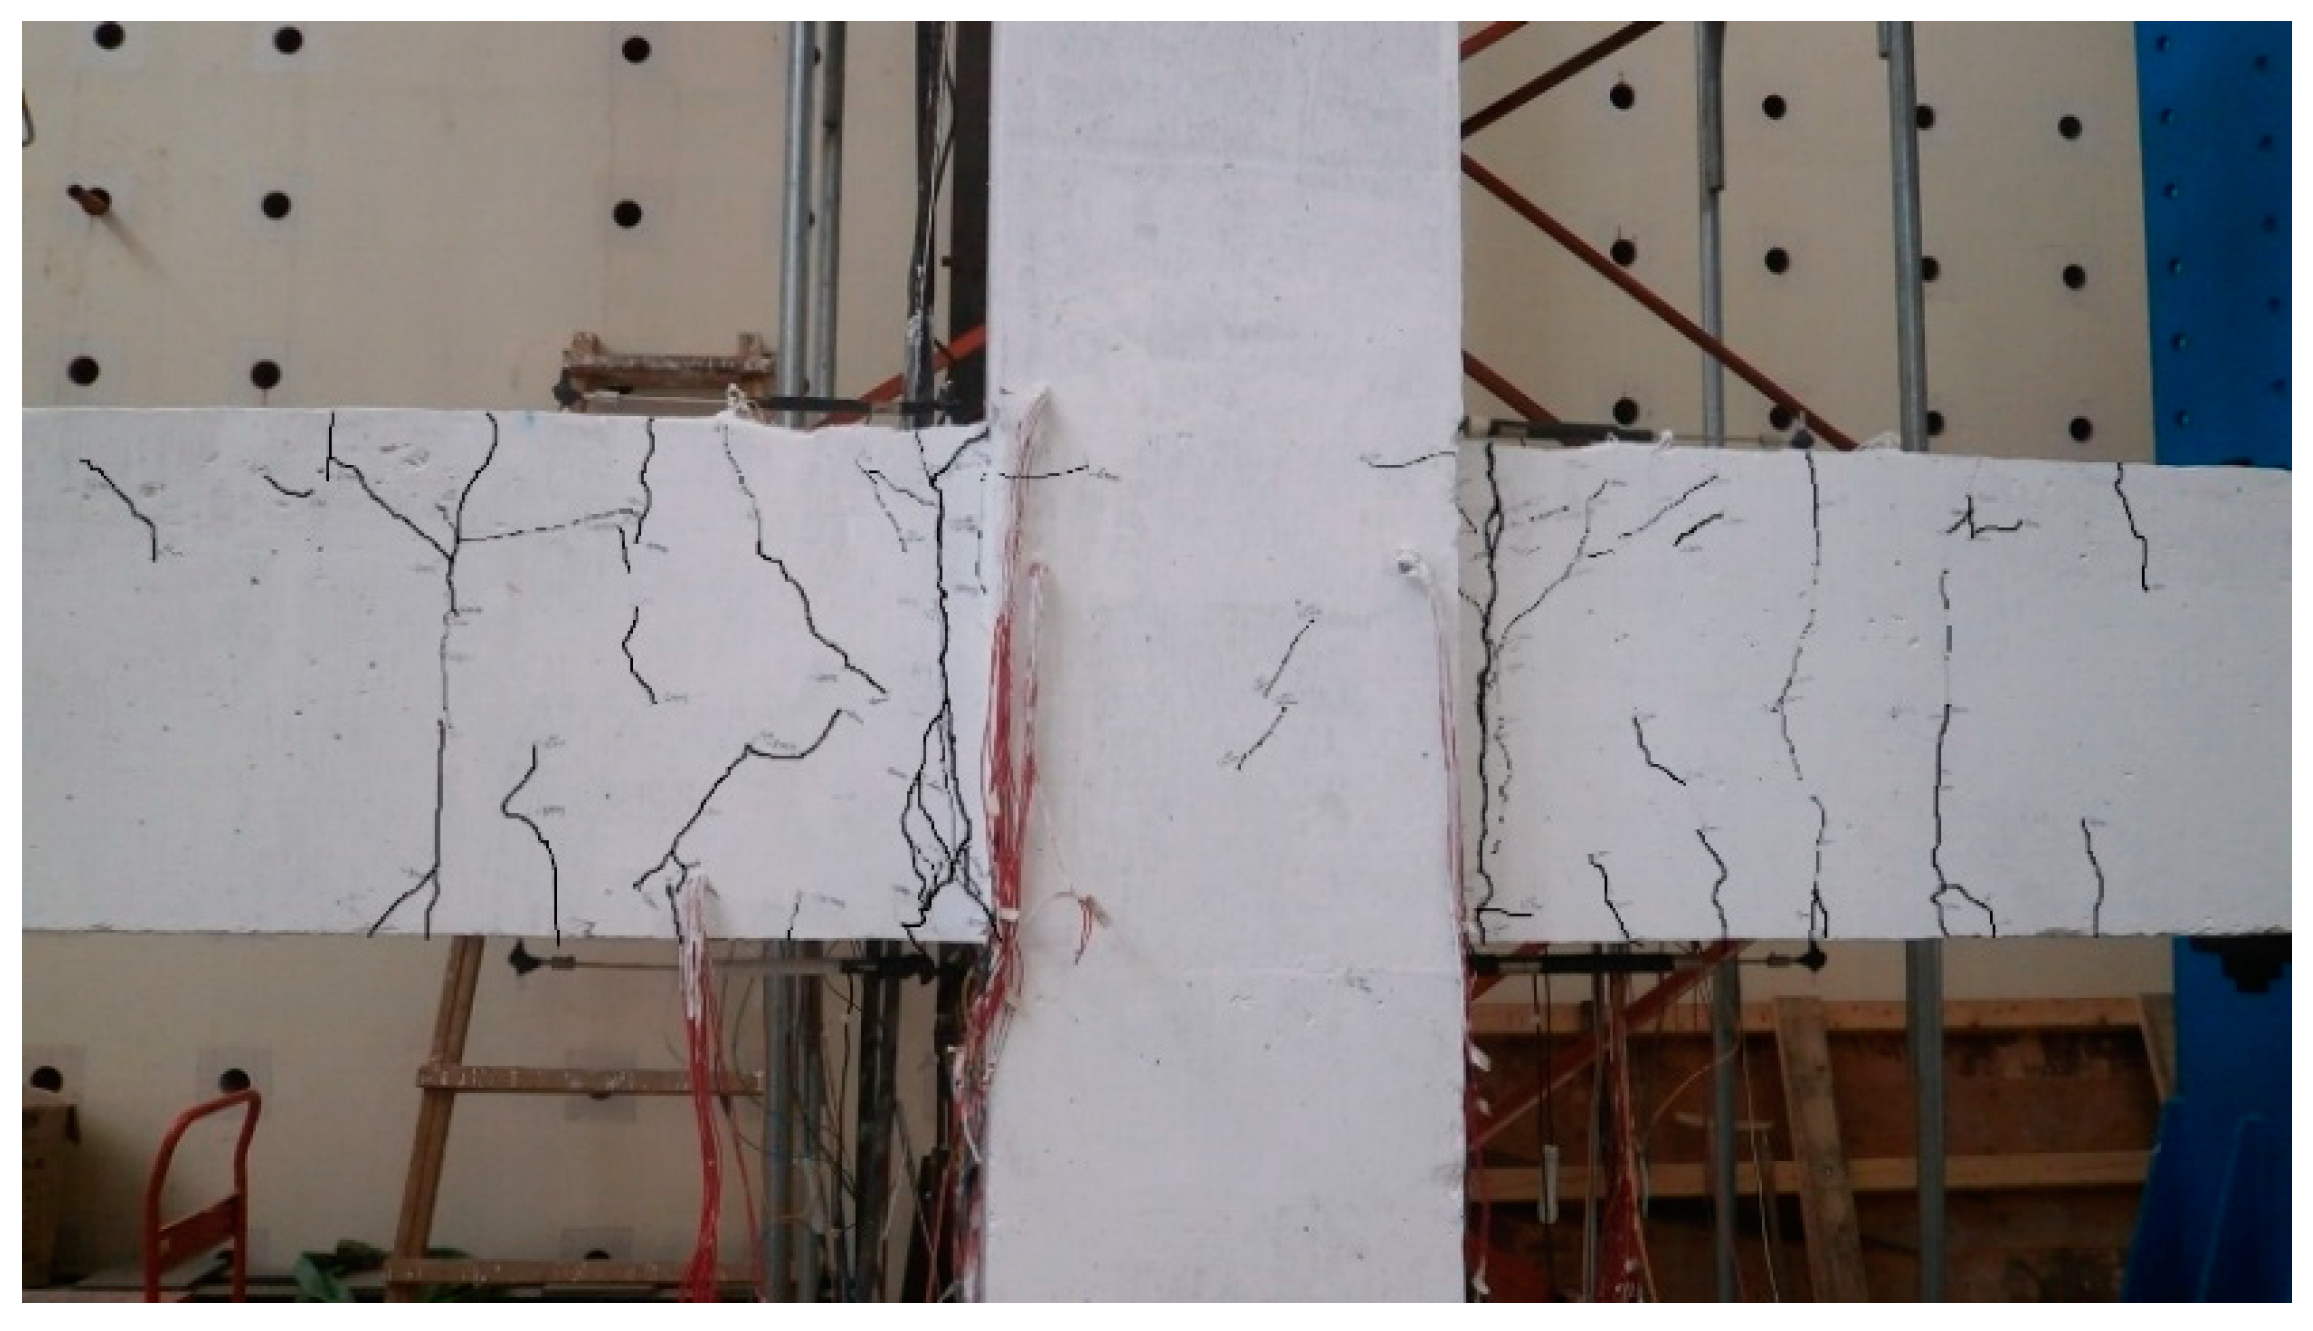
(1) The failure modes of the three joints were beam end failure, and plastic hinges were observed at the beam ends. The core area of the joints was never destroyed; this satisfies the joint design principle of “strong joint weak component”.
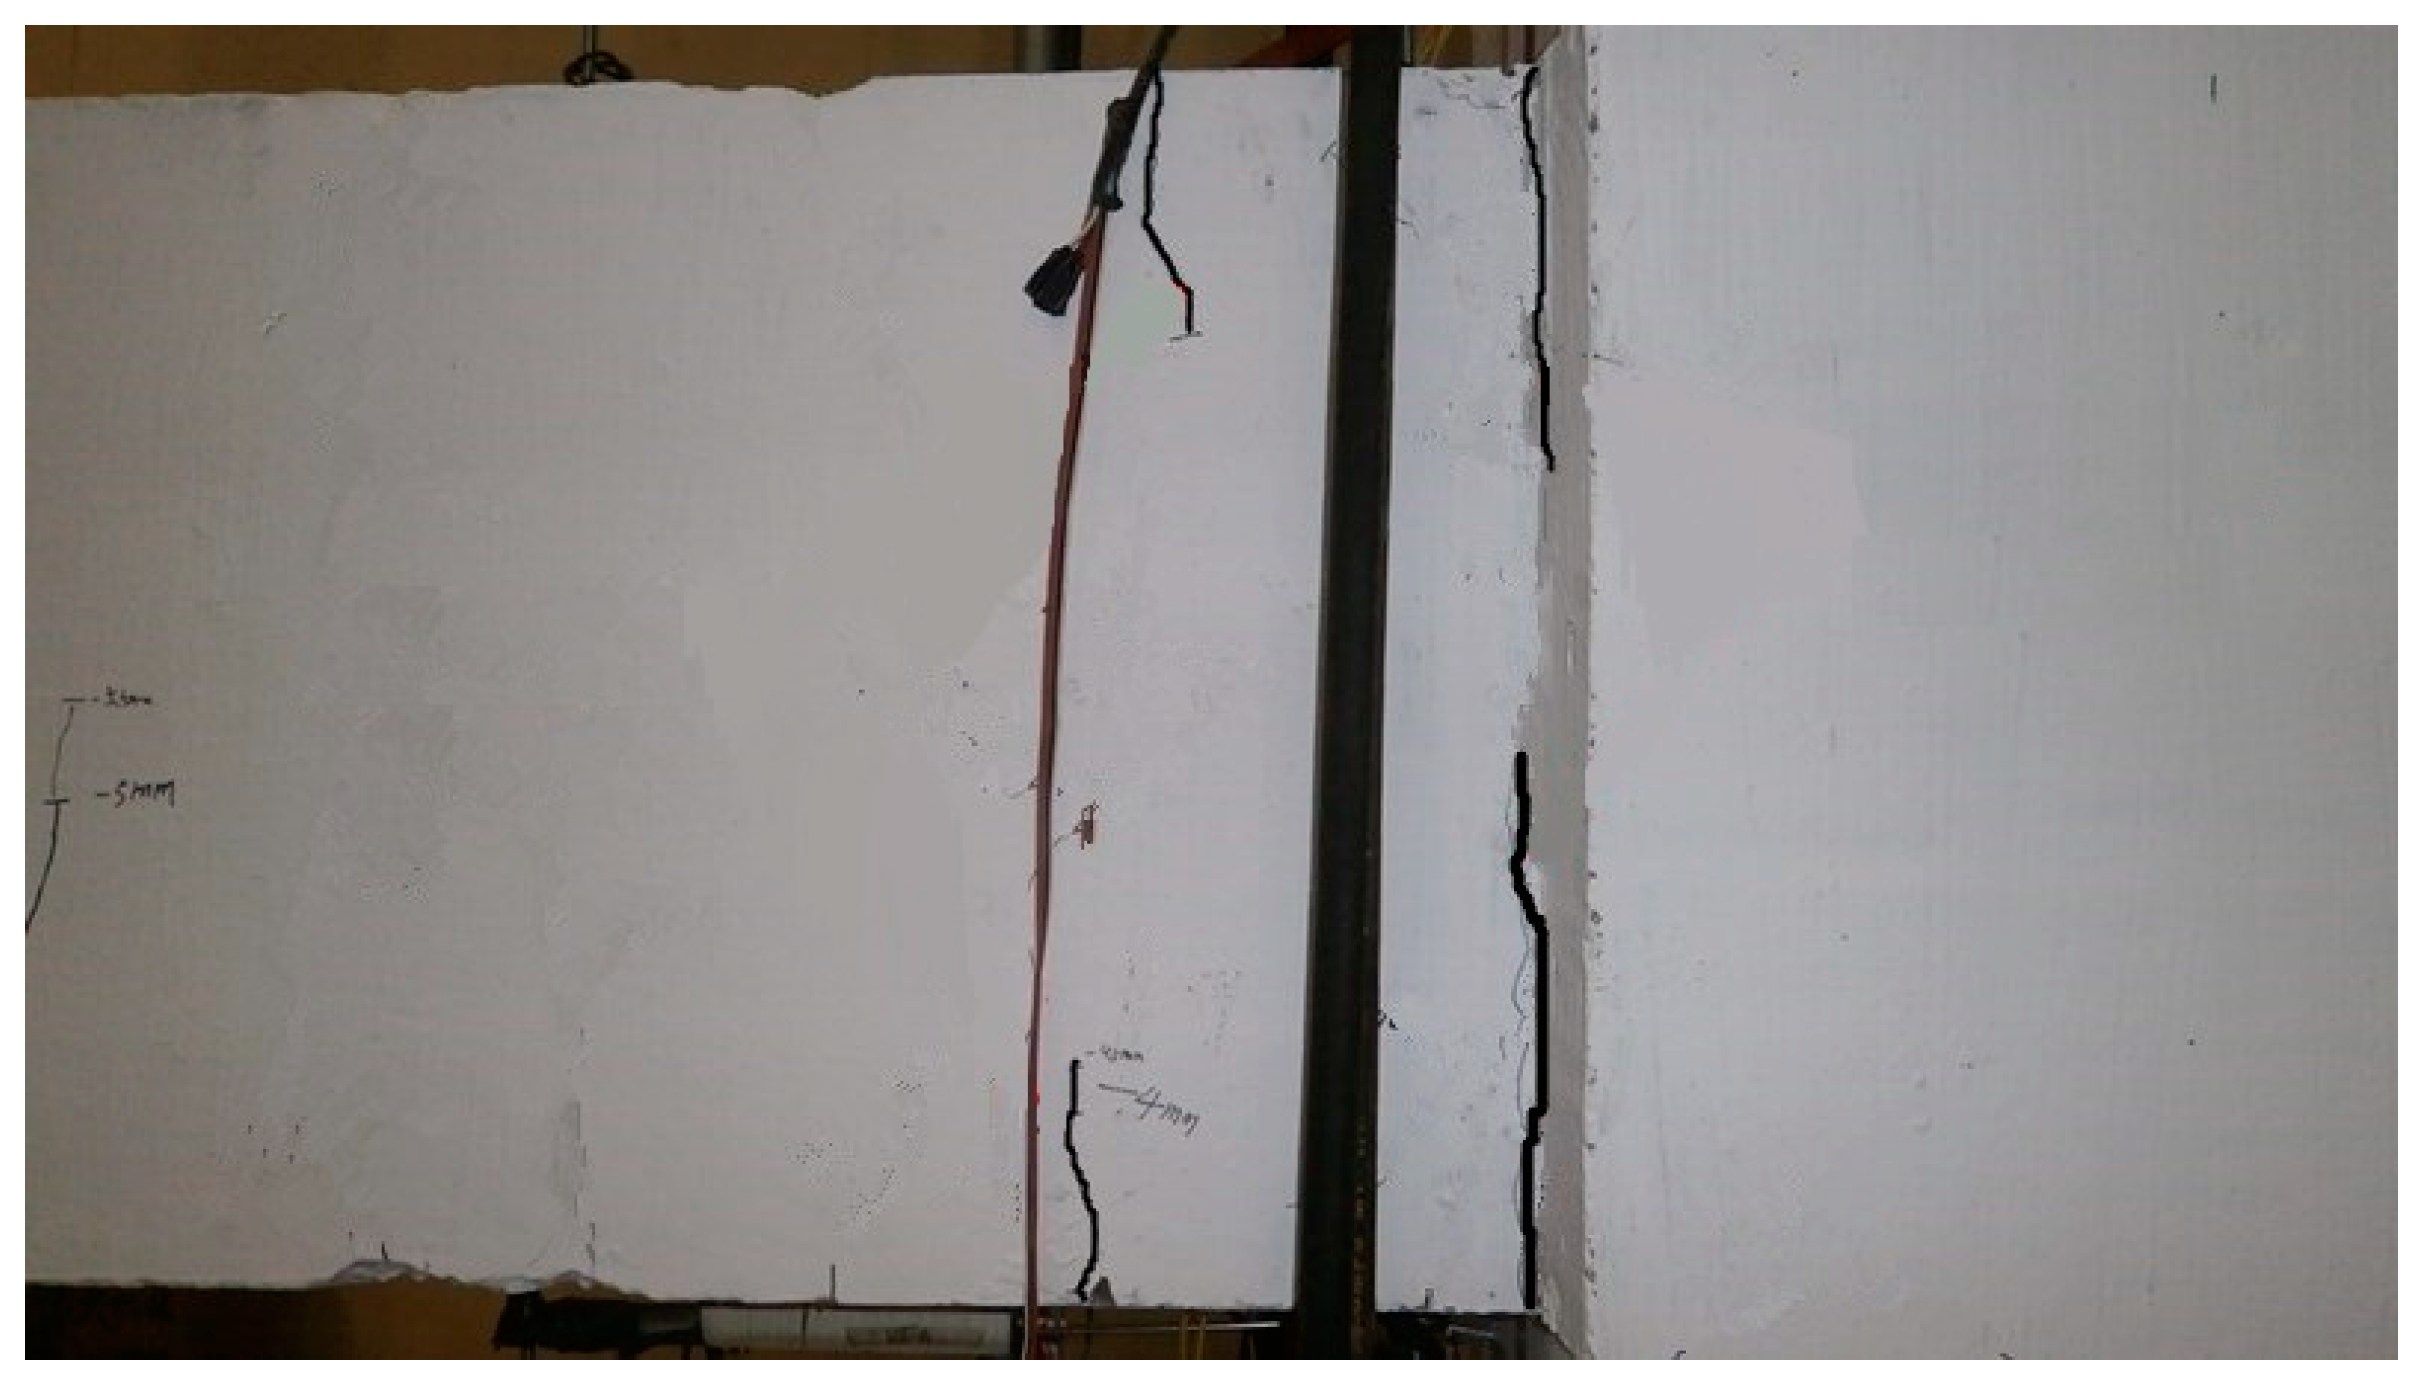
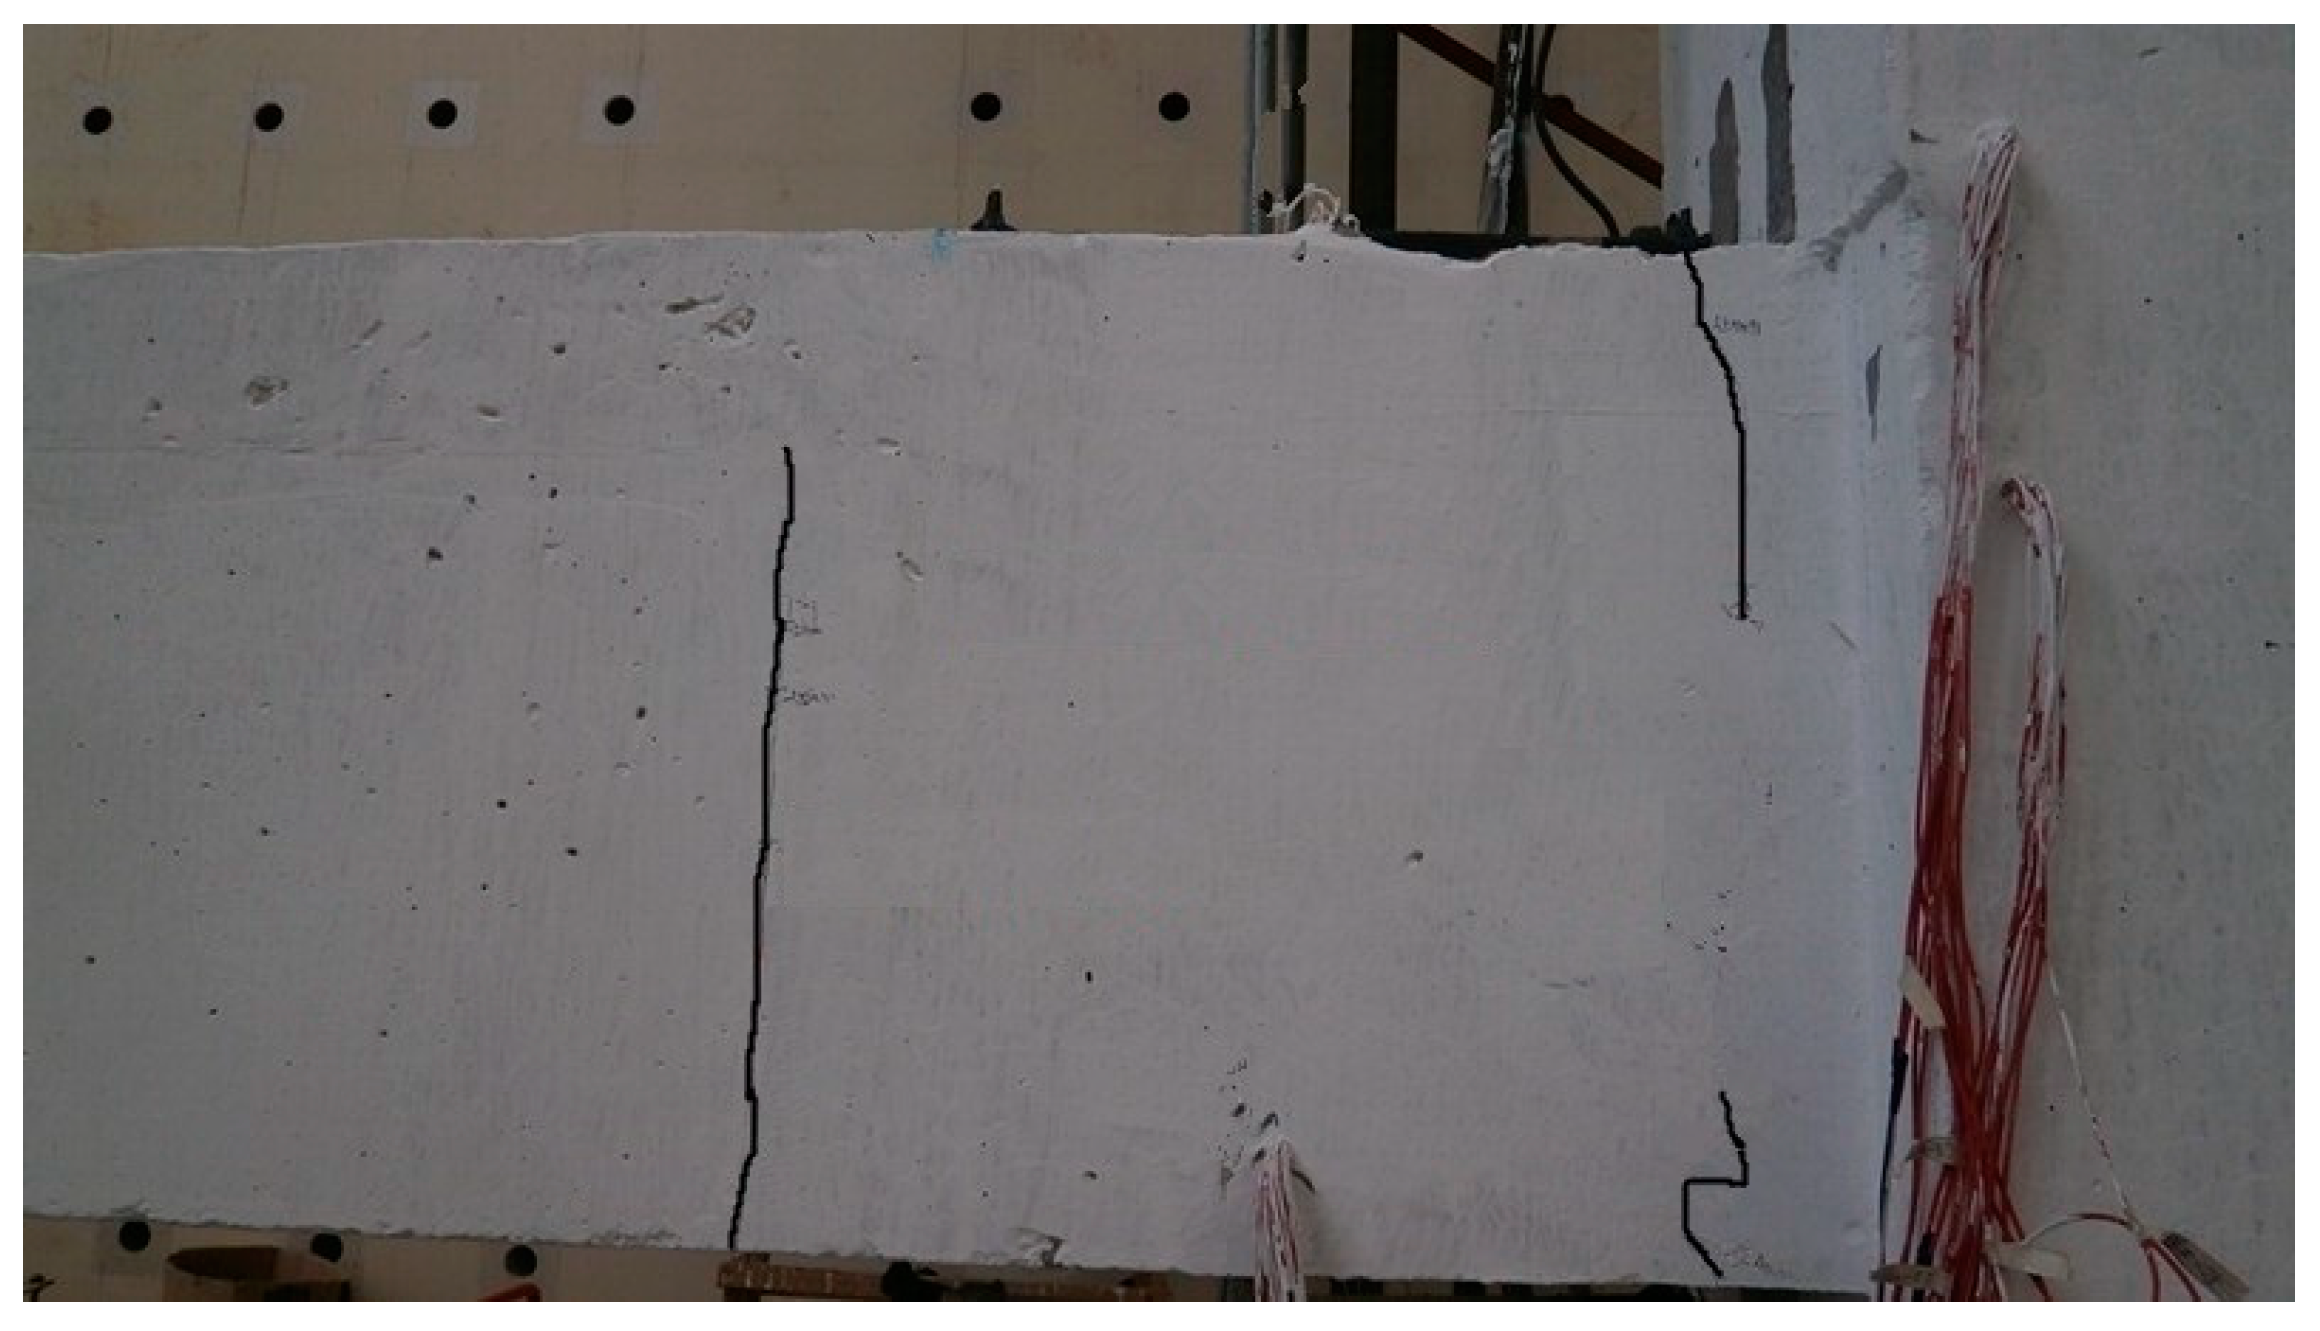
(2) The first crack of the precast prestressed concrete joint at the beam bottom occurred at the vertical new–old concrete interface. The largest bending crack and plastic hinge appeared at the beam end. Fewer cracks developed in the precast beam due to the prestress. The “manual chiseling” method for the horizontal new–old concrete interface and the “shear key” method for the vertical new–old concrete interface in the keyway area satisfied the shear resistance requirements of the member.
(3) The precast prestressed concrete joints were connected by overlapped steel bars in the keyway area. Thus, the load during the forward loading of the joint was increased, while the load during the reverse loading was reduced compared to the cast-in-place joint. The overlapped steel bars in the keyway area were well anchored and could meet the force transmission requirements of the precast prestressed concrete joints under cyclic loading.
(4) Concrete with different strengths in the keyway area affected the stiffness, load, ductility, and energy dissipation of the precast prestressed concrete joints. However, the effect was not strong for these parameters.
(5) The analysis of the hysteresis curves and skeleton curves showed that the precast prestressed concrete joint had comparable seismic resistance to the cast-in-place joint.
