Article

Elucidating the Energetics and Effects of Solvents on Cellulose Hydrolysis Using a Polymeric Acid Catalyst

Department of Biomedical Engineering, University of Arkansas, Fayetteville, AR 72701, USA
*
Author to whom correspondence should be addressed.
Appl. Sci. 2018, 8(10), 1767; https://doi.org/10.3390/app8101767
Submission received: 6 September 2018 / Accepted: 25 September 2018 / Published: 30 September 2018

Abstract

:

Featured Application

Authors are encouraged to provide a concise description of the specific application or a potential application of the work. This section is not mandatory.

Abstract

A novel polymeric acid catalyst immobilized on a membrane substrate was found to possess superior catalytic activity and selectivity for biomass hydrolysis. The catalyst consists of two polymer chains, a poly(styrene sulfonic acid) (PSSA) polymer chain for catalyzing carbohydrate substrate, and a neighboring poly(vinyl imidazolium chloride) ionic liquid (PIL) polymer chain for promoting the solvation of the PSSA chain to enhance the catalytic activity. In order to elucidate the mechanism and determine the energetics of biomass catalytic processing using this unique catalyst, classical molecular dynamics (MD) coupled with metadynamics (MTD) simulations were conducted to determine the free energy surfaces (FES) of cellulose hydrolysis. The critical role that PIL plays in the catalytic conversion is elucidated. The solvation free energy and the interactions between PSSA, PIL, and cellulose chains are found to be significantly affected by the solvent.

1. Introduction

Cellulose is one of the major polymers in the plant cell wall. Deconstruction of cellulosic biomass is a critical step in the production of sugars and biofuels, as an alternative to depleting fossil fuels [1,2,3,4,5,6,7]. In the biochemical platform of biomass conversion, a pretreatment step is required to open up the biomass structures, relocate lignin, or to partially hydrolyze hemicelluloses [8,9,10,11]. Dilute acid pretreatment is one of the leading technologies, among several other approaches [12,13,14]. The disadvantages of the dilute acid pretreatment include the high equipment cost, and the detrimental effect on the environment with regard to acid disposal and recycling. The pretreated lignocellulosic biomass is typically further hydrolyzed to monomeric sugars using an enzyme cocktail [15,16]. However, enzymatic conversion is slow and expensive [17].
Cel48F is a widely used cellulase to catalyze cellulose hydrolysis [18,19]. The mechanism involved in the Cel48F hydrolysis involves two reaction steps. The first step is to break the intermolecular hydrogen bonds formed between cellulose chains, followed by the second step of hydrolyzing the individual cellulose chain to glucose and shorter oligosaccharides. Earlier studies using classical molecular dynamics (MD) simulations have gained insights into the catalytic mechanisms of cellulases such as TmCel12A [20], Cel7A [21], and Cel48F [18,19]. Amino acid residues on cellulases play important roles in adapting their conformations for the entry, breakage, and exit of cellulose chains in the catalytic tunnel, as well as in transferring water molecules into the hydrolysis site for breaking down the glycosidic bond. The microenvironment in the catalytic tunnel inside cellulase is partially dehydrated. Previously, we have performed ab initio molecular dynamics simulations coupled with metadynamics (CPMD-MTD) simulations [22,23,24,25,26,27,28,29,30,31] to elucidate the energetics and mechanisms of acid-catalyzed catalytic conversions, including cellulose hydrolysis, glucose ring opening, glucose dehydration, and isomerization reactions. The barriers of these reactions are found to strongly affect by the solvent. A partially dehydrated environment could potentially reduce the activation barrier and facilitate the hydrolysis reaction.
Inspired by action of cellulase enzymes, a polymeric solid acid catalyst consisting of two adjacent nanostructures was synthesized and immobilized on a porous membrane substrate to mimic the function of cellulase. The poly(styrene sulfonic acid) (PSSA) chain hydrolyzes the β-1,4-glycosidic bonds, whereas the neighboring poly(vinyl imidazolium chloride) ionic liquid (PIL) chain enhances the solvation of the PSSA chain and facilitates the dissolution of cellulose by breaking the intermolecular hydrogen bonds between the neighboring cellulose chains. The schematic interaction between the polymeric acid catalyst and cellulose is shown in Figure 1. The polymeric acid catalyst can operate at higher temperatures than cellulase enzymes, overcoming the limitations of biocatalysts to speed up the reaction rates significantly [32,33]. This designed polymeric acid catalyst was successfully synthesized and studied [34,35,36]. More than 97% total reduction of sugar (TRS) yield was obtained in 1-ethyl-3-methylimidazolium chloride ([EMIM]Cl) solution using cellulose as a substrate at a mild temperature of 130 °C. More recently, the depolymerization of lignocellulosic corn over the biomass was conducted using the optimized polymeric catalyst. Near-quantitative TRS yields were obtained in IL and IL/H2O mixed solvents for dilute acid, base, and stream-pretreated samples obtained from the National Renewable Energy Laboratory [35]. In addition, over 50% glucose yield was obtained for acid-pretreated wheat straw in mixed solvents consisting of ionic liquid and γ-valerolactone (GVL) [36].
To elucidate the mechanism of cellulose hydrolysis using the polymeric catalyst, theoretical calculations were performed in this work to investigate the direct interactions between PSSA, PIL, and cellulose chains using classical MD simulations coupled with metadynamics (MTD) [37,38,39,40] simulations to determine its associated free energy surface (FES). Elucidating the catalytic mechanism will provide an insight and understanding to the biomass hydrolysis process, and it is valuable for developing better catalysts.
MTD simulations have been used extensively in our previous investigations to map out the free energy surfaces [25,27,28,29,30,31] for xylose and glucose condensation reactions, glucose ring opening, glucose-to-hydroxymethylfurfural (HMF) dehydration, and glucose-to-fructose isomerization reactions. It was found that the solvent plays a critical role in all of these reactions, and that the barriers are largely solvent-induced. Here MD-MTD simulations are used to investigate the FES for cellulose hydrolysis in the presence of explicit solvent ([EMIM]Cl and water) molecules.

2. Computational Methods

MD-MTD simulations allow for efficient sampling of free energy surfaces of two interacting molecules without the formation and breakage of a covalent bond in an accelerated time scale of less than one microsecond (µs) by filling the potential wells with repulsive bias potentials [37,38,39,40]. As shown in Figure 2, the bias potential is added to the local minima to facilitate barrier crossing. Once one local minimum is filled close enough to the barrier, the system crosses the barrier and moves to the neighboring minimum. When all the local minima are filled, the FES becomes flat and the system can move back and forth without any barrier. The FES is subsequently reconstructed based on the amount of bias potentials added. This method assumes that several collective variables (CVs) can be used to describe the process, distinguishing different states of the interacting system. Many variables including the number of hydrogen bonds formed, the coordination number, bond distance, bond angle, and dihedral angles, can be used as CVs. To describe the interacting system consisting of one polymer chain from the catalyst and one cellulose substrate accurately, the number of formed hydrogen bonds between the polymer chain and cellulose substrate was used as the CV, as shown in Equation (1). Because the catalytic polymer chain can be both the donor and the acceptor of a hydrogen bond, two CVs were used. One CV was the hydrogen bonds formed between one polymer chain (donor, group i), and one cellulose chain (acceptor, group j), and the other CV had the opposite setting of the donor and the acceptor.
  C V h y d r o g e n   b o n d s = i j 1 ( d i j r 0 ) n 1 ( d i j r 0 ) m  
where d i j is the distance between atom i and atom j; r 0 is the hydrogen bond cutoff distance. m and n are high-power integers used to determine the formation of hydrogen bond. The values m = 12, n = 6, and r 0 = 2.5 Å are typically chosen for calculating the hydrogen bonds.
It is found that polymer chain length plays a critical role in the catalytic activity based on our previous experiment results [34]. MD simulations were conducted for two different chain lengths with degree of polymerization (DP) of 10 and 20 for PSSA, PIL, and cellulose chains. Earlier studies [41,42,43,44] showed that the properties of ionic liquids (ILs) using an OPLS (optimized potentials for liquid simulations) force field from MD simulations agreed well with experimental results. The OPLS force field [45], if available, was used for PSSA and PIL chains for the catalysts. Additional force fields parameters of PSSA, PIL, and [EMIM]Cl were parameterized based on quantum mechanics (QM) calculations using SCAN in Gaussian09 [46]. The monomer units in PSSA and PIL chains were terminated by two methyl groups to mimic the polymeric environment. The scan ranges of bond length, bond angle and dihedrals were 0.2 Å, 10°, and 360° respectively. Geometries for the neutral species were optimized at the MP2/6-31G** level in gas phase. The single point energy was subsequently calculated with the same method and the same basis set for each scanned structure. For PIL and ionized PSSA, the force field parameters were determined at the same level, and the same basis set but with the implicit solvent model. The atomic charges were derived from electrostatic potentials (ESP [47]) calculation using Gaussian09 at the MP2/6-31G** level based on the RESP (restrained ESP) protocol [48,49,50,51]. The force field parameters for [EMIM]Cl were improved based on previous studies [41,44], and it has been validated in our earlier work [52].
The improved sampling MTD simulations were conducted using AMBER [53], coupled with PLUMED1.3 [54] to reconstruct the FESs of interactions between PSSA, PIL, and cellulose chains in aqueous solution as well as in [EMIM]Cl. The initial polymeric structures were constructed by AMBERTOOLS package [55]. The GLYCAM06 [56] force field was used for cellulose. The TIP3P was used for water model [57]. The initial distance between the polymer chains and the simulation cell edge was 10 Å. All simulations were conducted at constant temperatures (300 K in aqueous solution and 353 K in [EMIM]Cl) and pressure (1 bar) under the periodic boundary condition with the Langevin dynamics thermostat [58]. A 10 Å cutoff was used for both the real part of the electrostatic and van der Waals (VdW) interactions. The time step was chosen to be 1 femtosecond (fs). The force field parameters of conuterions Na+, Cl were from ion08 [59] in AMBER. The criteria for the formation of a hydrogen bond are that the distance between the two heavy atoms A and B is equal to or less than 3.5 Å and that the angle A—H···B is equal to or greater than 130°. As mentioned, a partially dehydrated microenvironment can facilitate the hydrolysis reaction. Solvation-free energies were calculated based on the thermodynamics integration [60] (TI) method for DP 10 and DP 20 polymer chains in [EMIM]Cl and aqueous solutions.

3. Results and Discussion

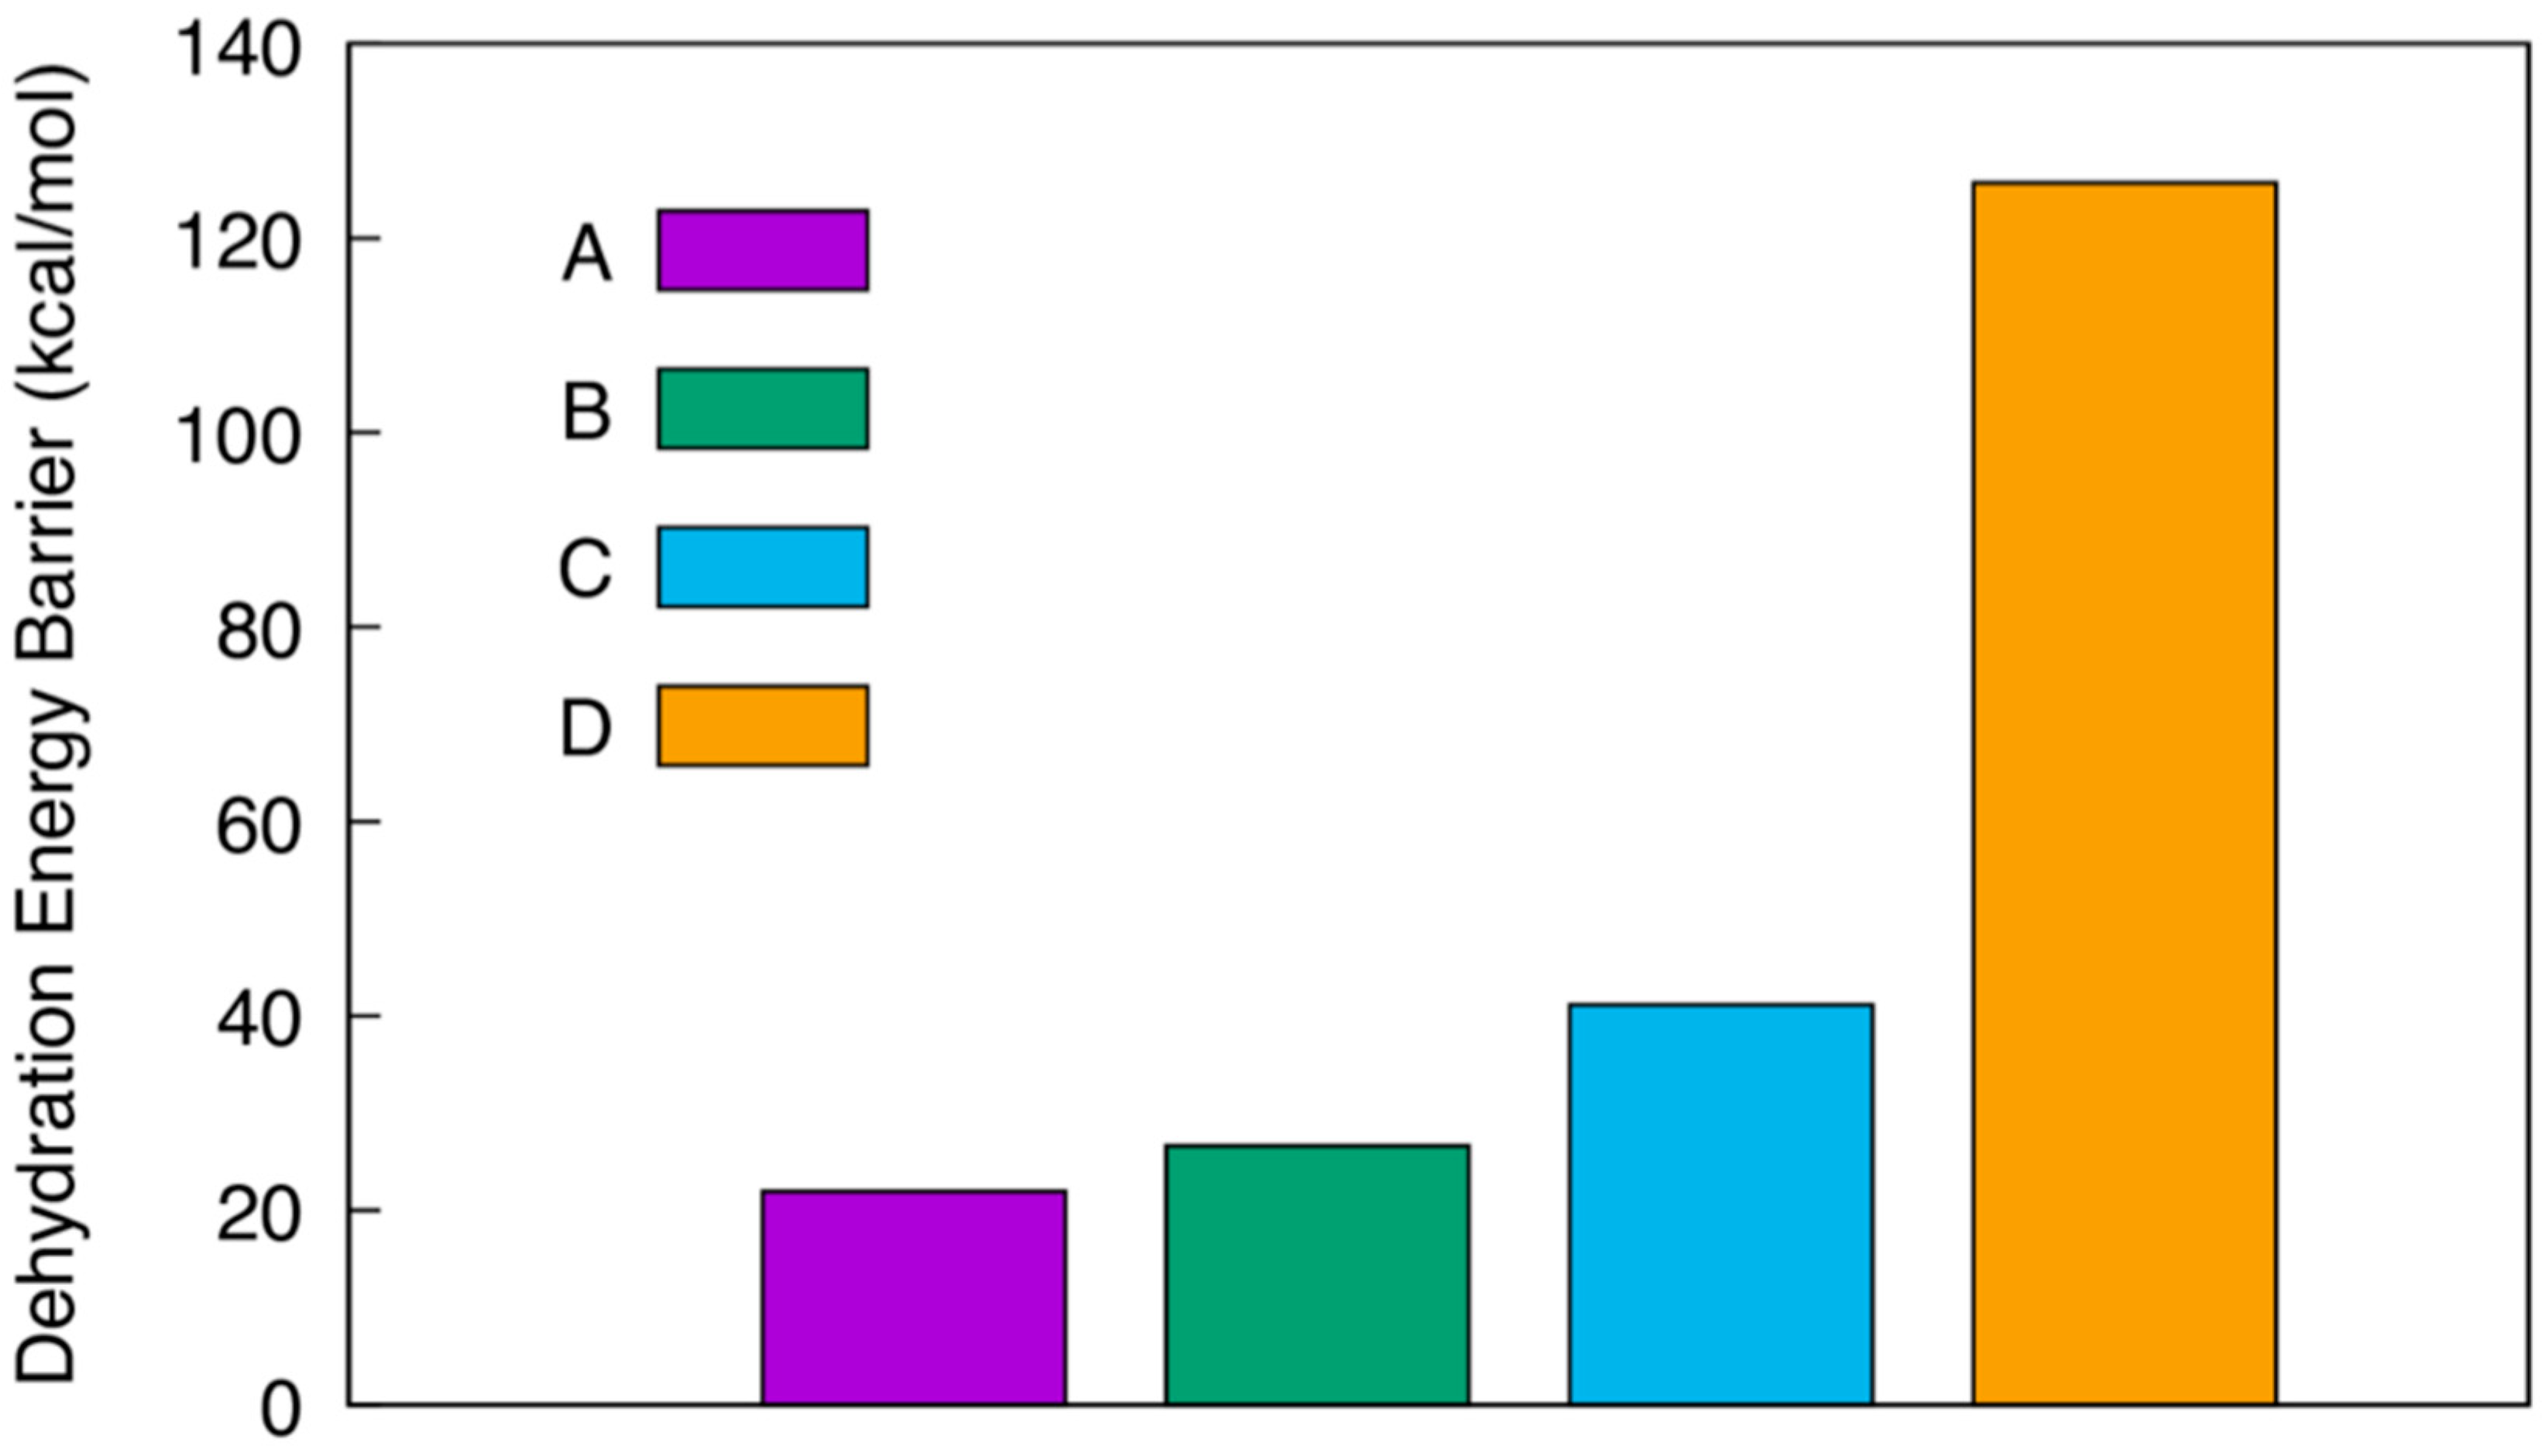
The MD-MTD simulations commenced when the two polymer chains were close to each other of about 5 Å apart. The simulations were conducted for a total of between 100 to 200 ns. Although the initial intermolecular distances were relatively short, interactions between PSSA, PIL, and cellulose chains appeared to be different in [EMIM]Cl and aqueous solutions. In [EMIM]Cl, PSSA or PIL chains can quickly form hydrogen bonds with the cellulose chain soon after the simulations started. However, both PSSA and PIL chains moved apart from cellulose chain during the initial 20–30 ns simulations in aqueous solution. The different behaviors of polymeric catalysts and cellulose chains are critically affected by the solvent. [EMIM]Cl is an excellent solvent of cellulose, and has been widely applied to study cellulose hydrolysis catalyzed by different catalysts [61,62,63,64]. On the contrary, cellulose is almost insoluble in aqueous solutions because water molecules hardly disrupt the intermolecular hydrogen bonds between the cellulose chains [65]. In MD-MTD simulations, the direct interactions between polymeric catalysts and cellulose chains are energetically favorable in [EMIM]Cl. In aqueous solution, the separated states are more favorable. The free energy for the direct interaction between the polymeric catalyst and cellulose chains were found to arise largely in aqueous solution, because water molecules form an extensive hydrogen bonding network and prevent PSSA, PIL, and cellulose chains from moving close to each other. Water molecules between the PSSA, PIL, and cellulose chains have to be removed so that the polymer chains can interact directly and form hydrogen bonds with each other. In MD-MTD simulations, biased potentials were continuously added into the system so that PSSA/PIL and cellulose chains can overcome different dehydration energy barriers to interact directly, as shown in Figure 3.
A represents DP 20 ionized PSSA interacting with DP 20 cellulose in aqueous solution. B represents DP 10 neutral PSSA interacting with DP 10 cellulose in aqueous solution. C represents DP 20 PSSA and DP 20 PIL interacting system in water. D represents DP 10 PIL interacting with DP 10 cellulose in water. Figure 3 shows the barriers that need to be overcome in order for the two polymer chains to form any direct contact interaction. The dehydration energy barrier between the ionized PSSA and cellulose chains was about 21 kcal/mol. The neutral PSSA slightly increased the barrier to about 28 kcal/mol. This was surprising, as the ionized species typically had stronger solvation free energies, as shown in Figure 4. However, since the polymer chains in A were only half of those in B, polymer chain length also contributed to the energy barriers. Short chains had stronger solvation free energies per DP compared to the longer PSSA and ionized PSSA chains. More significantly, the entropic cost for an unattached short chain to bind was higher than that of a longer chain. As a result, the barrier in B was slightly higher than that of in A. The dehydration energy barrier for C between PIL and PSSA increased to about 40 kcal/mol. This was due to the much stronger solvation free energy of the PIL chains in water, as shown in Figure 4. The solvation free energies of the various polymer chains in water and ionic liquid will be discussed in more detail later. System D, involving interactions between PIL and cellulose, has the highest dehydration energy barrier, of about 123 kcal/mol. This is again due to the much stronger solvation free energy of the PIL chain, and the chains are much shorter.
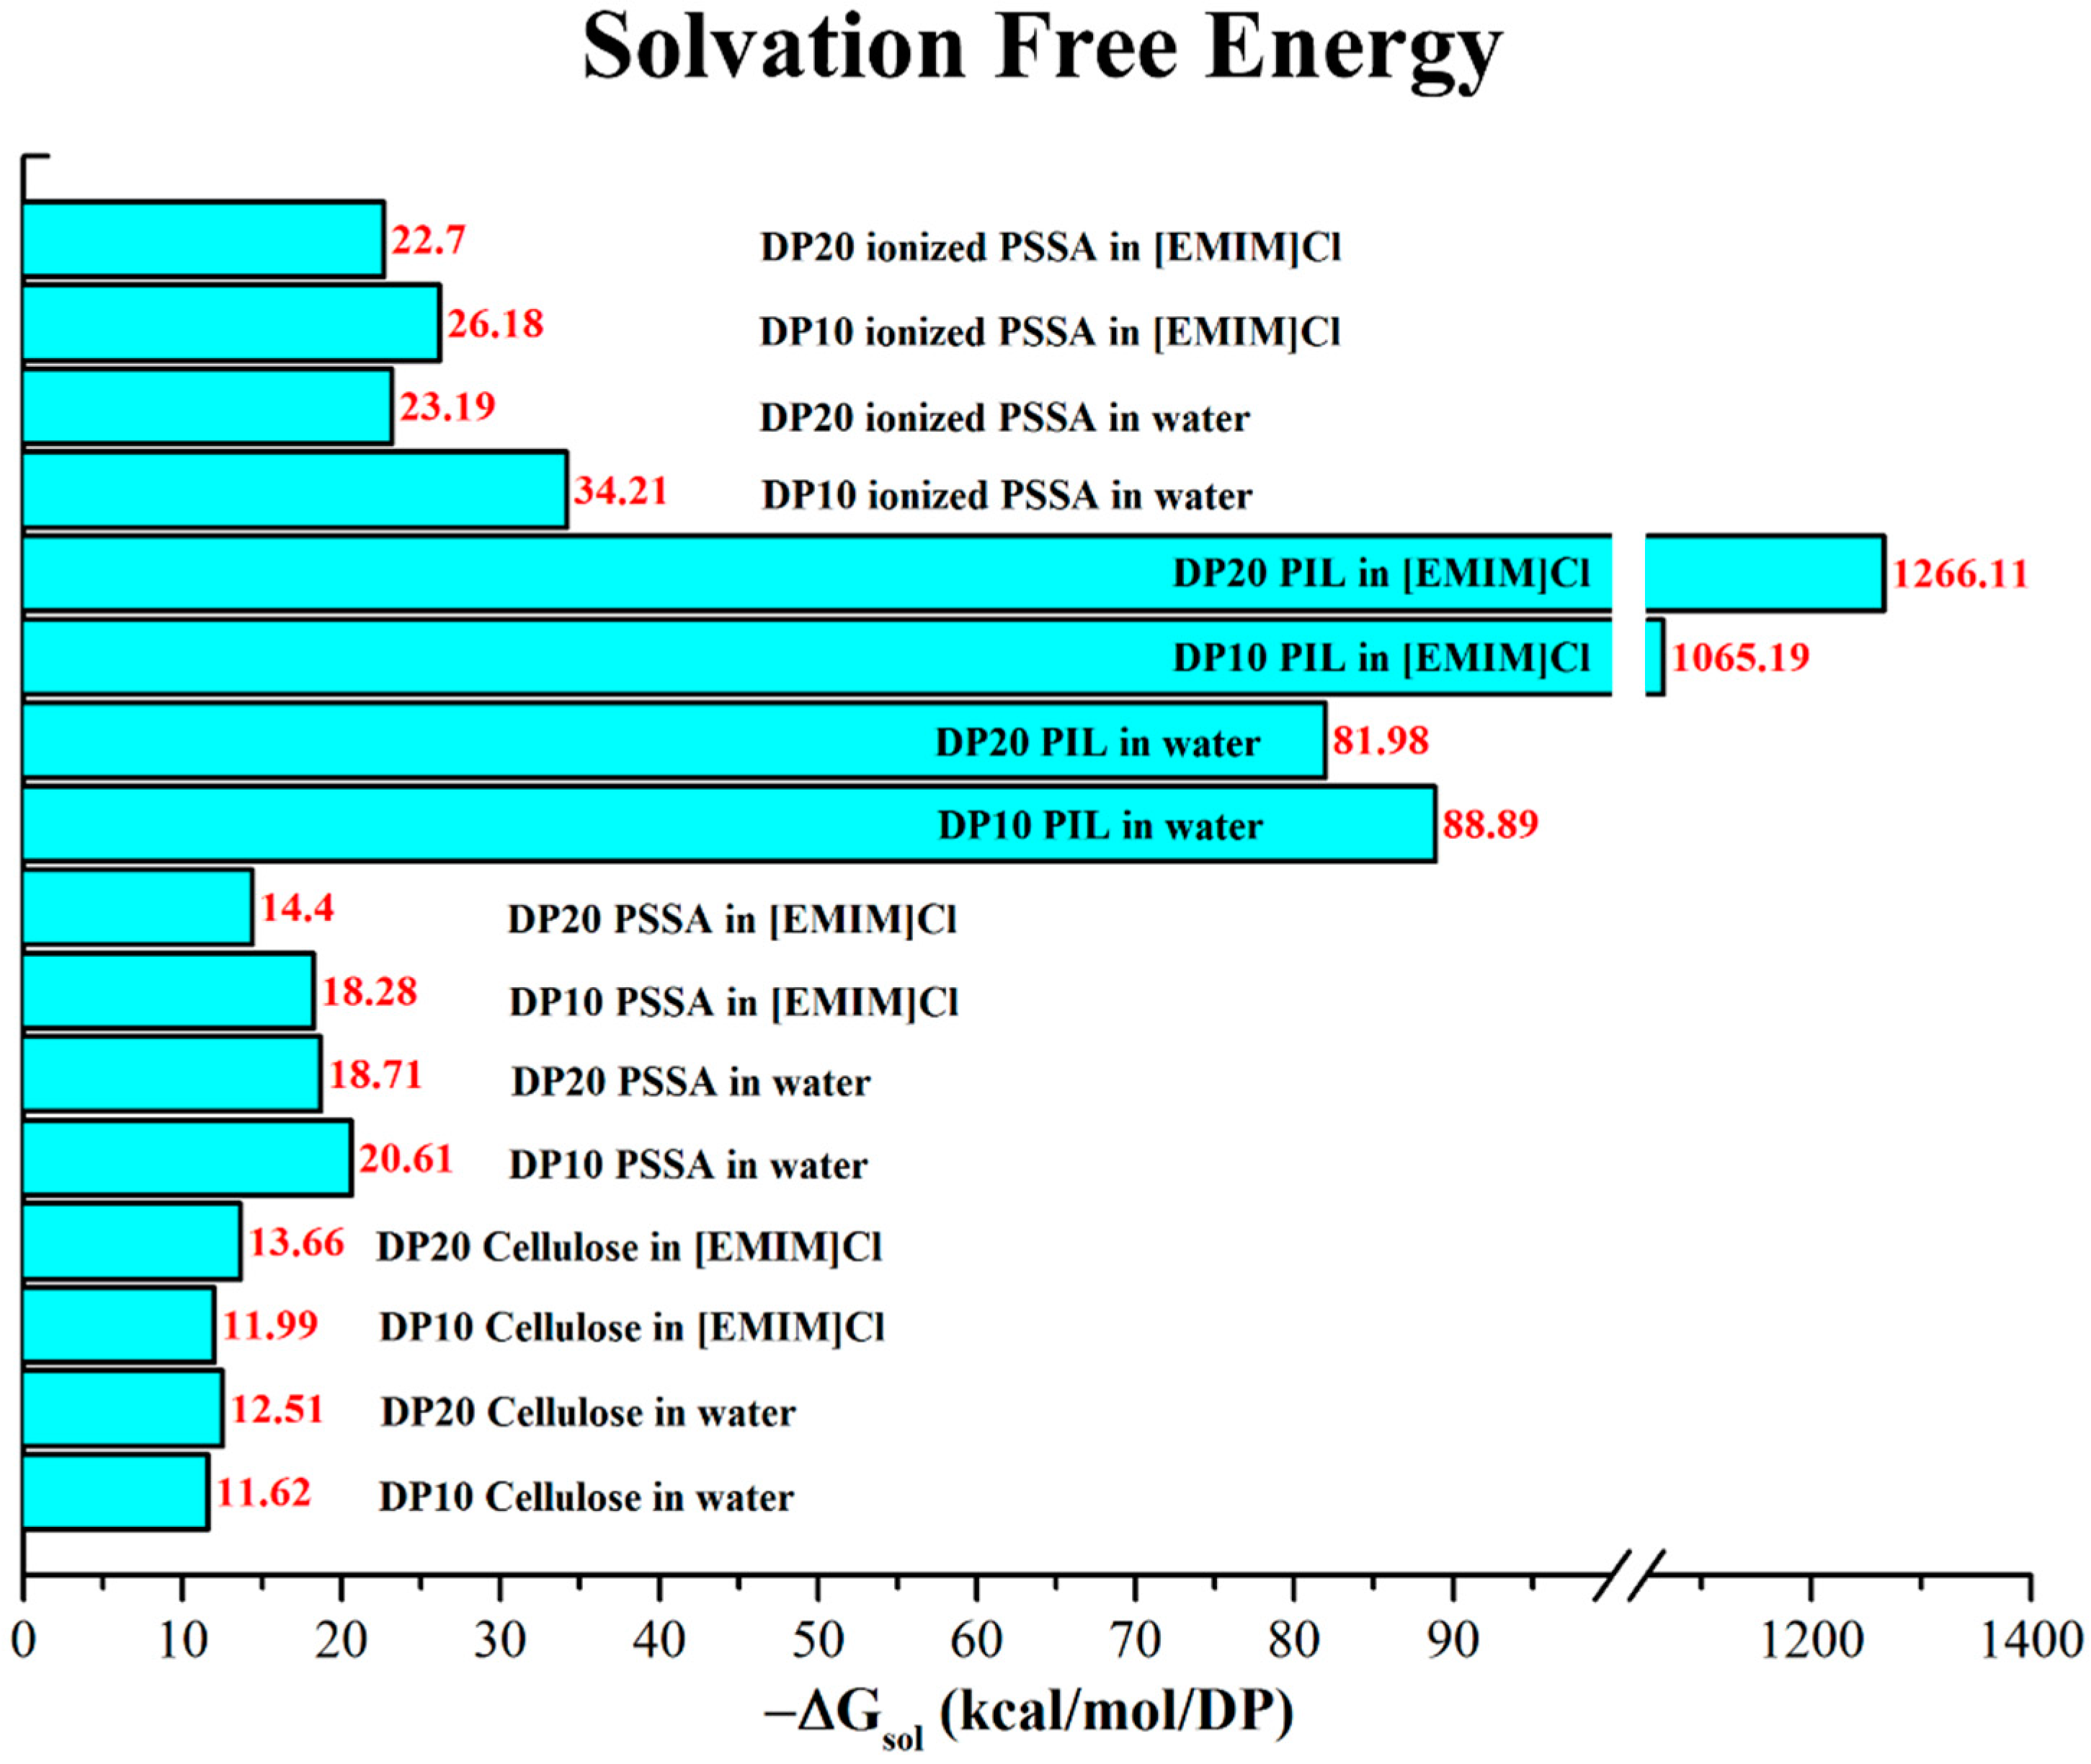
The affinity between solute and solvent molecules significantly affects the interactions between polymeric catalysts and cellulose chains. To better understand the behaviors of PSSA, PIL, and cellulose in different solvents. The TI method was used to calculate the solvation free energies in [EMIM]Cl and aqueous solutions. Figure 4 shows the solvation free energy of each polymer chain per monomer unit in water and [EMIM]Cl. It can be seen clearly that the cellulose and PSSA chains, irrespective of their polymer chain length, had solvation free energies of between 10–30 kcal/mol, with the only exception of DP 10 ionized PSSA chain, which had 34 kcal/mol solvation free energy per monomer unit. For neutral and ionized PSSA chains, shorter chains had a slightly higher solvation free energy per monomer unit compared to that of the longer chains in both water and [EMIM]Cl. This was understandable, as shorter chains had overall more solvent molecules surrounding them. The differences in solvation free energies of the same polymer chain in water and the [EMIM]Cl solvents were small, with only a few kcal/mol per monomer unit for the neutral polymers. Both water and [EMIM]Cl are highly polar solvents. However, for ionized PSSA chains, solvation free energies were larger compared to the corresponding neutral PSSA chains. This was due to the fact that charged residues typically have stronger solvation free energies arising from the increased dipole-dipole interaction between the polymer and solvent.
What was really surprising was the solvation free energies for the PIL chains in both water and [EMIM]Cl. The solvent free energies increased to about 80–90 kcal/mol per monomer unit in water, compared to the values of about 10–30 kcal/mol for PSSA and cellulose chains. This dramatic increase in solvation free energy was due to the polyelectrolyte nature of the PIL chains. The solvent free energies further increased to about 1000 kcal/mol for PIL chains in [EMIM]Cl solvent, a more than 10-fold increase than in water. This drastic increase in solvation free energy of the PIL chain was one of the main reasons that our catalyst was very effective in catalyzing the cellulose in [EMIM]Cl solvent, as well as in the mixed solvent of [EMIM]Cl/H2O [34,35,36]. Since both of our polymeric solid acid catalysts and cellulose substrates were in the solid state, solid–solid reactions are generally slow and ineffective due to the limited surface interactions. However, in the case of our PSSA/PIL catalyst, the significantly larger solvation free energy of the PIL chain rendered the polymeric catalyst more solvable in [EMIM]Cl, and to some extent, in aqueous solutions as well. The solvated PIL chains open up the polymer catalyst and allows the cellulose chains to move in and to be hydrolyzed by the PSSA acid chains. The inclusion of the PIL chains was critically important for our designed polymeric solid acid catalyst.
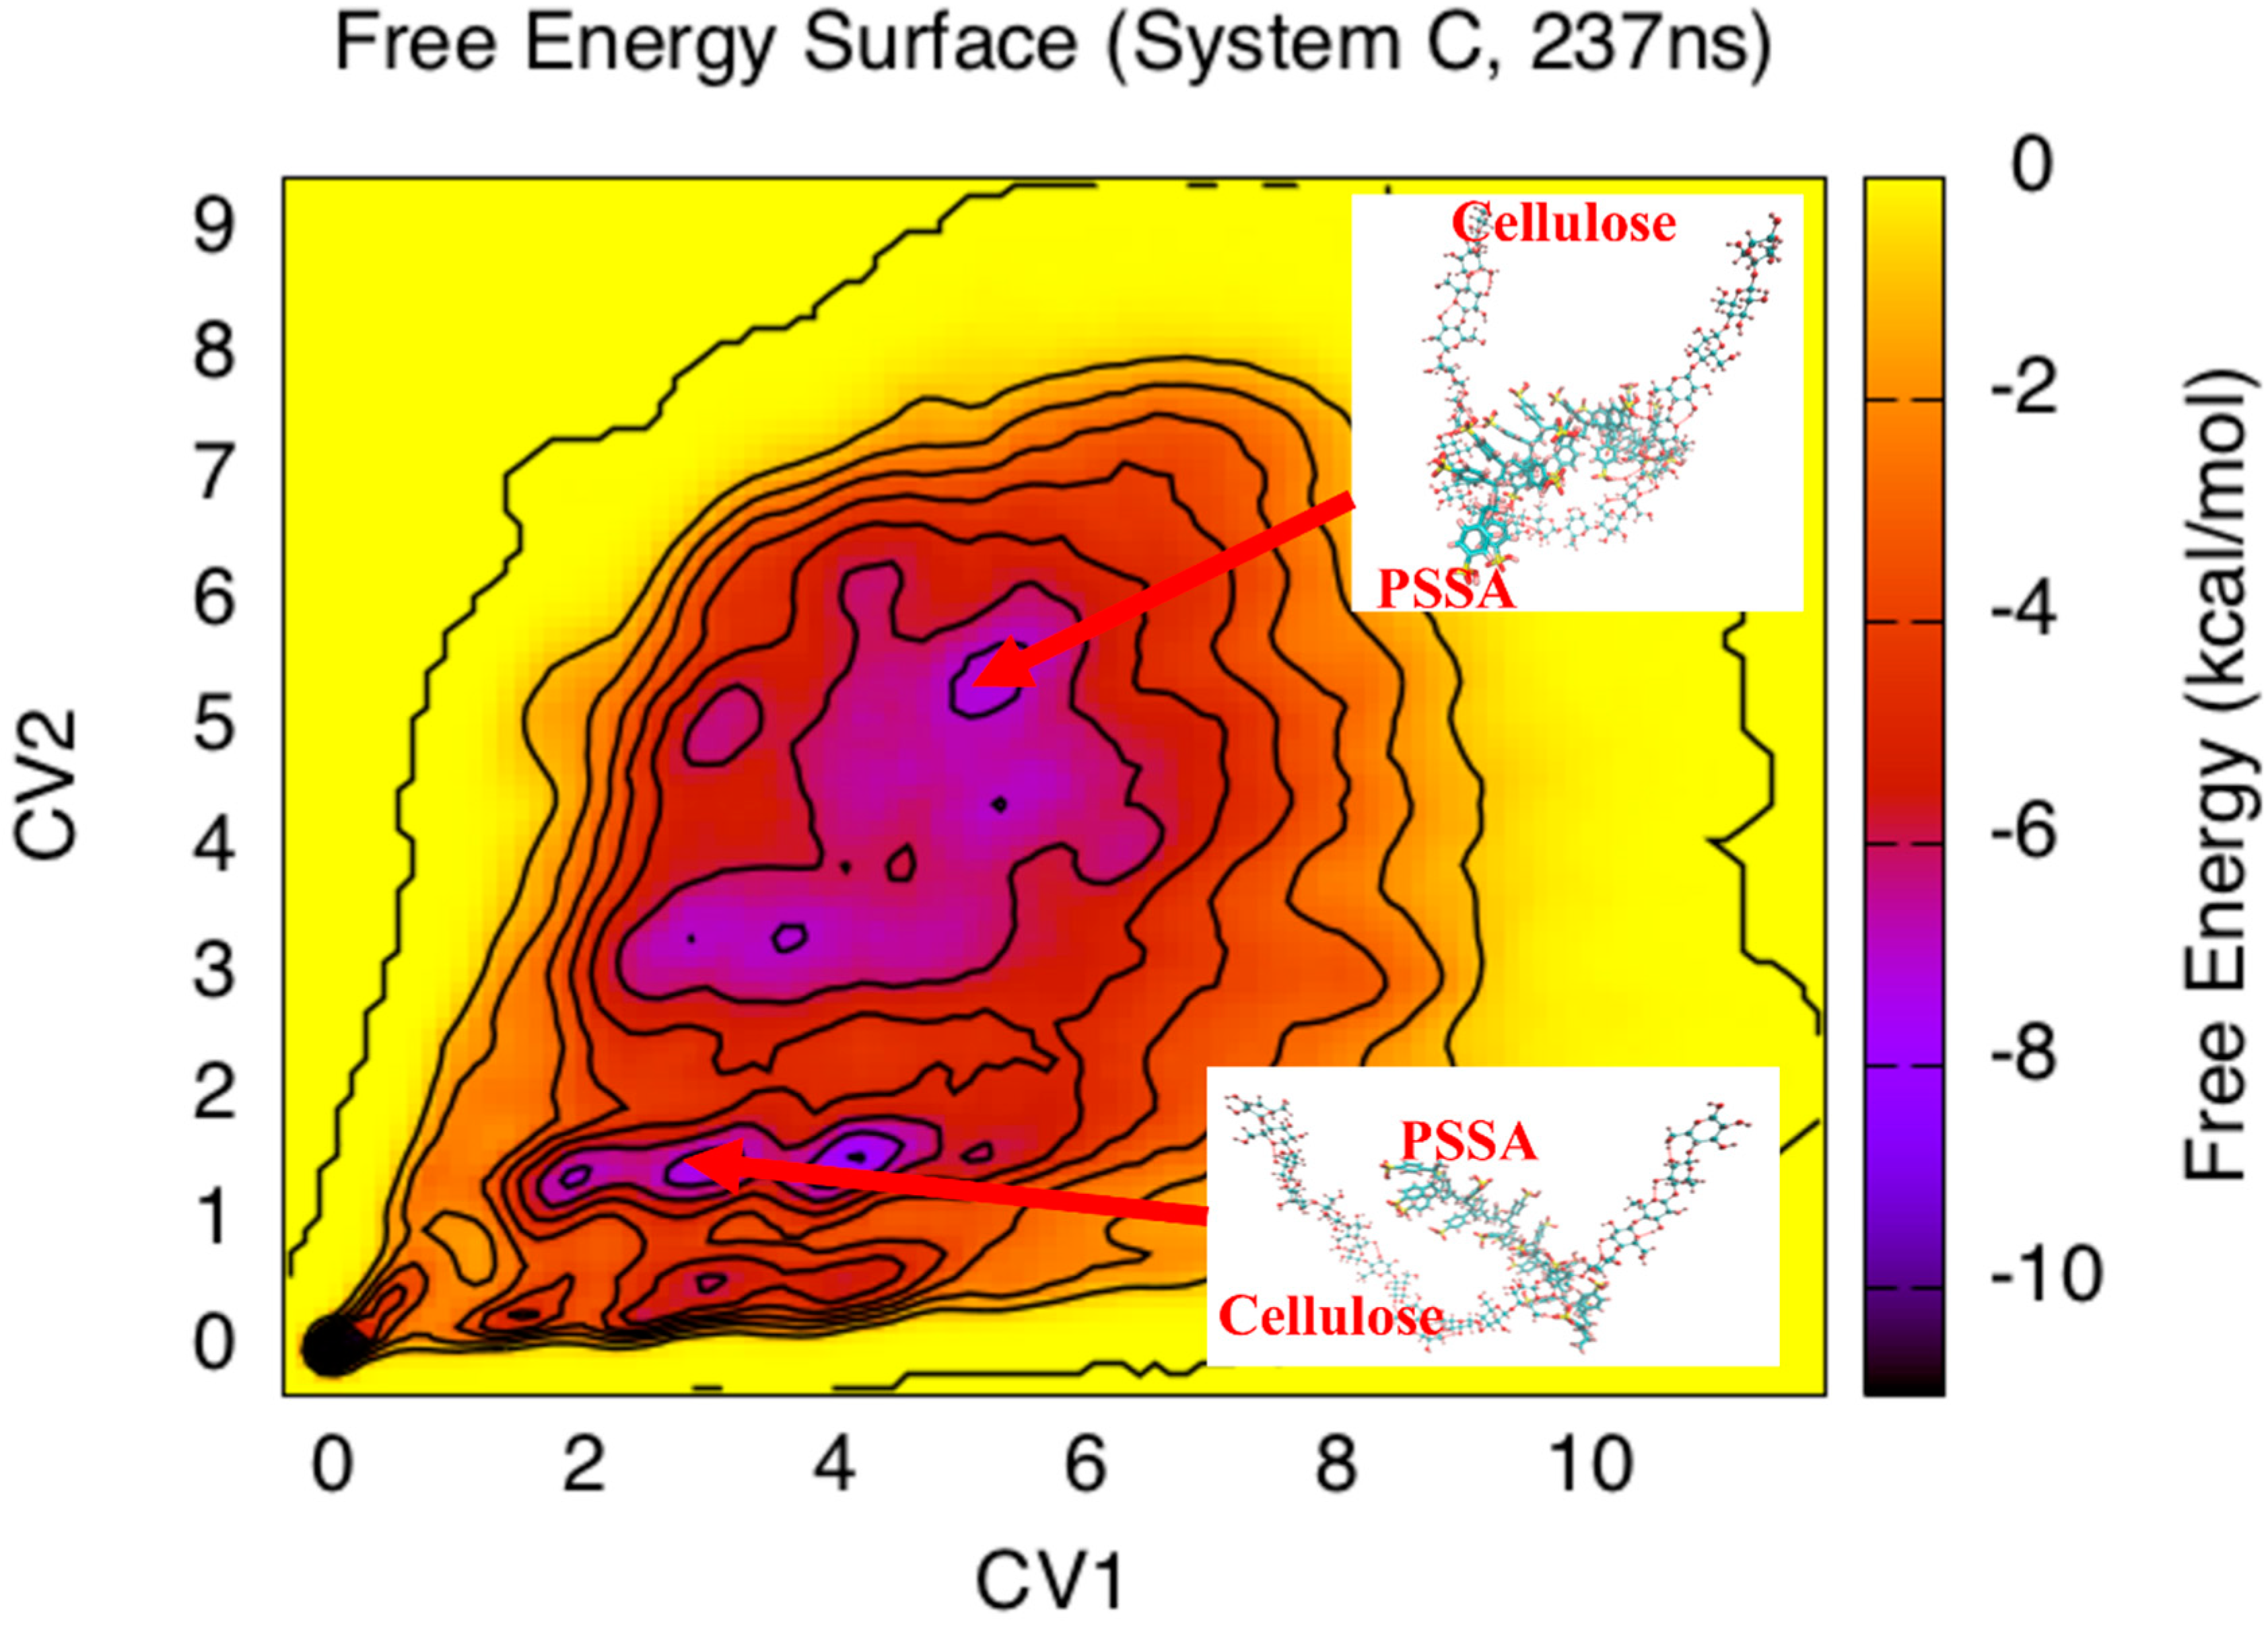
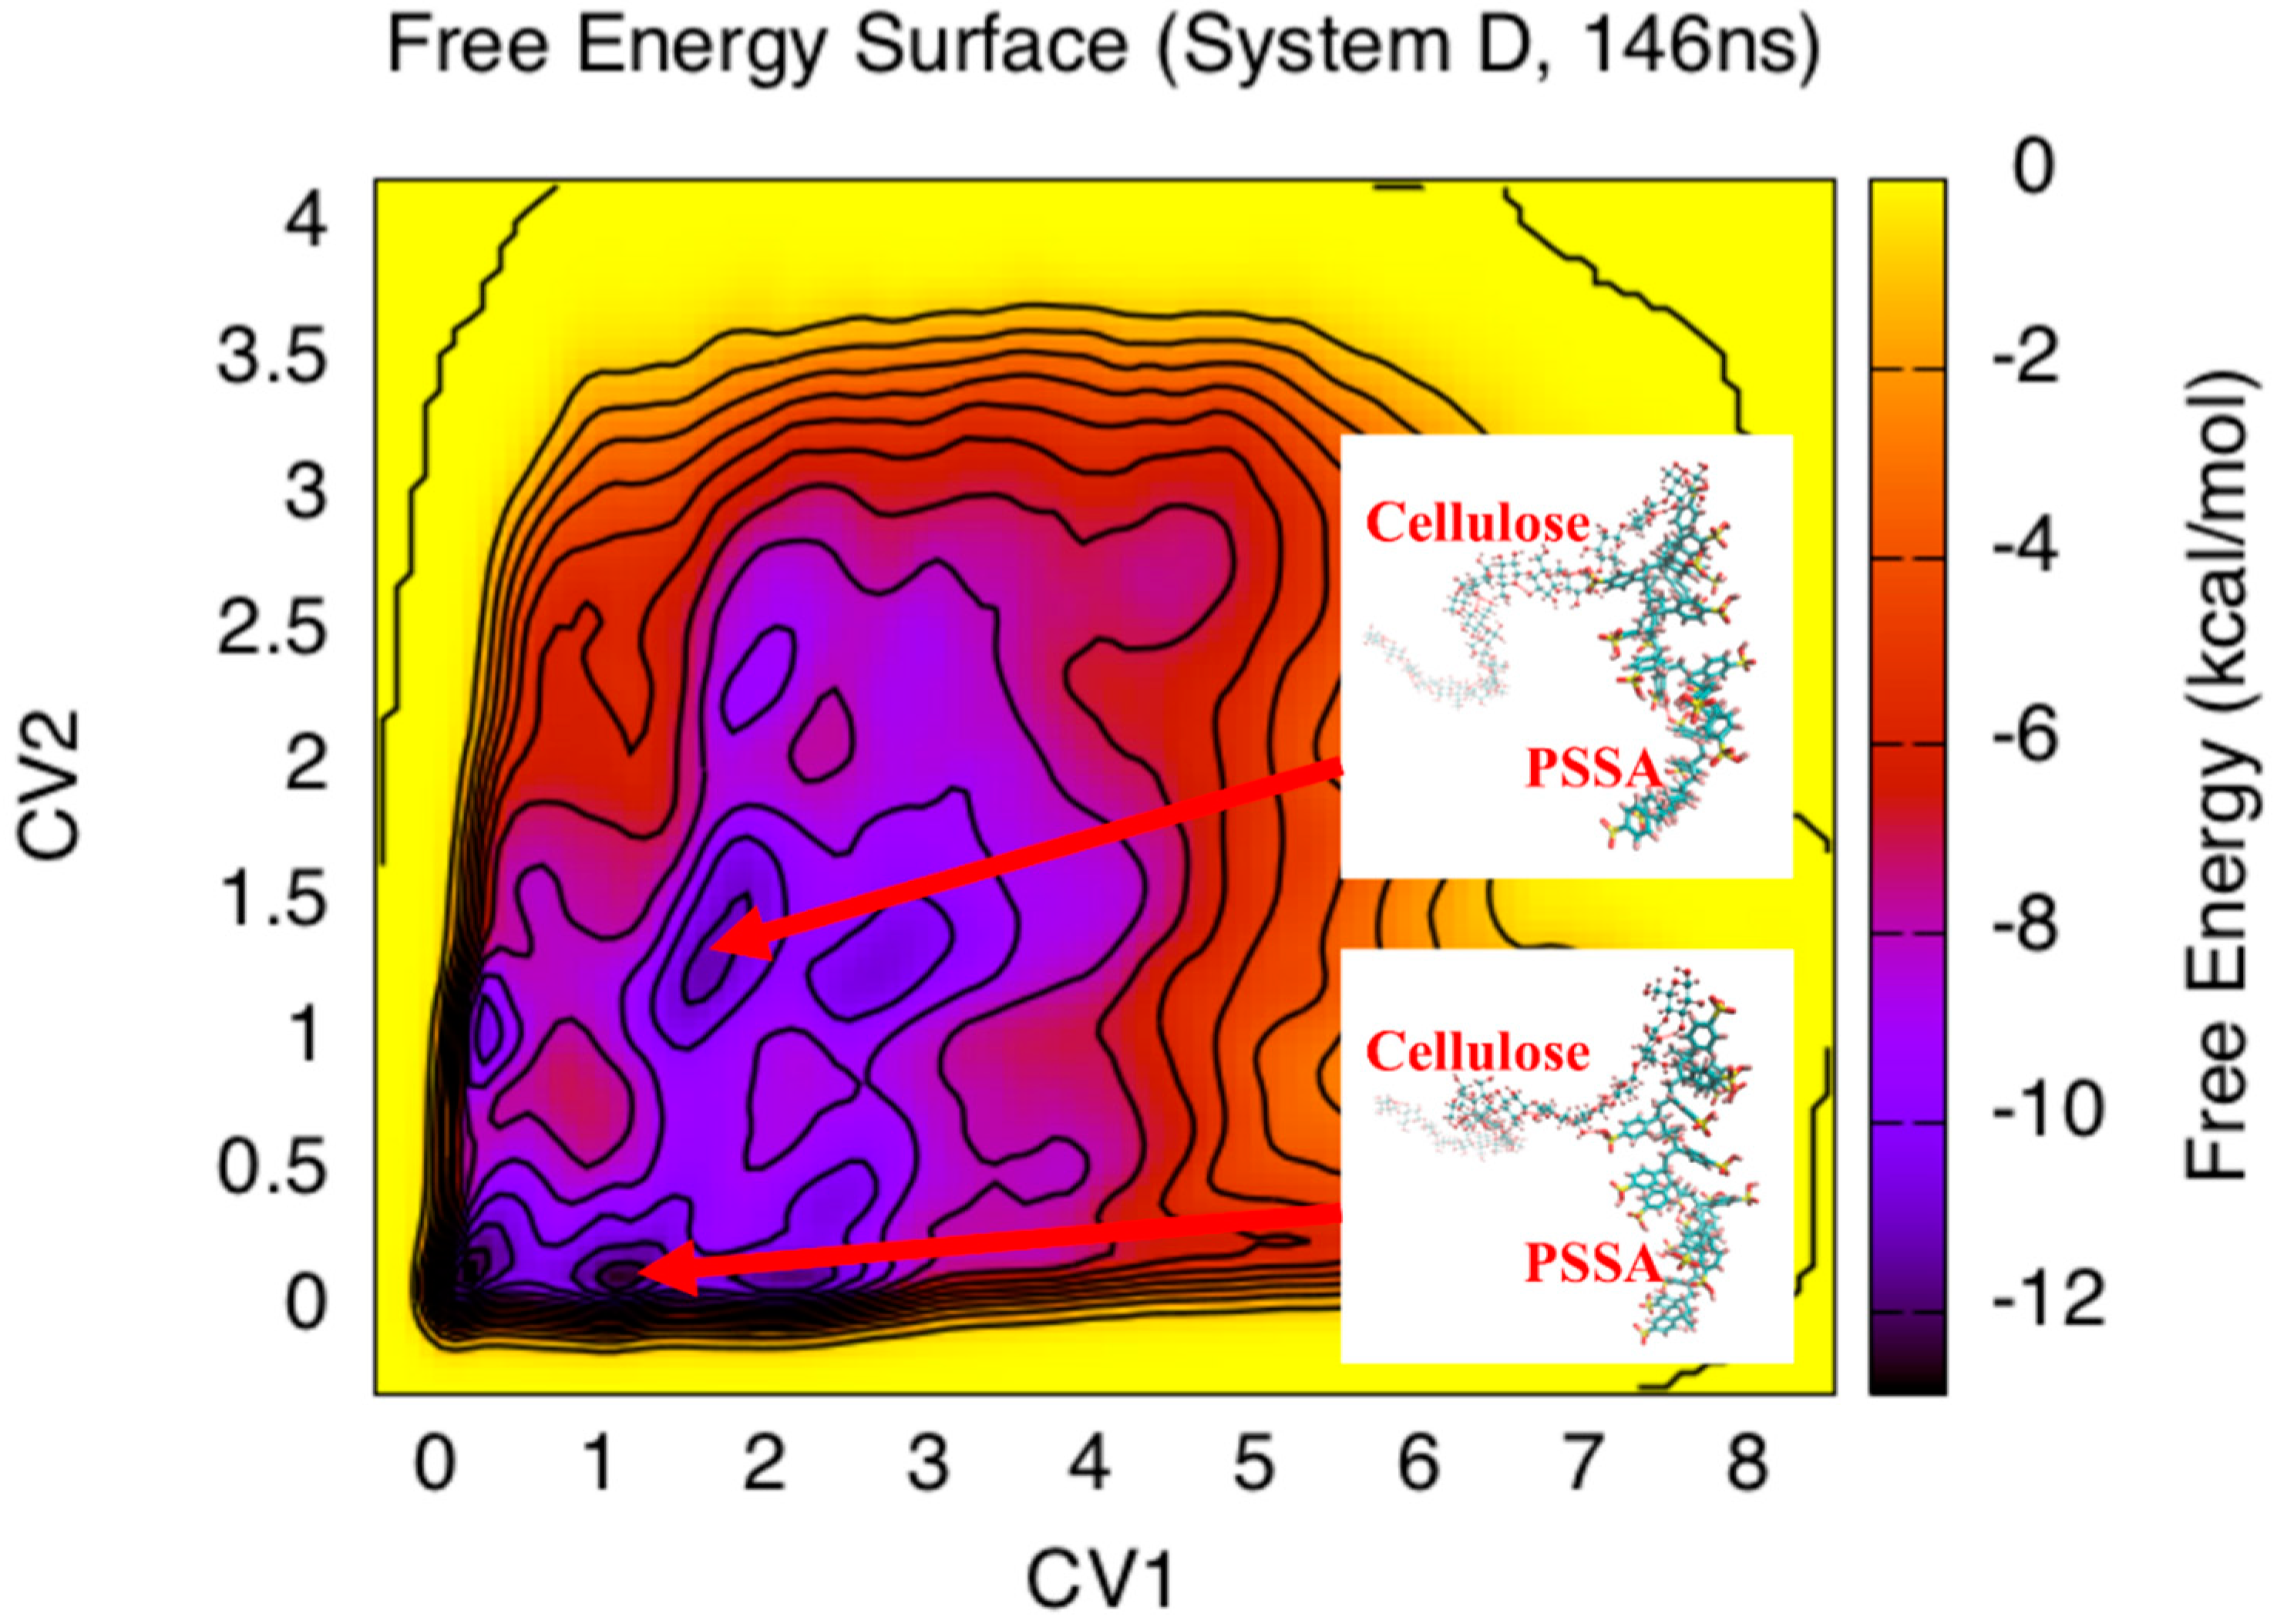
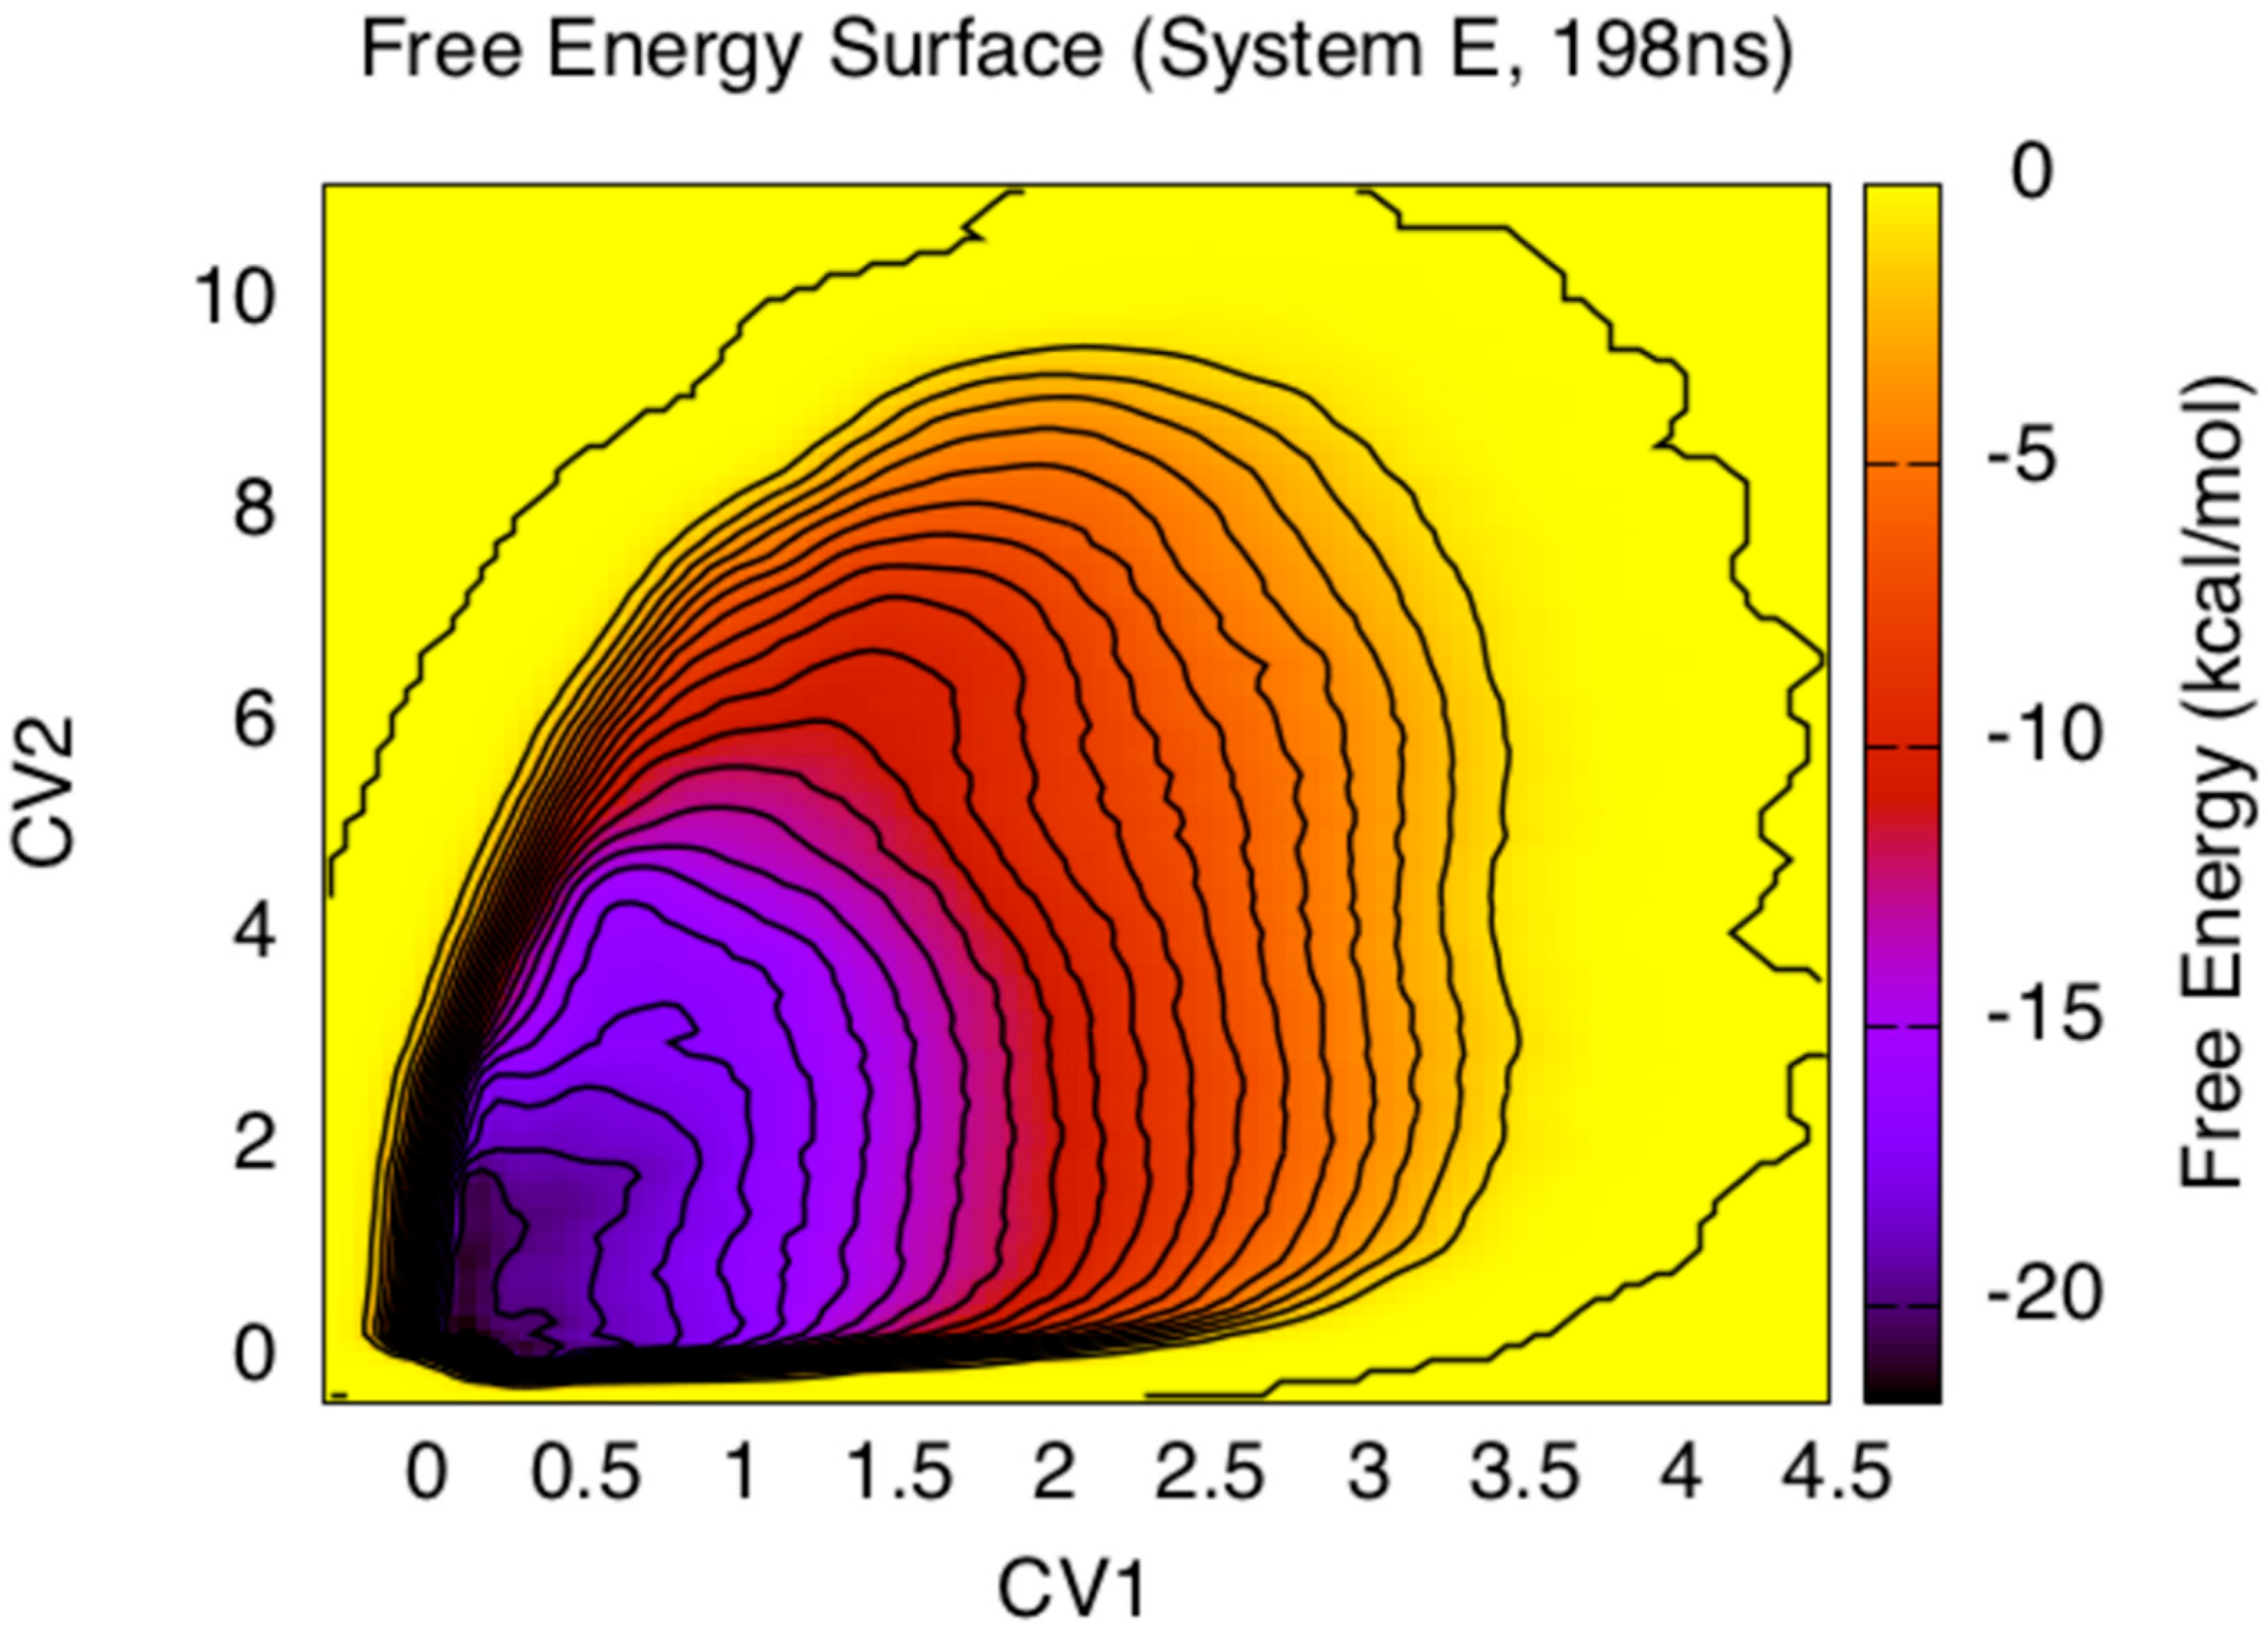
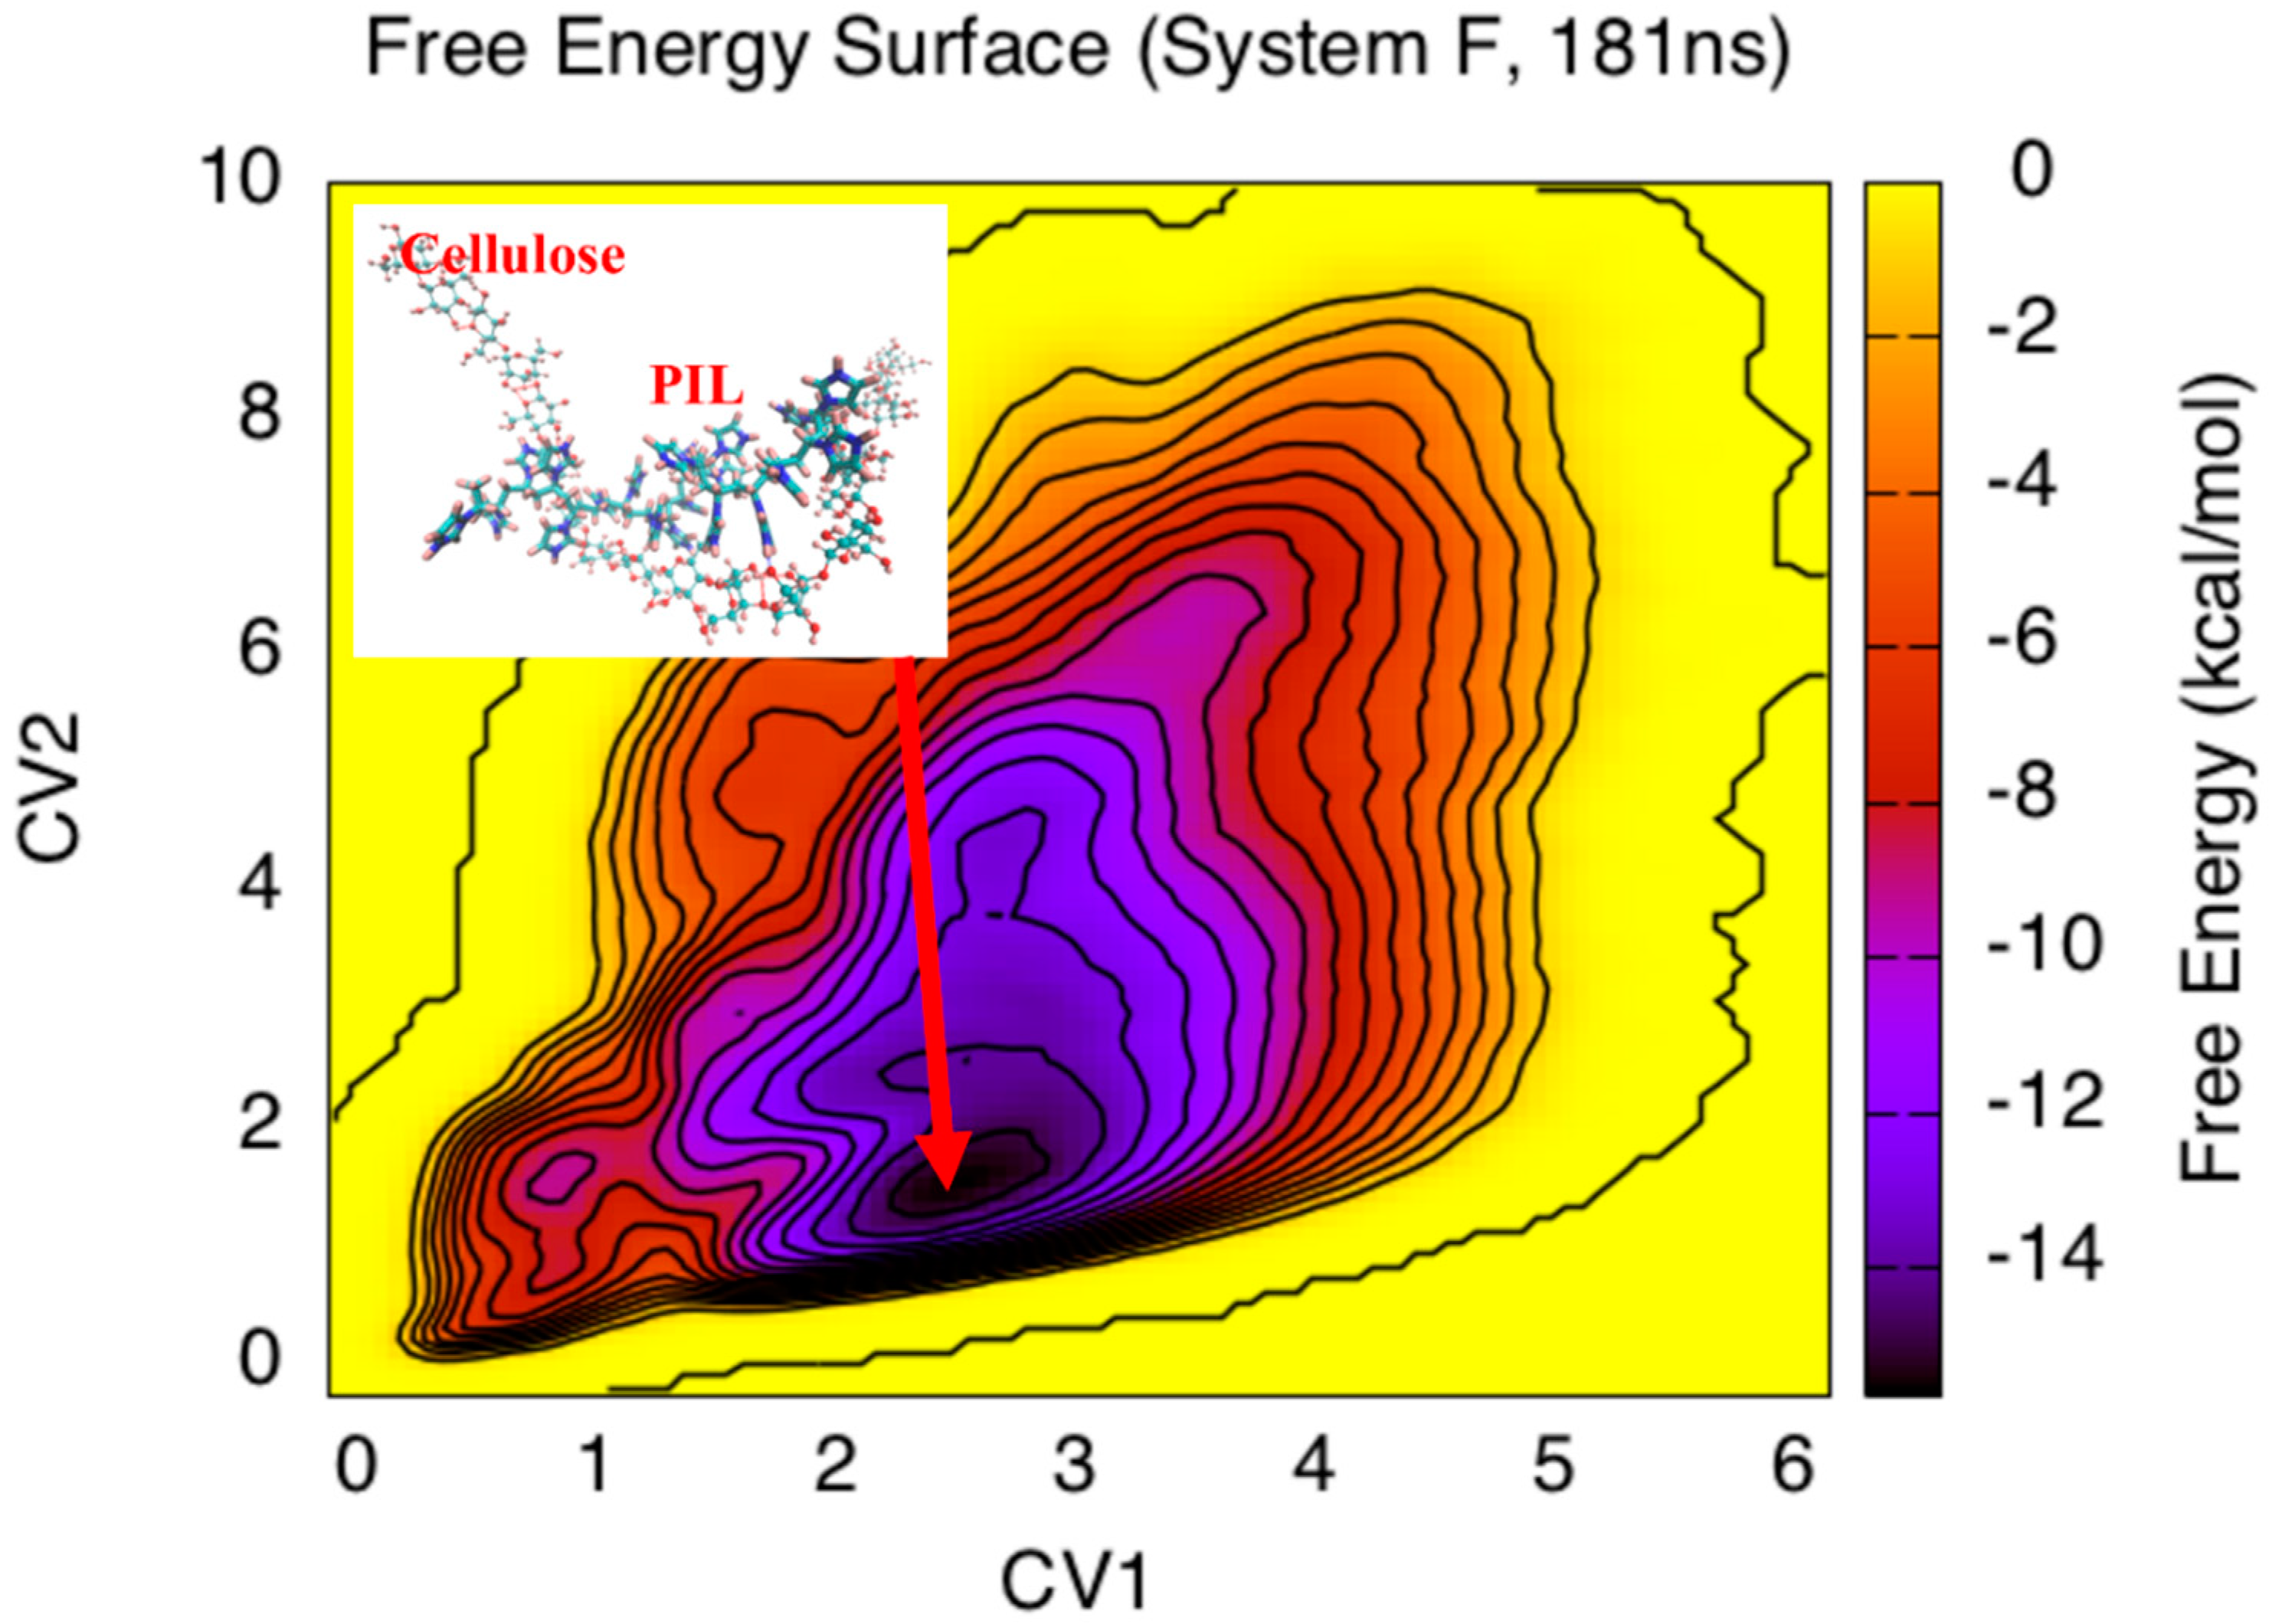
The reconstructed free energy surfaces (FES) can better demonstrate how PSSA or PIL interacts with cellulose in [EMIM]Cl and aqueous solutions. The FES were reconstructed for systems of different combinations of PSSA, PIL, and cellulose chains. The bias potentials were used to determine the FES after the hydrogen bonds started to form (CVs are larger than 0) for all the systems investigated. CV1 and CV2 describe the number of hydrogen bonds formed between the two polymer chains. The sampling of the free energy surfaces during the MD-MTD simulations was considered to be completed when the two CVs moved back and forth between different values randomly.
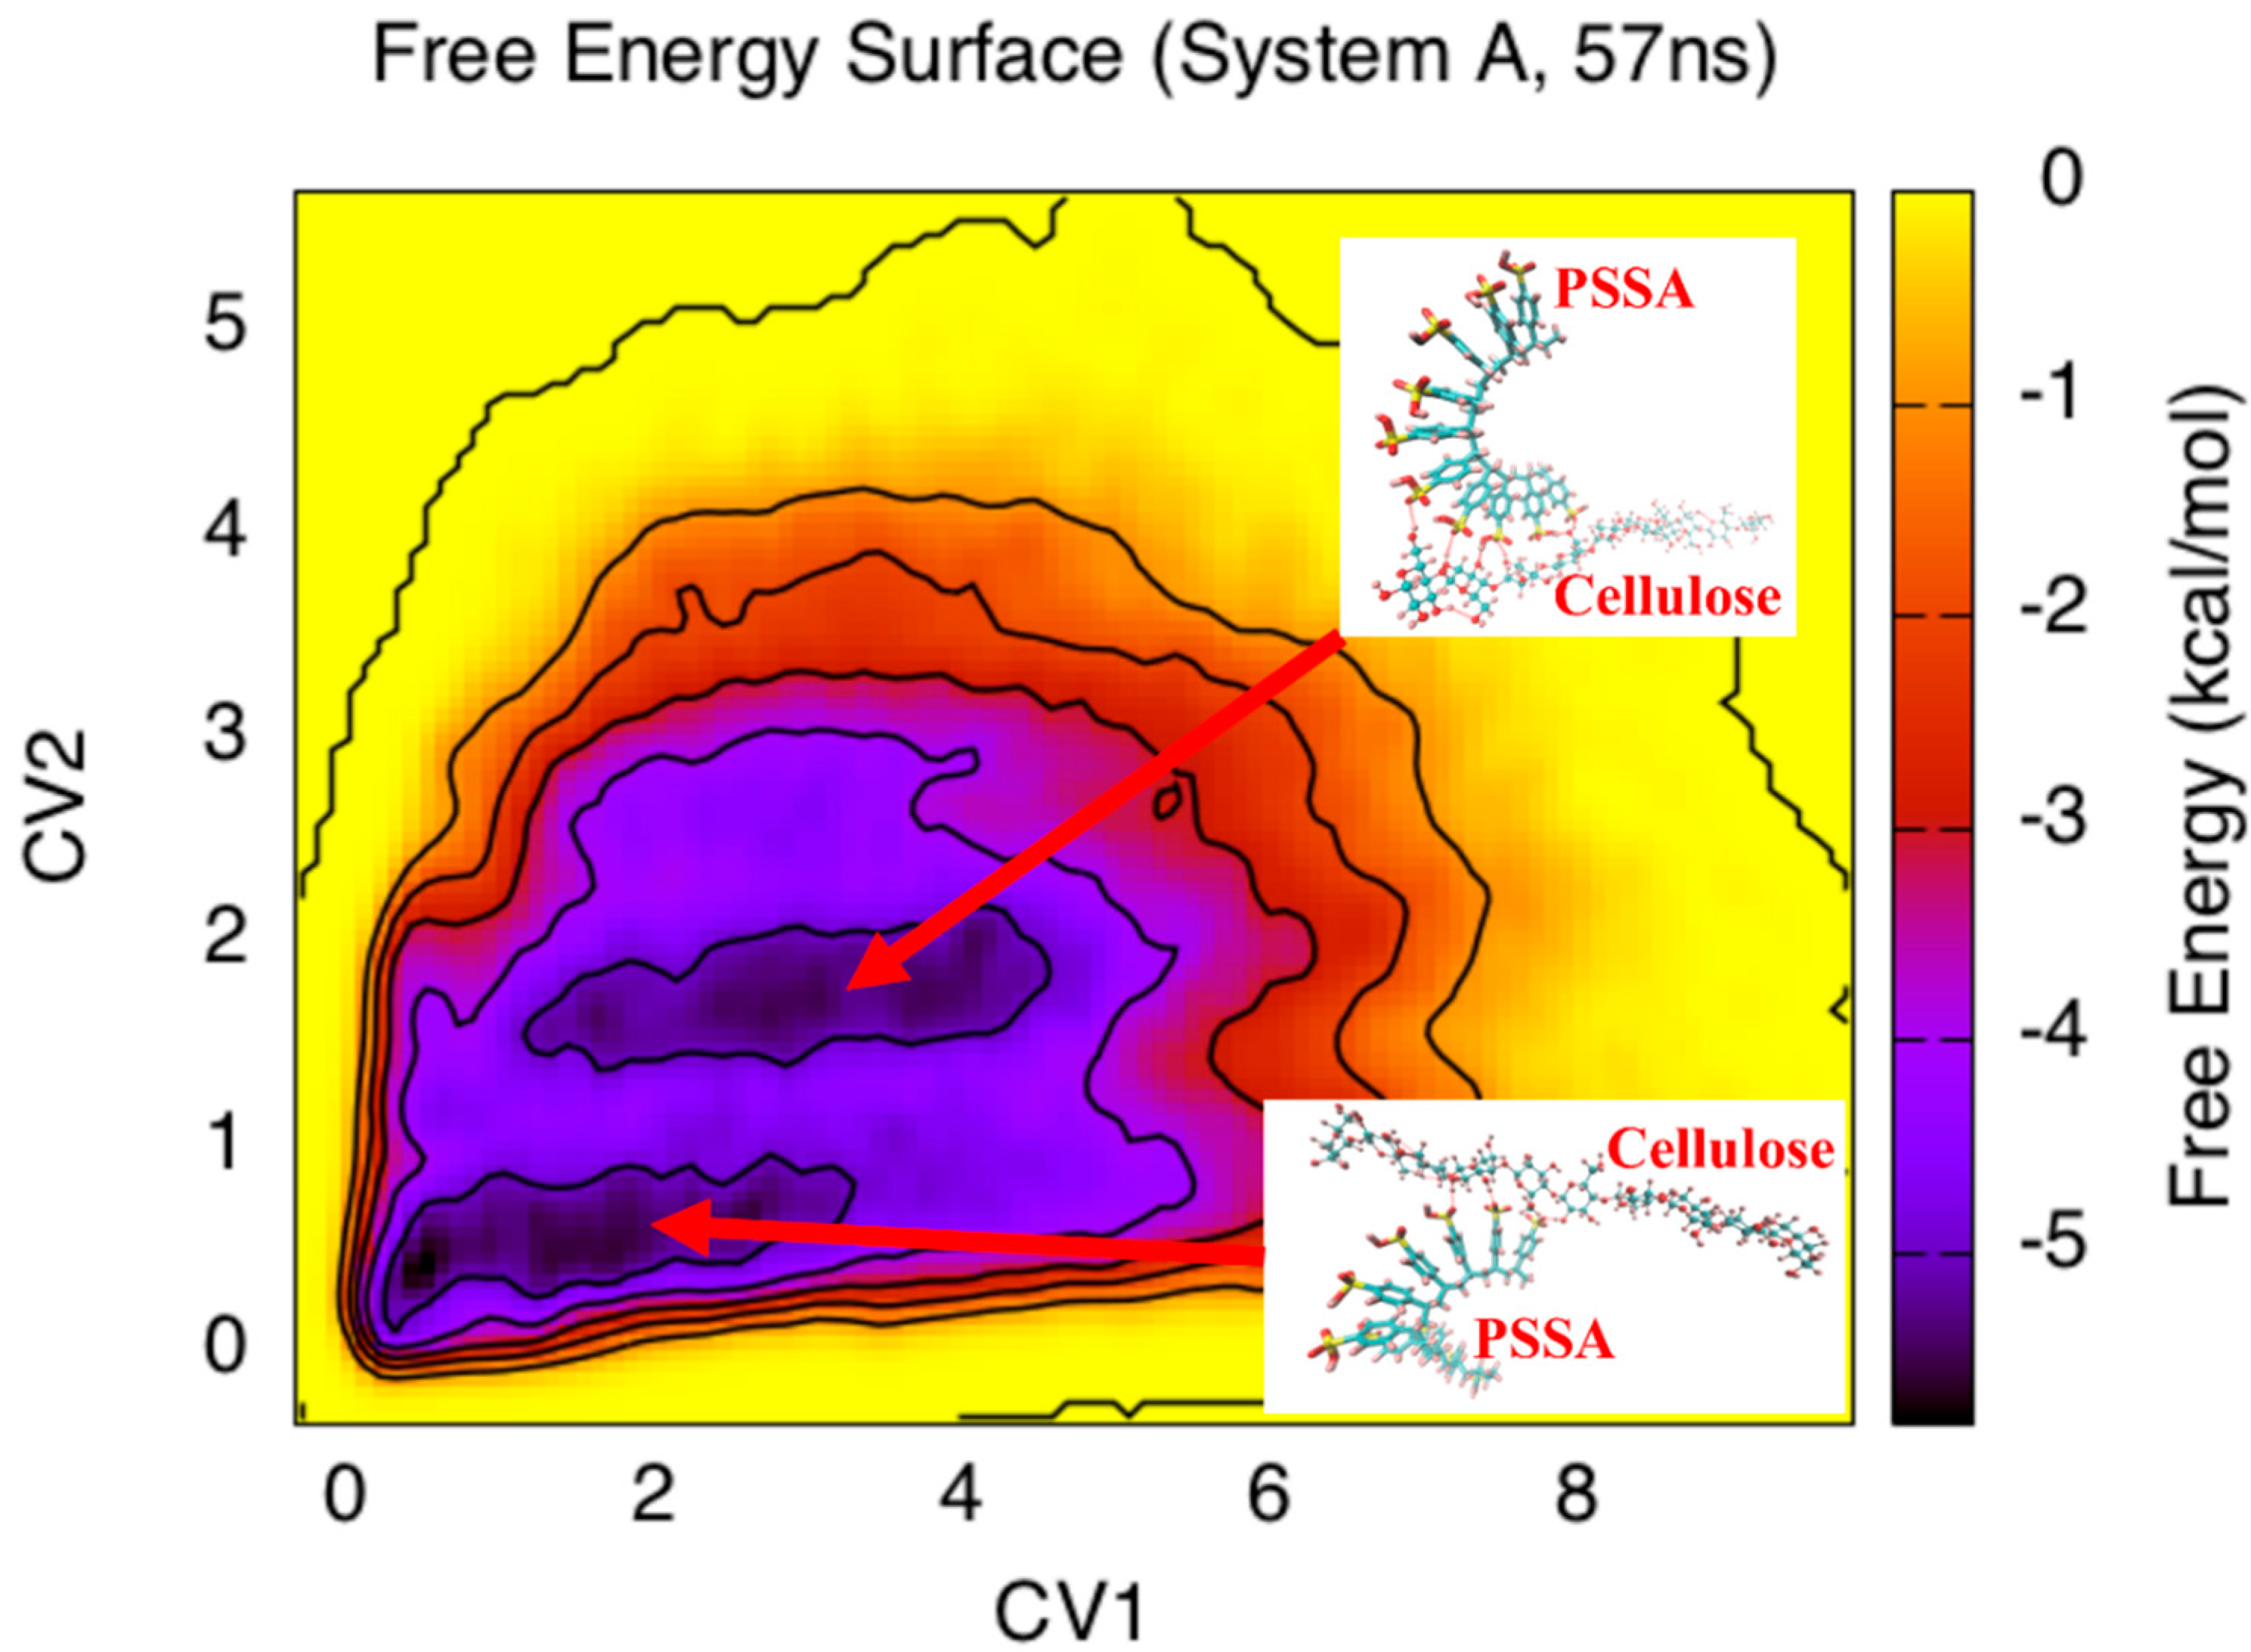
Figure 5 is the reconstructed 2D free energy contour plot for the FES of system A (DP 10 neutral PSSA and cellulose in aqueous solution). Two regions of local minima were found, with an interaction of free energies at around −5.5 kcal/mol. The first region of the interaction minimum was located at CV1 = 0.2–3.8 and CV2 = 0.3–0.8, indicating the initial intermolecular interaction between the PSSA and cellulose chains. An energy barrier of 1.5 kcal/mol needed to be overcome to reach the second region of the minimum at CV1 = 1.0–4.4 and CV2 = 1.3–1.9. It appears that partial intermolecular interactions were more stable than the completely dehydrated interactions. An additional barrier of 5.5 kcal/mol was needed to be overcome, in order to form more hydrogen bonds between the PSSA and the cellulose chains. However, this stronger PSSA–cellulose interaction state appeared not to be favorable energetically, probably due to the decrease of entropy as a result of greater constraint on the polymer chains.
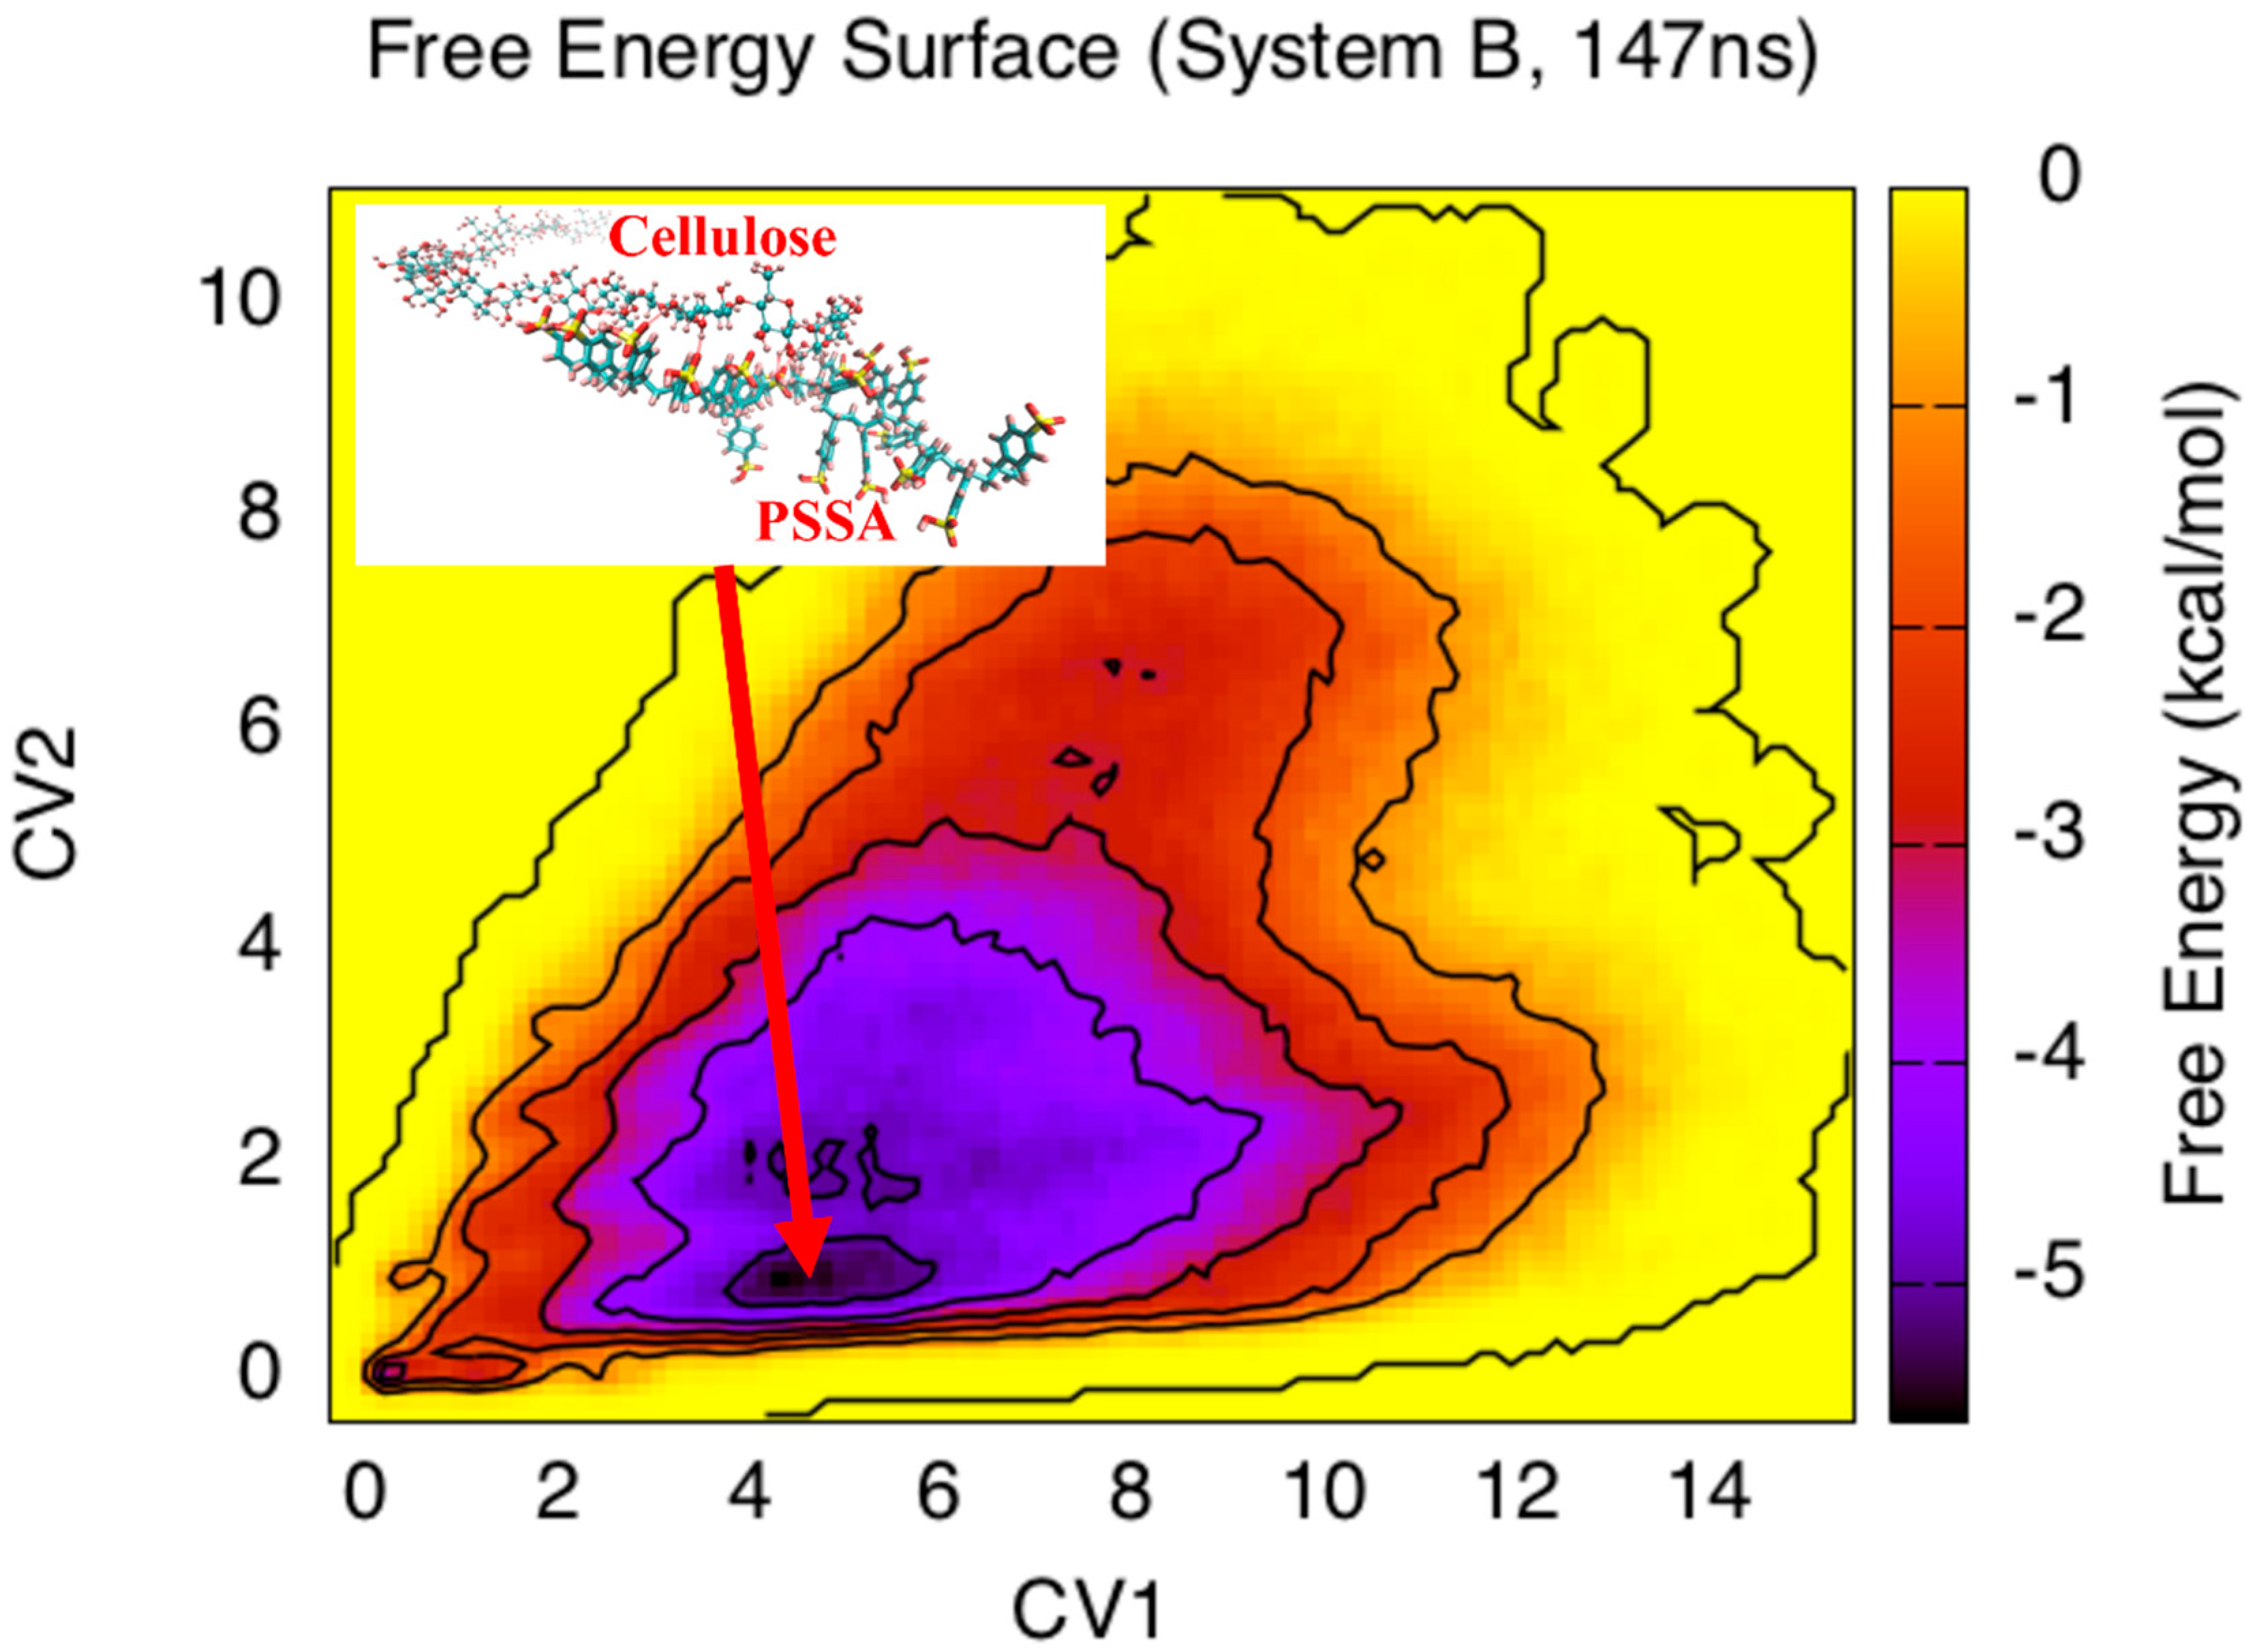
Figure 6 shows the 2D free energy contour plot for the FES of the system B (DP 20 ionized PSSA, cellulose in aqueous solution). The FES appeared to be quite different, with the doubling of polymer chain length with the values of CVs at minima being almost twice that of system A. The longer PSSA and cellulose chains formed more hydrogen bonds. The global minima were found in the region at around CV1 = 3.8–6.1 and CV2 = 0.8–1.6. Conformational analysis at the global minima showed that a small fragment of PSSA was close to cellulose, to form a partially direct contact interaction. An energy barrier of about 5.5 kcal/mol had to be overcome in order to completely remove the water molecules and to form a direct contact interaction between the two chains, similar to the situation in system A.
Figure 7 and Figure 8 show the 2D free energy contour plots for the FES reconstructed from the system C (DP 20 neutral PSSA and 20 DP cellulose in [EMIM]Cl) and D (DP 20 neutral PSSA and 20 DP cellulose in [EMIM]Cl) respectively. Experimentally, the cellulose hydrolysis in [EMIM]Cl was much more efficient and selective [34,35,36]. In [EMIM]Cl, no desolvation barrier was observed, and the PSSA chain was seen to readily form direct contacts with the cellulose chain. The free energy minima in Figure 7 and Figure 8 are for complexes when PSSA and the cellulose chains form partial direct contact. The lowest interaction free energies in the two systems are similar, at around ~−11–12 kcal/mol. This significantly enhanced interaction free energy is largely due to the [EMIM]Cl solvent used. Water molecules form strong hydrogen bonds with both cellulose and PSSA, thereby reducing the strength of the interaction between the cellulose and PSSA chains.
Figure 9 and Figure 10 show the 2-D free energy contour plots reconstructed from system E (DP 10 PIL and DP 10 cellulose chains in water) and F (DP 20 PIL and DP 20 cellulose chains in [EMIM]Cl) respectively. The free energy landscape for the system in aqueous solution had one minimum at CV1 = 0 and CV2 = 0 as seen from Figure 9. This indicates that PIL and cellulose chains are not likely to interact directly in water. In [EMIM]Cl, there is a region at CV1 = 2.0–3.0 and CV2 = 1.1–1.9 that favors the partial direct cellulose and PIL interaction, as seen in Figure 10. The lowest interaction free energy was about −15 kcal/mol.
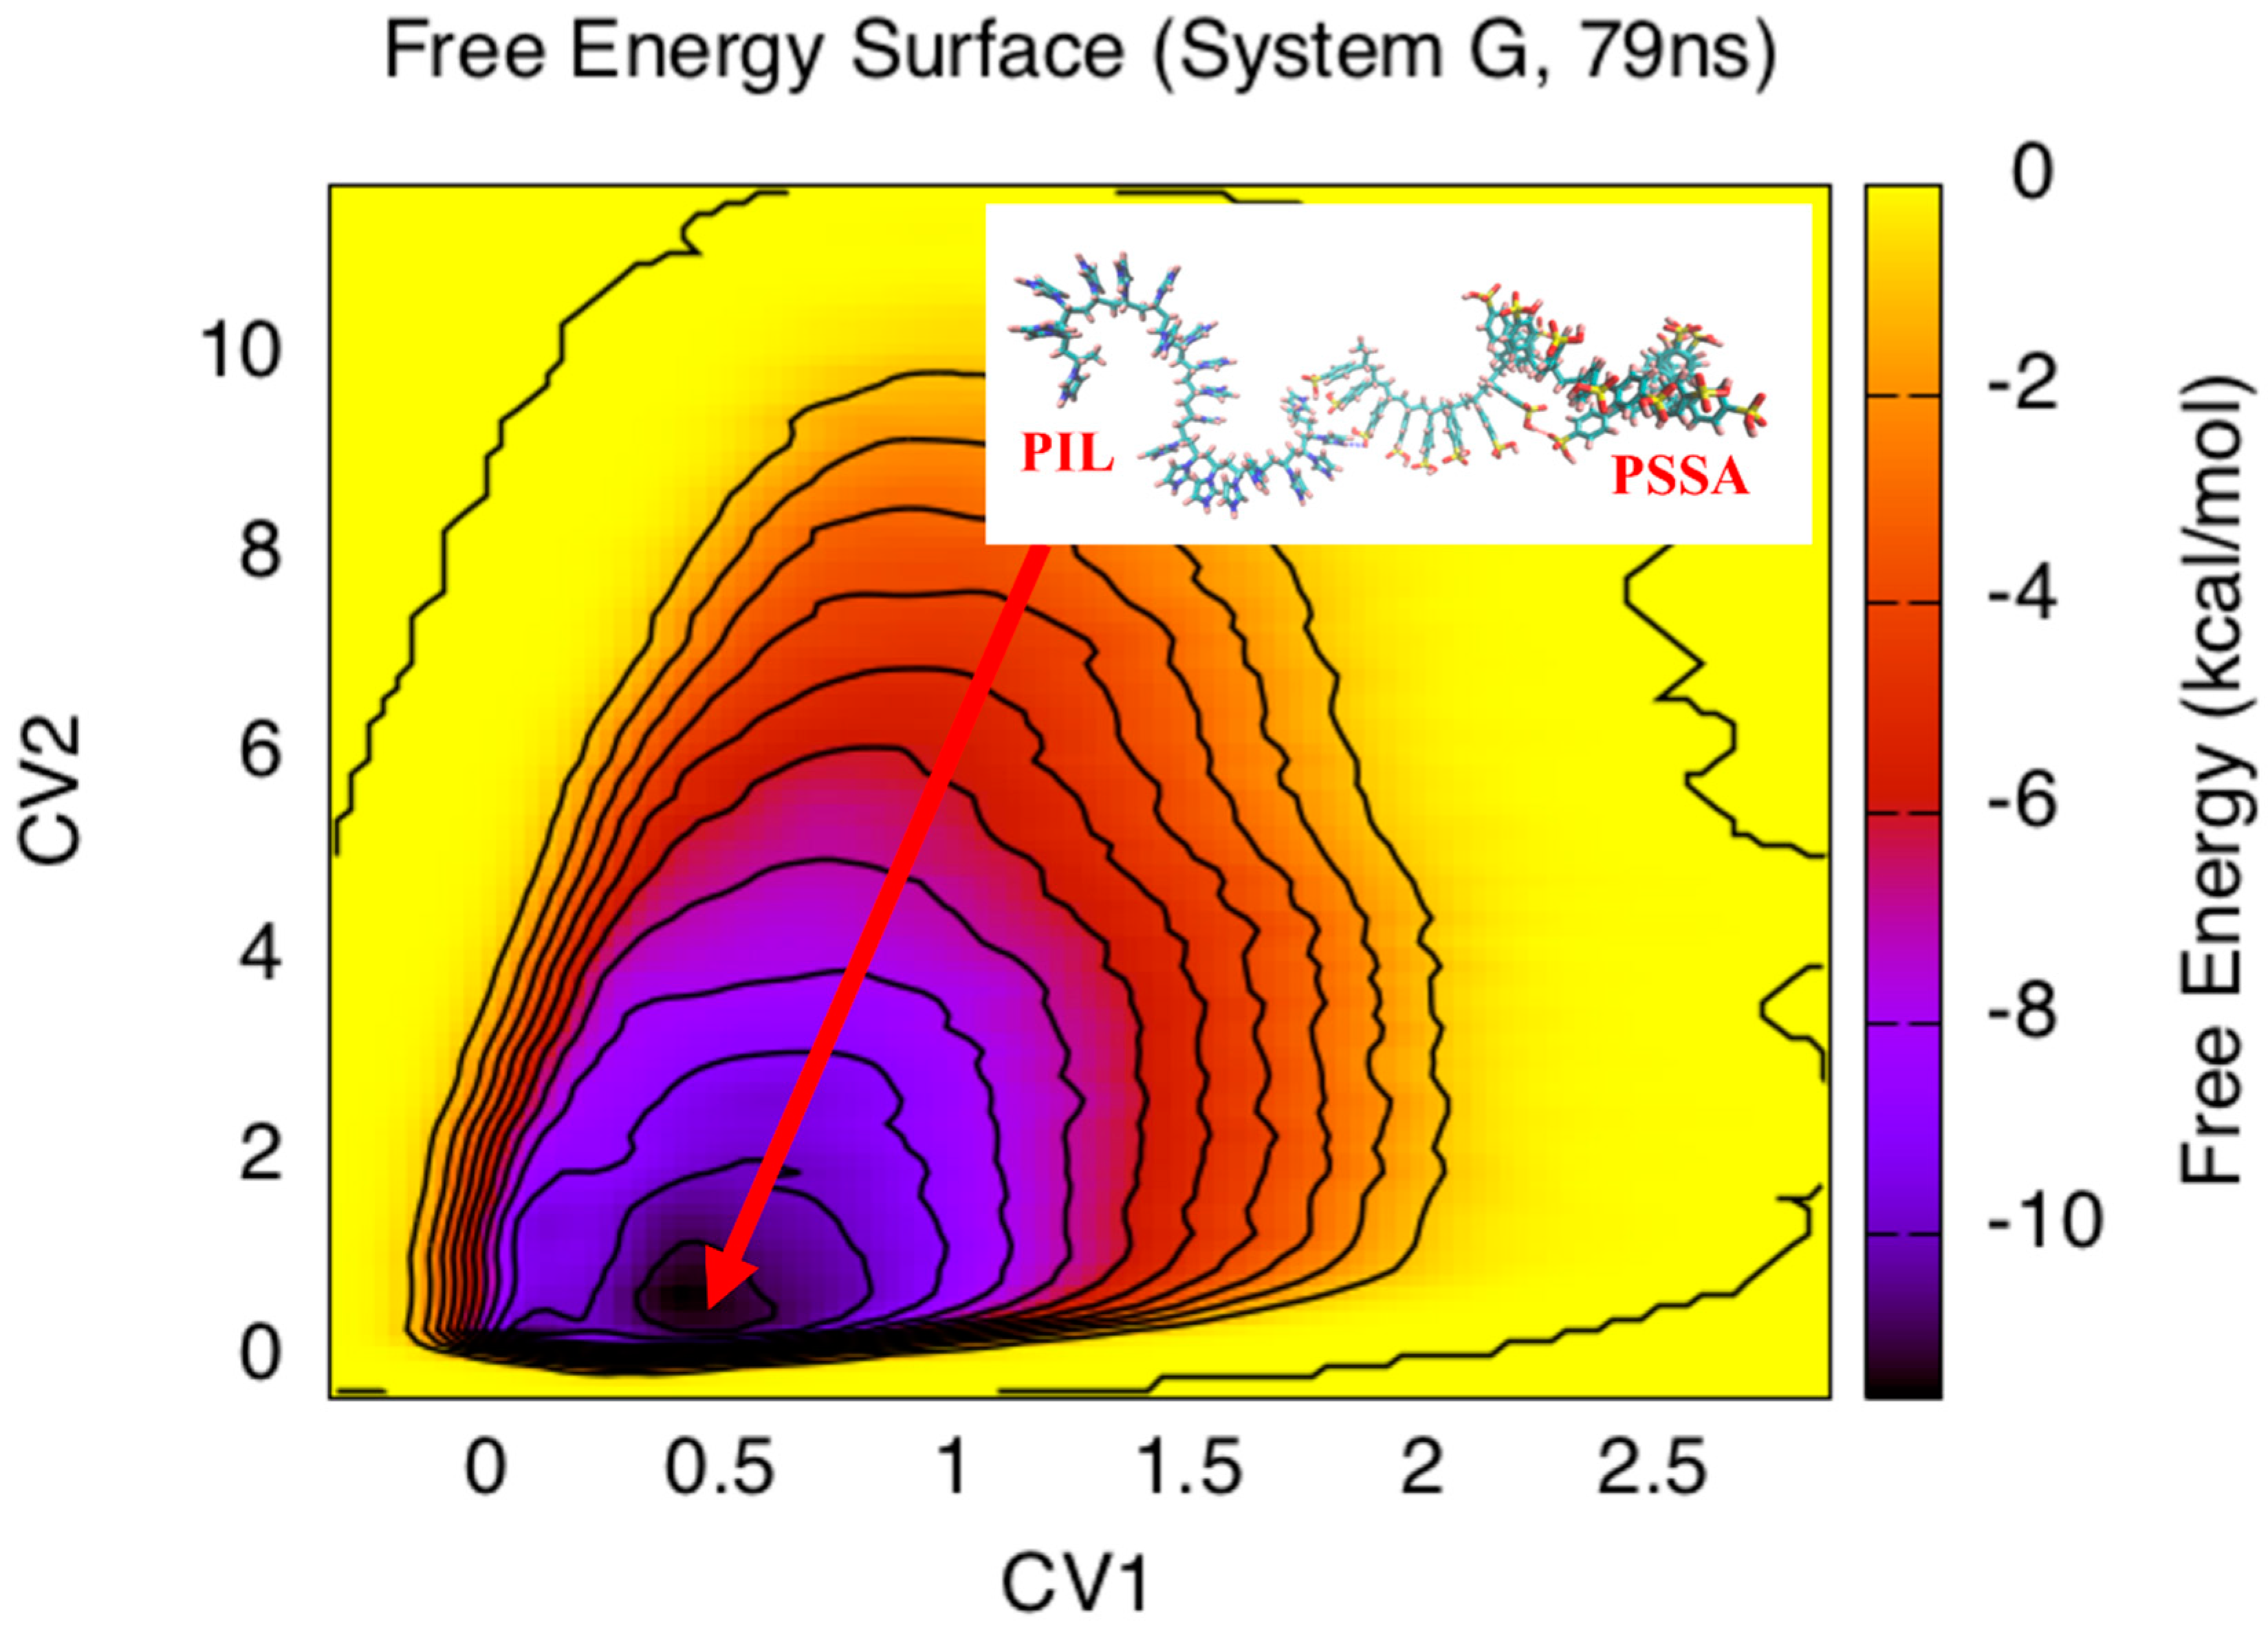
Figure 11 shows the 2-D free energy contour plot for the FES reconstructed from the system G (DP 20 PSSA and DP 20 PIL chains in water). The conformational analysis at the lowest energy region at CV1 = 0.3–0.6 and CV2 = 0–1 showed a partially dehydrated interaction between the ends of the PSSA and PIL chains. The lowest interaction free energy was about −11 kcal/mol. The FESs for PSSA–cellulose, PIL–cellulose, and PSSA–PIL interactions in aqueous and [EMIM]Cl solutions were mapped out using combined MD-MTD simulations. The conformational interactions were found to be largely affected by the solvent. In aqueous solution, the PSSA and cellulose interaction was relatively weak, leading to a slow hydrolysis reaction. In [EMIM]Cl, the PSSA and cellulose interaction was much stronger and extensive, leading to a more efficient breakdown of the cellulose chains in excellent agreement with experimental observations. Moreover, the PIL chain had a significantly stronger solvation in both water and [EMIM]Cl, compared to the PSSA and cellulose chains, which led to a more effective catalytic conversion of the cellulose in a solid PSSA/PIL catalyst–solid substrate reaction process. Moreover, the solvation free energy of the PIL chain in [EMIM]Cl was more than 10 times larger than that in water. This indicates the effectiveness of the [EMIM]Cl for cellulose hydrolysis and that the critical role that PIL plays for the catalytic conversion of cellulose, by enhancing the solubility of both the cellulose substrate and the PSSA/PIL catalyst.

4. Conclusions

Our MD-MTD simulations clearly demonstrate that the solvent plays a critical role in the cellulose hydrolysis reaction catalyzed by novel enzyme mimic polymeric PSSA/PIL catalysts. The PSSA and cellulose could form stronger hydrogen bonding interactions, thereby disrupting the hydrogen bonding network in the cellulose substrate. Moreover, the [EMIM]Cl solvent strengthens the PSSA/cellulose interaction, making the hydrolysis reaction more effective. The PIL chain in the catalyst plays a vital role in enhancing the catalytic activity of our unique polymer catalyst. The PIL chain has much stronger solvation free energies in both water and [EMIM]Cl solvents, which enhances the solubility of the PSSA chains, as well as the cellulose substrate.

Author Contributions

Conceptualization, X.Q.; Investigation, X.S. and X.Q.; Writing-Original Draft Preparation, X.S.; Writing-Review & Editing, X.Q.; Supervision, X.Q.; Project Administration, X.Q.; Funding Acquisition, X.Q.

Funding

This research was funded by United States National Science Foundation CBET 1264896.

Acknowledgments

Computations were performed at the High Performance Computing Center (HPCC) at the University of Arkansas.

Conflicts of Interest

The authors declare no conflict of interest. The funders had no role in the design of the study; in the collection, analyses, or interpretation of data; in the writing of the manuscript, and in the decision to publish the results.

References

  1. Agarwal, A.K. Biofuels (alcohols and biodiesel) applications as fuels for internal combustion engines. Prog. Energy Combust. Sci. 2007, 33, 233–271. [Google Scholar] [CrossRef]
  2. Greene, N.; Celik, F.E.; Dale, B.; Jackson, M.; Jayawardhana, K.; Jin, H.; Larson, E.D.; Laser, M.; Lynd, L.; MacKenzie, D. Growing Energy. How Biofuels Can Help End America’s Oil Dependence; Natural Resources Defense Council: New York, NY, USA, 2004. [Google Scholar]
  3. Guo, M.; Song, W.; Buhain, J. Bioenergy and biofuels: History, status, and perspective. Renew. Sustain. Energy Rev. 2015, 42, 712–725. [Google Scholar] [CrossRef]
  4. Ho, D.P.; Ngo, H.H.; Guo, W. A mini review on renewable sources for biofuel. Bioresour. Technol. 2014, 169, 742–749. [Google Scholar] [CrossRef] [PubMed] [Green Version]
  5. Liew, W.H.; Hassim, M.H.; Ng, D.K.S. Review of evolution, technology and sustainability assessments of biofuel production. J. Clean. Prod. 2014, 71, 11–29. [Google Scholar] [CrossRef]
  6. Naik, S.N.; Goud, V.V.; Rout, P.K.; Dalai, A.K. Production of first and second generation biofuels: A comprehensive review. Renew. Sustain. Energy Rev. 2010, 14, 578–597. [Google Scholar] [CrossRef]
  7. Dragone, G.; Fernandes, B.D.; Vicente, A.A.; Teixeira, J.A. Third generation biofuels from microalgae. Curr. Res. Technol. Educ. Top. Appl. Microbiol. Microb. Biotechnol. 2010, 2, 1355–1366. [Google Scholar]
  8. Agbor, V.B.; Cicek, N.; Sparling, R.; Berlin, A.; Levin, D.B. Biomass pretreatment: Fundamentals toward application. Biotechnol. Adv. 2011, 29, 675–685. [Google Scholar] [CrossRef] [PubMed]
  9. Bajpai, P. Summary of Biomass Pretreatment Methods, Pretreatment of Lignocellulosic Biomass for Biofuel Production; Springer: Singapore, 2016; pp. 71–75. [Google Scholar]
  10. Kumar, A.K.; Sharma, S. Recent updates on different methods of pretreatment of lignocellulosic feedstocks: A review. Bioresour. Bioprocess. 2017, 4, 7. [Google Scholar] [CrossRef] [PubMed]
  11. Kumar, P.; Barrett, D.M.; Delwiche, M.J.; Stroeve, P. Methods for Pretreatment of Lignocellulosic Biomass for Efficient Hydrolysis and Biofuel Production. Ind. Eng. Chem. Res. 2009, 48, 3713–3729. [Google Scholar] [CrossRef]
  12. Harris, E.E.; Kline, A.A. Hydrolysis of Wood Cellulose with Hydrochloric Acid and Sulfur Dioxide and the Decomposition of its Hydrolytic Products. J. Phys. Chem. 1949, 53, 344–351. [Google Scholar] [CrossRef]
  13. Segal, L.; Nelson, M.L. The Effect of Aqueous Hydrochloric Acid on the Cotton Cellulose III Lattice and Its Implications Concerning the Determinations of Crystallinity and Leveling-off Degree of Polymerization 2. J. Am. Chem. Soc. 1954, 76, 4626–4630. [Google Scholar] [CrossRef]
  14. Lin, J.-H.; Chang, Y.-H.; Hsu, Y.-H. Degradation of cotton cellulose treated with hydrochloric acid either in water or in ethanol. Food Hydrocoll. 2009, 23, 1548–1553. [Google Scholar] [CrossRef]
  15. Béguin, P.; Aubert, J.-P. The biological degradation of cellulose. FEMS Microbiol. Rev. 1994, 13, 25–58. [Google Scholar] [CrossRef] [PubMed]
  16. Sun, Y.; Cheng, J. Hydrolysis of lignocellulosic materials for ethanol production: A review. Bioresour. Technol. 2002, 83, 1–11. [Google Scholar] [CrossRef]
  17. Lee, J. Biological conversion of lignocellulosic biomass to ethanol. J. Biotechnol. 1997, 56, 1–24. [Google Scholar] [CrossRef]
  18. Vital de Oliveira, O. Molecular Dynamics and Metadynamics Simulations of the Cellulase Cel48F. Enzyme Res. 2014, 2014, 692738. [Google Scholar] [CrossRef] [PubMed]
  19. Zhang, H.; Zhang, J.-L.; Sun, L.; Niu, X.-D.; Wang, S.; Shan, Y.-M. Molecular dynamics simulation of the processive endocellulase Cel48F from Clostridium cellulolyticum: A novel “water-control mechanism” in enzymatic hydrolysis of cellulose. J. Mol. Recognit. JMR 2014, 27, 438–447. [Google Scholar] [CrossRef] [PubMed]
  20. Lian, P.; Guo, H.-B.; Smith, J.C.; Wei, D.-Q.; Guo, H. Catalytic mechanism and origin of high activity of cellulase TmCel12A at high temperature: A quantum mechanical/molecular mechanical study. Cellulose 2013, 21, 937–949. [Google Scholar] [CrossRef]
  21. Alekozai, E.M.; GhattyVenkataKrishna, P.K.; Uberbacher, E.C.; Crowley, M.F.; Smith, J.C.; Cheng, X. Simulation analysis of the cellulase Cel7A carbohydrate binding module on the surface of the cellulose Iβ. Cellulose 2013, 21, 951–971. [Google Scholar] [CrossRef]
  22. Qian, X.; Nimlos, M.R.; Davis, M.; Johnson, D.K.; Himmel, M.E. Ab initio molecular dynamics simulations of β-d-glucose and β-d-xylose degradation mechanisms in acidic aqueous solution. Carbohydr. Res. 2005, 340, 2319–2327. [Google Scholar] [CrossRef] [PubMed]
  23. Qian, X.; Nimlos, M.R.; Johnson, D.K.; Himmel, M.E. Acidic Sugar Degradation Pathways, Twenty-Sixth Symposium on Biotechnology for Fuels and Chemicals; Humana Press: New York, NY, USA, 2005; pp. 989–997. [Google Scholar]
  24. Dong, H.; Nimlos, M.R.; Himmel, M.E.; Johnson, D.K.; Qian, X. The Effects of Water on β-d-Xylose Condensation Reactions. J. Phys. Chem. A 2009, 113, 8577–8585. [Google Scholar] [CrossRef] [PubMed]
  25. Liu, D.; Nimlos, M.R.; Johnson, D.K.; Himmel, M.E.; Qian, X. Free Energy Landscape for Glucose Condensation Reactions. J. Phys. Chem. A 2010, 114, 12936–12944. [Google Scholar] [CrossRef] [PubMed]
  26. Qian, X.; Johnson, D.K.; Himmel, M.E.; Nimlos, M.R. The role of hydrogen-bonding interactions in acidic sugar reaction pathways. Carbohydr. Res. 2010, 345, 1945–1951. [Google Scholar] [CrossRef] [PubMed]
  27. Qian, X. Mechanisms and Energetics for Acid Catalyzed β-d-Glucose Conversion to 5-Hydroxymethylfurfurl. J. Phys. Chem. A 2011, 115, 11740–11748. [Google Scholar] [CrossRef] [PubMed]
  28. Qian, X. Mechanisms and Energetics for Brønsted Acid-Catalyzed Glucose Condensation, Dehydration and Isomerization Reactions. Top. Catal. 2012, 55, 218–226. [Google Scholar] [CrossRef]
  29. Qian, X.; Wei, X. Glucose Isomerization to Fructose from ab Initio Molecular Dynamics Simulations. J. Phys. Chem. B 2012, 116, 10898–10904. [Google Scholar] [CrossRef] [PubMed]
  30. Qian, X. Free Energy Surface for Brønsted Acid-Catalyzed Glucose Ring-Opening in Aqueous Solution. J. Phys. Chem. B 2013, 117, 11460–11465. [Google Scholar] [CrossRef] [PubMed]
  31. Qian, X.; Liu, D. Free energy landscape for glucose condensation and dehydration reactions in dimethyl sulfoxide and the effects of solvent. Carbohydr. Res. 2014, 388, 50–60. [Google Scholar] [CrossRef] [PubMed]
  32. Breslow, R. Biomimetic Chemistry and Artificial Enzymes: Catalysis by Design. Acc. Chem. Res. 1995, 28, 146–153. [Google Scholar] [CrossRef]
  33. Simmons, T.R.; Berggren, G.; Bacchi, M.; Fontecave, M.; Artero, V. Mimicking hydrogenases: From biomimetics to artificial enzymes. Coord. Chem. Rev. 2014, 270–271, 127–150. [Google Scholar] [CrossRef]
  34. Qian, X.; Lei, J.; Wickramasinghe, S.R. Novel polymeric solid acid catalysts for cellulose hydrolysis. RSC Adv. 2013, 3, 24280–24287. [Google Scholar] [CrossRef]
  35. Vu, A.; Wickramasinghe, S.R.; Qian, X. Polymeric Solid Acid Catalysts for Lignocellulosic Biomass Fractionation. Ind. Eng. Chem. Res. 2018, 57, 4514–4525. [Google Scholar] [CrossRef]
  36. Qi, B.; Vu, A.; Wickramasinghe, S.R.; Qian, X. Glucose production from lignocellulosic biomass using a membrane-based polymeric solid acid catalyst. Biomass Bioenergy 2018, 117, 137–145. [Google Scholar] [CrossRef]
  37. Laio, A.; Parrinello, M. Escaping free-energy minima. PNAS 2002, 99, 12562–12566. [Google Scholar] [CrossRef] [PubMed] [Green Version]
  38. Barducci, A.; Bussi, G.; Parrinello, M. Well-Tempered Metadynamics: A Smoothly Converging and Tunable Free-Energy Method. Phys. Rev. Lett. 2008, 100, 020603. [Google Scholar] [CrossRef] [PubMed]
  39. Ensing, B.; de Vivo, M.; Liu, Z.; Moore, P.; Klein, M.L. Metadynamics as a Tool for Exploring Free Energy Landscapes of Chemical Reactions. Acc. Chem. Res. 2006, 39, 73–81. [Google Scholar] [CrossRef] [PubMed]
  40. Barducci, A.; Bonomi, M.; Parrinello, M. Metadynamics. WIREs Comput. Mol. Sci. 2011, 1, 826–843. [Google Scholar] [CrossRef] [Green Version]
  41. Lopes, J.N.C.; Deschamps, J.; Pádua, A.A.H. Modeling Ionic Liquids Using a Systematic All-Atom Force Field. J. Phys. Chem. B 2004, 108, 2038–2047. [Google Scholar] [CrossRef]
  42. Sunda, A.P.; Venkatnathan, A. Molecular dynamics simulations of triflic acid and triflate ion/water mixtures: A proton conducting electrolytic component in fuel cells. J. Comput. Chem. 2011, 32, 3319–3328. [Google Scholar] [CrossRef] [PubMed]
  43. Dommert, F.; Holm, C. Refining classical force fields for ionic liquids: Theory and application to [MMIM][Cl]. Phys. Chem. Chem. Phys. 2013, 15, 2037–2049. [Google Scholar] [CrossRef] [PubMed]
  44. Dommert, F.; Wendler, K.; Qiao, B.; Site, L.D.; Holm, C. Generic force fields for ionic liquids. J. Mol. Liquids 2014, 192, 34–37. [Google Scholar] [CrossRef]
  45. Jorgensen, W.L.; Maxwell, D.S.; Tirado-Rives, J. Development and Testing of the OPLS All-Atom Force Field on Conformational Energetics and Properties of Organic Liquids. J. Am. Chem. Soc. 1996, 118, 11225–11236. [Google Scholar] [CrossRef] [Green Version]
  46. Frisch, M.J.; Trucks, G.W.; Schlegel, H.B.; Scuseria, G.E.; Robb, M.A.; Cheeseman, J.R.; Scalmani, G.; Barone, V.; Mennucci, B.; Petersson, G.A.H.; et al. Fox, Gaussian 09; Gaussian, Inc.: Wallingford, CT, USA, 2009. [Google Scholar]
  47. Singh, U.C.; Kollman, P.A. An approach to computing electrostatic charges for molecules. J. Comput. Chem. 1984, 5, 129–145. [Google Scholar] [CrossRef]
  48. Bayly, C.I.; Cieplak, P.; Cornell, W.; Kollman, P.A. A well-behaved electrostatic potential based method using charge restraints for deriving atomic charges: The RESP model. J. Phys. Chem. 1993, 97, 10269–10280. [Google Scholar] [CrossRef]
  49. Cornell, W.D.; Cieplak, P.; Bayly, C.I.; Kollmann, P.A. Application of RESP charges to calculate conformational energies, hydrogen bond energies, and free energies of solvation. J. Am. Chem. Soc. 1993, 115, 9620–9631. [Google Scholar] [CrossRef]
  50. Cieplak, P.; Cornell, W.D.; Bayly, C.; Kollman, P.A. Application of the multimolecule and multiconformational RESP methodology to biopolymers: Charge derivation for DNA, RNA, and proteins. J. Comput. Chem. 1995, 16, 1357–1377. [Google Scholar] [CrossRef]
  51. Fox, T.; Kollman, P.A. Application of the RESP Methodology in the Parametrization of Organic Solvents. J. Phys. Chem. B 1998, 102, 8070–8079. [Google Scholar] [CrossRef]
  52. Sun, X. Structure and Property of Polymers and Biopolymers from Molecular Dynamic Simulations; University of Arkansas: Fayetteville, AR, USA, 2018. [Google Scholar]
  53. Case, D.; Darden, T.A.; Cheatham, T.E.; Simmerling, C.; Wang, J.; Duke, R.; Luo, R.; Crowley, M.; Walker, R.; Zhang, W.; et al. Amber 11; University of California, San Francisco: San Francisco, CA, USA, 2010. [Google Scholar]
  54. Bonomi, M.; Branduardi, D.; Bussi, G.; Camilloni, C.; Provasi, D.; Raiteri, P.; Donadio, D.; Marinelli, F.; Pietrucci, F.; Broglia, R.A.; et al. PLUMED: A portable plugin for free-energy calculations with molecular dynamics. Comput. Phys. Commun. 2009, 180, 1961–1972. [Google Scholar] [CrossRef] [Green Version]
  55. Wang, J.; Wang, W.; Kollman, P.A.; Case, D.A. Automatic atom type and bond type perception in molecular mechanical calculations. J. Mol. Graph. Model. 2006, 25, 247–260. [Google Scholar] [CrossRef] [PubMed]
  56. Kirschner, K.N.; Yongye, A.B.; Tschampel, S.M.; González-Outeiriño, J.; Daniels, C.R.; Foley, B.L.; Woods, R.J. GLYCAM06: A generalizable biomolecular force field. Carbohydrates. J. Comput. Chem. 2008, 29, 622–655. [Google Scholar] [CrossRef] [PubMed]
  57. Jorgensen, W.L.; Chandrasekhar, J.; Madura, J.D.; Impey, R.W.; Klein, M.L. Comparison of simple potential functions for simulating liquid water. J. Chem. Phys. 1983, 79, 926–935. [Google Scholar] [CrossRef]
  58. Chandrasekhar, S. Stochastic Problems in Physics and Astronomy. Rev. Mod. Phys. 1943, 15, 1–89. [Google Scholar] [CrossRef]
  59. Joung, I.S. Cheatham, Determination of Alkali and Halide Monovalent Ion Parameters for Use in Explicitly Solvated Biomolecular Simulations. J. Phys. Chem. B 2008, 112, 9020–9041. [Google Scholar] [CrossRef] [PubMed]
  60. Kirkwood, J.G. Statistical Mechanics of Fluid Mixtures. J. Chem. Phys. 1935, 3, 300–313. [Google Scholar] [CrossRef]
  61. Binder, J.B.; Raines, R.T. Fermentable sugars by chemical hydrolysis of biomass. PNAS 2010, 107, 4516–4521. [Google Scholar] [CrossRef] [PubMed] [Green Version]
  62. Dee, S.J.; Bell, A.T. A study of the acid-catalyzed hydrolysis of cellulose dissolved in ionic liquids and the factors influencing the dehydration of glucose and the formation of humins. ChemSusChem 2011, 4, 1166–1173. [Google Scholar] [CrossRef] [PubMed]
  63. Mora-Pale, M.; Meli, L.; Doherty, T.V.; Linhardt, R.J.; Dordick, J.S. Room temperature ionic liquids as emerging solvents for the pretreatment of lignocellulosic biomass. Biotechnol. Bioeng. 2011, 108, 1229–1245. [Google Scholar] [CrossRef] [PubMed]
  64. Sen, S.M.; Binder, J.B.; Raines, R.T.; Maravelias, C.T. Conversion of biomass to sugars via ionic liquid hydrolysis: Process synthesis and economic evaluation, Biofuels. Bioprod. Biorefin. 2012, 6, 444–452. [Google Scholar] [CrossRef]
  65. Strachan, J. Solubility of Cellulose in Water. Nature 1938, 141, 332. [Google Scholar] [CrossRef]
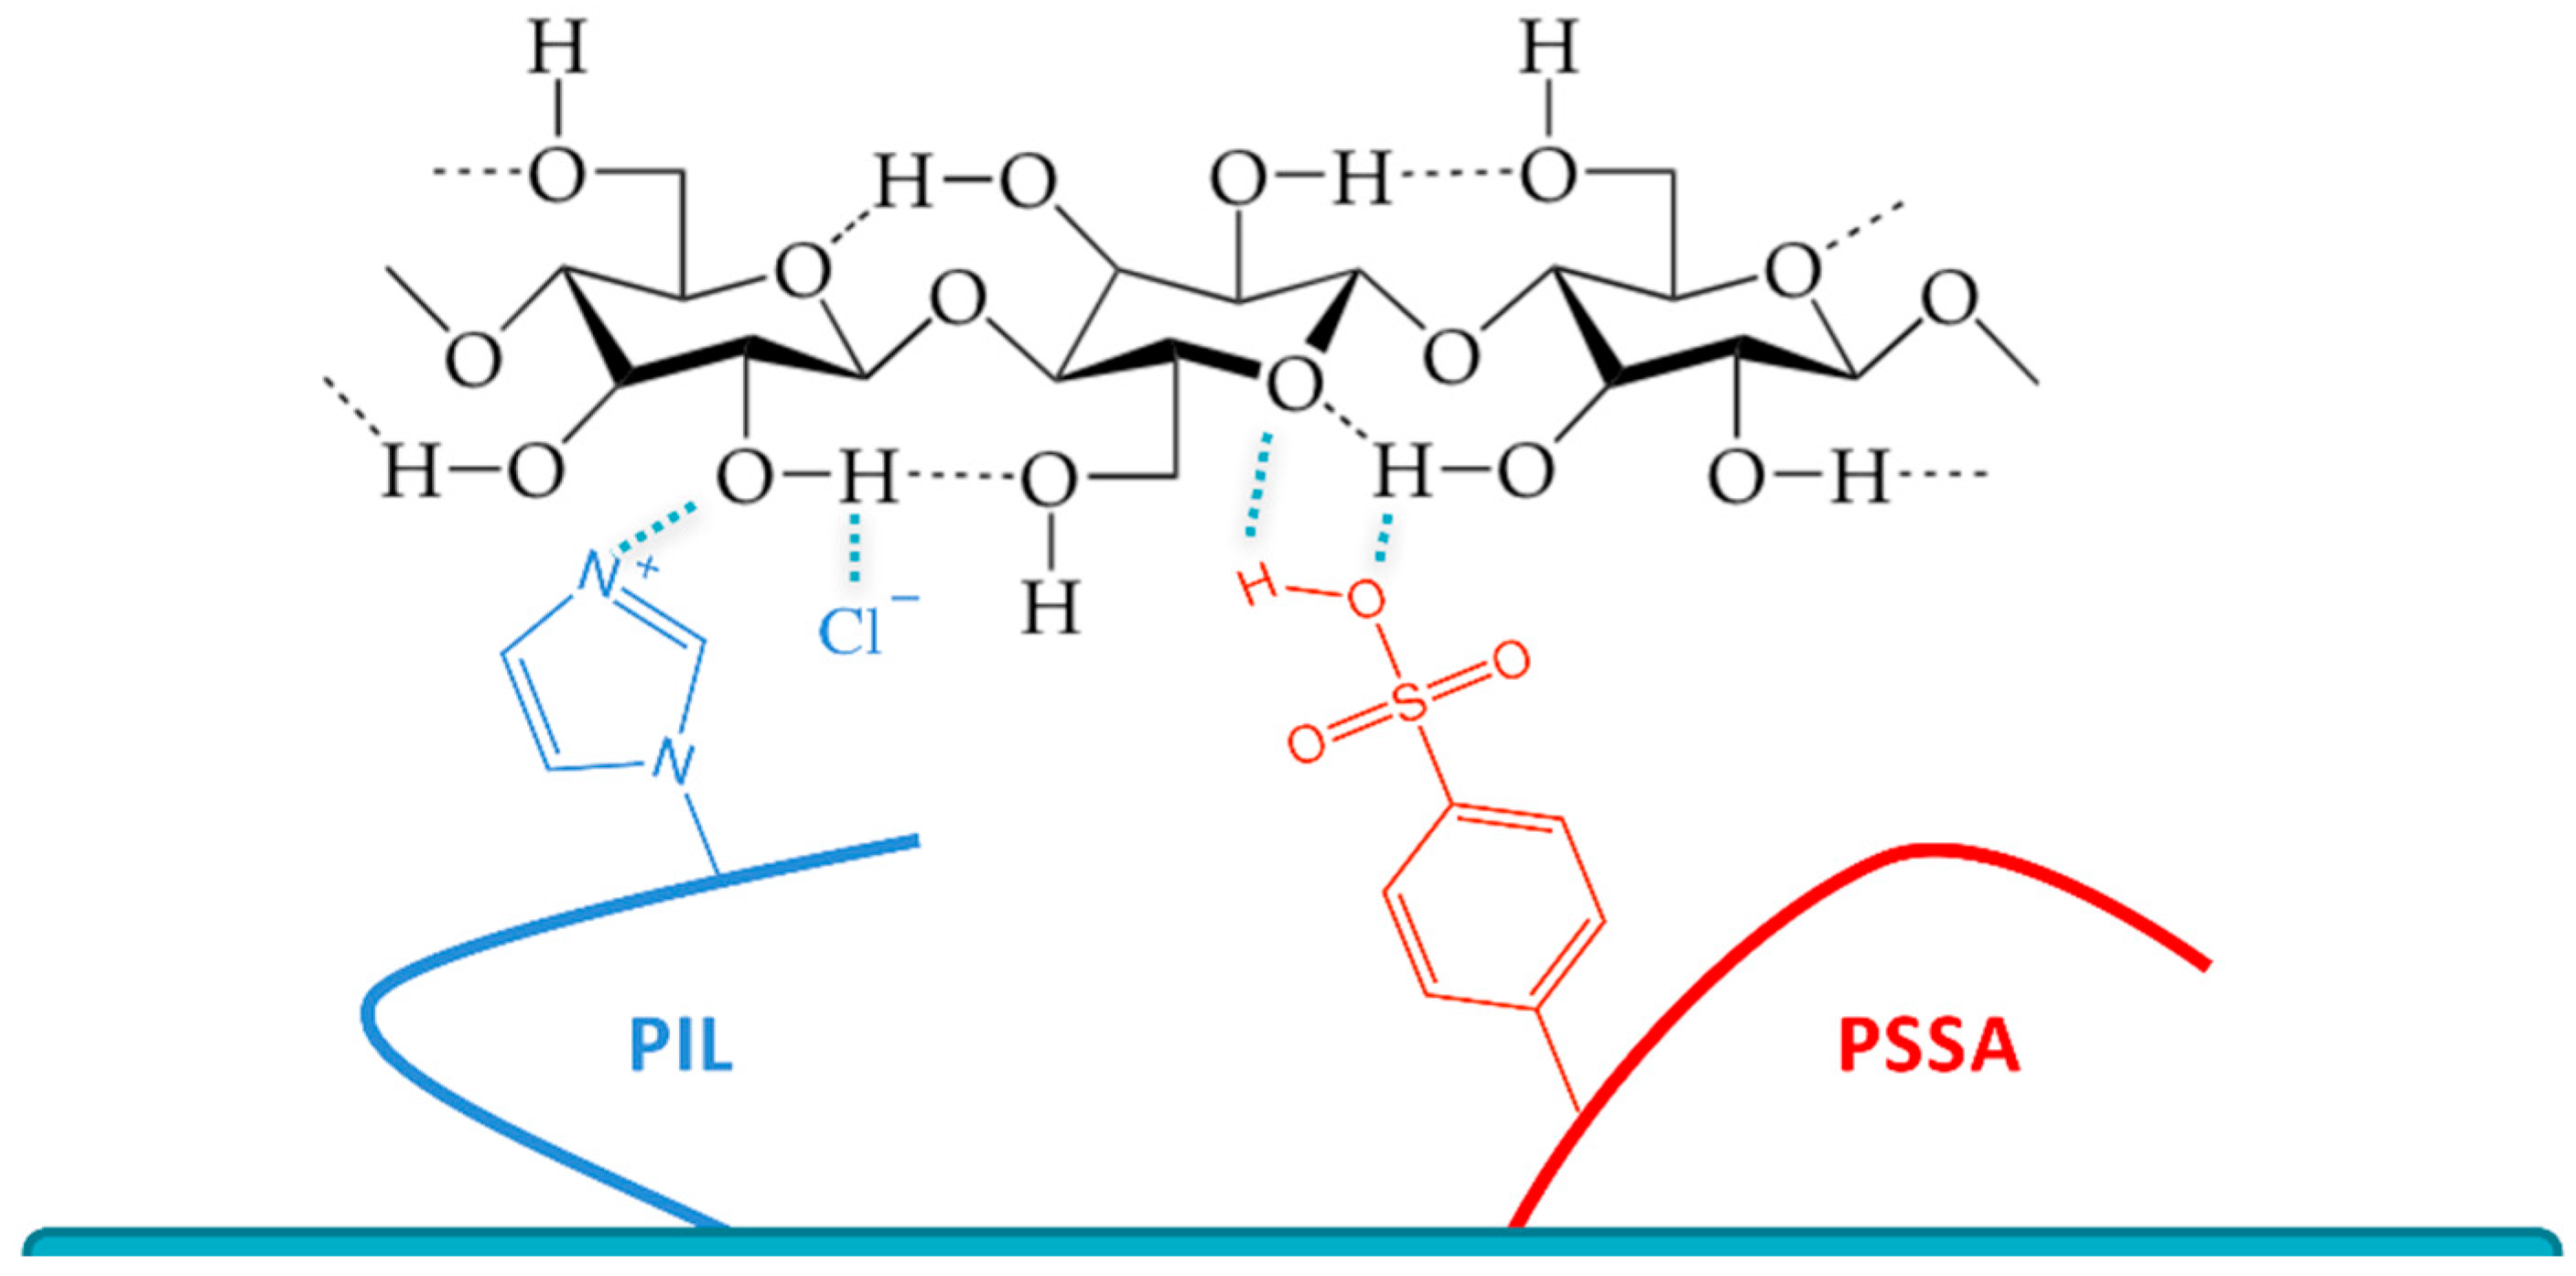
Figure 1. The proposed interaction between PSSA, PIL and cellulose chains in the hydrolysis. Intramolecular hydrogen bonds in the cellulose chain are the black dashed line. Hydrogen bonds formed between PIL/PSSA and cellulose chains are the green dashed line.
Applsci 08 01767 g001
Figure 2. Filling a one-dimensional model potential with bias potentials, starting in the right local minimum. After filling up the local minimum, the system escapes to the other local minimum on the left and so forth, and generates the whole free energy landscape [39].
Applsci 08 01767 g002
Figure 3. The free energy barrier before the formation of hydrogen bonds between the polymer chains for the four interacting systems (A: DP 20 ionized PSSA, DP 20 Cellulose; B: DP 10 PSSA, DP 10 Cellulose; C: DP 20 PSSA, DP 20 PIL; D: DP 10 PIL, DP 10 Cellulose) in aqueous solution.
Applsci 08 01767 g003
Figure 4. Solvation free energies (per DP) of polymeric catalysts and cellulose chains in [EMIM]Cl and aqueous solutions.
Applsci 08 01767 g004
Figure 5. The 2D free energy surface contour plot for system A, involving the interaction of DP 10 neutral PSSA and DP 10 cellulose in water. CV1 and CV2 represent the number of hydrogen bonds formed between them.
Applsci 08 01767 g005
Figure 6. The 2D free energy surface contour plot for system B involving DP 20 ionized PSSA and DP 20 cellulose chain interactions in water. CV1 and CV2 represent the numbers of hydrogen bonds formed between the two polymer chains.
Applsci 08 01767 g006
Figure 7. The 2D free energy surface contour plot for system C involving DP 20 neutral PSSA and DP 20 cellulose chains in [EMIM]Cl. CV1 and CV2 represent the numbers of hydrogen bonds formed between them.
Applsci 08 01767 g007
Figure 8. The 2-D free energy surface contour plot for system D involving DP 20 ionized PSSA and DP 20 cellulose chains in [EMIM]Cl. CV1 and CV2 represent the numbers of hydrogen bonds formed between them.
Applsci 08 01767 g008
Figure 9. The 2D free energy surface contour plot for system E involving DP 10 PIL and DP 10 cellulose in water. CV1 and CV2 represent the numbers of hydrogen bonds formed between them.
Applsci 08 01767 g009
Figure 10. The 2D free energy surface contour plot for system F involving DP 20 PIL and DP 20 cellulose chains in [EMIM]Cl. CV1 and CV2 represent the numbers of hydrogen bonds formed between them.
Applsci 08 01767 g010
Figure 11. The 2D free energy surface contour plot for system G, involving DP 20 PSSA and DP 20 PIL in water. CV1 and CV2 represent the numbers of hydrogen bonds formed between them.
Applsci 08 01767 g011