Abstract
In this study, a post-tensioning method using externally unbonded steel rods was applied to pre-damaged reinforced concrete beams for flexural strengthening. Nine simply-supported beams, three reference beams and six post-tensioned beams, were subjected to three-point bending. The design parameters observed in this study were the amount of tension reinforcements (3-D19, 4-D19, and 2-D22 + 2-D25; “D” indicates the nominal diameter of the rebar) and the diameters of the external rod (φ22 mm and φ28 mm). A V-shaped profile with a deviator at the bottom of the mid-span was applied to the pre-damaged beams, and a post-tensioning force was added to overcome the low load resistance and deflection already incurred in the pre-loading state. The post-tensioning force caused by tightening the nuts at the anchorage corresponded to a strain of 2000 με in the external rods; this value was approximately equal to the strain caused by torque that two adults can apply conveniently. The post-tensioning system increased the load-carrying capacity and flexural stiffness by approximately 40–112% and 28–73%, respectively, when compared with the control beams. However, the external rods did not yield in the post-tensioned beam with larger steel reinforcements and external steel rods. The external rod with the larger diameter increased the flexural strength more effectively.
1. Introduction
Concrete is the principal component of reinforced concrete (RC) and is the most widely used structural material in modern society because of its remarkable economic value and durability [1,2,3]. Nonetheless, the aging of concrete in concrete structures gradually deteriorates their performance. Therefore, periodic inspections are very important for restoring the performance of concrete structures prior to performance degradation. As the importance of maintenance and rehabilitation of aged RC structures is being emphasized, the rehabilitation and reinforcement of existing structures are attracting immense interest in South Korea. Accordingly, various studies on structural materials and techniques are being pursued actively [1,4,5,6].
The most common strengthening techniques include new section enlargement [7,8,9,10], external plate bonding [11,12,13,14,15,16,17], and post-tensioning [18,19,20,21]. Sectional reinforcement involves the addition of an RC jacket section and the bonding of high-strength materials such as steel plate or carbon fiber. Steel plate and carbon fiber reinforcement methods face challenges due to low bonding reliability and unsatisfactory deflection recovery. In an effort to resolve this problem, Nardone et al. [22] suggested a mechanical fastening technique that uses steel anchors to secure fiber-reinforced polymer components to the concrete substrate. However, a post-tensioning method using tensile structural materials is advantageous because the reinforcement effect is more assured and reliable, the restoration of deflection is more convenient, and ductile failure can occur. A post-tensioning technique can be conveniently used while the affected structure is in service [23,24,25,26]. It is commonly used overseas and is highly economical in comparison with other reinforcement methods. However, its use in South Korea has been severely limited to a certain group of structural engineers owing to its low recognition and the uncertainty regarding its maintenance and rehabilitation. It is likely that the construction cost of reinforcement will be significantly reduced if the post-tensioning reinforcement method is used more widely [27,28,29].
Pre-stressing with tendons involves applying tendon pre-stressing to a concrete structure both internally and externally [30]. This method has a long history of application and is the most effective repair and reinforcement method for existing concrete beams. Moreover, it is a popular technique for constructing long-span bridges because of its short construction time and low cost [30,31,32]. The advantages of internal or external tendon systems compared with bonding techniques have been widely studied and are enumerated as follows [2,3,18,28,29,30,32,33]:
- more economical construction method;
- shorter construction time;
- higher convenience and freedom in the layout of the tendon and its consolidation of the concrete.
The system for reinforcing the outside of existing structures with tendons is fundamentally different from the traditional method of embedding the tendon inside the concrete. The tendons embedded in the design of a concrete bridge function as the main reinforcing material (e.g., rebar). On the other hand, the tendons used as external reinforcing materials function only as a part of the total flexural strengthening material, while the internal rebar, internal pre-stressing steel, or both contribute to the remaining reinforcement [18]. This study aims to examine the strengthening effect of the tensile rebar ratio and the quantity of reinforcement by using a reinforcing system comprised of external reinforcing steel rods and a deviator. This system was introduced in “Reinforcing Method of Architectural Structures Using High-strength Bars and Tensile-force Measurement Device,” as reported by Molti and Kaia [27]. This study was motivated by previous experiments that have investigated the strength capacities of continuous RC beams reinforced by externally prestressed steel bars relative to those of RC beams without external reinforcement [4,6]. Theoretical analyses have also been performed [5]. In addition, the effect of distance between stirrups and boundary conditions [28], the diameter of steel rods and the ratio of tension reinforcement [29], and the loading condition [34] have been examined. However, these investigations had difficulties verifying the effect of external steel rods on the damaged RC beam because they started the experiments after installing the external steel rods. The scope of the current study included (1) damage to the RC beam due to repetitive fatigue loading; (2) restoration of the deflection through post-tensioning; (3) strengthening effect with respect to the external strengthening quantity; and (4) evaluation of the increases in strength and stiffness.
2. Experimental Plan
2.1. Specimen Fabrication
Test specimens of total length 4400 mm were prepared according to design parameters in order to evaluate the flexural behavior of an RC beam externally strengthened with post-tensioning steel rods. The section size of the basic RC beam was 270 × 400 mm (width × height), and the rebar material was SD400 grade with a tensile strength of 400 MPa. As shown in Figure 1, 3-D13 was used as the compression rebars, and 3-D19, 4-D19, and 2-D22 + 2-D25 were used as the tension rebars (“D” indicates the nominal diameter of the rebar). Transverse reinforcements of D10 were laid out at intervals of 65 mm. The design parameters for strengthening the nine test specimens are as follows:
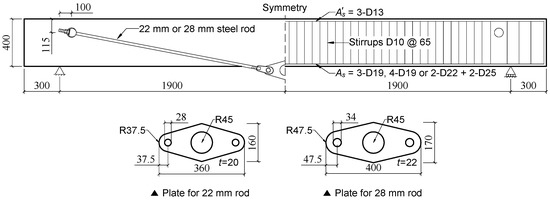
Figure 1.
Details of reinforcements (all dimensions are in mm).
- Strengthening material: high-strength steel rod;
- Diameter of steel rods: φ22 mm, φ28 mm;
- Layout shape of steel rod: V-profile with deviator at mid-span;
- Strengthening effective depth at deviator: 435 mm;
- Anchorage type: penetrated anchor pin;
- Loading pattern: three-point bending; and
- Amount of tensile reinforcements: 3-D19, 4-D19, and 2-D22 + 2-D25.
Table 1 lists the test specimens by the design parameters as shown in Figure 1 and Figure 2. S1-No, S2-No, and S3-No are basic unstrengthened RC beam specimens with tension rebars of 2-D22 + 2-D25, 4-D19, and 3-D19 design, respectively. “R22” and “R28” in the specimen name denote the diameter of the external post-tensioning steel rods. The nine specimens were subjected to three-point bending tests.

Table 1.
Specimen lists.

Figure 2.
Details of the strengthening specimen.
2.2. Material Properties
The compressive strength tests of concrete cylindrical specimens of dimensions φ100 × 200 mm were carried out according to the specifications of KS F 2405 [35]. The longitudinal displacement and strain were simultaneously measured using two linear variable differential transformers (LVDTs) of capacity 10 mm and two concrete strain gauges of gauge length 60 mm. The load was measured using a load cell mounted in a universal testing machine (UTM). The tensile tests of the rebar and steel rod were performed in accordance with KS B 0802 [36]. The elongated displacement and strain were measured using an extensometer of gauge length 50 mm and two strain gauges of gauge length 5 mm, respectively. Table 2 and Figure 3 present the material test results. The average compressive strength of concrete at 28 d was 30 MPa, and the D13 compression rebar exhibited a yield strength of 544 MPa and tensile strength of 655 MPa. The D19, D22, and D25 tension rebars exhibited yield strengths of 493, 530, and 445 MPa, respectively, and tensile strengths of 631, 658, and 628 MPa, respectively. The φ22 mm and φ28 mm external rods exhibited yield strengths of 655 and 625 MPa, respectively, and tensile strengths of 805 and 765 MPa, respectively.
Table 2.
Material test results.

Figure 3.
Tensile test results of reinforcements (left) and external rods (right).
2.3. Loading and Measurement
The specimens were subjected to three-point bending with a span length of 3800 mm. Two LVDTs of capacity 100 mm were installed at the center of the beam. Five crack gauges of capacity ±5 mm were installed such that the gauge length of each one was 430 mm. The gauge length of the original crack gauge device was 100 mm; however, it was extended using a dummy plate. The LVDTs measured the deflection at the front and back of the beam center, and the crack gauges were installed to measure the strain change and curvature of the beam section, as shown in Figure 4.

Figure 4.
Curvature calculation using crack gauges.
The method of computing the curvature from the displacements measured using the crack gauges is expressed by Equation (1):
where l1 and l2 are the gauge lengths at the top and bottom crack gauges, respectively; Δl1 and Δl2 represent the displacements measured at the top and bottom gauges, respectively; ε1 and ε2 are the strains in the compression and tension extreme fibers, respectively; hg is the vertical distance between the two gauges; and φ represents the curvature.
The steps of the experimental procedure used to simulate the actual rehabilitation and reinforcement of the RC specimens are as follows (see Figure 5):
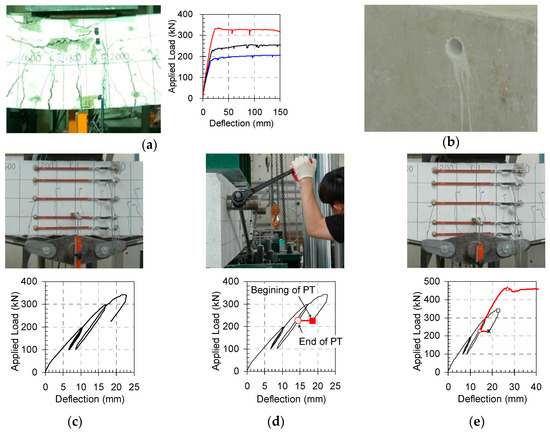
Figure 5.
Experimental procedure: (a) testing of control beam; (b) drill hole for anchorage; (c) preloading; (d) post-tensioning (PT); and (e) reloading.
- (1)
- First, bending tests of the unstrengthened control RC beams were carried out to determine their yield strength, ultimate strength, and the corresponding deflections (Figure 5a).
- (2)
- The specimens used for strengthening were prepared and the anchor holes at the end of the beam were drilled prior to the loading test rather than prefabricated so as to simulate the real-world condition of the beam (Figure 5b).
- (3)
- Preloading was applied to the unstrengthened beam through displacement control. Several repetitive loads were applied until the load exceeded the yield load in order to induce damage to the beam (Figure 5c).
- (4)
- The external unbonded member was post-tensioned after reducing the load (i.e., from the load exceeding yield load down to the service load of approximately two-thirds of the ultimate strength; Figure 5d). Since damage to the measuring device and measurement error can occur if the strengthening system were installed during the loading test, the system was prepared prior to the loading test and tensioned after the beam was damaged.
- (5)
- Tensioning was applied while monitoring the load–deflection curve and strain of the unbonded steel rod. The post-tensioning (PT) level was set at the first of two strengths: recovery of the deflection at the service load of the unstrengthened beam or attainment of a strain of 2000 με in the steel rod, which is approximately the force converted from torque that two adult men can apply using a wrench. At this time, an actuator was used to maintain the service load level by load control.
- (6)
- After the tensioning was completed, the test specimens were subjected to re-loading using the displacement control method until their final failure (Figure 5e).
3. Experimental Results
3.1. Unstrengthened Beams
Figure 6 indicates the typical crack distributions in an RC beam. Generally, the cracking behavior of an RC beam can be described as composed of three stages: the first is the initiation of cracking, the second is the yield of the tensile rebar, and the third is the concrete crushing collapse [38]. Similarly, in this test, flexural cracking occurred from the bottom of the beam center upon attaining the crack load. The gradual loading resulted in a wider crack and the propagation of the crack toward the support. As the propagation of the cracks involved simultaneous shear cracking and flexural cracking, diagonal cracking was observed toward the support. After the tensile rebar yielded, a plastic hinge occurred around the loading point, causing the cracking to propagate further, and the collapse of the concrete around the loading point started. Moreover, at this point of tensile rebar yielding, the increase in load was not significant and only the deflection increased. Upon attaining the final failure of the specimens, the compressive collapse of concrete in the specimens S1-No, S2-No, and S3-No was observed at the distances of 1200, 1000, and 600 mm, respectively, on the left and right sides of the loading point. The more the number of tensile rebars in the test specimen, the fewer were the hairline cracks and the narrower were the cracks observed.

Figure 6.
Experimental crack pattern of unstrengthened beams.
Figure 7a shows the load–deflection curves of the control specimens. The yield load for the specimen S1-No was 331 kN, and the corresponding mid-span deflection was 24.8 mm. This specimen manifested ductility until the strain of the compressive concrete extreme fiber attained 0.013 with no indication of rapid load decrease. The specimen S2-No yielded at the deflection of 20.3 mm and load of 228 kN. The specimen S3-No started to yield at the deflection of 18.2 mm and load of 181.2 kN. Moreover, the two beams exhibited sufficient ductility until the strain of the compressive concrete extreme fiber attained 0.016 and 0.007, respectively, with no indication of load decrease.

Figure 7.
Results of control RC beams: (a) measured total load versus mid-span deflection and (b) calculated mid-span moment versus curvature relationship.
The mid-span curvature curves in Figure 7b are plotted with the strain of the section as measured using the crack gauges installed as illustrated in Figure 4. The curvature of S1-No could not be computed until the completion of the experiment owing to an early debonding of the crack gauge caused by the compressive collapse of the extreme concrete fiber.
Table 3 summarizes the experimental results such as the stiffness, load capacity, and corresponding deflection of the unstrengthened control specimens. All the specimens exhibited similar crack load Pcr and deflection δcr of approximately 50 kN and 2.3 mm, respectively. The initial stiffness Kinitial of about 30 kN/mm decreased to the post-stiffness Kpost of 16.5 kN/mm for S1-No and 12.5 kN/mm for S2-No. For S3-No, the initial stiffness was 26.0 kN/mm, and the post-stiffness after cracking was 10.1 kN/mm. Comparing the deflections, when the compressive strains εcu of the extreme concrete fiber were 0.003 or 0.005, as measured using the crack gauges, the deflection tended to decrease with a higher number of tensile rebars. The strain of 0.003 represents the maximum strain (or ultimate strain or failure strain) of the compressive extreme fiber as assumed during the typical flexural design of the RC beam [37]. The strain of 0.005 refers to the maximum value of the strain of the compressive concrete as used more practically in the rehabilitation and reinforcement of RC structures [39,40]. This study investigated the stepwise change at strains exceeding 0.003 in the compressive extreme fiber.
Table 3.
Summary of measured results of control RC beams.
3.2. Strengthened Beams
Figure 8a shows the crack distribution of the S1 beams strengthened with steel rods of diameters φ22 mm and φ28 mm. These strengthened specimens exhibited significantly fewer and narrower cracks in comparison to the unstrengthened specimens. However, in comparison with the S2-type specimens, the tensile flexural cracking was significantly reduced. Furthermore, the concrete collapse was deeper than that of the S2 specimens (reaching the deepened neutral axis) due to the relative increase in the tension reinforcements.

Figure 8.
Crack pattern of strengthened beams: (a) S1 beams; (b) S2 beams; and (c) S3 beams.
The distribution of cracks after applying load on the S2 specimens strengthened with steel rods of diameters φ22 mm and φ28 mm is shown in Figure 8b. The two specimens manifested a significant decrease in the number and width of cracks in comparison to the unstrengthened control specimen S2-No. Although further reinforcement resulted in wider and deeper concrete collapse owing to the deepened neutral axis, the number and propagation of the flexural cracks observed at the beam bottom were relatively less. The specimen strengthened with a steel rod of diameter φ28 mm (S2-R28) cracked around the anchorage on top of the support upon attaining the ultimate strength. However, the anchorage did not fail until the completion of the test.
Figure 8c indicates the crack patterns of the strengthened S3 beams. When compared to the basic beam, the width and number of the cracks decreased. At the cracking load, flexural cracks occurred near the loading point, and they grew to a height of 260–300 mm in the section at the completion of the test. In S3-R22, while the load increased from the yield load to the ultimate load, concrete crushing started on the left side of the loading point. In S3-R28, concrete crushing occurred over a wider range than in R22.
Figure 9a shows the load–deflection and load–rod strain curves of S1-R22 strengthened with a steel rod of diameter φ22 mm. Prior to the post-tensioning, the measured stiffness after cracking Kbefore was 17.5 kN/mm. The stiffness of the strengthened specimen after post-tensioning Kafter was 23.2 kN/mm. Post-tensioning was carried out after reducing the load from that at the state when it damaged the unstrengthened beam (P1st = 342.7 kN and δ1st = 21.9 mm), to 226 kN. Post-tensioning aided the recovery of the deflection of approximately 4.1 mm at the center, and the tension strain applied to the steel rod εse was measured as 2163 με. The beam specimen attained the maximum load P2nd and corresponding deflection δ2nd of 469.4 kN and 55.5 mm, respectively, upon continuous reloading after post-tensioning. The deflection continued to increase without a significant increase in the load until the maximum load, followed by a decrease in the load. Although the strain of the concrete compressive-extreme fiber had already reached 0.003 prior to attaining the maximum strength, the strain of the concrete compressive extreme fiber could not be measured subsequently owing to the debonding of the top crack gauge, which was caused by crushing of the concrete. However, it was likely to have exceeded 0.005, considering the linearity of strains measured by crack gauges. The external rod strain of 2163 με with post-tensioning reached 2763 με and 5582 με when the compressive strain of the concrete extreme fiber εcu and the maximum load reached 0.003 and 469.4 kN, respectively. The steel rod yielded at a load of 463 kN and deflection of 71.0 mm between the time the compressive strain of the concrete extreme fiber reached 0.003 and the maximum load reached 469.4 kN. The test ended at the rod strain of 6260 με.
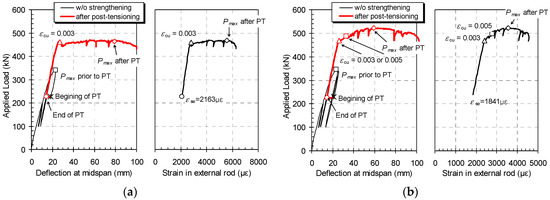
Figure 9.
Deflection and rod strain with respect to applied load: (a) S1-R22 and (b) S1-R28.
Figure 9b depicts the load–deflection and load–rod strain curves of S1-R28. The initial stiffness of 17.5 kN/mm immediately before post-tensioning increased to 22.3 kN/mm after strengthening with the steel rods. The mid-span deflection recovered by post-tensioning was approximately 6.4 mm; at this point, the measured steel rod strain was 1841 με. The beam specimen attained the maximum load of 521.4 kN and deflection of 59.3 mm after post-tensioning. The strains of the concrete compressive extreme fiber were 0.003 and 0.005 at the deflection stages of 26.0 and 32.5 mm, respectively, prior to attaining the maximum strength. The load continued to increase beyond the yield strength up to the maximum strength and gradually decreased after the maximum load. The test ended at the point of deflection of 100 mm at the beam center. The external rod strain of 1841 με reached 2400, 2572, and 3536 με at εcu = 0.003, εcu = 0.005, and P2nd = 521.4 kN, respectively. The strain of the steel rod did not yield, even after attaining the maximum strength, until the completion of the experiment.
Figure 10a shows the load–deflection and load–rod strain curves for S2-R22 strengthened with a steel rod of diameter φ22 mm. The stiffness prior to the post-tensioning of 12.5 kN/mm increased to 17.9 kN/mm after post-tensioning, which was performed after reducing the load from P1st = 230.2 kN to 154 kN. The post-tensioning recovered a deflection of approximately 5.7 mm, and the effective strain applied to the steel rod was 2153 με. The continuous reloading resulted in a maximum load of 419.0 kN and deflection of 66.0 mm. The deflections were 30.4 mm and 41.5 mm at the measured strain of 0.003 and 0.005, respectively, in the concrete compressive extreme fiber; these deflections occurred well before attaining the maximum load capacity. Although the decrease in the load was not evident after the maximum load, the experiment was terminated when the measured deflection was 87 mm because brittle failure by concrete crushing was predicted. The initial strain of the post-tensioning rod (εse = 2153 με) increased to 3141, 3805, and 5411 με at εcu = 0.003, εcu = 0.005, and P2nd = 419.0 kN, respectively. The external rod yielded at the load and deflection of 417 kN and 62.6 mm, respectively; this occurred immediately prior to attaining the maximum load.

Figure 10.
Deflection and rod strain with respect to applied load: (a) S2-R22 and (b) S2-R28.
The measured load–deflection and rod strain curves for S2-R28 are shown in Figure 10b. The stiffness prior to post-tensioning of 13.8 kN/mm increased to 19.8 kN/mm after post-tensioning, which resulted in a deflection recovery of approximately 8.5 mm. The initial strain in the external rod was 2035 με. Reloading was applied at a deflection of 8.2 mm, which was less than the deflection 11.3 mm of the unstrengthened specimen owing to the deflection recovery. In this beam, a maximum load and the corresponding strain of 513.8 kN and 61.1 mm, respectively, were recorded after post-tensioning and reloading. The deflections at the measured strains of 0.003 and 0.005 were 26 and 29 mm, respectively. The compressive strain at the concrete extreme fiber reached 0.005 prior to the maximum load. Although the strain of the external rod reached 4592 με at the maximum load, the yield strain was not attained at this point.
The changes in the deflection and strain of the external rod with increasing applied load for the S3-R22 beam are plotted in Figure 11a. The stiffness of 10.4 kN/mm prior to post-tensioning reduced to 17.5 kN/mm afterwards. The first maximum load prior to post-tensioning was 182.4 kN, and the post-tensioning was conducted after unloading to 120 kN. Post-tensioning achieved a deflection recovery of 6.0 mm, and the initial strain of the steel rod was 2148 με at the end of post-tensioning. In this beam, the load marginally decreased after the maximum load of 409 kN and, thereafter, the compressive strain of the concrete extreme fiber reached 0.003.
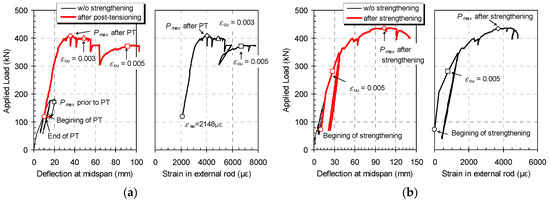
Figure 11.
Deflection and rod strain with respect to applied load: (a) S3-R22 and (b) S3-R28.
Figure 11b shows the load–deflection and load–rod strain plots of S3-R28. In this specimen, because of an operational error that caused the UTM to act abruptly on the beam immediately prior to the post-tensioning, the initial strain of the rod and the deflection recovery were zero. The stiffnesses before and after post-tensioning were calculated as 10.4 kN/mm and 18.0 kN/mm, respectively. The load was plotted as 281.9 kN at the concrete extreme fiber strain of 0.005, and the maximum load was recorded as 436.9 kN.
Table 4 summarizes the test results of the strengthened specimens. The stiffness-strengthening effects for the S1-, S2-, and S3-type specimens were approximately 30, 43, and 70%, respectively. The specimens with a higher number of tensile rebars exhibited less stiffness-strengthening effects. Additionally, based on the maximum load, the strengthening effect was observed to be approximately two times for the S3-type specimens, approximately 40 and 55% for the S1-type specimens, and 64 and 101% for the S2-type specimens. The strengthening effect was more than 37% at the compressive concrete strain of 0.003 or 0.005 except for S3-28, which was not post-tensioned owing to the aforementioned operational error.
Table 4.
Summary of measured results in post-tensioned beams.
3.3. Flexural Strength Analysis
Flexural strength analyses were performed for the mid-span section of the tested beams. The analysis performed in this study was different from that performed for a beam with internal tendons since the internal tendons remain in place relative to the surrounding concrete under varying deflection. However, in this study, the deflection of the external unbonded steel along the beam length is different from that of the surrounding concrete [41,42,43,44]. Therefore, the analysis required the calculation of the elongation of the external rod, which was dependent on the deflection at the deviator point [41]. The elongation (Δεps) of the external rod was obtained from Equations (2)–(4) and Figure 12, as reported by Lee et al. [5].

Figure 12.
Elongation of external rod after deformation.
To obtain the value of the elongation (L’p) at a particular loading state, the deflection (δ) and rotation (θ) at that state in Equation (4) should be calculated. At a specific ultimate state, these parameters can be determined using Equations (5)–(7) and the ultimate curvature of Figure 13 [5,45].

Figure 13.
Curvature distribution at ultimate state.
To calculate the deflection and rotation in Equations (5) and (6), the neutral axis depth c in Equation (7) is required. These interrelated values (δ, θ, c, and Δεps) should be obtained by an iteration procedure until all the conditions, including the strain compatibility, force equilibrium, and compatibility between the rod elongation and deflection are satisfied. The force equilibrium is expressed as Equation (8) based on Figure 14.
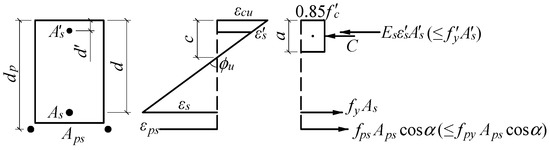
Figure 14.
Stress and strain distribution at ultimate state.
Table 5 shows a comparison between the analytical and measured moment capacities for each specimen. A sensitivity analysis was also conducted with respect to the four loading steps: εcu = 0.003, εcu = 0.005, Pmax, and at the end of the test. No significant difference in the predicted moment capacities was observed. It was recommended in previous studies [40,46] that an ultimate compression strain of 0.005 be conservatively adopted for the purpose of rehabilitation. In this sensitivity analysis, the predicted moment capacities for εcu = 0.005 were closer to the measured moment capacities than those for εcu = 0.003. The average and standard deviations between the predicted and measured capacities were 0.84 and 0.08, respectively, for εcu = 0.005.
Table 5.
Sensitivity analysis of moment capacities with respective to loading step.
4. Conclusions
This study experimentally evaluated and verified the strengthening effect of post-tensioning on an RC beam using external unbonded steel rods. The objective was to examine the effect of such strengthening on damaged RC beams as a technique for rehabilitation or reinforcement. Reinforced concrete beams with different tensile rebar quantities were prepared, and three-point bending tests were performed with different diameters (φ22 mm and φ28 mm) of steel rods in order to evaluate the performance of the steel rods as strengthening members. The beam specimens were damaged by repetitive loading before applying the reinforcement system. Subsequently, the loading was controlled up to the service load after the yield load was attained, and post-tensioning was applied to the steel rod. Tension was applied by tightening the nut of the anchorage, and the initial tension was set to the amount of force required to recover the deflection up to the service load stage or about 2000 με (the strain in the steel rods that two adult men could achieve conveniently). The following conclusions were derived from the flexural strength tests:
- (1)
- External post-tensioning was highly effective in strengthening the RC beams because the strengthened test specimens generally exhibited stable load–deflection behavior after reaching the maximum load, without a rapid decrease in strength.
- (2)
- The rehabilitation or reinforcement of the beams using external unbonded post-tensioning steel rods resulted in enhancements exceeding 28% and 40% in stiffness and strength, respectively. Furthermore, the external post-tensioning was effective in controlling the crack width and re-establishing the service load deflections of the RC beams. This method reduced the crack widths or closed the cracks and resulted in a stiffer load–deflection behavior.
- (3)
- Comparing the effects of the external rod diameter, the maximum strength of the beams strengthened with the thicker steel rods was higher; however, the depth of concrete crushing at the ultimate strength was also higher in these beams.
- (4)
- Notably, tensioning played a highly important role in external strengthening. It was also observed that the initial tension of the steel rod was sufficiently effective for recovering the deflection up to the service load stage or approximately 2000 με.
- (5)
- The ultimate moment determined using moment capacity analysis was found to be sufficiently accurate and computationally efficient at various loading steps, i.e., εcu = 0.003, 0.005, Pmax, and test completion.
Author Contributions
S.H.L. and K.J.S. conceived and designed the experiments; S.H.L. and H.D.L. performed the experiments; S.H.L. analyzed the data; K.J.S. contributed reagents/materials/analysis tools; S.H.L. and H.D.L. participated in manuscript writing and revision. All authors collaborated on the interpretation of the results and on the preparation of the manuscript.
Funding
This study was supported by the National Research Foundation of Korea (NRF) grant funded by the Korea government (MSIT) (no. NRF-2015R1C1A1A01054899).
Conflicts of Interest
The authors declare no conflict of interest.
References
- Han, S.H.; Hong, K.N.; Shin, B.G.; Lim, J.M.; Kwak, S.H. Characteristics of shear behavior of reinforced concrete beams strengthened with near surface mounted CFRP strips. J. Korea Inst. Struct. Maint. Insp. 2011, 15, 178–189. [Google Scholar] [CrossRef]
- Shin, K.J.; Kwak, M.K.; Heo, B.W.; Na, J.M.; Oh, Y.S. An experimental study on the flexural behavior of RC beams strengthened with high-strength bars (1). J. Korea Concr. Inst. 2006, 18, 527–534. [Google Scholar] [CrossRef]
- Shin, K.J.; Kwak, M.K.; Bae, K.W.; Oh, Y.S.; Moon, J.H. An experimental study on flexural behavior of RC beams strengthened with hi-strength bars (2). J. Korea Concr. Inst. 2006, 18, 603–610. [Google Scholar] [CrossRef]
- Lee, S.H.; Lee, H.D.; Shin, K.J.; Kang, T.H.K. Shear strengthening of continuous concrete beams using externally prestressed steel bars. PCI J. 2014, 59, 77–92. [Google Scholar] [CrossRef]
- Lee, S.H.; Shin, K.J.; Kang, T.H.K. Non-iterative moment capacity equation for reinforced concrete beams with external post-tensioning. ACI Struct. J. 2014, 111, 1111–1122. [Google Scholar] [CrossRef]
- Lee, S.H.; Shin, K.J.; Kang, T.H.K. Flexural strengthening of continuous concrete beams using external prestressed steel bars. PCI J. 2015, 60, 68–86. [Google Scholar]
- Wang, Y.; Yang, S.; Han, M.; Yang, X. Experimental study of section enlargement with reinforced concrete to increase shear capacity for damaged reinforced concrete beams. Appl. Mech. Mater. 2013, 256–259, 1148–1153. [Google Scholar] [CrossRef]
- Belal, M.F.; Mohamed, H.M.; Morad, S.A. Behavior of reinforced concrete columns strengthened by steel jacket. Hous. Build. Natl. Res. Cent. J. 2015, 11, 201–212. [Google Scholar] [CrossRef]
- Lavorato, D.; Nuti, C.; Santini, S. Experimental investigation of the shear strength of RC beams extracted from an old structure and strengthened by carbon FRP U-strips. Appl. Sci. 2018, 8, 1182. [Google Scholar] [CrossRef]
- Bossio, A.; Fabbrocino, F.; Lignola, G.P.; Prota, A.; Manfredi, G. Simplified model for strengthening design of beam-column internal joints in Reinforced Concrete Frames. Polymers 2015, 7, 1732–1754. [Google Scholar] [CrossRef]
- Norris, T.; Saadatmanesh, H.; Ehsani, M.R. Shear and flexural strengthening of R/C beams with carbon fiber sheets. J. Struct. Eng. 1997, 123, 903–911. [Google Scholar] [CrossRef]
- Subedi, N.K.; Baglin, P.S. External plate reinforcement for concrete beams. J. Struct. Eng. 1998, 124, 1490–1495. [Google Scholar] [CrossRef]
- Barnes, R.A.; Baglin, P.S.; Mays, G.C.; Subedi, N.K. External steel plate systems for the shear strengthening of reinforced concrete beams. Eng. Struct. 2001, 23, 1162–1176. [Google Scholar] [CrossRef]
- Altin, S.; Anil, Ö.; Kara, M.E. Improving shear capacity of existing RC beams using external bonding of steel plates. Eng. Struct. 2005, 27, 781–791. [Google Scholar] [CrossRef]
- Arslan, G.; Sevuk, F.; Ekiz, I. Steel plate contribution to load-carrying capacity of retrofitted RC beams. Constr. Build. Mater. 2008, 22, 143–153. [Google Scholar] [CrossRef]
- Bukhari, I.A.; Vollum, R.L.; Ahmad, S.; Sagaseta, J. Shear strengthening of reinforced concrete beams with CFRP. Mag. Concr. Res. 2010, 62, 65–77. [Google Scholar] [CrossRef]
- Del Vecchio, C.; Di Ludovico, M.; Balsamo, A.; Prota, A. Experimental investigation of exterior RC beam-column joints retrofitted with FRP systems. J. Compos. Constr. 2014, 18, 04014002. [Google Scholar] [CrossRef]
- Harajli, M.H. Strengthening of concrete beams by external prestressing. PCI J. 1993, 38, 76–88. [Google Scholar] [CrossRef]
- Ruiz, M.F.; Muttoni, A. Shear strength of thin-webbed post-tensioned beams. ACI Struct. J. 2008, 105, 308–317. [Google Scholar] [CrossRef]
- Revathy, J.; Sriraman, M. Structural response of FRP strengthened post-tensioned concrete beams. Res. J. Recent Sci. 2014, 3(ISC-2013), 198–202. [Google Scholar]
- Shin, K.J.; Lee, S.C.; Kim, Y.Y.; Kim, J.M.; Park, S. Construction condition and damage monitoring of post-tensioned PSC girders using embedded sensors. Sensors 2017, 17, 1843. [Google Scholar] [CrossRef] [PubMed]
- Nardone, F.; Lignola, G.P.; Prota, A.; Manfredi, G.; Nanni, A. Modeling of flexural behavior of RC beams strengthened with mechanically fastened FRP strips. Compos. Struct. 2011, 93, 1973–1985. [Google Scholar] [CrossRef]
- Täljsten, B.; Elfgren, L. Strengthening concrete beams for shear using CFRP-materials. Compos. Part B 2000, 31, 87–96. [Google Scholar] [CrossRef]
- De Lorenzis, L.; Miller, B.; Nanni, A. Bond of fiber-reinforced polymer laminates to concrete. ACI Mater. J. 2001, 98, 256–264. [Google Scholar]
- Yao, J.; Teng, J.G.; Chen, J.F. Experimental study on FRP-to-concrete bonded joints. Compos. Part B 2005, 36, 99–113. [Google Scholar] [CrossRef]
- Iovinella, I.; Prota, A.; Mazzotti, C. Influence of surface roughness on the bond of FRP laminates to concrete. Const. Build. Mater. 2013, 40, 533–542. [Google Scholar] [CrossRef]
- Ministry of Land, Infrastructure and Transport (MOLTI) & Korea Agency for Infrastructure Technology Advancement (KAIA). Available online: http://www.codil.or.kr/Codil/doc/OTKTRKX70571 (accessed on 17 September 2018).
- Shin, K.J.; Kim, Y.J.; Moon, J.H. An experimental study on flexural behavior of RC beams strengthened with hi-strength bars (3). J. Korea Concr. Inst. 2007, 19, 351–358. [Google Scholar] [CrossRef]
- Shin, K.J.; Kim, Y.J.; Moon, J.H. A study on flexural behavior of RC beams strengthening with high-strength bars according to the reinforcing ratio. J. Arch. Inst. Korea Struct. Constr. 2008, 24, 51–58. [Google Scholar]
- Virlogeux, M.P. External Prestressing. In IABSE Proceedings of International Association Bridge and Structural Engineering; IABSE Proceedings: Zurich, Switzerland, 1982; pp. 101–108. ISBN 0377-7278. [Google Scholar]
- Naaman, A.E.; Breen, J.E. SP-120: External Prestressing in Bridges; ACI Special Publication: Detroit, MI, USA, 1990; Available online: https://www.concrete.org/publications/internationalconcreteabstractsportal/m/details/id/14153 (accessed on 17 September 2018).
- Rabbat, B.G.; Sowlat, K. Testing of segmental concrete girders with external tendons. PCI J. 1987, 32, 86–107. [Google Scholar] [CrossRef]
- Hong, S.; Cho, D.; Park, S.K. Application of a new anchorage towards the flexural strengthening of RC rectangular beams with external steel tendons. Appl. Sci. 2016, 6, 119. [Google Scholar] [CrossRef]
- Kwon, S.J.; Yang, K.H.; Mun, J.H. Flexural tests on externally post-tensioned lightweight concrete beams. Eng. Struct. 2018, 164, 128–140. [Google Scholar] [CrossRef]
- KS F 2405:2010. Standard Test Method for Compressive Strength of Concrete; Korean Standards Association: Seoul, Korea, 2010. [Google Scholar]
- KS B 0802:2003. Method of Tensile Test for Metallic Materials; Korean Standards Association: Seoul, Korea, 2003. [Google Scholar]
- American Concrete Institute. Building Code Requirements for Structural Concrete (ACI 318-14) and Commentary on Building Code Requirements for Structural Concrete (ACI 318R-14); American Concrete Institute: Farmington Hills, MI, USA, 2014. [Google Scholar]
- Park, R.; Paulay, T. Reinforced Concrete Structures; John Wiley & Sons, Inc.: New York, NY, USA, 1975. [Google Scholar]
- Priestley, M.J.N.; Seible, F.; Calvi, G.M. Seismic Design and Retrofit of Bridges; John Wiley & Sons, Inc.: New York, NY, USA, 1996. [Google Scholar]
- Federal Emergency Management Agency. NEHRP Commentary on the Guideline for the Seismic Rehabilitation of Buildings (FEMA-274); Federal Emergency Management Agency: Washington, DC, USA, 1997.
- Shin, K.J.; Lee, S.H.; Kang, T.H.K. External posttensioning of reinforced concrete beams using a V-shaped steel rod system. J. Struct. Eng. 2015, 140. [Google Scholar] [CrossRef]
- Du, J.S.; Au, F.T.K.; Cheung, Y.K.; Kwan, A.K.H. Ductility analysis of prestressed concrete beams with unbounded tendons. Eng. Struct. 2007, 30, 13–21. [Google Scholar] [CrossRef]
- Yang, K.H.; Kang, T.H.K. Equivalent-strain distribution factor for unbounded tendon stress at ultimate. ACI Struct. J. 2011, 108, 217–226. [Google Scholar]
- Yang, K.H.; Mun, J.H.; Kim, G.H. Flexural behavior of post-tensioned normal-strength lightweight concrete one-way slabs. Eng. Struct. 2013, 56, 1295–1307. [Google Scholar] [CrossRef]
- Harajli, M.H. Effect of span-depth ratio on the ultimate steel stress in unbonded prestressed concrete members. ACI Struct. J. 1990, 87, 305–312. [Google Scholar]
- Paulay, T.; Priestley, M.J.N. Seismic Design of Reinforced Concrete and Masonry Buildings; Johh Wiley & Sons, Inc.: New York, NY, USA, 1992. [Google Scholar]
© 2018 by the authors. Licensee MDPI, Basel, Switzerland. This article is an open access article distributed under the terms and conditions of the Creative Commons Attribution (CC BY) license (http://creativecommons.org/licenses/by/4.0/).