Article

Quantitative Flow Cytometry to Measure Viral Production Using Infectious Pancreatic Necrosis Virus as a Model: A Preliminary Study

Instituto de Acuicultura, Departamento de Microbiología, Universidad de Santiago de Compostela, 15782 Santiago de Compostela, Spain
*
Author to whom correspondence should be addressed.
Appl. Sci. 2018, 8(10), 1734; https://doi.org/10.3390/app8101734
Submission received: 6 September 2018 / Revised: 22 September 2018 / Accepted: 22 September 2018 / Published: 26 September 2018
(This article belongs to the Section Applied Biosciences and Bioengineering)

Abstract

:
In recent decades, flow cytometry (FCM) has become an important tool in virology, due to its applications in viral replication and viral-cell interactions, as well as its capacity to quantify proteins (qFCM). In the present study, we have designed and evaluated a qFCM procedure for the in vitro analysis and quantification of fish viral proteins, using the infectious pancreatic necrosis virus (IPNV) as a model. We have also tested its use for viral titration and adapted the MARIS (method for analysing RNA following intracellular sorting) method for simultaneous quantification of viral RNA expression in infected cells. The procedure has proved to be repeatable and reproducible to an acceptable level, although to ensure reproducibility, the repetition of standard curves is inevitable. Regarding its use for viral quantification, a direct relationship (by a second-degree polynomial regression) between viral titres and Molecules of Equivalent Soluble Fluorochrome (MESF) was observed. Finally, the results support the use of this technology, not only for virus quantification, but also to study viral replication from a quantitative approach.

1. Introduction

Since its first development, flow cytometry (FCM) has become a reliable tool to study virus-cell interactions and, among its applications, the quantification of cellular antigens gained popularity in the early 80s [1,2]. This methodology, known as quantitative flow cytometry (qFCM), is defined as “the calibrated measurement of fluorescence intensity from labelled particles to determine the actual number of fluorescent ligands labelling each particle” [3]. Different clinical studies using qFCM have been published [4], including applications in viral research, like monitoring the multiplicity of infection of a virus during vaccine production, the evaluation of protein heterogeneity in the Herpes simplex virus, or the evaluation of cell antiviral response to Rhinovirus [5,6,7].
FCM has also been extensively used in fish virology, for the screening of antibody libraries [8], for the detection of different viruses such as IPNV [9,10,11,12,13], the Lymphocystis virus [14], the Infectious haematopoietic necrosis virus (IHNV) [15] or the Iridovirus [16], and in viral replication studies [17,18,19,20,21]. However, to our knowledge, its use for real quantitative purposes has never been reported.
Infectious pancreatic necrosis is an important disease affecting salmonid aquaculture. The causative agent, the Infectious pancreatic necrosis virus (IPNV), is an Aquabirnavirus, belonging to the family Birnaviridae. Members of this family have a genome composed of two segments of double-stranded RNA (named A and B), and a naked icosahedral single-shelled capsid. Segment A encodes a 105 KDa pVP2-NS-VP3 polyprotein, which is cotranslationally processed and cleaved into the structural VP2 and VP3 viral proteins, and the NS viral protease (also known as VP4) [22]. This segment also encodes a 17 KDa non-structural protein called VP5 whose biological function still needs to be determined [23]. Segment B encodes VP1, the viral RNA-dependent RNA-polymerase (RdRp) [24]. Since VP2 elicits neutralizing antibodies and carries serotype-specific and group-specific antigenic determinants, this protein is important for the development of subunit vaccines, for diagnosis and for serological typing.
Different applications of FCM have been employed for this virus, both for the detection of the virus in different cells and for in vitro and in vivo viral replication studies; although in some of those studies FCM was used to determine the level of production of certain viral proteins, a quantitative approach of this technique has yet to be validated [17,20,25,26].
The objective of the present study has been the design and evaluation of a qFCM procedure for the analysis and quantification of VP2 proteins expressed in in vitro infected bluegill fry (BF-2) cells. We have also adapted the method for analysing RNA following intracellular sorting (MARIS) reported by Hrvatin et al. [27] for the simultaneous quantification of the viral RNA expression in infected cells.

2. Materials and Methods

2.1. Virus and Cell Line Employed

For this study, the IPNV West Buxton (WB) strain (ATCC VR-877) has been employed.
The BF-2 (Bluefin gill) cell line (ECACC # 00021712) was used for viral propagation. Cells were maintained at 20 °C in 25 cm2 flasks with Eagle’s Minimum Essential Medium (EMEM, Gibco, Thermofisher, Bilbao, Spain) supplemented with 10% foetal bovine serum (FBS) (Lonza, Madrid, Spain), penicillin (100 IU/mL) and streptomycin (0.1 mg/mL) (Lonza, Madrid, Spain).
For viral propagation and for the FCM assays described below, monolayers with around 80% confluence were inoculated with the virus at a multiplicity of infection (MOI) of 0.1–0.01 (or lower, in some experiments). After 1 h at 15 °C, the remaining inoculum was withdrawn, and the monolayers covered with fresh 2% EMEM (EMEM supplemented with 2% FBS and antibiotics) and incubated at 15 °C either until cytopathic effect (CPE) became extensive for the propagation of the virus, or during the corresponding time indicated for each assay.

2.2. Titration by Plaque and Endpoint Dilution Assays

For plaque assay titration, 6-well plates with 80% confluent BF-2 monolayer were employed. Ten-fold dilutions of the virus were inoculated in the wells (3 replicas per dilution, 200 μL per replica) and, after 1 h of adsorption at room temperature, the remaining inoculum was removed, and the monolayers overlaid with 2 mL of 1.2% low melting agarose (Pronadisa, Madrid, Spain) in 2%-EMEM. After 5 days of incubation at 15 °C, the monolayers were fixed for 1 h with a fixative solution composed of 25% formalin, 10% ethanol and 5% acetic acid, in phosphate-buffered saline (PBS). After fixation, the agarose overlay was removed, and the monolayers were stained with 1 mL of 5% crystal violet (Sigma, Madrid, Spain) in PBS. The wells were washed, the plaques counted, and the titre expressed as plaque forming units per millilitre (pfu/mL).
For the endpoint dilution titration assay, 96-well microtitre plates with BF-2 cells in 2%-EMEM were employed. Ten-fold dilutions of the virus were inoculated in the wells (3 replicas per dilution, 100 µL per replica) and the plates incubated at 15 °C for 1 week and examined for the presence of CPE. The titres were determined as tissue culture infection dose per millilitre (TCID50/mL) [28].

2.3. MARIS Staining and Fluorescence Activated Cell Sorting (FACS)

The MARIS staining procedure and FACS acquisition of positive infected cells [27] was adapted and optimized to sort IPNV infected BF-2 cells, using a monoclonal antibody against the VP2 protein and indirect labelling with a FITC conjugate. After viral infection in 25 cm2 flasks, the cells were dispersed using PBS and vigorous pipetting to detach them from the flask. After centrifugation at 500× g for 30 min, the supernatant was withdrawn, and the cells were fixed and permeabilized for 30 min at 4 °C with 4% paraformaldehyde (PFA, Panreac, Barcelona, Spain) and 0.1% saponin (Sigma-Aldrich, Madrid, Spain) solution in PBS supplemented with 1:100 RiboLock RNase inhibitor (Thermo Scientific, Bilbao, Spain). The cells were then centrifuged 5 min at 500× g and washed twice with a washing buffer: PBS supplemented with 0.2% bovine serum albumin (BSA), 0.1% saponin and 1:1000 RiboLock RNase inhibitor. Incubation with primary monoclonal antibody (anti-IPNV_VP2, IBT systems GmbH, Ertinger, Germany) was carried out in stain buffer (PBS, 1% BSA, 0.1% saponin and 1:100 RiboLock RNase inhibitor; Sigma-Aldrich, Madrid, Spain) during 60 min at room temperature. The cells were washed twice in washing buffer followed by secondary antibody staining (FITC conjugated goat anti-mouse antibody, Sigma-Aldrich, Madrid, Spain) for 45 min at room temperature in staining buffer. The cells were washed twice in wash buffer and resuspended in sort buffer containing 0.5% BSA and 1:1000 RiboLock RNase inhibitor in PBS. The sorting procedure was performed on a FACSAria (BD Biosciences, Madrid, Spain) using FACS Diva software.

2.4. Quantitative Flow Cytometry (qFCM) Assessment

Fluorescence data was exported to FlowJo Vx software and analysed in terms of forward light scattering (FSC) and side-light scattering (SSC) to gate cells from background noise. Single events were discriminated from cell aggregate gating events in plots of forward-light scattering area (FSC-A) against forward-light scattering signal height (FSC-H). Fluorescence parameters (in terms of arbitrary fluorescence intensity; AFI) were standardised in Molecules of Equivalent Soluble Fluorochrome (MESF) units by means of type IIIb standard microsphere beads [29] using a QuantumTM MESF Kit (Bangs Laboratories, Inc., Burlington, ON, Canada). Standard beads were resuspended in the same sort buffer in order to avoid pH-based differences between standards and samples. The standard beads were analysed on the same day of the cell samples analysis, according to the indications of the supplier. The AFI geometric mean of each bead population was recorded and the calibration curve resulting from the linear regression of the geometric mean channel number versus the expected MESF values of the corresponding beads provided a slope of MESF per fluorescence channels using the QuickCal v2.3 (Bangs Laboratories, Inc., Burlington, ON, Canada). The Mean of Fluorescence Intensity (MFI) was then calculated as MESF × percentage of infected cells. Once the threshold limit between positives and negatives was determined using negative controls (mock infected cells), positive cells (against IPNV VP2) were sorted and collected in sort buffer filled tubes.

2.5. RNA Isolation

The collected VP2-IPNV positive cells were pelleted by centrifugation for 30 min at 500× g and 4 °C. The supernatant was discarded and total RNA isolated using the kit Recover All Total Nucleic Acid Isolation (Ambion, Madrid, Spain), following the modified protocol described by Hrvatin et al., (2014). The concentration of the extracted RNA was quantified with a ND-1000 spectrophotometer (Nanodrop Technologies, Inc., Wilmington, CA, USA) and its quality was evaluated from the ratios A260/280 and A260/A230 as described by Sambrook et al. [30].

2.6. Quantitative RT-PCR

We have used a previously optimized reverse transcription-quantitative PCR (RT-qPCR) method for the absolute quantification of IPNV, using the RNA isolated from sorted cells. The RNA was transcribed to cDNA using SuperScript III (Invitrogen, Merelbeque, Belgium) for a 20 µL reaction volume. Briefly: 9 µL of RNA were mixed with 1 µL of random primers (Invitrogen, Merelbeque, Belgium), heated to 99 °C for 5 min and immediately cooled down to 4 °C. Then, 4 μL (5×) of First Strand Buffer, 1 μL dithiothreitol (DTT) (0.1 M), 1 μL of dNTPs (10 mM), 3.8 μL H2O and 0.2 μL Super Script III RT polymerase were added per reaction. The thermal profile continued with 10 min at 25 °C, 50 min at 50 °C and 5 min at 85 °C. Finally, the cDNA was maintained at 4 °C until use or stored at −20 °C. Real time PCR amplifications were performed in a Bio-Rad CFX96 (Bio-Rad Laboratories, Inc., Madrid, Spain) using 10 µL of 2x SYBR® Green Supermix (iQ SYBR® Green Supermix, Thermofisher, Bilbao, Spain), 500 nM of each primer (PP_WB 2370F, 5′-CAAGTTTGGCAGGCTCATCAG-3; PP_WB 2614R, 5′-CGTAGTCCTCGTACTCTTCTCC-3) and 2 µL of cDNA in a 20 µL final reaction, with the following thermal profile: 95 °C for 3 min, followed by 42 cycles of 95 °C for 15 s and 60 °C for 30 s, and a melting curve analysis of 55 °C to 95 °C with an increment of 0.2 °C for 10 s. Absolute quantification was performed using in vitro transcribed RNA standard from a cloned plasmid with a 364 bp fragment from RNA region 2317–2681 of reference strain WB [31].

2.7. Preliminary Optimization of the Assay and Evaluation of qFCM Reliability

In a preliminary approach, serial dilutions of the virus were inoculated in BF-2 cells and, after 24 h incubation, processed for qFCM as described above. After the threshold limit between positive and negative events was established using the mock infected cells, positive events with different levels of fluorescence were observed. The correlation between the MOI employed and the MFI was analysed by means of linear regression using Prism V5.0 (GraphPad Software, Inc., La Jolla, CA, USA). In addition, 100,000 cells were sorted for further RNA isolation and qPCR analysis, in order to test the method for recovering viral RNA from fixed BF2 positive cells described above.

2.8. Repeatability and Reproducibility of Quantitative Flow Cytometry Measurements

To assess the reliability of the qFCM in terms of repeatability and reproducibility of the fluorescent measurements, replicate assays were performed on three non-consecutive days (3 simultaneous replicas per day), using BF-2 infected cells (at a MOI of 0.1) and the standard beads as described before. Afterwards, the fluorescence data in terms of AFI, MESF and MFI were subjected to analysis of the coefficient of variation (CV) values.

2.9. Comparative Evaluation of Correlation between qFCM and Traditional Titration Methods

Ten-fold viral dilutions were inoculated in 25 cm2 flasks with semiconfluent BF-2 cells (approximate density 5 × 10⁵ cells/cm2). Adsorption was carried out at room temperature and, after 60 min, the inoculum was withdrawn and replaced by fresh 2%-EMEM. Infected cultures were kept during 24 h at 15 °C, and then the cells from each flask were collected and the fluorescence parameters quantified as described above. The same virus sample was titrated by two different procedures: plaque assay and end point dilution as described.

2.10. Assessment of VP2 Protein Expression during the IPNV Time Course Infection

Ten 25 cm2 cultured flasks were seeded with the same density of BF2 cells from a single 150 cm2 confluent monolayer. When the subcultured monolayers were semiconfluent, the virus was inoculated at a MOI of 0.1–0.01 and after 1 h of adsorption the monolayers were covered with 2%-EMEM and incubated at 15 °C for a maximum of 24 h. The cells were collected at the following post-infection (p.i.) times: 0 h p.i. (collected right after adsorption) and 4, 8, 12, 16, 20 and 24 h p.i. Mock infected cells (negative control of infection) were also collected at the end of the experiment. The cells were disaggregated, fixed and permeabilized as described above. The samples were maintained at 4 °C in washing buffer until all cells were collected, in order to incubate all the samples with the antibodies at once. Fluorescence values were analysed and recorded and then the positive cells were collected, and the RNA isolated as described previously. RNA copies (corresponding to the VP2 sequence) per IPNV infected cell were quantified and correlated with the VP2 fluorescence values in the MFI units. For this purpose, the Pearson correlation test was performed using GraphPad Prism version 5.00 (GraphPad Software, Inc., La Jolla, CA, USA).

3. Results

3.1. Optimization of the Procedure and Assessment of the Reliability of the Data

For the optimization of the procedure, and to evaluate its ability to discriminate between different viral concentrations, four multiplicities of infection (MOI) were tested (from 0.1 to 0.0001), and the correlation between the viral doses and the different parameters was assessed by regression analysis. As shown in Table 1, the percentage of infected cells decreased with the MOI and both parameters correlated significantly (R2 = 0.9882; Figure 1A). Using the obtained MESF data and the percentages of positive cells, the corresponding MFI values were calculated, which as expected also showed a significant correlation with the infected cells (R2 = 0.9682; Figure 1B).
In addition, the viral RNA was extracted from a number of positive cells and quantified by RT-qPCR to determine the number of RNA copies per cell. The total number of copies (per 100 cells) was calculated multiplying that value by the percentage of infected cells (Table 1). As shown in Figure 1C,D, a clear correlation was observed between either parameters (RNA copies per cell and per all positive cells) and the MFI values, following a second-degree regression with R2 values 0.9734 and 0.9998, respectively.

3.2. Repeatability and Reproducibility

To assess reliability in terms of repeatability and reproducibility, the procedure was tested with BF-2 infected cells (24 h p.i.), using three replicas to evaluate repeatability, and the assay was repeated in three different days to test reproducibility.
Since the MESF values of the normalized beads are provided by the manufacturer as standard units, their repeatability and reproducibility were evaluated using the observed AFI values. As shown in Table 2, the CV values corresponding to both repeatability and reproducibility were always below 10% (on all 3 days). In addition, the reliability of the standard curves was demonstrated by the high correlation values (R2 > 0.99) of the regression lines between the expected MESF (as indicated by the manufacturer) and the observed AFI values (Figure 2). In addition, the repeatability of the three fluorescence parameters (AFI, MESF, and MFI) of the IPNV infected cells was high, with CV values ≤ 7.2% in all cases. The same result was observed in the reproducibility of the AFI and MESF data; although, in the case of MFI the CV corresponding to reproducibility was slightly higher (CV = 11.5%; Table 2).

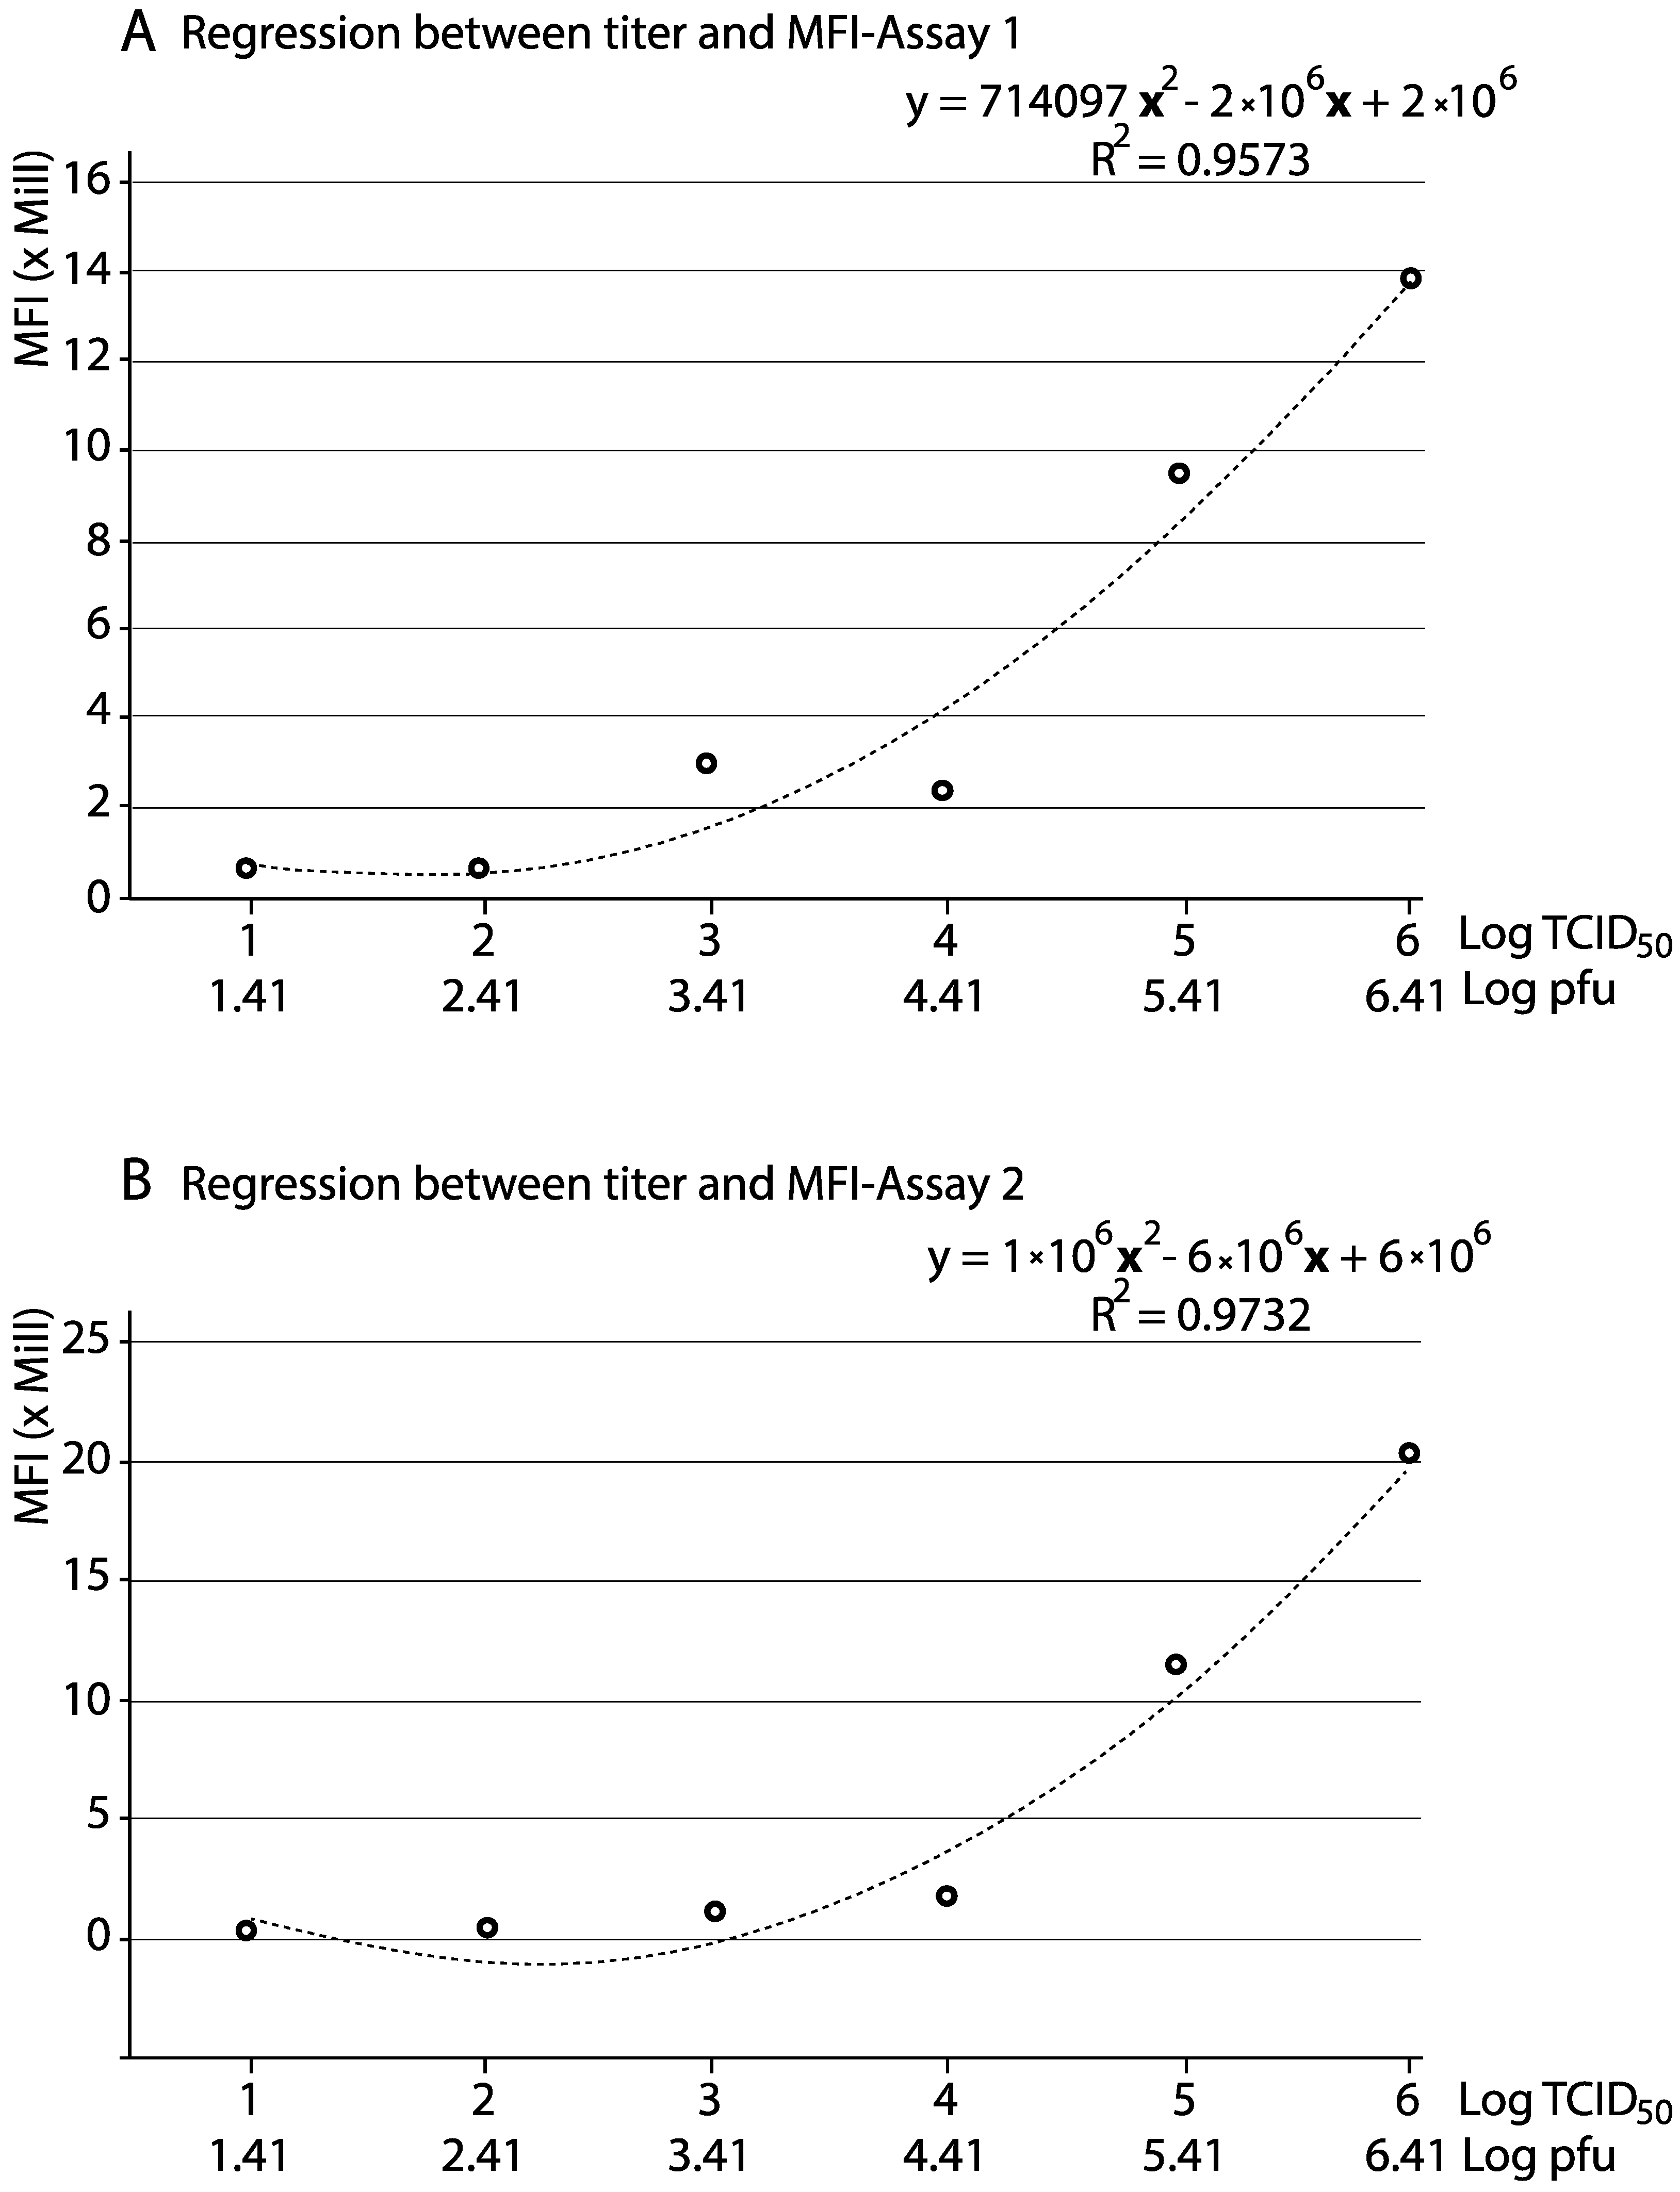
3.3. Reliability of the qFCM for Viral Titration

To evaluate the procedure for viral quantification, qFCM was applied using ten-fold dilutions of the virus (titrated by two methods: plaque forming units and endpoint dilution), and the results are shown in Table 3. Surprisingly, the MESF values corresponding to the lowest MOIs (0.00001 and 0.000001) were higher than the previous ones; however, this was corrected when the percentage of infected cells at each MOI was considered to calculate the MFI values.
On the other hand, a significant correlation (R2 = 0.9559, assay 1; R2 = 0.9577, assay 2) was observed between the viral titre and the percentage of infected cells, by a second-degree polynomial regression (y = 2.8979x2 − 6.7267x + 5466, assay 1; y = 3.3423x2 − 6.2588x + 4.229, assay 2) (data not shown). More importantly, a clear correlation between viral titres and the MFI values was observed, also by a second-degree polynomial regression (Figure 3).
Finally, to compare the limit of detection of qFCM with that of the traditional method involving virus isolation, the same viral dilutions employed in qFCM were subjected to re-isolation in BF-2, observing that re-isolation was not possible from the last dilution (corresponding to 101 TCID50/mL or 2.6 × 101 pfu/mL).

3.4. Quantification of the VP2 Protein Production and RNA Synthesis

To assess the use of this methodology to study the production of viral proteins and RNA synthesis during the replication of a virus, a time course experiment was designed to test the production of the VP2 protein in IPNV BF2 infected cells throughout the course of the in vitro infection. For that purpose, the absolute fluorescence per cell was quantified by qFCM testing FITC+ events; additionally, all sorted FITC+ (around 105 positive cells) were pelleted and subjected to RNA extraction and quantification by RT-qPCR to evaluate the RNA synthesis.
RNA production raised from around 102 copies per cell at 0 h p.i. (653.9 copies per positive cells; Table 4) to almost 3 × 10⁵ copies/cell 12 h p.i., coinciding with the peak of VP2 production. Then it experimented a small increase until 24 h p.i. (up to 3.7 × 10⁵ copies/cell) (Table 4 and Figure 4A). The intracellular VP2 fluorescent signal rose from 115073 MFI at 0 h p.i. to 1321944.9 at 24 h p.i., corresponding to an increase from 6.3 to 51.9% positive cells. As shown in Figure 4B, a peak of VP2 production was detected at 12 h p.i., coinciding with the maximum level of viral RNA (corresponding to the VP2 sequence) detected in the cells. Furthermore, a significant (R2 = 0.9514) second degree polynomial regression between RNA synthesis and VP2 protein production was observed (Figure 4C). In addition, we applied a Pearson correlation test to the FITC+ data, confirming that the increase of VP2 fluorescence positively correlates (Pearson’s r = 0.8913) with the RNA detected in the sorted positive cells. Although the linearity was weak, correlation was significant (α = 0.05), with p (two-tailed) = 0.0061, and the 95% confidence interval from 0.4201 to 0.9839.

4. Discussion

In addition to its use simply for viral detection, flow cytometry (FCM) has also been employed for studying the replication of fish viruses such as IHNV [17], Viral nervous necrosis virus [18], piscine orthoreovirus [19,21], and even for coinfections between IPNV and fish rhabdoviruses [20]. However, its use for quantitative purposes (qFCM) has never been validated for these viruses. Therefore, we designed a preliminary study to evaluate the reliability of qFCM to study viral replication, using IPNV as a model. In addition, we have adapted the FACS methodology described by Hrvatin and co-workers [27] for the quantification of viral replication in the positive sorted cells.
In the present study, prior to assessing the use of qFCM for the quantification of viral components, we first performed a preliminary test of the procedure to ensure its reliability and performance to discriminate between viral concentrations, and we have confirmed the correlation between viral doses (MOI) and fluorescence (MFI), and between these and the number of RNA copies in the positive cells. In addition, one of the main issues regarding the validation of a quantitative procedure is to ensure its repeatability and reproducibility. In this study, both parameters were first tested on the standard beads (which are used as reference to transform AFI into MESF), and they were demonstrated to be reliable based on the CV values below 10%—in all cases—and on the significant correlation values (R2 > 0.99). In the case of the IPNV infected cells (FITC+), repeatability and reproducibility were also high (CV ≤ 7.2%) in terms of MESF. However, in terms of MFI, the CV corresponding to reproducibility was slightly high (11.5%), probably due to the low repeatability observed on day 2 (CV = 17.4%: data not shown). Therefore, if a qFCM assay must be repeated on different days, the beads standard curve must be simultaneously repeated, in order to reduce the effect of the dispersion introduced by the system. On the other hand, because in general terms the procedure has been confirmed to be repeatable, the application of replicas is not needed when serial dilutions (or time course) are employed, since regression can be applied to confirm the reliability of the data. Otherwise—for single assays—the use of three replicas is mandatory.
The procedure was then tested for viral quantification, compared to the traditional methods by pfu and endpoint dilution. The results clearly demonstrated that for the quantification of virus, the use of MFI values from FITC+ events is appropriate given that a direct relationship between viral titres and MESF was observed. However, we must point out that such a relationship did not correspond to a linear regression, but to a second-degree polynomial function, mainly due to the lowest viral titres. To this regard, the 24 h incubation time applied without overlaying the monolayer (to avoid the progeny viruses spreading to primarily uninfected cells) cause secondary infection to contribute to the MFI data, providing higher values than expected at the lowest MOIs. And, in addition, the lower the MOI, the higher the effect on the MFI data. Another analysis of the data showed that the qFCM methodology was able to detect 2.6 × 101 pfu/mL (equivalent to 1 × 101 TCID50/mL), a viral concentration which could not be re-isolated in cell culture. This result is similar to that reported by Hammelund et al. [32], who stated that FCM was more that 10-fold more sensitive that pfu and isolation in cell culture. An important issue regarding the dynamic range of the quantification curves is that titres over 106 and below 101 did not fit into a regression with the data within the range, and therefore, they are not reliable (data not shown). The highest value of the range would be appropriate for field samples but not for crude viruses from cell cultures in most cases. Therefore, without having a clue on the titre of a sample, what we are doing at present to apply this technology is to use the original sample and a 10−4 or 10−5 dilution. If the titre obtained falls within the dynamic range of the standard curve (101–106), it is accepted as correct; otherwise, it is rejected. If both resulting titres fit into the dynamic range, an average titre is calculated.
Finally, the method was tested to study viral replication. For this purpose, the kinetic of expression of the VP2 protein during the first 24 h of the IPNV infection was studied by analyzing MFI from FITC+ events. In addition, in order to study the viral RNA production, the MARIS method described by Hrvatin et al. [27] was applied. The strength of the methodology comes from the high quality of the recovered RNA and the fact that it can be selected from specific cells (infected/non infected, or with initial/advanced levels of replication), which makes it possible to relate RNA and protein production. In the present study, the evolution of the in vitro IPNV infection of BF-2 cells was monitored during the first 24 h p.i., sampling each 4 h to monitor VP2 and RNA production. The results revealed evidence of the internalization of IPNV particles, since the cells analysed right after adsorption showed an increase of fluorescence with respect to the mock infected cells. Then, an important peak of VP2 production was observed 12 h p.i. Interestingly, this peak in VP2 production clearly coincides with that of RNA production, and we must highlight that the PCR primers were designed for the VP2 sequence. Similar results using fluorescence microscopy and monoclonal antibodies against VP2 have been previously reported by Espinoza et al., [33], who observed a high accumulation of large spherical clusters of VP2 proteins in a perinuclear location, strong signals first appearing at 8 h p.i. However, the most important result of this assay was the fact that we have demonstrated that the data from qPCR significantly correlated (R2 = 0.9514) with the RNA (VP2 sequence) production.
Therefore, the results from the present study support the use of this technology, not only for the quantification of optimal virus infectivity rate, but also to study viral replication from a quantitative approach.

Author Contributions

The authors have contributed as follows: Conceptualization, D.V., I.B., and C.P.D.; Methodology, D.V., C.L.-V., and C.P.D.; Validation, D.V., C.L.-V., and J.G.O.; Formal Analysis, D.V., C.L.-V., J.G.O., I.B., and C.P.D.; Investigation, D.V.; Resources, D.V. and C.P.D.; Data Curation, D.V., J.G.O., and C.P.D.; Writing—Original Draft Preparation, D.V.; Writing—Review & Editing, I.B. and C.P.D.; Supervision, C.P.D.

Funding

This research received no external funding.

Conflicts of Interest

The authors declare that they have no conflict of interest.

References

  1. Kürzinger, K.; Reynolds, T.; Germain, R.N.; Davignon, D.; Martz, E.; Springer, T.A. A novel lymphocyte function-associated antigen (LFA-1): Cellular distribution, quantitative expression, and structure. J. Immunol. 1981, 127, 596–602. [Google Scholar] [PubMed]
  2. Poncelet, P.; Carayon, P. Cytofluorometric quantification of cell-surface antigens by indirect immunofluorescence using monoclonal antibodies. J Immunol. Methods 1985, 85, 65–74. [Google Scholar] [CrossRef]
  3. Henderson, L.O.; Marti, G.E.; Gaigalas, A.; Hannon, W.H.; Vogt, R.F. Terminology and nomenclature for standardization in quantitative fluorescence cytometry. Cytometry 1998, 33, 97–105. [Google Scholar] [CrossRef] [Green Version]
  4. Maher, K.J.; Fletcher, M.A. Quantitative flow cytometry in the clinical laboratory. Clin. Appl. Immunol. Rev. 2005, 5, 353–372. [Google Scholar] [CrossRef]
  5. El Bilali, N.; Duron, J.; Gingras, D.; Lippe, R. Quantitative Evaluation of Protein Heterogeneity within Herpes Simplex Virus 1 Particles. J. Virol. 2017, 91. [Google Scholar] [CrossRef] [PubMed]
  6. Gill, M.A.; Liu, A.H.; Calatroni, A.; Krouse, R.Z.; Shao, B.; Schiltz, A.; Gern, J.E.; Togias, A.; Busse, W.W. Enhanced plasmacytoid dendritic cell antiviral responses after omalizumab. J. Allergy Clin. Immunol. 2018, 141, 1735–1743. [Google Scholar] [CrossRef] [PubMed]
  7. Schulze-Horsel, J.; Genzel, Y.; Reichl, U. Flow cytometric monitoring of influenza A virus infection in MDCK cells during vaccine production. BMC Biotechnol. 2008, 8, 45. [Google Scholar] [CrossRef] [PubMed]
  8. Zhou, Y.; Xie, Z.-G. High throughput screening of scFv antibodies against viral hemorrhagic septicaemia virus by flow cytometry. J. Virol. Method 2015, 219, 18–22. [Google Scholar] [CrossRef] [PubMed]
  9. Rodríguez, S.; Alonso, M.; Perez-Prieto, S.I. Detection of infections pancreatic necrosis virus (ipnv) from leukocytes of carrier rainbow trout Oncorhynchus mykiss. Fish Pathol. 2001, 36, 139–146. [Google Scholar] [CrossRef]
  10. Rodríguez Saint-Jean, S.; Vilas, P.; Palacios, M.; Pérez, S. Detection of infectious pancreatic necrosis in a carrier population of rainbow trout, Oncorhynchus mykiss (Richardson), by flow cytometry. J. Fish Dis. 1991, 14, 545–553. [Google Scholar] [CrossRef]
  11. Rodríguez Saint-Jean, S.; Borrego, J.J.; Pérez-Prieto, S.I. Comparative evaluation of five serological methods and RT-PCR assay for the detection of IPNV in fish. J. Virol. Method 2001, 97, 23–31. [Google Scholar] [CrossRef]
  12. Rønneseth, A.; Pettersen, E.F.; Wergeland, H.I. Flow cytometry assay for intracellular detection of infectious pancreatic necrosis virus (IPNV) in Atlantic salmon (Salmo salar L.) leucocytes. Fish Shellfish Immunol. 2012, 33, 1292e302. [Google Scholar] [CrossRef] [PubMed]
  13. Rønneseth, A.; Haugland, G.T.; Wergeland, H.I. Flow cytometry detection of infectious pancreatic necrosis virus (IPNV) within subpopulations of Atlantic salmon (Salmo salar L.) leucocytes after vaccination and during the time course of experimental infection. Fish Shellfish Immunol. 2013, 34, 1294–1305. [Google Scholar] [CrossRef] [PubMed]
  14. Garcia-Rosado, E.; Castro, D.; Cano, I.; Perez-Prieto, S.I.; Borrego, J.J. Serological techniques for detection of lymphocystis virus in fish. Aquat. Living Resour. 2002, 15, 179–185. [Google Scholar] [CrossRef]
  15. Alonso, M.; Stein, D.A.; Thomann, E.; Moulton, H.M.; Leong, J.C.; Iversen, P.; Mourich, D.V. Inhibition of infectious haematopoietic necrosis virus in cell cultures with peptide-conjugated morpholino oligomers. J. Fish Dis. 2005, 28, 399–410. [Google Scholar] [CrossRef] [PubMed]
  16. Qin, Q.W.; Gin, K.Y.-H.; Lee, L.Y.; Gedaria, A.I.; Sheng Zhang, S. Development of a flow cytometry based method for rapid and sensitive detection of a novel marine fish iridovirus in cell culture. J. Virol. Method 2002, 125, 49–54. [Google Scholar] [CrossRef] [PubMed]
  17. Alonso, M.; Rodriguez, S.; Perez-Prieto, S.I. Viral coinfection in salmonids: Infectious pancreatic necrosis virus interferes with infectious hematopoietic necrosis virus. Arch. Virol. 1999, 144, 657–673. [Google Scholar] [CrossRef] [PubMed]
  18. Chang, J.S.; Chi, S.C. GHSC70 Is Involved in the Cellular Entry of Nervous Necrosis Virus. J. Virol. 2015, 89, 61–70. [Google Scholar] [CrossRef] [PubMed]
  19. Finstad, Ø.W.; Dahle, M.K.; Lindholm, T.H.; Nyman, I.B.; Løvoll, M.; Wallace, C.; Olsen, C.M.; Storset, A.K.; Rimstad, E. Piscine orthoreovirus (PRV) infects Atlantic salmon erythrocytes. Vet. Res. 2014, 45, 35. [Google Scholar] [CrossRef] [PubMed] [Green Version]
  20. Rodriguez, S.; Alonso, M.; Perez-Prieto, S.I. Comparison of two birnavirus–rhabdovirus coinfections in fish cell lines. Dis. Aquat. Organ. 2005, 67, 183–190. [Google Scholar] [CrossRef] [PubMed]
  21. Wessel, Ø.; Olsen, C.M.; Rimstad, E.; Dahle, M.K. Piscine orthoreovirus (PRV) replicates in Atlantic salmon (Salmo salar L.) erythrocytes ex vivo. Vet. Res. 2015, 46, 26. [Google Scholar] [CrossRef] [PubMed] [Green Version]
  22. Pedersen, T.; Skjesol, A.; Jørgensen, J.B. VP3, a structural protein of infectious pancreatic necrosis virus, interacts with RNA-dependent RNA polymerase VP1 and with double-stranded RNA. J. Virol. 2007, 81, 6652–6663. [Google Scholar] [CrossRef] [PubMed] [Green Version]
  23. Julin, K. Infectious Pancreatic Necrosis Virus (IPNV)—Persistent Infections, Virulence and Antiviral Defence. Ph.D. Thesis, UiT The Arctic University of Norway, Tromsø, Norway, 2015. [Google Scholar]
  24. Duncan, R.; Mason, C.L.; Nagy, E.; Leong, J.A.; Dobos, P. Sequence analysis of infectious pancreatic necrosis virus genome segment B and its encoded VP1 protein: A putative RNA-dependent RNA polymerase lacking the Gly-Asp-Asp motif. Virology 1991, 181, 541–552. [Google Scholar] [CrossRef]
  25. Rønneseth, A.; Pettersen, E.F.; Wergeland, H.I. Neutrophils and B-cells in blood and head kidney of Atlantic salmon (Salmo salar L.) challenged with infectious pancreatic necrosis virus (IPNV). Fish Shellfish Immunol. 2006, 20, 610–620. [Google Scholar] [CrossRef] [PubMed]
  26. Rodríguez Saint-Jean, S.; de Las Heras, A.I.; Pérez-Prieto, S.I. The persistence of infectious pancreatic necrosis virus and its influence on the early immune response. Vet. Immunol. Immunopathol. 2010, 136, 81–91. [Google Scholar] [CrossRef] [PubMed]
  27. Hrvatin, S.; Deng, F.; O’Donnell, C.W.; Gifford, D.K.; Melton, D.A. MARIS: Method for analyzing RNA following intracellular sorting. PLoS ONE 2014, 9, e89459. [Google Scholar] [CrossRef] [PubMed] [Green Version]
  28. Reed, L.J.; Muench, H. A simple method of estimating fifty per cent endpoints. Am. J. Epidemiol. 1938, 27, 493–497. [Google Scholar] [CrossRef]
  29. Schwartz, A.; Marti, G.E.; Poon, R.; Gratama, J.W.; Fernández-Repollet, E. Standardizing flow cytometry: A classification system of fluorescence standards used for flow cytometry. Cytometry 1998, 33, 106–114. [Google Scholar] [CrossRef] [Green Version]
  30. Sambrook, J.F.; Russell, D.W. (Eds.) Molecular Cloning: A Laboratory Manual, 2nd ed.; Cold Spring Harbor Lab Press: Cold Spring Harbor, NY, USA, 2001; ISBN 0-87969-309-6. [Google Scholar]
  31. Vázquez, D.; Cutrín, J.M.; Olveira, J.G.; Dopazo, C.P. Design and validation of a RT-qPCR procedure for diagnosis and quantification of most types of infectious pancreatic necrosis virus using a single pair of degenerated primers. J. Fish Dis. 2016, 40, 1155–1167. [Google Scholar] [CrossRef] [PubMed]
  32. Hammarlund, E.; Amanna, I.J.; Dubois, M.E.; Barron, A.; Engelmann, F.; Messaoudi, I.; Slifka, M.K. A Flow Cytometry-Based Assay for Quantifying Non-Plaque Forming Strains of Yellow Fever Virus. PLoS ONE 2012, 7, e41707. [Google Scholar] [CrossRef] [PubMed]
  33. Espinoza, J.C.; Hjalmarsson, A.; Everitt, E.; Kuznar, J. Temporal and subcellular localization of infectious pancreatic necrosis virus structural proteins. Arch. Virol. 2000, 145, 739–748. [Google Scholar] [CrossRef] [PubMed]
Figure 1. Correlation between multiplicity of infection (MOI), infected cells, Mean of Fluorescence Intensity (MFI) and RNA molecules. Each data corresponds to a single data point. (A) Regression between MOI and percentage of infected cells; (B) Regression between MOI and MFI; (C) Regression between MFI and viral RNA copies per cell; (D) Regression between MFI and viral RNA copies per positive cells. In graphs with 2 equations, the first one corresponds to a regression line equation (and R2 value) using the values shown on both axes; the second one corresponds to a regression line equation (and R2 value) using logarithm of the values shown on both axes. Dashed lines: regression curves.
Applsci 08 01734 g001
Figure 2. Repeatability and reproducibility. Linear regression between the observed fluorescence (AFI) and the expected MESF reported by the manufacturer of the beads employed as standard.
Applsci 08 01734 g002
Figure 3. Reliability of qFCM for viral titration. Second degree polynomial regression between the viral titre (in pfu and TCID50) and fluorescence (in MFI). Each data corresponds to a single data point.
Applsci 08 01734 g003
Figure 4. Quantification of VP2 protein production and RNA synthesis. The kinetics of RNA synthesis (A) and VP2 protein production (B) were studied in the first 24 h of viral replication in BF-2 cells. In addition, the correlation between both has been assessed (C). Each data corresponds to a single data point.
Applsci 08 01734 g004
Table 1. Preliminary assays to evaluate the performance of the method for discrimination between different virus concentrations.
Fluorescence ParametersViral RNA
Sample% +Cells 1AFI 2MESF 3MFI 4Per Cell 5Per All +Cells 6
FITC+
MOI 0.165.401025373,69624,439,718.4402,80726,343,577.8
MOI 0.018.8134,962919,6988,102,539.438,615340,198.2
MOI 0.0011.8245372,386,7614,343,905.033,10460,249.3
MOI 0.00010.12211,2666,912,796829,535.521,6752601.0
1 % +Cells: Percentage of positive cells; 2 AFI: arbitrary fluorescence intensity units (geometric mean values); 3 MESF: Molecules of Equivalent Soluble Fluorochrome units, normalized with respect to the negative control (C-MOCK, Mock infected cells); 4 MFI: Mean Fluorescence Intensity of the infected cells, calculated multiplying the MESF data by the corresponding percentages of infected cells; 5 Number of RNA copies per cell determined by RT-qPCR using in vitro transcribed viral RNA as standard; 6 Number of RNA copies per all positive infected cells. Each data corresponds to a single data point.
Table 2. Repeatability and Reproducibility.
Repeatability Day 1
AFIMESF
Replica 1Replica 2Replica 3MeanSDCVReplica 1Replica 2Replica 3MeanSDCV
Beads
B115.0715.1415.3915.200.171.11929 192900
B236.1036.3037.3936.600.701.98750 875000
B3127.85127.91134.23130.003.672.834,864 34,86400
B4406.90425.17463.92432.0029.126.7127,311 127,31100
B51197.541219.181325.491247.4068.495.5421,992 421,99200
Samples
Blank102.50105.80112.70107.005.204.923,579.6224,483.9626,391.8624,818.481435.665.8
C-MOCK140.20131.50145.40139.037.025.134,205.2431,699.1935,717.2333,873.882029.416.0
FITC +1647.401656.801795.201699.8082.754.9638,252.09642,579.82706,821.61662,551.1738,400.905.8
Repeatability Day 2
AFIMESF
Replica 1Replica 2Replica 3MeanSDCVReplica 1Replica 2Replica 3MeanSDCV
Beads
B118.4117.0517.6417.700.683.91929 192900
B238.6736.7238.0137.800.992.68750 875000
B3152.00129.09117.91335.007.915.934,864 34,86400
B4457.93487.65449.49465.0220.044.3127,311 127,31100
B51495.671410.551263.891390.04117.248.4421,992 421,99200
Samples
Blank96.5195.5990.9394.302.993.220,011.719,785.4418,645.6319,480.93732.183.8
C-MOCK178.71145.90130.96151.9024.4316.141,586.3832,686.3528,751.9334,341.556575.3719.1
FITC +1847.761949.351761.121852.70133.107.2665,827.32709,507.84628,507.58668,087.5840,337.946.0
Repeatability Day 3
AFIMESF
Replica 1Replica 2Replica 3MeanSDCVReplica 1Replica 2Replica 3MeanSDCV
Beads
B116.6916.2815.3416.100.694.31929 192900
B241.1938.9337.4839.201.874.88750 875000
B3145.51130.46128.15135.0410.007.434,864 34,86400
B4490.08543.75434.09489.3144.849.2127,311 127,31100
B51560.611544.341314.781473.24137.479.3421,992 421,99200
Samples
Blank135.17135.82128.07133.004.33.229,451.7929,615.9227,667.3228,911.681080.773.7
C-MOCK184.52186.45169.11180.019.505.342,236.1942,748.3638,177.8446.032.392504.076.1
FITC +1980.121906.031818.851901.7080.724.2660,066.13631,542.06598,203.17629,937.1230,962.694.9
Reproducibility
Day 1AFIMESF
BeadsAFIMESFAFIMESFAFIMESFMeanSDCVMeanSDCV
B115.21929.017.71929.016.11929.016.331.37.81929.000.000.00
B236.68750.037.88750.039.28750.037.871.33.48750.000.000.00
B3130.034,864.0133.034,864.0135.034,864.0132.672.51.934,864.000.000.00
B4432.0127,311.0465.0127,311.0489.0127,311.0462.0028.86.2127,311.000.000.00
B51247.4421,992.01390.0421,992.01473.0421,992.01370.23114.28.3421,992.000.000.00
Blank107.0024,818.4894.3419,480.93133.0228,911.68111.4519.717.724,403.694729.019.4
C-MOCK139.0333,818.88151.8634,341.55180.0341,054.13156.9721.013.434,215.674017.311.7
FITC+1699.80662,551.171852.74668,087.581901.67629,937.121818.07105.35.8635,525.2920,614.73.2
(MFI) (24,050,607.6) (25,387,328.0) (29,859,019.5) (26,432,318.4)(3,041,943)(11.5)
AFI, arbitrary fluorescence intensity units (geometric mean values); MESF, Molecules of Equivalent Soluble Fluorochrome units; SD, Standard deviation; CV, Coefficient of variation (SD/average × 100); C-MOCK, Negative control (Mock infected cells); MFI, Mean Fluorescence Intensity of the infected cells.
Table 3. Reliability of the qFCM for viral titration.
Inoculated Virus 1Assay 1Assay 2
MOITCID50/mLpfu/mL% +Cells 2AFI 3MESF 4MFI 5% +Cells 2AFIMESFMFI
0.11 × 1062.6 × 10666.47901206,11213,685,836.882.65761241,27619,929,423.9
0.011 × 1052.6 × 10554.16641173,3149,376,287.467.84154166,50211,288,862.9
0.0011 × 1042.6 × 10413.36967181,8012,417,953.323.7165558,628.71,389,500.3
0.00011 × 1032.6 × 10317.66344165,5812,914,225.618.6139548,297.5898,333.3
0.000011 × 1022.6 × 1021.8713,615324,712607,211.42.6387428,418.974,741.8
0.0000011 × 1012.6 × 1011.9711,188291,618574,487.52.7696331,72387,555.6
1 Titrated by endpoint dilution (TCID50) and plaque forming units (pfu); 2 % +Cells, Percentage of positive cells; 3 AFI, arbitrary fluorescence intensity units (geometric mean values); 4 MESF, Molecules of Equivalent Soluble Fluorochrome units, normalized with respect to the negative control (C-MOCK, Mock infected cells); 5 MFI, Mean Fluorescence Intensity of the infected cells, calculated multiplying the MESF data by the corresponding percentages of infected cells. Each data corresponds to a single data point.
Table 4. Time course experiment: VP2 production and RNA synthesis.
Time p.i. 1% +Cells 2MESF 3MFI 4RNA/Cell 5RNA/+Cells 6
0 h6.318,179115,073.1103.3653.9
4 h11.019,647216,117.0615.56770.6
8 h26.834,673929,236.424,000.5643,213.7
12 h43.734,2061,494,802.2297,121.512,984,209.8
16 h32.625,698837,754.8319,035.610,400,561.0
20 h38.523,221894,008.5250,950.89,661,604.2
24 h51.925,4711,321,944.9370,657.119,237,102.3
1 Time (in hours) post infection of cell monolayers; 2 Percentage of positive cells; 3 MESF, Molecules of Equivalent Soluble Fluorochrome units, normalized with respect to the negative control (C-MOCK, Mock infected cells); 4 MFI, Mean Fluorescence Intensity of the infected cells, calculated multiplying the MESF data by the corresponding percentages of infected cells; 5 Number of RNA copies per cell determined by RT-qPCR using in vitro transcribed viral RNA as standard; 6 Number of RNA copies per all positive infected cells (considering the percentage of positive cells). Each data corresponds to a single data point.

