Abstract
The effects of doping antimony oxides (Sb2O3/Sb2O5) on the ferroelectric/piezoelectric and energy-harvesting properties of 0.99Pb(Zr0.53Ti0.47)O3–0.01BiYO3 (PZT–BY) have been studied. The feasibility of doping Sb2O3 and Sb2O5 into the PZT–BY ceramics has also been compared by considering factors such as sintering condition, grain size, density, and electrical properties etc. This work discusses a detailed experimental observation using Sb2O3, because Sb2O5 is relatively expensive and does not follow the stoichiometric reaction mechanism when doped in PZT–BY. The Sb2O3-doped specimens were well sintered by oxygen-rich sintering and reached a maximum density of 99.1% of the theoretical value. X-ray diffraction (XRD) analysis showed a complete solid solution for all the specimens. Scanning electron microscope (SEM) observation revealed that the addition of Sb2O3 inhibits grain growth, and exhibits a denser and finer microstructure. The 0.1 moles of Sb2O3-doped ceramic shows a sharp decrease in the dielectric constant (ε33T = 690), while the piezoelectric charge constant (d33) and electromechanical coupling factor (kp) maintained high values of 350 pC/N and 66.0% respectively. The relatively higher value of d33 and lower ε33T of the 0.99Pb(Zr0.53Ti0.47)O3–0.01Bi(Y0.9Sb0.1)O3 ceramic resulted in an optimum value of piezoelectric voltage constant (g33 = 57.4 × 10⁻³ Vm/N) and a high figure of merit (d33 × g33 = 20075 × 10−15 m2/N). These values are high compared to recently reported works. Therefore, Sb2O3-doped PZT–BY ceramic could be a promising candidate material for the future study of power-harvesting devices.
1. Introduction
The use of renewable energy from different technologies to make a contribution to the world’s total energy supply has grown fast. Among different energy conversion technologies, piezoelectric energy-harvesting has received considerable attention for powering small electronic components. The piezoelectric effect is a unique property that allows materials to convert mechanical energy to electrical energy or vice versa. Piezoelectric material selection is crucial in the design of piezoelectric energy harvesters. Numerous researchers are working in this area, but most of the solutions being employed have low power (nW) and high frequency [1,2]. Among the various piezoelectric materials, lead zirconate titanate (PZT) based ceramic is one of the most widely used because of its fast electro-mechanical response, relatively low power requirements, high generative force, and inherent durability [3,4,5,6,7]. Extensive research and development of PZT-based ceramics have been conducted to find such piezoelectric materials [1,7,8,9,10]. A variety of parameters is used to compare piezoelectric materials for energy-harvesting, such as electromechanical coupling factor, piezoelectric charge constant, output voltage, power density, energy-conversion efficiency, and cost and frequency of operation. Among them, energy-conversion efficiency is the most important when designing piezoelectric energy harvesters for real applications [11]. Xu et al. proposed a new figure of merit (FOM), which combines the transduction efficiency and the energy-conversion capacity, for comparing piezoelectric materials for energy-harvesting applications [11]. Priya et al. proposed a FOM for a polycrystalline piezoelectric energy-harvesting device, which can be expressed by the following Equations (1) and (2) [12]:
where d is the piezoelectric charge constant, g is the piezoelectric voltage constant, ε33T is the dielectric permittivity, F is the applied force, and A is the area.
u = 1/2 (d.g) (F/A)2
g = d/ε33T
According to Equations (1) and (2), a material with a high d and a lower ε33T will generate high FOM. In general, the piezoelectric charge constant and the dielectric constant increase or decrease concurrently upon modification with dopants or processing techniques [7,8,9,10]. However, by modifying the fabrication technique and choosing suitable dopants, it is possible to produce high d33 with low ε33T. Previous work has reported on such a piezoelectric ceramic composition of (1 − x)Pb(Zr0.53Ti0.47)O3–xBiYO3 [PZT–BY] and its fabrication process [13].
In the present study, PZT–BY composition is further tuned using antimony oxide (both Sb2O3 and Sb2O5) to improve the FOM. The Sb2O3- and Sb2O5-doped PZT has had a long history whereby Sb2O3/Sb2O5 was doped with other oxides for tailoring piezoelectric/dielectric properties [14,15,16,17,18,19,20,21,22]. Lonker et al. reported a high electrical output in the lanthanum-doped Pb(Ni1/3Sb2/3)–PbZrTiO3 system which was comparable to the PZT type 5A [16]. Zhou et al. reported a high electrical output in the Sb2O3-doped Pb(Zr0.54Ti0.46)O3 system [14]. They explained that the ionic radius of Sb3+ is smaller than that of other trivalence “soft” ions; this may be the most important factor for improving the piezoelectric activity. S. Zahi et al. reported a high electromechanical coupling factor and dielectric constant with relatively higher Tc in the xPbZrO3–(90 − x)PbTiO3–10Pb(Ni1/3, Sb2/3)O3 ternary system [17]. Dutta et al. studied the structural and electrical properties of Sb3+-modified [Pb0.92(La1−zSbz)0.08(Zr0.65Ti0.35)0.98]O3 (PLZT) ceramics and provided some interesting ferroelectric and sensing properties [20,21]. Furthermore, Zhou et al. studied the effect of doping Sb2O3 in Pb(Zr0.54Ti0.46)O3 and obtained an optimum value of piezoelectric activity with d33 = 570 × 10−12 C/N and piezoelectric voltage constant, g33 = 32 × 10−3 Vm/N [14].
In this work, the effects of doping Sb2O3 and Sb2O5 on 0.99Pb(Zr0.53Ti0.47)O3–0.01Bi[Y(1−x)Sbx]O3 (abbreviated as PZT–BYS(x) from now on, where 0 ≤ x ≤ 0.6) ceramics have been compared in terms of sintering condition and piezoelectric/dielectric properties. Based on comparative studies, Sb2O3 is selected as a dopant into the PZT–BYS(x) system. Therefore, detailed experimental observations of Sb2O3 doping into PZT–BYS(x) regarding piezoelectric/dielectric, ferroelectric and energy-harvesting properties are evaluated and discussed.
2. Materials and Methods
At the first stage, a precursor of PbZr0.53Ti0.47O3 (PZT) and Sb2O3/Sb2O5-doped BiY1−xSbxO3 [BYS(x), where x = 0.0, 0.1, 0.2, 0.3, 0.4, 0.5, 0.6] was prepared by a conventional solid state method. In the final stage, the precursors of PZT and BYS(x) was mixed stoichiometrically to fabricate 0.99Pb(Zr0.53Ti0.47)O3–0.01Bi[Y(1−x)Sbx]O3 (abbreviated as PZT–BYS(x)) containing various amounts of Sb2O3/Sb2O5 (0 ≤ x ≤ 0.6). The pre-synthesis method was considered for the fabrication of PZT–BYS(x) to eliminate the effects associated with the direct co-doping. The stoichiometric amount of the analytical reagent (AR) grade Bi2O3 (99.9%, High Purity Chemicals, Japan), Sb2O3 (99.9%, High Purity Chemicals, Japan) and Y2O3 (99.9%, High Purity Chemicals, Japan) were weighed to synthesize Bi(Y1−xSbx)O3 [BYS(x)] (where, x = 0.0, 0.1, 0.2, 0.3, 0.4, 0.5, 0.6). The BYS(x) was then ball milled in distilled water using a ZrO2 media for 24 h. The same specimens of BYS(x) were also prepared by using Sb2O5 (99%, Samchun Pure Chemical, Mokock-dong Pyeongtaek, Korea). According to the thermogravimetric and differential scanning calorimetry (TG/DSC-Mettler Toledo) analysis, both Sb2O3 and Sb2O5-doped BYS(x) powders were calcined at 800 °C for 2 h in alumina crucibles. A detailed synthesis process of Pb(Zr0.53Ti0.47)O3 (PZT) and BiYO3 (BY) were described in previous work [13]. The pre-synthesized PZT and BYS(x) powders were weighed according to reaction stoichiometry to fabricate PZT–BYS(x), and ball-milled for 72 h. The dried powders were pressed as a disk of 15 mm diameter and then cold isostatically pressed (CIP) under a pressure of 147.2 MPa. The pressed pellets were sintered at various temperatures between 1050 °C and 1250 °C in air and an oxygen (O2) rich atmosphere. An equimolar mixture of PbO and ZrO2 inside a covered alumina crucible was used to limit PbO loss from pellets during sintering. The sintered specimens were then polished to obtain parallel surfaces and suitable dimensions (diameter/thickness ≥15) to estimate the piezoelectric properties.
The specimens were characterized using an X-ray diffractometer (XRD, D/Max-2500H, Rigaku, Tokyo, Japan and D8 advance, Bruker, Karlsruhe, Germany) with Cu Kα radiation after sintering. The morphologies and the microstructures for all of the powders and sintered samples were investigated using a scanning electron microscope (Hitachi S-2400, Tokyo, Japan). In order to measure the electrical properties, we used silver paste to form electrodes on both sides of the sample, which was then fired at 560 °C for 30 min. For investigating the proper poling conditions, we poled each specimen in stirred silicon oil at 120 °C by applying a DC electric field of 3–6 kV/mm for 45 min; subsequently, the sample was aged at 120 °C for 3 h. The dielectric and the piezoelectric properties of the aged samples were then measured and evaluated. A preliminary study indicated that the spontaneous polarization was fully saturated under a DC electric field of 4 kV/mm. Therefore, the optimum poling voltage was chosen as 4.0 kV/mm. A standard deviation of the electric properties could exist in the measured samples, so five specimens were prepared for each batch and tested. The piezoelectric coefficient was determined using a d33 meter (IACAS, Model ZJ-6B, Bolingbrook, IL, USA), and the electromechanical and the dielectric properties were calculated by using a resonance/anti-resonance measurement method [15] and an impedance/gain phase analyzer (HP-4194A, Palo Alto, CA, USA). The temperature dependences of the dielectric constant and the dissipation factor over the temperature range from −25 to 500 °C were measured using an automated system at 1 kHz, in which an HP-4194A and temperature-control box (−40 °C to 150 °C: Delta 9023 chamber, 150–500 °C: Lindberg tube furnace) were controlled by using a computer system. The temperature was measured using a Keithley 740 thermometer via a K-type thermocouple mounted on the samples. The polarization-electric field (P-E) behavior was determined using a Precision LC system (Radiant Technology, Model: 610E, Walden, NY, USA).
3. Results and Discussion
3.1. X-ray Diffraction (XRD) Analysis of Pre-Synthesized PZT and Bi[Y(1−x)Sbx]O3
Figure 1a,b shows the X-ray diffraction (XRD) patterns of pre-synthesized Sb2O3-doped Bi[Y(1−x)Sbx]O3 [BYS(x)] (where x = 0.0, 0.1, 0.2, 0.3, 0.4, 0.5 and 0.6) and Pb(Zr0.53Ti0.47)O3 [PZT], respectively. For clarity, only Sb2O3-doped BYS(x) is presented here. The reaction mixture of BYS(x) was characterized by thermogravimetry and differential scanning calorimetry (TG–DSC) to locate the formation temperature. Based on the TG–DSC analysis, undoped BiYO3 (BY) and PZT was calcined at 850 °C, whereas both Sb2O3 and Sb2O5-doped BY was calcined at 800 °C for 2 h. In Figure 1a it can be seen that the major phase formed for the BYS(x) could be related only to the diffraction peak given for BiYO3 (JCPDS No. 271047). However, a tiny peak of Y3Sb5O12 [JCPDS No. 0430160], Bi2O3 [JCPDS No. 0270052], Y2O3 [JCPDS No. 0431036], and BiSbO4 [JCPDS No. 0480469] was observed in the XRD patterns. Moreover, it can be seen that the intensity and the number of second phases increase with increasing Sb2O3 content. Therefore, the XRD studies indicate that the solubility of Sb2O3 in BY is limited to a certain range. According to Shannon’s effective radius [23], Y3+ and Sb3+ with a coordination number of six have radii of 0.90 and 0.76 Å, respectively. The difference in radii between Y3+ and Sb3+ ions is greater than 15%. Therefore, it is not easy for Sb3+ to enter into Y3+, and the solubility of Sb3+ in the system would be limited. On the other hand, the calcined PZT powder was fully stabilized to the perovskite structure (JCPDS No. 01-070-4264) without any second phases.
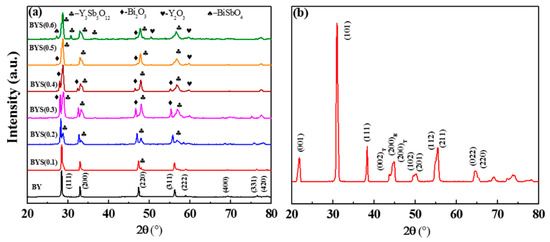
Figure 1.
X-ray diffraction (XRD) patterns of (a) Sb2O3-doped Bi[Y1−xSbx]O3 and (b) Pb(Zr0.53Ti0.47)O3 calcined at different temperatures.
3.2. Comparative Study of Sb2O3 and Sb2O5 Doping on the PZT–BY System
0.99Pb(Zr0.53Ti0.47)O3–0.01Bi[Y(1−x)Sbx]O3 (abbreviated as PZT–BYS(x) from now on, where x = 0.0, 0.1, 0.2, 0.3, 0.4, 0.5, and 0.6 moles) ceramics were sintered in air and an O2-rich atmosphere to investigate the Sb2O3 and Sb2O5-doping effects on the microstructure and electrical properties. Figure 2 shows the microstructure for the fracture surfaces of Sb2O3 and Sb2O5-doped PZT–BYS(0.1) ceramic sintered at 1170 °C in different sintering atmospheres. In addition, the piezoelectric, dielectric, ferroelectric and energy-harvesting parameters of same specimens have been listed in Table 1. From Table 1, it is clear that the piezoelectric properties of Sb2O5-doped specimens sintered in an air atmosphere and Sb2O3-doped specimens sintered in an O2-rich atmosphere show higher values than the Sb2O3-doped specimen sintered in air. It may be considered that the presence of oxygen during sintering reduced the porosity and resulted in dense microstructures. Therefore, among other reasons like pre-synthesis, doping, etc., sintering in an oxygen-rich atmosphere is an essential factor for relatively higher piezoelectric properties as well as higher FOM.
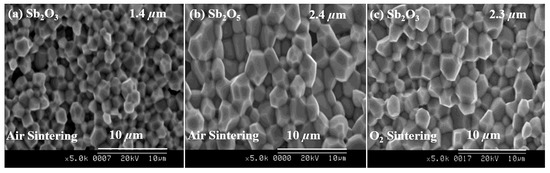
Figure 2.
SEM (Scanning Electron Microscope) images of the fracture surface of Sb2O3 and Sb2O5-doped PZT–BYS(0.1) ceramics sintered in different atmospheres (sintered temperature 1170 °C). PZT-BYS: 0.99Pb(Zr0.53Ti0.47)O3–0.01Bi[Y(1−x)Sbx]O3.

Table 1.
The piezoelectric, dielectric and energy-harvesting parameters of Sb2O3 and Sb2O5-doped PZT-BYS(0.1) ceramics sintered in air and in an O2-rich atmosphere. PZT-BYS: 0.99Pb(Zr0.53Ti0.47)O3–0.01Bi[Y(1−x)Sbx]O3.
In Figure 2, uniform, fine-grained, and almost pore-free microstructures can be seen for Sb2O5-doped specimens when sintered in the air atmosphere and for Sb2O3-doped samples when sintered in the O2-rich atmosphere. On the other hand, Sb2O3-doped specimens sintered in the air have small (approx. 1.4 µm) and loosely bonded grains. Since the dielectric properties are directly associated with grain size, the air-sintering of the Sb2O3 sample has a smaller average grain size and shows a higher value of ε33T. A similar observation was also explained by Uchino et al. [24]. Subsequently, higher ε33T produces a lower FOM according to Equation (1), therefore, doping Sb2O3 and sintering in the presence of air is not favorable or advantageous in the present case. On the contrary, Sb2O5 is relatively expensive and does not follow the stoichiometric reaction mechanism when doped in PZT–BY. Therefore, according to the experimental results and discussions above, Sb2O3 is considered as a substituent for Y3+ in the PZT–BYS(x) and also an O2-assisted sintering atmosphere was selected. Hence, a detailed analysis of the crystal structure, microstructure, piezoelectric/dielectric properties, and ferroelectric properties of the Sb2O3-doped PZT–BYS(x) specimens sintered in the O2 atmosphere will be discussed in the next sections.
3.3. Effects of Pre-Synthesized BYS(x) Content on the Densities of PZT–BYS(x) Ceramics
Figure 3 shows the density of PZT–BYS(x) ceramics sintered at various temperatures as a function of Sb2O3 content. It is well known that electrical properties are directly related to density. Therefore, a detailed experiment was conducted to find out the optimum sintering temperature at which these ceramics reached their maximum density. From Figure 3, it is clear that the ceramics are well sintered to high densities between 1150 and 1170 °C. At x = 0.1–0.3, PZT–BYS(x) ceramics showed the highest density at about 1150 °C. At x = 0.4–0.6, the density reached its maximum at 1170 °C. As the piezoelectric and dielectric properties are closely related to the microstructure, and sintered density, a detailed investigation of crystal structure, microstructure, piezoelectric/dielectric and ferroelectric properties of PZT–BYS(x) ceramics sintered at their optimum temperature will be considered and discussed in the next sections.
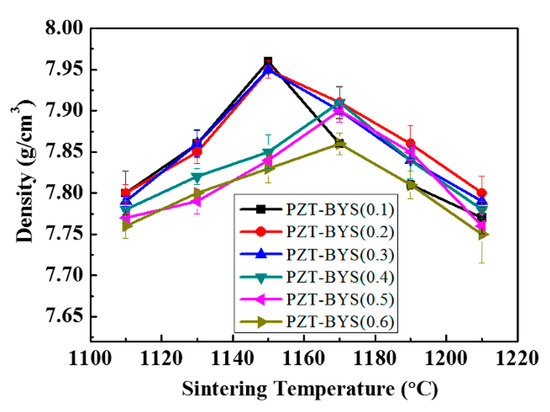
Figure 3.
Density of PZT–BYS(x) ceramics sintered in an O2-rich atmosphere at different temperatures.
3.4. Effects of Pre-Synthesized BYS(x) on the Crystal Structure and Microstructure of PZT–BYS(x) Ceramics
The XRD patterns of PZT–BYS(x) ceramics sintered at their optimum temperatures are shown in Figure 4a. In these patterns, no detectable traces of the pyrochlore or other impurities were observed. Additionally, asymmetry and/or peak splitting in 111 and 200 reflections indicate all of the compositions are exhibiting rhombohedral–tetragonal phase coexistence [14,15,17]. Quantitative analysis of possible change in relative phase fraction as a function of BYS is not within the scope of this work. Nevertheless, the enlarged XRD patterns in Figure 4b indicated that the decrease in 002 reflection with an increasing amount of Sb2O3 is possibly related to the decrease in volume fraction of the long c-axis of the tetragonal unit cell.
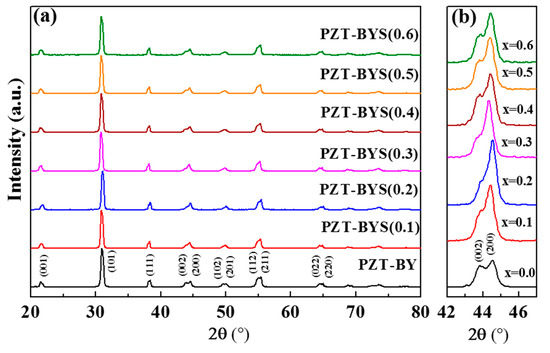
Figure 4.
(a) X-ray diffraction patterns of Sb2O3-doped PZT–BYS(x) (0.1 ≤ x ≤ 0.6) ceramics sintered at optimum temperature for 2 h, and (b) enlarged portion of XRD at a selected 2θ angle.
Figure 5 shows the microstructures of the fracture surface containing various amounts of Sb2O3 content sintered at an optimum temperature at which maximum density was obtained. A significant change in grain size was observed with the addition of Sb2O3. The microstructures of the sintered samples are uniform, dense and consistent with the measured density. In the previous work, it was reported that the addition of a small amount of BY abruptly decreases the grain size of PZT due to the pinning effect of the second phase [13]. In the present case, the addition of Sb2O3 doping on PZT–BYS(x) shows a further decrease in grain size. The average grain size of specimens is decreased with the increasing amount of Sb2O3. From Figure 5b, it can be seen that the microstructure of the specimen doped with 0.1 moles of Sb2O3 shows higher uniformity with fine grain size, and an average grain size of 2.2 µm was observed. On further addition of Sb2O3 content, as shown in Figure 5c–g, the average grain size abruptly decreased to approximately ~1.7 µm at x = 0.2–0.3 moles and approximately 1.4 µm for x = 0.4–0.6 moles. This reduction of grain size can be interpreted as a pinning effect of the secondary phases (Y3Sb5O12, Bi2O3, Y2O3, and BiSbO4) as indicated in XRD patterns in Figure 1a.
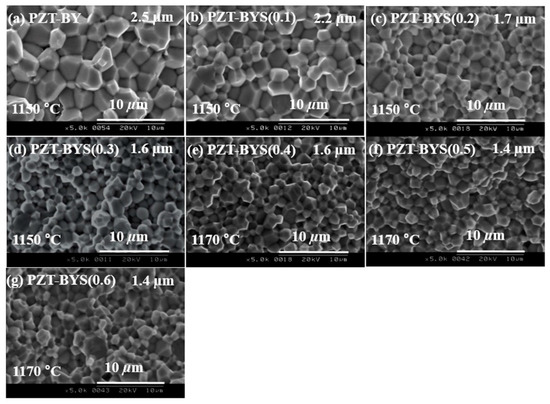
Figure 5.
SEM images of fracture surface of Sb2O3-doped PZT–BYS (0.0 ≤ x ≤ 0.6) specimens sintered at optimum temperature.
The optimized density of sintered PZT–BYS(x) ceramics is listed in Table 2. The relative densities of the Sb2O3-doped specimens were higher than 98% of the theoretical density, indicating the development of dense microstructure in all of these compositions. However, it can be observed that the compositions with x = 0.1 show relatively higher density than other compositions. This may be attributed to the relatively uniform grain size with scarcer porosity at x = 0.1, which promotes densification. Further addition of Sb2O3 into the compositions decreases the density again. The SEM investigations, as in Figure 5, revealed supporting evidence that the ceramics with higher Sb2O3 (x > 0.1 moles) compositions contain small and loosely bonded grains. Evidently, this could be a reason for the much lower density of these compositions. Among all the compositions, a peak density of 7.96 g/cm3 (99.1% of the theoretical density) was obtained at x = 0.1.
Table 2.
The ferroelectric, dielectric and piezoelectric properties of the PZT–BYS(x) ceramics at the optimum sintering temperature.
3.5. The Piezoelectric and Dielectric Properties of PZT–BYS(x) Ceramics
Figure 6a,b shows the effects of Sb2O3 contents on d33, kp, ε33T and grain size. In addition, the electrical properties of PZT–BYS(x) samples sintered at their optimum temperature have been listed in Table 2. From Table 2, it is clear that doping Sb2O3 into the PZT–BY increased the d33 and kp sharply compared to the undoped specimen. This can be explained by factors like the density, grain size and soft effect of Sb2O3. Previously, it was observed that pre-synthesized BiYO3 acts as a donor into the PZT ceramics and improves the piezoelectric and dielectric properties. In the present work, incorporating Sb2O3 into the PZT ceramic further improved the piezoelectric and dielectric properties because it is possible that the Sb3+ entered into the A-site and facilitated the domain wall movement. A similar observation was also reported by Dutta et al. where they doped Sb3+ into the Pb2+ site [20]. Additionally, The Sb2O3-doped specimen shows higher sintered density (7.96 g/cm3 at x = 0.1) than the undoped specimen (7.91 g/cm3 at x = 0.0). As a result, adding Sb2O3 into the PZT improved the d33 and kp sharply (at x = 0.1) compared to the undoped specimen (at x = 0.0). A detailed explanation of increasing piezoelectric, dielectric and ferroelectric behavior of the Sb2O3-doped sample will be discussed in the next paragraph.
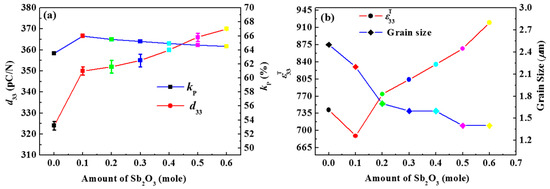
Figure 6.
Variation of (a) d33 and kp; (b) ε33T and grain size as a function of Sb2O3 contents of PZT–BYS(x) ceramics.
In Figure 6a, it is clear that the d33 and the kp increase with increasing amount of Sb2O3. The increased density and homogeneous grain size might be a reason for high d33 and kp. The increasing behavior of d33 with the addition of Sb2O3 into PZT was also explained by Zhou et al. [14]. In general, donor doping in PZT is expected to increase the d33 and the kp values, which is a soft effect [25]. In the previous work, it was observed that BiYO3 acts as a grain growth inhibitor as well as a donor in the vicinity of grains which improve d33 and kp in the PZT–BY system [13]. In the present case, similar trends of d33 and kp were also observed. Furthermore, the increasing tendency of d33 can be explained by the presence of second phases, as shown in Figure 1a.
It is possible that the second phases of Y3Sb5O12, Bi2O3, Y2O3, and BiSbO4, as shown in Figure 1a, dissociate at the higher sintering temperature. It can be speculated that Bi3+, Y3+ and Sb3+ enter into the Pb2+ site as donor ions in the PZT system to create A-site vacancies in the lattice. Similarly, a donor doping effect of Sb3+ was reported by Dutta et al. [20]. They studied the structural, dielectric and electrical properties of PZT ceramic extensively to find out the effect of double-doping (La3+ and Sb3+) at the Pb2+-site of PZT. Therefore, in the present work, A-site vacancies reduce the concentration of intrinsic oxygen vacancies during sintering and introduce lead vacancies to maintain the charge neutrality. These cation vacancies would, therefore, increase the mobility of the domain wall [26]. The change in the mobility of the domain wall by cation vacancies improves the d33, because displacement is sufficient. Therefore, d33 increases with increasing Sb2O3 content due to the increased concentration of the second phase in the PZT–BYS(x) system.
This increase in d33 by doping was also observed in a typical soft type of PZT system [26,27]. On the contrary, the value of kp reached the maximum value of 66.0% at x = 0.1, whereby it decreased slightly on further addition of Sb2O3. The grain size effect could be the predominant factor in this case. Ichinose and Kimura [28] reported that Nb and partially substituted Sb-doped PZT shows the maximum electrical properties at a grain size of 2–3 µm. The deterioration of kp with decreasing grain size is probably related to the fewer domains and less mobile domain walls. As a result, a slight decrease in kp was observed at higher Sb2O3 (x > 0.1) contents.
Figure 6b shows the variation of ε33T and grain size as a function of Sb2O3 contents. It is clear that ε33T varies from those of the piezoelectric properties. The ε33T sharply decreases as the grain size decreases from ~2.5 µm (at x = 0) to 2.2 µm (at x = 0.1), while it increases slightly with a decreasing grain size of ~1.7 µm at x = 0.2. A further increase in the Sb2O3 content decreases the grain size to ~1.4 µm, and dielectric constants increased sharply. This type of dielectric anomaly was previously explained by the effect of grain sizes [13,29,30,31,32,33,34]. Martirenat et al. [29] reported that the dielectric constant of BaTiO3 and PZT could be varied at different ranges of grain size. Okazaki and Nagata [34,35] reported that ε33T at room temperature increases within a critical range of grain size. Similar behavior was also explained by many earlier investigations of grain size effects [35,36]. They reported that there was a microstructure transition region between 1.3 μm and 2.7 μm. Within this range, ε33T decreases with decreasing grain size and increases with increasing grain size [36]. Therefore, in the present work, ε33T decreases with the PZT–BYS(0.1) composition because grain size decreases from ~2.5 µm to 2.2 µm. As the grain size decreases below critical values, the structure is changed, and the internal stress would be expected to increase. This in turn suggests that the dielectric constant increases with decreasing grain size for higher Sb2O3 content.
Further evidence for the Sb2O3 doping and grain size effects are obtained by examining the polarization-electric field (P-E) curve at room temperature and shown in Figure 7a. The values of Pr and Ec are determined from the measured P-E loops. The variation of Pr and Ec for undoped and Sb2O3-doped PZT–BYS(x) samples sintered at optimum temperatures are shown in Figure 7b. At 0.1 moles of Sb2O3 content, a relatively higher Pr, and lower Ec were observed. The relatively higher Pr and lower Ec at x = 0.1 could be explained by high mobility of domain walls achieved by suppression of the oxygen vacancies. Upon further increase of Sb2O3 content, Ec and Pr increases sharply. Above 0.1 moles of Sb2O3, the grain size decreases from 2.2 μm to around 1.7~1.4 μm. As a result, the clamping effect caused by internal stress below a critical grain size increases the Ec. By contrast, the increasing behavior of Pr with increasing Sb2O3 content can be explained by the presence of second phases, which is similar to the behavior of d33. It is believed that, at the higher sintering temperature, the second phases are dissociated. According to the similarities of ionic radius, the dissociated phase produces cation vacancies in PZT–BYS(x) as explained for the behavior of d33 as a function of Sb2O3 content (see Figure 6a). As a result of cation vacancies, the mobility of the domain wall increases [26] due to the sufficient displacement, which finally increases the Pr. Therefore, Pr increases at higher Sb2O3 content due to the higher concentration of the second phase in the PZT–BYS(x) system. These results are in agreement with a previous analysis of piezoelectric/dielectric properties.
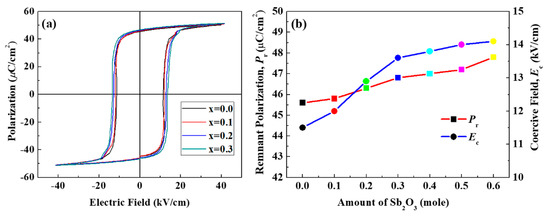
Figure 7.
(a) Polarization-electric (P-E) hysteresis loops, (b) Pr and Ec measured from their corresponding hysteresis loops of PZT–BYS(x) ceramics.
The dielectric constant (ε33T) of PZT–BYS(x) ceramics as a function of temperature is shown in Figure 8. The ε33T was almost constant up to 300 °C, and then increased gradually to a maximum value ε33T(max) at Curie temperature (TC). The TC of pure PZT is about ~360 °C. It is well known that cubic phase addition to PZT reduces TC, but in our recent work where BY was added into the PZT system, TC increased [13]. This anomaly was explained in terms of internal stress, which retarded the ferroelectric and paraelectric transition. In the present case, Sb2O3-doping has been shown to produce a linear reduction in TC. In Figure 8, it is clear that the ε33T(max) sharply decreases as the content of Sb2O3 increases and the dielectric peaks broaden around TC, which is similar to previous observations [13,37]. Similarly, Dutta et al. also explained that the broadening of the dielectric peak and variation of ε33T(max) could be attributed to the variation of grain size and some kinds of structural disorder [20]. It has already been established that, with decreasing grain size, ε33T(max) decreases, which results in the broadening of the dielectric peak, and shifts in ferroelectrics transition to higher or lower temperature sides [20,29,38].
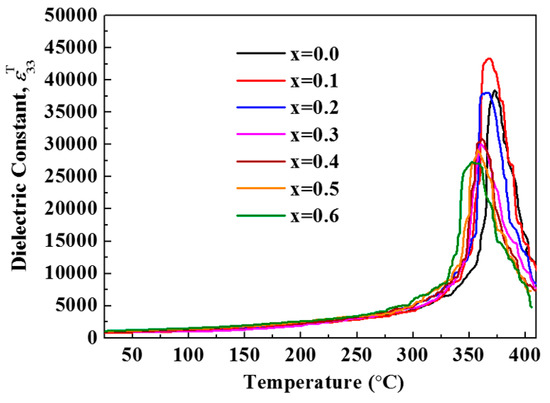
Figure 8.
Temperature dependence of dielectric constant for different Sb2O3-doped PZT–BYS(x) ceramics.
3.6. Feasibility of Sb2O3-Doped PZT–BYS(x) Ceramics for Use in an Energy Harvester
The calculated values of g33 and d33×g33 as a function of Sb2O3 contents are illustrated in Figure 9. The data of g33 and d33 × g33 for PZT–BYS(x) has also been shown in Table 3. From Figure 9, it is clear that the addition of Sb2O3 to the PZT–BYS(x) system significantly improved d33 × g33. In general, d33 and ε33T increase or decrease simultaneously depending on doping or processing conditions [24]. In the present case, it is observed that increasing behaviors of d33 and ε33T/ε0 were not similar at x = 0.1. For a small amount of Sb2O3 (x = 0.1), a considerable increase in d33 was observed, while ε33T/ε0 decreased to its lowest value of 690. Therefore, at x = 0.1 moles of Sb2O3, the g33 and d33 × g33 values reached a maximum value of 57.4 × 10⁻³ Vm/N and 20076 × 10−15 m2/N, respectively. On the other hand, the g33 and d33 × g33 values decreased rapidly at x > 0.1 due to the considerably slower rate of increase in d33 and rapid increase of ε33T/ε0.
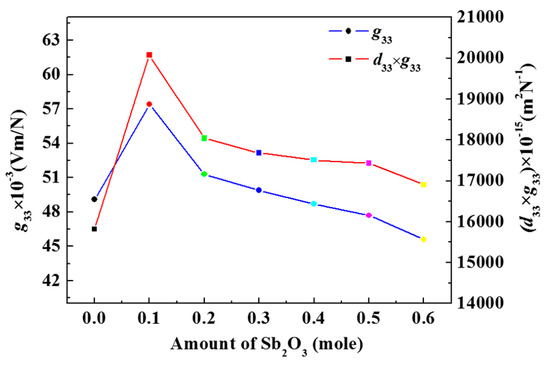
Figure 9.
Calculated values of g33 and d33 × g33 of PZT–BYS(x) ceramics as a function of different Sb2O3 contents.
Table 3.
The evaluated values of g33 and d33 × g33 of PZT–BYS(x) ceramics as a function of Sb2O3 content at optimum sintered temperature.
A list of piezoelectric energy-harvesting parameters reported recently is provided in Table 4 for comparison with the present results. In Table 4, clearly, PZT–BYS(x) possesses a considerably higher figure of merit with a high g33 value in comparison to the commercially available and recently reported materials. Furthermore, most of the recent works reported a high figure of merit after doping relaxor-type materials into the PZT system. Doping relaxor-type materials into the PZT system evidently causes an abrupt decrease in the TC, which limits the application temperature range of these materials [39,40,41,42,43]. On the other hand, Sb2O3-doped PZT–BYS(0.1) shows a high transduction coefficient without much lowering the TC. Therefore, it might be concluded that PZT–BYS(x) with x = 0.1 moles of Sb2O3 content could be considered as a good candidate material for piezoelectric energy-harvesting devices.
Table 4.
A comparison between the present work and recently reported piezoelectric ceramic materials for energy-harvesting applications.
4. Conclusions
The present study has shown that the addition of Sb2O3 to 0.99Pb(Zr0.53Ti0.47)O3–0.01Bi(Y1−xSbx)O3 [PZT–BYS(x)] ceramics (0 ≤ x ≤ 0.6) has significantly improved their energy-harvesting properties. The comparative study between doping Sb2O3 and Sb2O5 into the PZT–BYS(x) revealed the feasibility of both ceramics for energy harvesting when an appropriate sintering condition is maintained. It was observed that doping Sb2O3 into PZT–BYS(x) while maintaining the oxygen-rich sintering atmosphere had a significant influence on the dielectric and piezoelectric characteristics. All the Sb2O3-doped PZT–BYS(x) ceramics could be well sintered to high densities at temperatures between 1150 and 1170 °C. The XRD analysis of the sintered sample indicated a pure solid solution of PZT–BYS(x) without any second phases. The microstructures of the sintered samples were uniform and dense and consistent with the measured density. The Curie temperature of the ceramics was shown to produce a linear reduction with increasing Sb2O3 contents, but it is still high enough to use for high-temperature applications. The observed piezoelectric properties were in agreement with the measured P-E hysteresis loops. A maximum d33 of 370 pC/N at x = 0.6 moles and a maximum kp of 66% at x = 0.1 moles were observed. It was also observed that the ε33T (690) sharply decreased at x = 0.1 while maintaining relatively higher d33 (350 pC/N), which is a highly demanding piezoelectric characteristic for energy-harvesting. The relatively higher d33 and lower ε33T at x = 0.1 resulted in an optimum value of g33 = 57.4 × 10⁻³ Vm/N and d33 × g33 = 20075 × 10−15 m2/N, which is high among recently reported work. Therefore, the newly reported ceramic composition of 0.99Pb(Zr0.53Ti0.47)O3–0.01Bi[Y(1−x)Sbx]O3 could be a promising material for future study to be used in an energy harvester.
Acknowledgments
The research was supported by a grant from the Regional Innovation Center (RIC) Program which was conducted by the Ministry of Trade, Industry & Energy of the Korean Government.
Author Contributions
Iqbal Mahmud and Man-Soon Yoon designed the experiment. Iqbal Mahmud performed the experiments, analyzed data and wrote the manuscript. Man-Soon Yoon advised regarding data analysis and edited the manuscript. Soon-Chul Ur supervised the research work, advised concerning the study, and edited the manuscript.
Conflicts of Interest
The authors declare no conflict of interest.
References
- Kang, M.G.; Jung, W.S.; Kang, C.Y.; Yoon, S.J. Recent progress on PZT based piezoelectric energy harvesting technologies. Actuators 2016, 5, 5. [Google Scholar] [CrossRef]
- Tang, G.; Yang, B.; Hou, C.; Li, G.; Liu, J.; Chen, X.; Yang, C. A piezoelectric micro generator worked at low frequency and high acceleration based on PZT and phosphor bronze bonding. Sci. Rep. 2016, 6, 1–10. [Google Scholar] [CrossRef] [PubMed]
- Almusallama, A.; Luob, Z.; Komolafea, A.; Yanga, K.; Robinsonc, A.; Toraha, R.; Beeby, S. Flexible piezoelectric nano-composite films for kinetic energy harvesting from textiles. Nano Energy 2017, 33, 146–156. [Google Scholar] [CrossRef]
- Ramadan, K.S.; Sameoto, D.; Evoy, S. A review of piezoelectric polymers as functional materials for electromechanical transducers. Smart Mater. Struct. 2014, 23, 1–26. [Google Scholar] [CrossRef]
- Li, H.; Tian, C.; Deng, Z.D. Energy harvesting from low frequency applications using piezoelectric materials. Appl. Phys. Rev. 2014, 1, 1–19. [Google Scholar] [CrossRef]
- Lupascu, D.C. Fatigue in Ferroelectric Ceramics and Related Issues; Springer: Berlin, Germany, 2004; pp. 43–46. [Google Scholar]
- Yuan, D.; Yang, Y.; Hu, Q.; Wang, Y. Structures and properties of Pb(Zr0.5Ti0.5)O3–Pb(Zn1/3Nb2/3)O3–Pb(Ni1/3Nb2/3)O3 ceramics for energy harvesting devices. J. Am. Ceram. Soc. 2014, 97, 3999–4004. [Google Scholar] [CrossRef]
- Yoon, S.J.; Kang, H.W.; Kucheiko, S.I.; Kim, H.J.; Jung, H.J.; Lee, D.K.; Ahn, H.K. Piezoelectric properties of Pb[Zr0.45Ti0.5−xLux(Mn1/3Sb2/3)0.05]O3 ceramics. J. Am. Ceram. Soc. 1998, 81, 2473–2476. [Google Scholar] [CrossRef]
- Choi, C.H.; Seo, I.T.; Song, D.; Jang, M.S.; Kim, B.Y.; Nahm, S.; Sung, T.H.; Song, H.C. Relation between piezoelectric properties of ceramics and output power density of energy harvester. J. Eur. Ceram. Soc. 2013, 33, 1343–1347. [Google Scholar] [CrossRef]
- Lonkar, C.M.; Premkumar, S.; Kharat, D.K.; Kumar, H.H.; Prasad, S.; Balasubramanian, K. Effect of La on piezoelectric properties of Pb(Ni1/3Sb2/3)O3–Pb(ZrTi)O3 ferroelectric ceramics. J. Mater. Sci. Mater. Electron. 2013, 24, 1989–1993. [Google Scholar] [CrossRef]
- Xu, R.; Kim, S.G. Figures of merits of piezoelectric materials in energy harvesters. In Proceedings of the PowerMEMS, Atlanta, GA, USA, 2–5 December 2012. [Google Scholar]
- Priya, S. Criterion for material selection in design of bulk piezoelectric energy harvesters. IEEE Trans. Ultrason. Ferroelectr. Freq. Control 2010, 57, 2610–2612. [Google Scholar] [CrossRef] [PubMed]
- Yoon, M.S.; Mahmud, I.; Ur, S.C. Phase formation, microstructure and piezoelectric/dielectric properties of BiYO3 doped Pb(Zr0.53Ti0.47)O3 for piezoelectric energy harvesting devices. Ceram. Int. 2013, 39, 8581–8588. [Google Scholar] [CrossRef]
- Zhou, T.; Wang, S.; Gu, H.; He, Y.; Kuang, A.; Sun, W. The effect of doping Sb2O3 in high d33•g33 PZT piezoelectric ceramics. Ferroelectrics 1997, 195, 101–104. [Google Scholar] [CrossRef]
- Rai, R.; Sharma, S. Structural and dielectric properties of Sb-doped PLZT ceramics. Ceram. Int. 2004, 30, 1295–1299. [Google Scholar] [CrossRef]
- Lonkar, C.M.; Kharat, D.K.; Kumar, H.H.; Prasad, S.; Balasubramanian, K. Effect of sintering time on dielectric and piezoelectric properties of Lanthanum doped Pb(Ni1/3Sb2/3)–PbZrTiO3 ferroelectric ceramics. Def. Sci. J. 2013, 63, 418–422. [Google Scholar] [CrossRef]
- Zahi, S.; Bouaziz, R.; Abdessalem, N.; Boutarfaia, A. Dielectric and piezoelectric properties of PbZrO3–PbTiO3–Pb(Ni1/3,Sb2/3)O3 ferroelectric ceramic system. Ceram. Int. 2003, 29, 35–39. [Google Scholar] [CrossRef]
- Luan, N.D.T.; Vuong, L.D.; Chanh, B.C. Microstructure, ferroelectric and piezoelectric properties of PZT-PMnSbN ceramics. Int. J. Mater. Chem. 2013, 3, 51–58. [Google Scholar]
- Choia, W.Y.; Ahn, J.H.; Lee, W.J.; Kim, H.G. Electrical properties of Sb-doped PZT films deposited by d.c. reactive sputtering using multi-targets. Mater. Lett. 1998, 37, 119–127. [Google Scholar] [CrossRef]
- Dutta, S.; Choudhary, R.N.P.; Sinha, P.K. Electrical properties of antimony doped PLZT ceramics prepared by mixed-oxide route. J. Alloys Compd. 2006, 426, 345–351. [Google Scholar] [CrossRef]
- Dutta, S.; Choudhary, R.N.P.; Sinha, P.K. Studies on structural, electrical and electromechanical properties of Sb3+-modified PLZT. Mater. Sci. Eng. B 2004, 113, 215–223. [Google Scholar] [CrossRef]
- Yoon, S.J.; Choi, J.W.; Choi, J.Y.; Dandan, W.; Li, Q.; Yang, Y. Influences of donor dopants on the properties of PZT-PMS-PZN piezoelectric ceramics sintered at low temperatures. J. Korean Phys. Soc. 2010, 57, 863–867. [Google Scholar]
- Shannon, R.D. Revised effective ionic radii and systematic studies of interatomic distances in halides and chalcogenides. Acta Cryst. 1976, A32, 751–767. [Google Scholar] [CrossRef]
- Uchino, K.; Takasu, T. Property variation of piezoelectric ceramics with microstructure. Inspec 1986, 10, 29–33. [Google Scholar]
- Slouka, C.; Kainz, T.; Navickas, E.; Walch, G.; Hutter, H.; Reichmann, K.; Fleig, J. The effect of acceptor and donor doping on oxygen vacancy concentrations in lead zirconate titanate (PZT). Materials 2016, 9, 945. [Google Scholar] [CrossRef] [PubMed]
- Tani, T.; Watanabe, N.; Takatori, K.; Hori, S. Piezoelectric and dielectric properties for doped lead zirconate titanate ceramics under strong electric field. J. Appl. Phys. 1994, 33, 5352–5355. [Google Scholar] [CrossRef]
- Takahashi, S.; Hirose, S.; Uchino, K. Stability of PZT piezoelectric ceramics under vibration level change. J. Am. Ceram. Soc. 1994, 77, 2429–2432. [Google Scholar] [CrossRef]
- Ichinose, N.; Kimura, M. Preparation and properties of lead zirconate-titanate piezoelectric ceramics using ultrafine particles. Jpn. J. Appl. Phys. 1991, 30, 2220–2223. [Google Scholar] [CrossRef]
- Martirenat, H.T.; Burfoot, J.C. Grain-size effects on properties of some ferroelectric ceramics. J. Phys. C Solid State Phys. 1974, 7, 3182–3192. [Google Scholar] [CrossRef]
- Shirane, G.; Sawaguchi, E.; Takagi, Y. Dielectric properties of lead zirconate. J. Phys. Soc. Jpn. 1951, 6, 208–209. [Google Scholar] [CrossRef]
- Okazaki, K.; Nagata, K. Mechanical behaviour of materials. J. Soc. Mater. Sci. Jpn. 1972, 4, 404. [Google Scholar]
- Okazaki, K.; Nagata, K. Effects of grain size and porosity on electrical and optical properties of PLZT ceramics. J. Am. Ceram. Soc. 1973, 56, 82–86. [Google Scholar] [CrossRef]
- Lee, K.G.S.; Shrout, T.R.; Venkataramani, S. Fabrication of fine-grain piezoelectric ceramics using reactive calcination. J. Mater. Sci. 1991, 26, 4411–4415. [Google Scholar]
- Ai, Z.; Hou, Y.; Zheng, M.; Zhu, M. Effect of grain size on the phase structure and electrical properties of PZT–PNZN quaternary systems. J. Alloys Compd. 2014, 617, 222–227. [Google Scholar] [CrossRef]
- Arlt, G. The influence of microstructure on the properties of ferroelectric ceramics. Ferroelectrics 1990, 104, 217–227. [Google Scholar] [CrossRef]
- Kang, B.S.; Choi, D.G.; Choi, S.K. Effects of grain size on pyroelectric and dielectric properties of Pb0.9La0.1TiO3 ceramic. J. Korean Phys. Soc. 1998, 32, S232–S234. [Google Scholar]
- Chamola, A.; Singh, H.; Naithani, U.C. Study of Pb(Zr0.65Ti0.35)O3(PZT(65/35) doping on structural, dielectric and conductivity properties of BaTiO3(BT) ceramics. Adv. Mater. Lett. 2011, 2, 148–152. [Google Scholar] [CrossRef]
- Miga, S.; Wojcik, K. Investigation of the diffuse phase transition in PLZT X/65/35 ceramics, x = 7–10. Ferroelectrics 1989, 100, 167–173. [Google Scholar] [CrossRef]
- Mahmud, I.; Ur, S.C.; Yoon, M.S. Effects of Fe2O3 addition on the piezoelectric and the dielectric properties of 0.99Pb(Zr0.53Ti0.47)O3–0.01Bi(Y1−xFex)O3 ceramics for energy-harvesting devices. J. Korean Phys. Soc. 2014, 65, 133–144. [Google Scholar] [CrossRef]
- Wagner, S.; Kahraman, D.; Kungl, H.; Hoffmann, M.J.; Schuh, C.; Lubitz, K.; Biesenecker, H.M.; Schmid, J.A. Effect of temperature on grain size, phase composition, and electrical properties in the relaxor-ferroelectric-system Pb(Ni1/3Nb2/3)O3–Pb(Zr,Ti)O3. J. Appl. Phys. 2005, 98, 024102. [Google Scholar] [CrossRef]
- Islam, R.A.; Priya, S. High energy density composition in the system PZT-PZNN. J. Am. Ceram. Soc. 2006, 89, 3147–3156. [Google Scholar] [CrossRef]
- Seo, I.T.; Cha, Y.J.; Kang, I.Y.; Choi, J.H.; Nahm, S.; Seung, T.H.; Paik, J.H. High energy density piezoelectric ceramics for energy harvesting devices. J. Am. Ceram. Soc. 2011, 94, 3629–3631. [Google Scholar] [CrossRef]
- Jeong, Y.H.; Kim, K.B.; Lee, Y.J.; Choi, J.H.; Kim, B.I.; Paik, J.H.; Nahm, S. Ferroelectric and Piezoelectric Properties of 0.72Pb(Zr0.47Ti0.53)O3–0.28Pb[(Zn0.45Ni0.55)1/3Nb2/3]O3. Jpn. J. Appl. Phys. 2012, 51, 9S2. [Google Scholar] [CrossRef]
© 2017 by the authors. Licensee MDPI, Basel, Switzerland. This article is an open access article distributed under the terms and conditions of the Creative Commons Attribution (CC BY) license (http://creativecommons.org/licenses/by/4.0/).