1. Introduction
The realization of the importance of soil stiffness, represented generally by shear modulus (
G), at low shear strain level (
γ < 10
−5), in both static and dynamic behavior, has led to increased interest in methods of measuring stiffness at small strains in the laboratory. One of the most used technique to establish shear wave velocity (
VS), and therefore shear modulus [
1], is to make use of bender elements (BEs), small piezoceramic devices that can generate and detect waves in soil [
2].
VS is an important parameter for the design of geotechnical systems [
3], particularly in seismically active areas [
4,
5]. It is necessary for design and site response purposes, is related to stiffness of a foundation, evaluation of site response during earthquakes, liquefaction potential [
6], site characterization, soil density and its stratigraphy, or settlements of foundations [
7]. On the other hand, the anthropogenic impacts, like mining tremors, use of roads and rails transport etc., cannot be ignored as well. Some high-speed transport systems (e.g., expressway, high-speed railway, and airstrip) have been recently developed a lot, which transmit dynamic loading to subsoil. The settlements of subsoil in these cases are very much related to soil stiffness. Information of shear wave velocity is crucial for a better knowledge of work capacity of soil.
Shear wave velocity is connected to the small-strain shear modulus (
Gmax) using elasticity theory:
where
ρ means mass density of the material (equal to the total unit weight of the material,
γt, divided by the gravitational acceleration) [
8]. It is also recognized that shear wave propagation is the most versatile and portable method to assess
Gmax in the laboratory, besides bender elements [
9], resonant column tests [
10], and in the field, e.g., cross cone, seismic cone and surface waves methods [
11].
The desire to improve of the road infrastructure in Poland has led engineers to construct, inter alia pavements in various conditions. A request of construction materials in such a situation enhances a great need to explore new ways of reuse of waste deposits. Economic development in Poland has recently induced many deposits of Construction and Demolition (C&D) materials, such as demolished brick and concrete. On the other hand, an increase of ecological awareness has also caused bigger concentration on recycle building wastes and their possible usage in engineering constructions. In the field of pavement engineering, C&D recycling materials, like other composite materials [
12], have been used in roads, embankments, pipes bedding and backfilling [
13]. This trend has become global standard of treating crushed concrete and other construction materials [
14,
15].
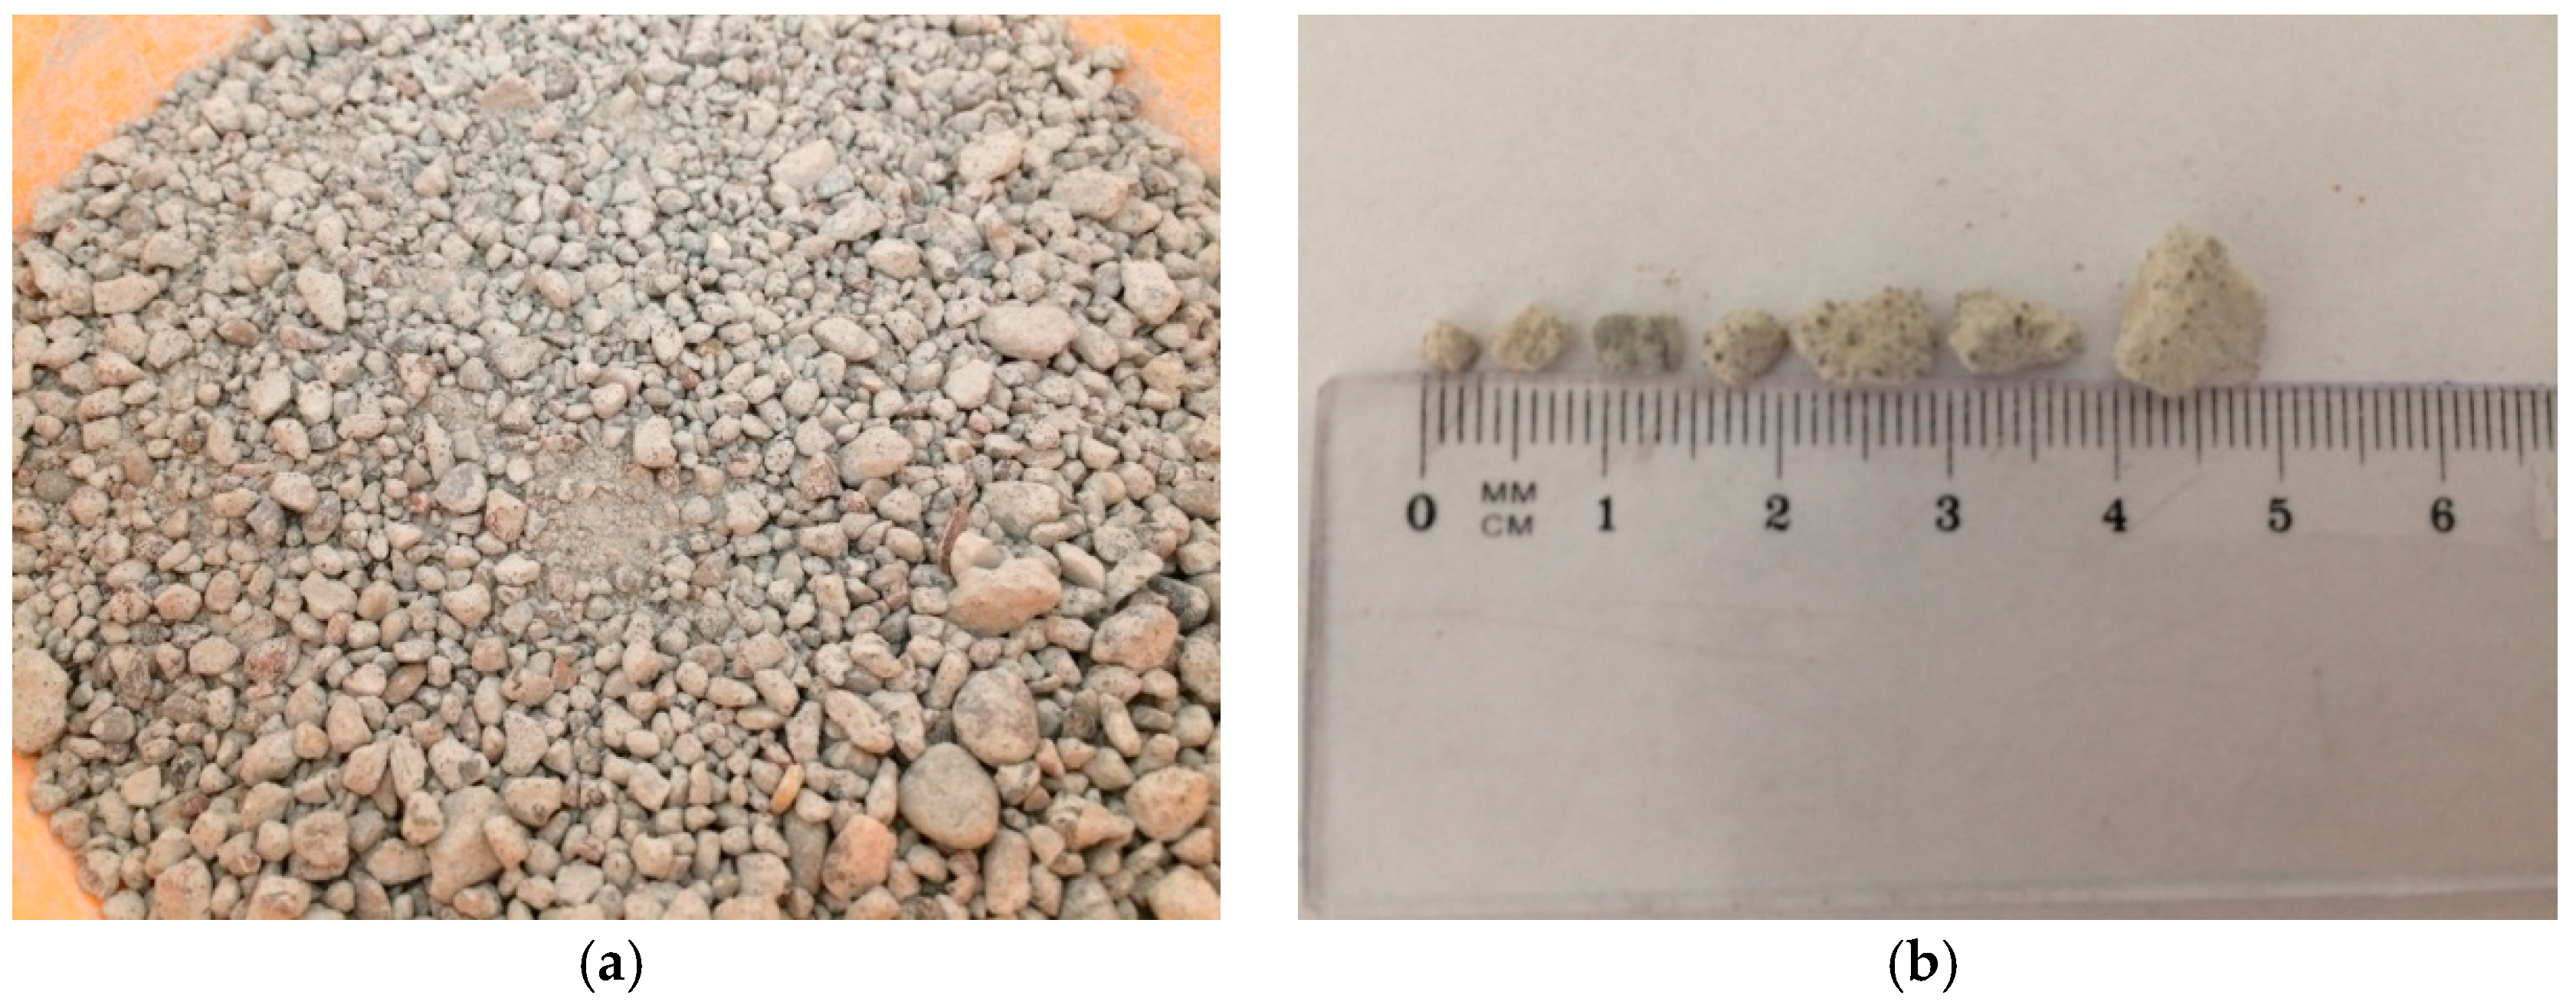
The subject of this research is Recycled Concrete Aggregate (RCA), an example of anthropogenic material, which is a product of demolishing of exploit constructions [
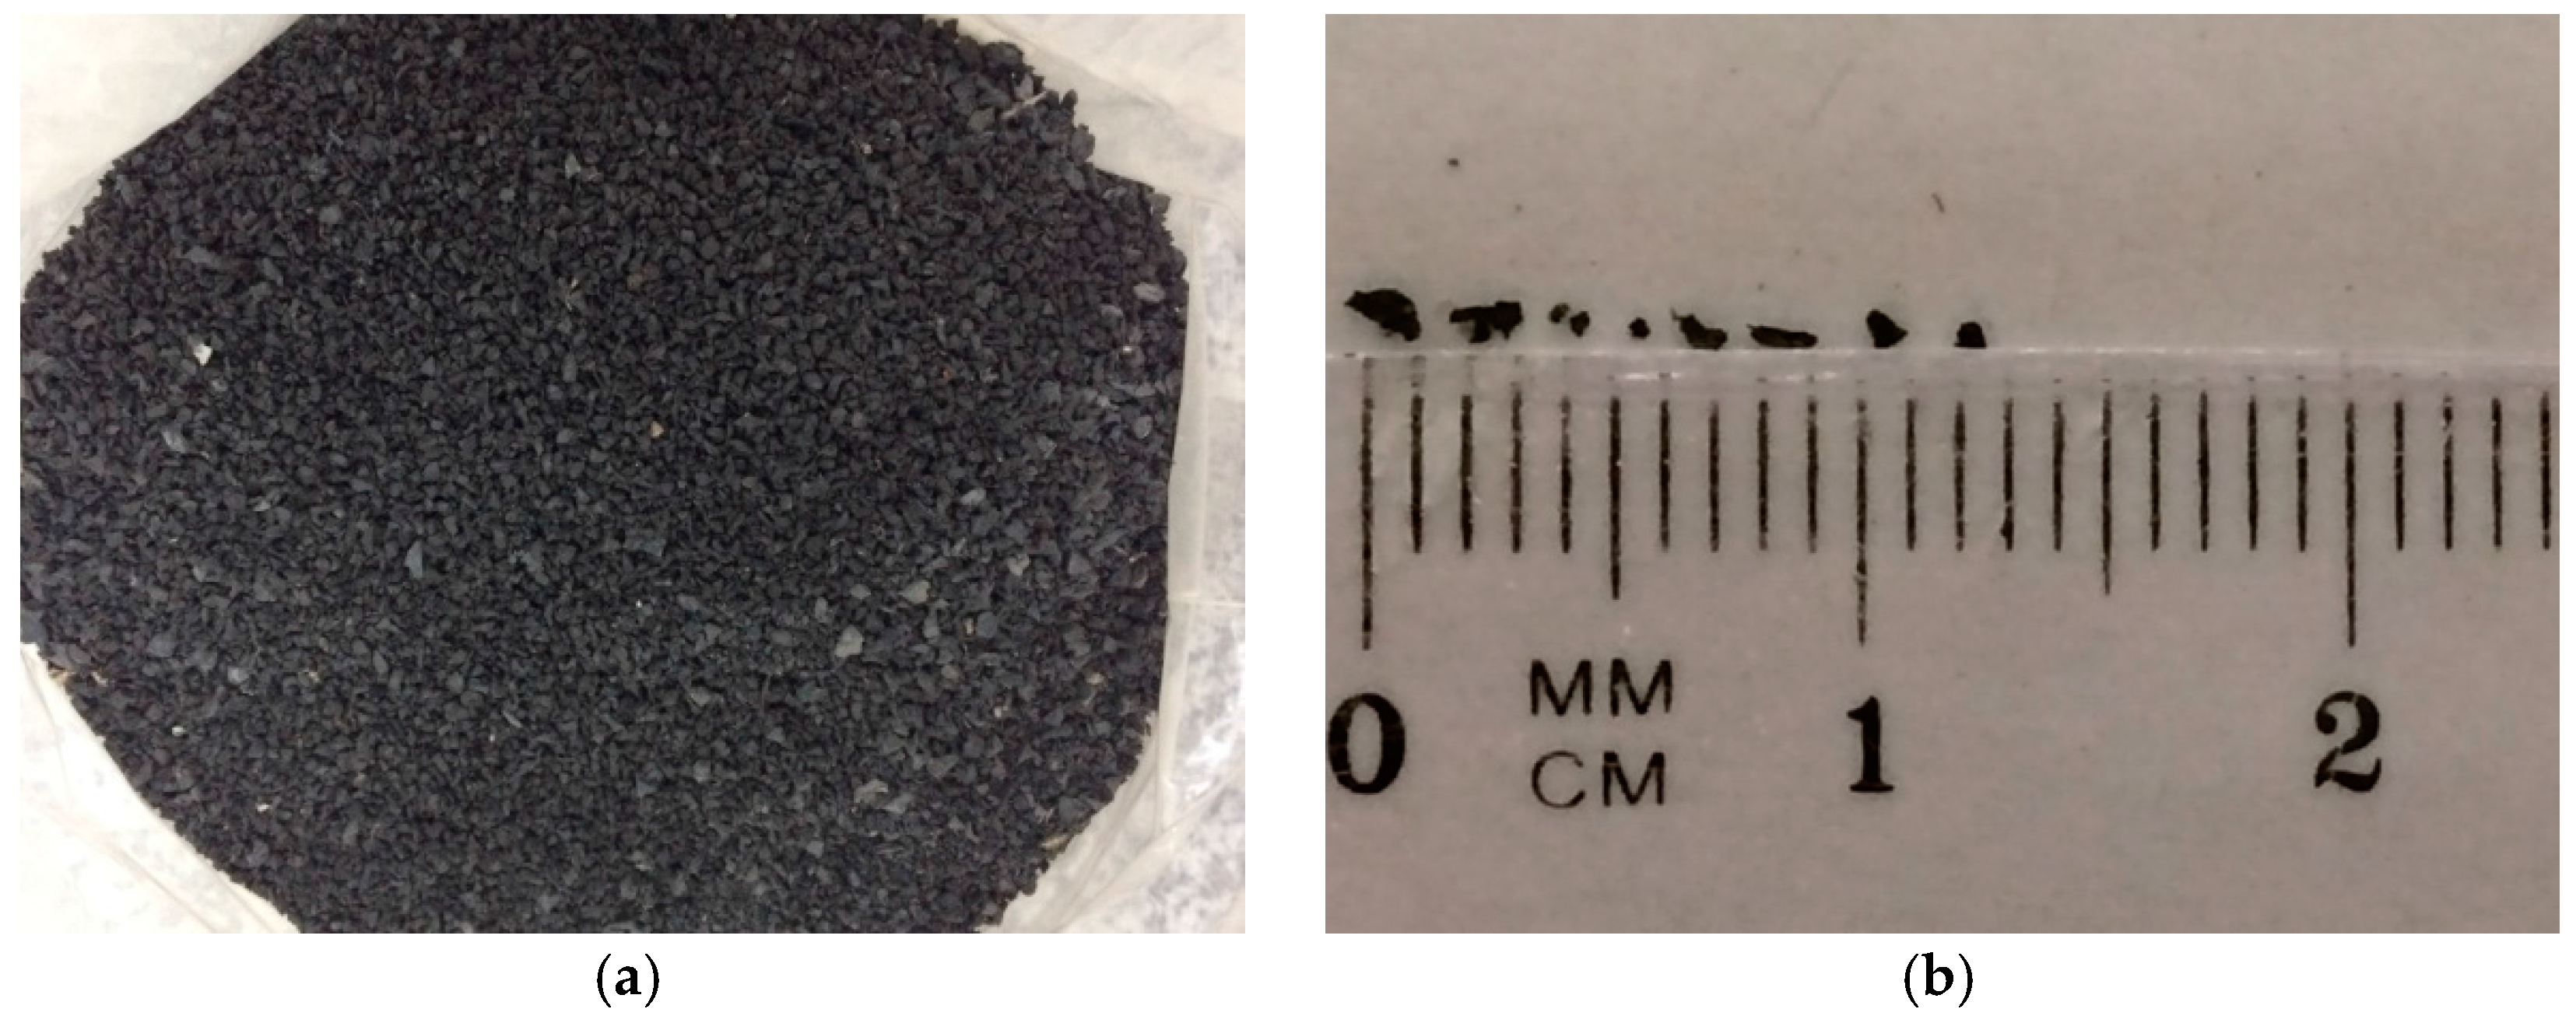
16]. The authors investigate the behavior of plain RCA as well as its mixture with rubber grains. One of the waste types produced during cars’ exploitation and after their utilization are rubber tires [
17]. Disposal of waste tires has become a global problem [
18]. Effectively reusing waste tires is an urgent and important issue for saving energy and protecting the environment [
19]. Scrap tires, shredded into small pieces (called “chips”), alone or mixed with soil can have properties favorable to civil and environmental engineering applications [
20]. Recycled waste tires when mixed with soil can play an important role as lightweight construction materials in embankments, retaining walls, machine foundations and railroad track beds in seismic zones. Rubber can be presented as an alternative material in various construction activities, because it is cheap and available in abundance. It can reduce vibrations when seismic loads are of great concern or even improve some mechanical properties of problematic soils, e.g., soft soils [
21].
Over the last decades, there have been many investigations, which highlighted physical, chemical and mechanical properties of RCA. Numerous researchers have conducted studies to determine the same parameters but of rubber-soil mixtures [
22]. To authors’ knowledge, data on shear wave velocity of concrete aggregates with rubber chips is, however, remarkably limited. Therefore, the scientific objective of this work is to recognize and evaluate the
VS values of such anthropogenic material from modern geotechnical research technique originally applied for natural soil, i.e., bender elements set in the triaxial device, in the time and frequency domain.
2. State of the Art
Most of the work presented in the literature concerns mechanical properties of RCA [
23], durability and/or volume stability. Direct Shear Tests (DSTs), conducted by Soból et al. [
24] and Arulrajah et al. [
25], showed that among six tested C&D materials all meet the shear strength requirements for aggregates in pavement engineering, including RCA. Melbouci [
26] in 2009 carried out cyclic loading tests on RCA samples with addition of sand and concrete. Laboratory research, typical for roads, were also performed on a large scale, including California Bearing Ratio (CBR) [
27], compaction, crushing susceptibility, freeze thaw and triaxial tests [
28] or long-term cyclic triaxial tests [
29]. Nonetheless, studies on dynamic properties (shear modulus and damping ratio) of RCA are still very few [
30].
In the recent past, a series of intensive studies, aimed at finding the possible application of rubber chips mixed with natural aggregates, have been conducted as well. Takano et al. [
19] tested shear behavior of rubber chips and silica sand mixture using micro focus X-ray CT scanner. The results of those tests proved that, while direct shearing of the mixture of sand and rubber chips, the shear stress level rises monotonically and no peak stress is observed. Dilatancy effect was also not very significant, in comparison to the tests conducted on pure sand. It was also interesting that rubber chips additions can decrease shear strain propagation. This fact turned to be important for road engineering, as shear stress causes many structural damages. For instance, Srinivas et al. [
31] studied a mixture of gravel, fly ash and waste fibers. Their study revealed an increase of CBR characteristics, namely optimal addition of waste tire rubber ranged between 0.2% and 2.0% of dry unit weight of soil. Two scientists, Ghatge and Rakaraddi [
32] in 2014, though, used shredded waste rubber for reinforcement of soft clay with different percentages of rubber content and, additionally, with cement as a binding medium. CBR test set, together with unconfined compressive strength tests, pointed out an improvement of bearing capacity, strength and high compressibility of the tested material.
However, only a limited number of research described the cyclic behavior, including the liquefaction potential and dynamic properties of sand-scrap tire mixtures (e.g., [
33,
34,
35]). Turer and Özden [
36] reported that sand-scrap tire mixtures have lower shear modulus and higher damping ratio compared to sand at low to medium shear strains (
γ < 0.1%), while pure scrap tires have higher damping ratio. Kaneko et al. [
37] stated that sand-tire crumb mixtures show remarkable damping and seismic isolation properties. They have an ability to reduce significantly the acceleration amplitude at the ground surface, due to the low stiffness of tire crumbs. Because of the lack of experimental data, Tsang et al. [
38] studied dynamic properties of scrap tire-soil mixture based on the extrapolated data of shear modulus and damping ratio of Feng and Sutter [
33] for shear strains greater than 0.1%. Mashiri et al. [
34] conducted a series of strain controlled consolidated undrained cyclic triaxial tests on specimens of sand mixed with varying proportions of tire chips. The maximum shear modulus (
Gmax) of the tested mixture was determined by bender element tests for different gravimetric proportions of tire chips and various effective confining pressures. The initial shear modulus was found to be influenced by the proportion of tire chips and confining pressure. The results showed as well that the increase of scrap tire in sand-scrap tire mixtures reduced shear modulus degradation curves and increased damping ratio curves. Anbazhagan and Manohar [
22] in 2015 investigated static properties (i.e. shear strength and energy absorption capacity) of Sand Tire Crumb Mixtures (STCM), and then in 2016 [
39] they presented dynamic properties of STCM in terms of
G and
D against shear strain (
γ). Torsional resonant column tests were performed to measure
G and
D of the small strain rate of 0.0001% to 0.1%. Their values at a large strain rate (0.1% to 10%) were measured through cyclic triaxial test. The results showed that shear modulus and damping ratio of the mixtures were strongly influenced by the percentage of rubber inclusion. Shear modulus decreased with an increase in tire crumb inclusion for all confining pressures, whereas damping ratio increased with the increase in rubber content in STCM. For any percentage of tire crumbs inclusion, shear modulus increased and damping ratio decreased with increasing confining pressure. Ehsani et al. [
21] also conducted torsional resonant column and dynamic triaxial experiments of sand-granulated rubber mixtures. They examined the effect of rubber content and ratio of mean grain size of rubber solids versus soil solids (
D50,r/
D50,s) on dynamic response of these mixtures, in a range of low to high shearing strain amplitude, from about 4 × 10
−4% to 2.7%. Similar conclusions, as in the case of previously cited studies, were drawn. It is worth emphasizing that a decrease in
D50,r/D50,s caused the mixture to exhibit more rubber-like behavior.
Regardless of immense work performed by various researchers to determine physical, chemical, mechanical and, sometimes as well, dynamic properties of RCA and rubber-soil mixtures, the authors were unable to find the detailed study of VS of RCA improved with rubber grains, covering the wide range of strains, from small to moderate strains (0.0001% to 0.1%). Therefore, such a complete study on RCA with rubber chips will help to fill this gap in the geotechnical engineering knowledge, provide new information about this modified anthropogenic soil and may be very useful for selecting the shear modulus and damping values associated with field events, e.g., machine foundations, motion characteristics or earthquake motion.
Nowadays in Poland, in the field of transportation and/or road investments, anthropogenic soils can be easily located. The decision either to leave them, or to exchange for a better material, must result from studies of their behavior. In addition, the rapid development of modern civil engineering constructions as well as EU directives force engineers to use anthropogenic soil nevertheless. It must be supported by the extensive knowledge of their engineering properties, including dynamic ones.
4. Tests Results and Discussion
In
Table 3 and
Table 4, a summary of the
VS values obtained by various techniques of travel time determination is presented. The data combined in
Table 3 concern the first three specimens, namely of pure RCA, while those of
Table 4 relate to three mixtures of RCA with rubber chips. All the results are resumed here, regardless of whether
LTT/λ ratio is greater than 3.0 or not. The wave periods employed in the presented tests, divided into two groups: for specimens No. 1, 4, 6 and for specimens No. 2, 3, 5, arise from the authors’ experience and the possibility of clear wave reading. From
Table 3 and
Table 4, it can be noted that the
VS values are not uniform for different periods.
Moreover, a comparison of the VS results obtained by peak-to-peak method, but done twice, shows a big consistency of the values of shear wave velocity. The average difference between the velocities from the technique peak-to-peak_1 and peak-to-peak_2 does not exceed 0.5%, what can be also confirmed in the next presented tables. It follows that it does not matter when the analysis of the signals is performed, during or after the tests.
In the next order, the statistical analysis of all data from
Table 3 and
Table 4 was executed. Its results are summarized in
Table 5 and
Table 6. The minimum value of
VS in the most cases was received from cross correlation method, whereas the maximum from zero crossing method. The average median value of
VS for specimens tested under
p′ = 45 kPa is equal to 183.1 m/s, pure RCA, and 43% less, 104.5 m/s, composition of RCA with rubber chips. For specimens tested under
p′ = 90 kPa, the median value for pure RCA is about 254.3 m/s and more than 50% less, 116.7 m/s, for its composition with rubber chips. A similar difference, namely 47%, is occurred for the average median values of
VS between specimens No 3 and 6 that are respectively 296.9 and 156.7 m/s.
Analyzing other statistical parameters, e.g., dispersion of the results within a method, standard deviation, standard error and variance, the highest values were usually found for zero crossing interpretation method. Regardless of the type of a test material, it can be seen that this technique deviates significantly from others. A large spread of the results is characteristic as well for frequency domain method. It is higher, up to 93%, for composition of RCA with rubber chips than for pure RCA specimens. The smallest spread of the results provides peak-to-peak method, in the region of 1.1 m/s (specimen No. 5) to 4.7 m/s (specimen No. 4). For some specimens (No. 1 and 6) though, a small scatter of the results is obtained by cross correlation method, amounting to 7.5 and 2.8 m/s.
After estimating standard error, it can be noticed that for most of the techniques of travel time identification in BEs testing standard error is minor, except for cross correlation. In general, it does not exceed the value of 1.3 m/s for pure anthropogenic material and 4.4 m/s for its modified version. The above-given data relates to frequency domain method. This means that the chosen interpretation methods are correct. The differences between empirical and theoretical values of
VS hardly exist. The average error in
VS calculation using one of the analyzed method deviates from the theoretical value of
VS by the standard error value (
Table 5 and
Table 6). However, it should be remembered that presented errors do not exactly tell about the scale of the phenomenon. They should be also considered in relation to average value of
VS for each method. Excluding zero crossing method, for pure RCA specimens’ standard errors are from 0.2% to 0.4% of the average value of
VS, and for RCA with rubber chips from 0.4% to 3.3%. This actually confirms the small values of errors as well as the accuracy of the interpretation methods chosen.
An analysis of uncertainty was also required, in order to approve the precision and credibility of this study. Relative uncertainty in the range of 0.1% to 10% is typical for laboratory experiments. Based on data summarized in
Table 5 and
Table 6, it can be seen, that uncertainty of the results is at the level of 1–2% (specimens No. 1–3) and of 1.4%–30% (specimens No. 4–6), where the highest value was obtained for specimen No. 5. It is clear, that the time domain methods allow for very accurate measurement of
VS, the lowest uncertainty of the results.
In
Table 7, selected statistical parameters, i.e., dispersion, standard deviation and standard error, from all four methods together for each specimen are summarized. Pure RCA specimens are characterized by lower values of these parameters (from 50% to 90%), especially specimen No. 2, tested at
p′ = 90 kPa, than three mixtures of RCA with rubber chips. In the case of composite, No. 5, tested as well at
p′ = 90 kPa, the values of dispersion, standard deviation and error are the highest. Judging, for example, these two specimens, No. 2 and 5, investigated under the same mean effective stress, the difference between statistical parameters is up to 90%.
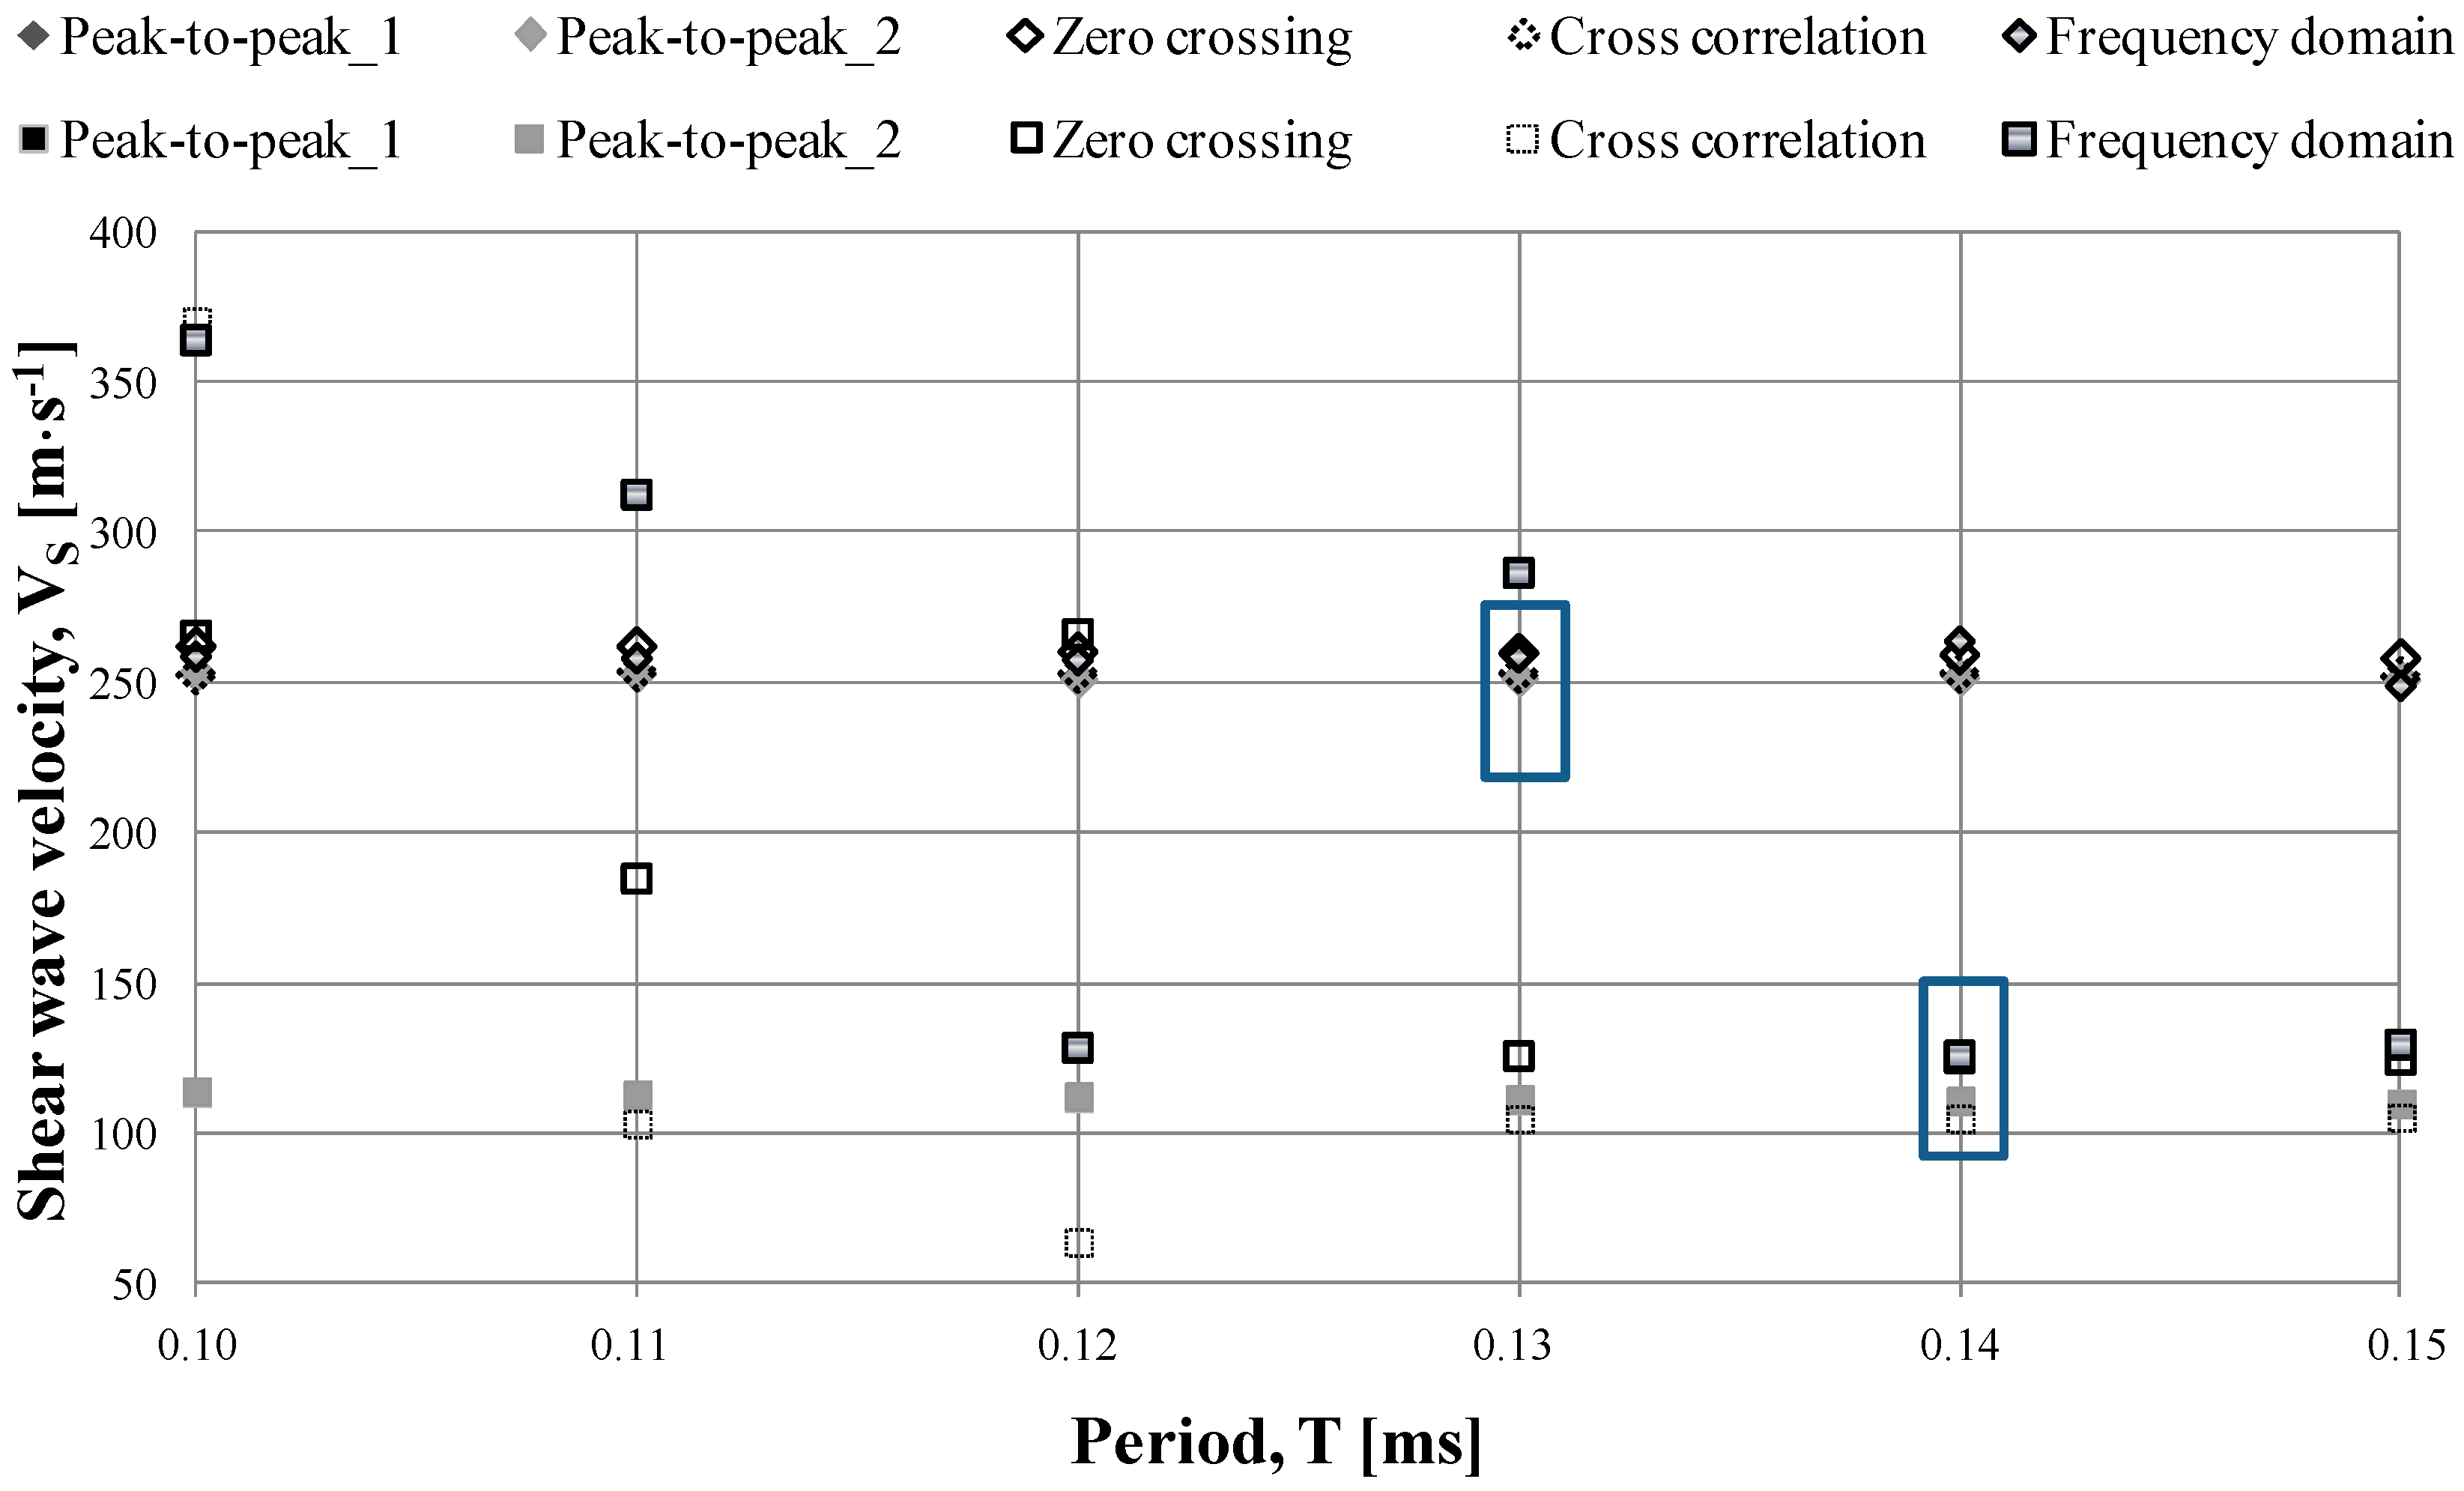
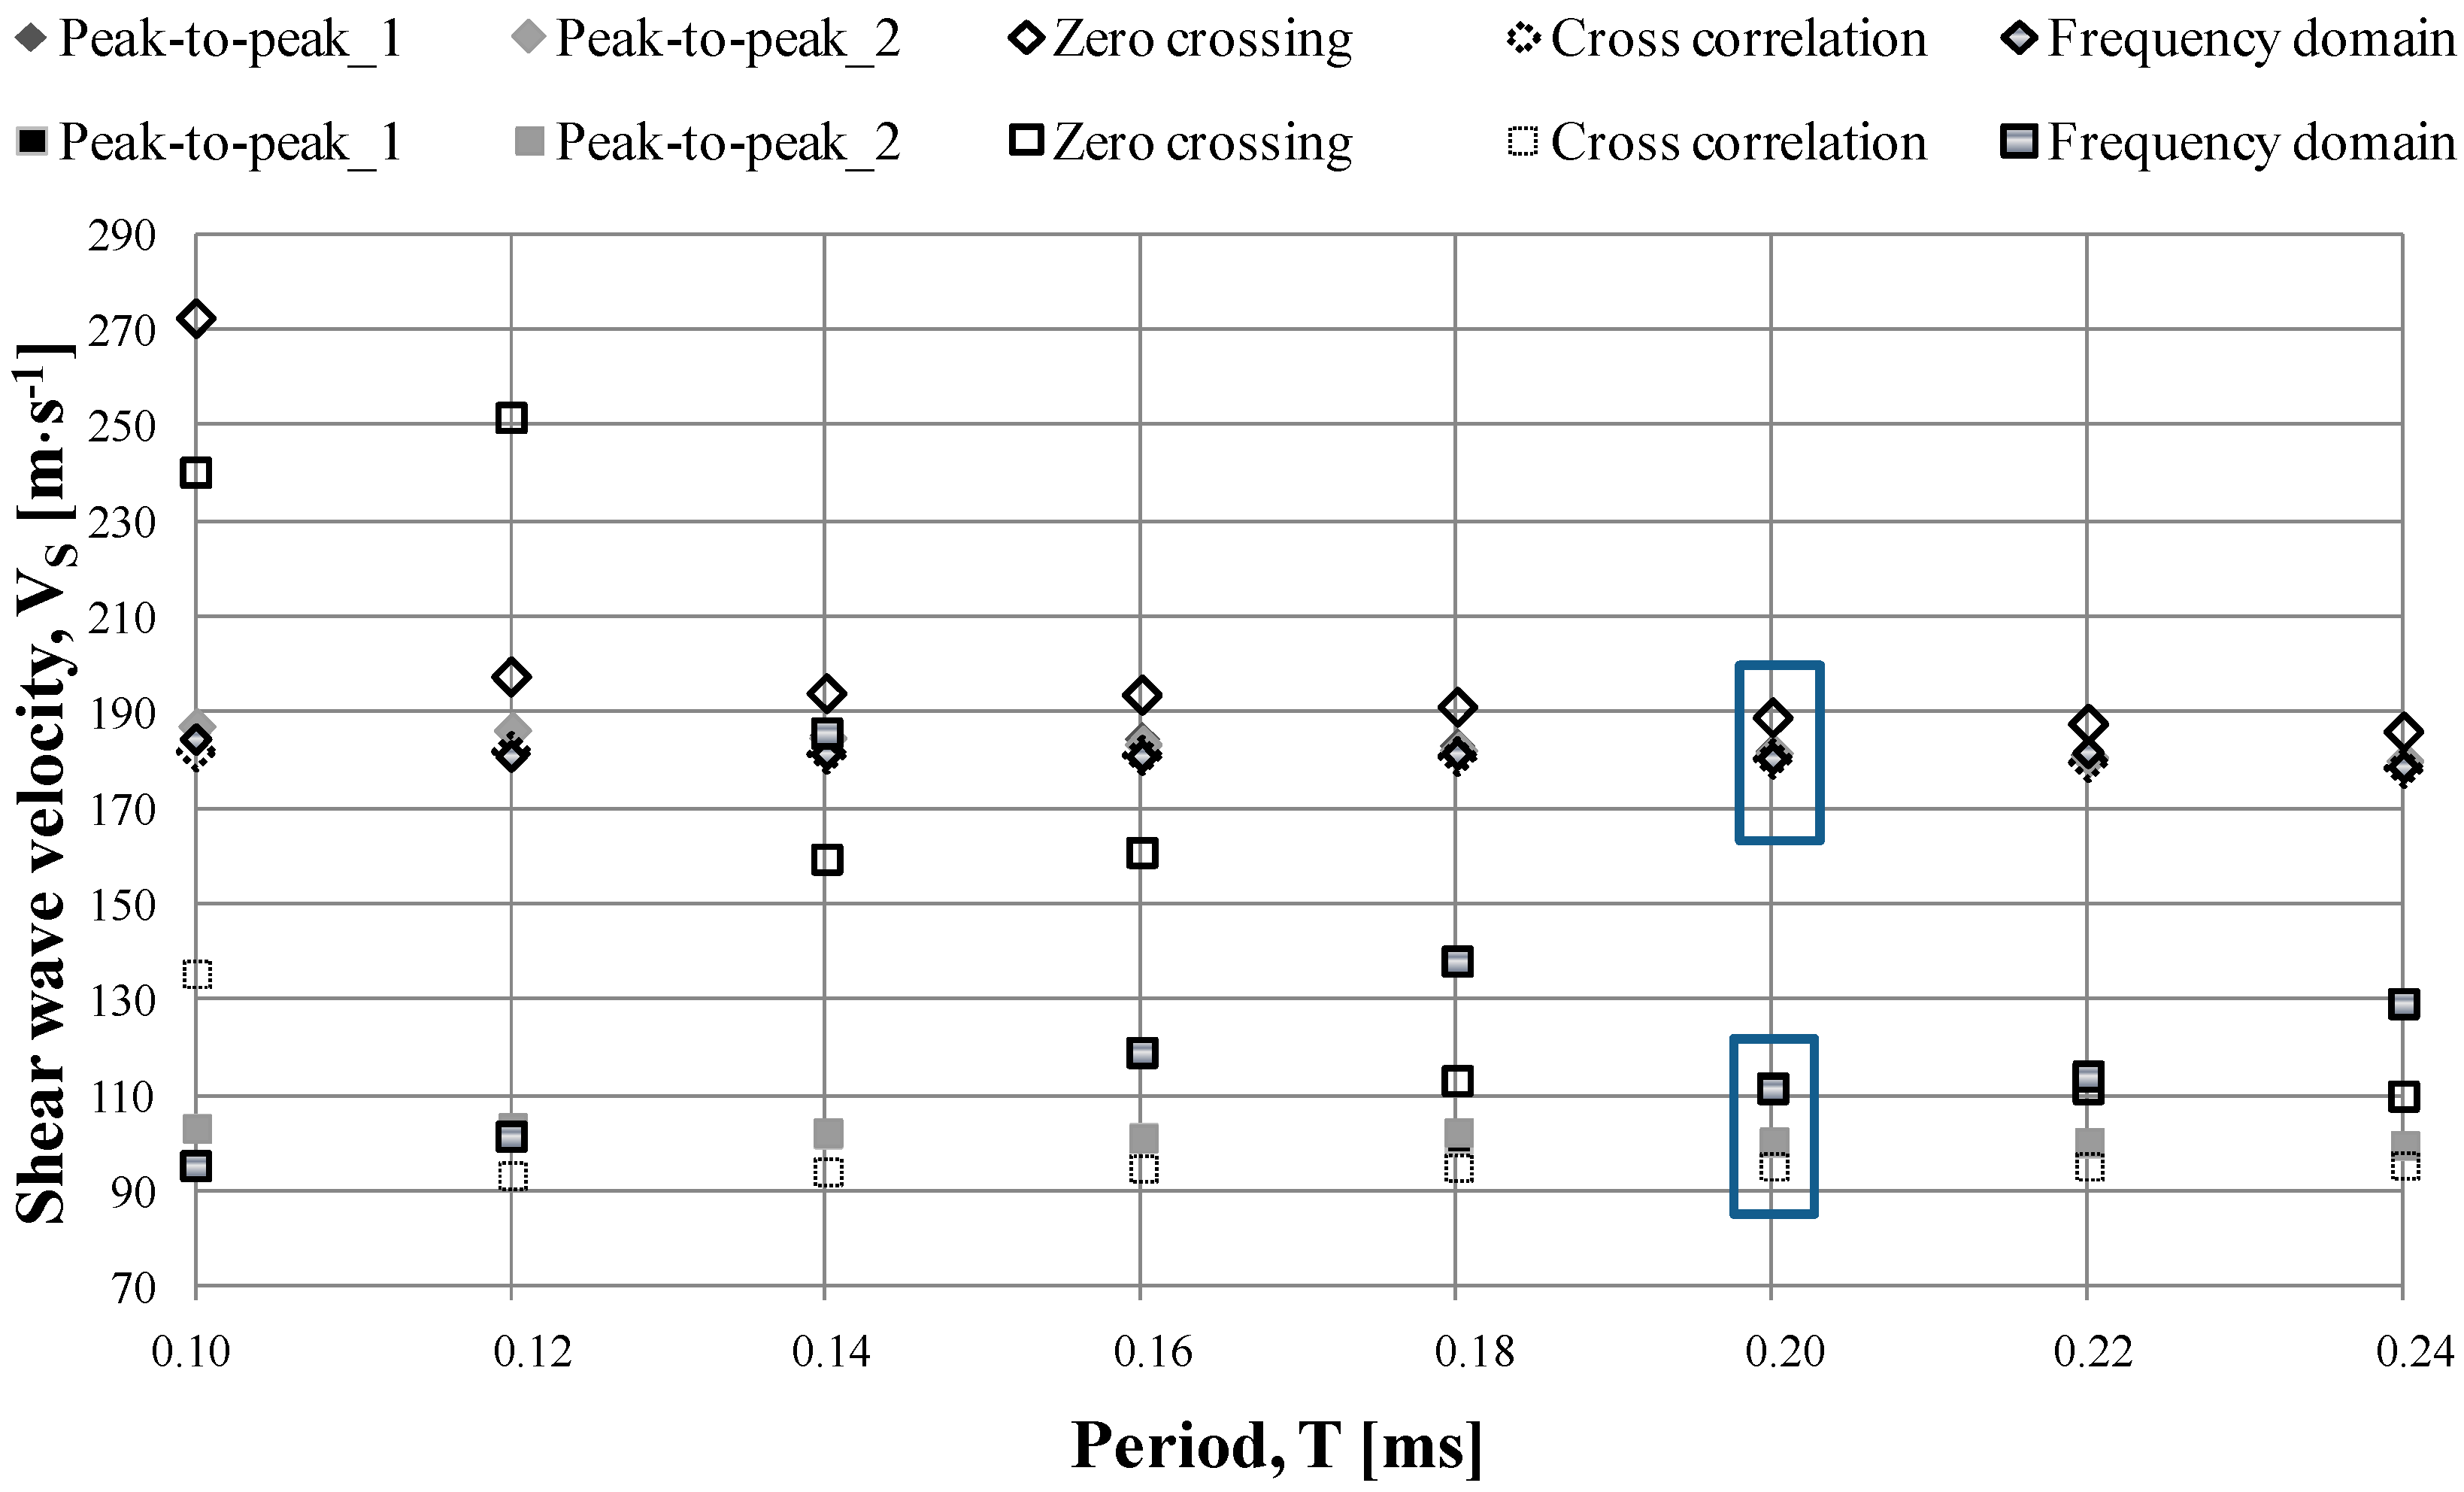
In
Figure 9,
Figure 10 and
Figure 11, a graphic variation of the
VS values with a predetermined wave’s propagation period at different specified stress level is shown. Besides, it is also a graphic comparison between the time domain and frequency domain techniques of BEs results interpretation. It is important, that for these figures, only the data when the ratio
LTT/λ was greater than 3.0 were selected. Plain RCA specimens showed higher sensitivity to the near field effect, since in their case, it was rather difficult to keep the ratio
LTT/λ at the appropriate level.
Based on these figures, and in particular,
Figure 9 and
Figure 11, the conclusion regarding zero crossing method from the statistical analysis is confirmed. Most differs this method from the others. Therefore, in the analysis of the results for
p′ = 45 kPa and
p′ = 180 kPa it was removed, completely or partially.
In all the figures, the values of shear wave velocity for compositions of RCA with rubber chips are distinctly lower and less consistent in comparison to pure RCA specimens. A great dispersion of these results is strongly remarkable. The exact values of the spread of the results, comparing two tested materials, are given in
Table 7.
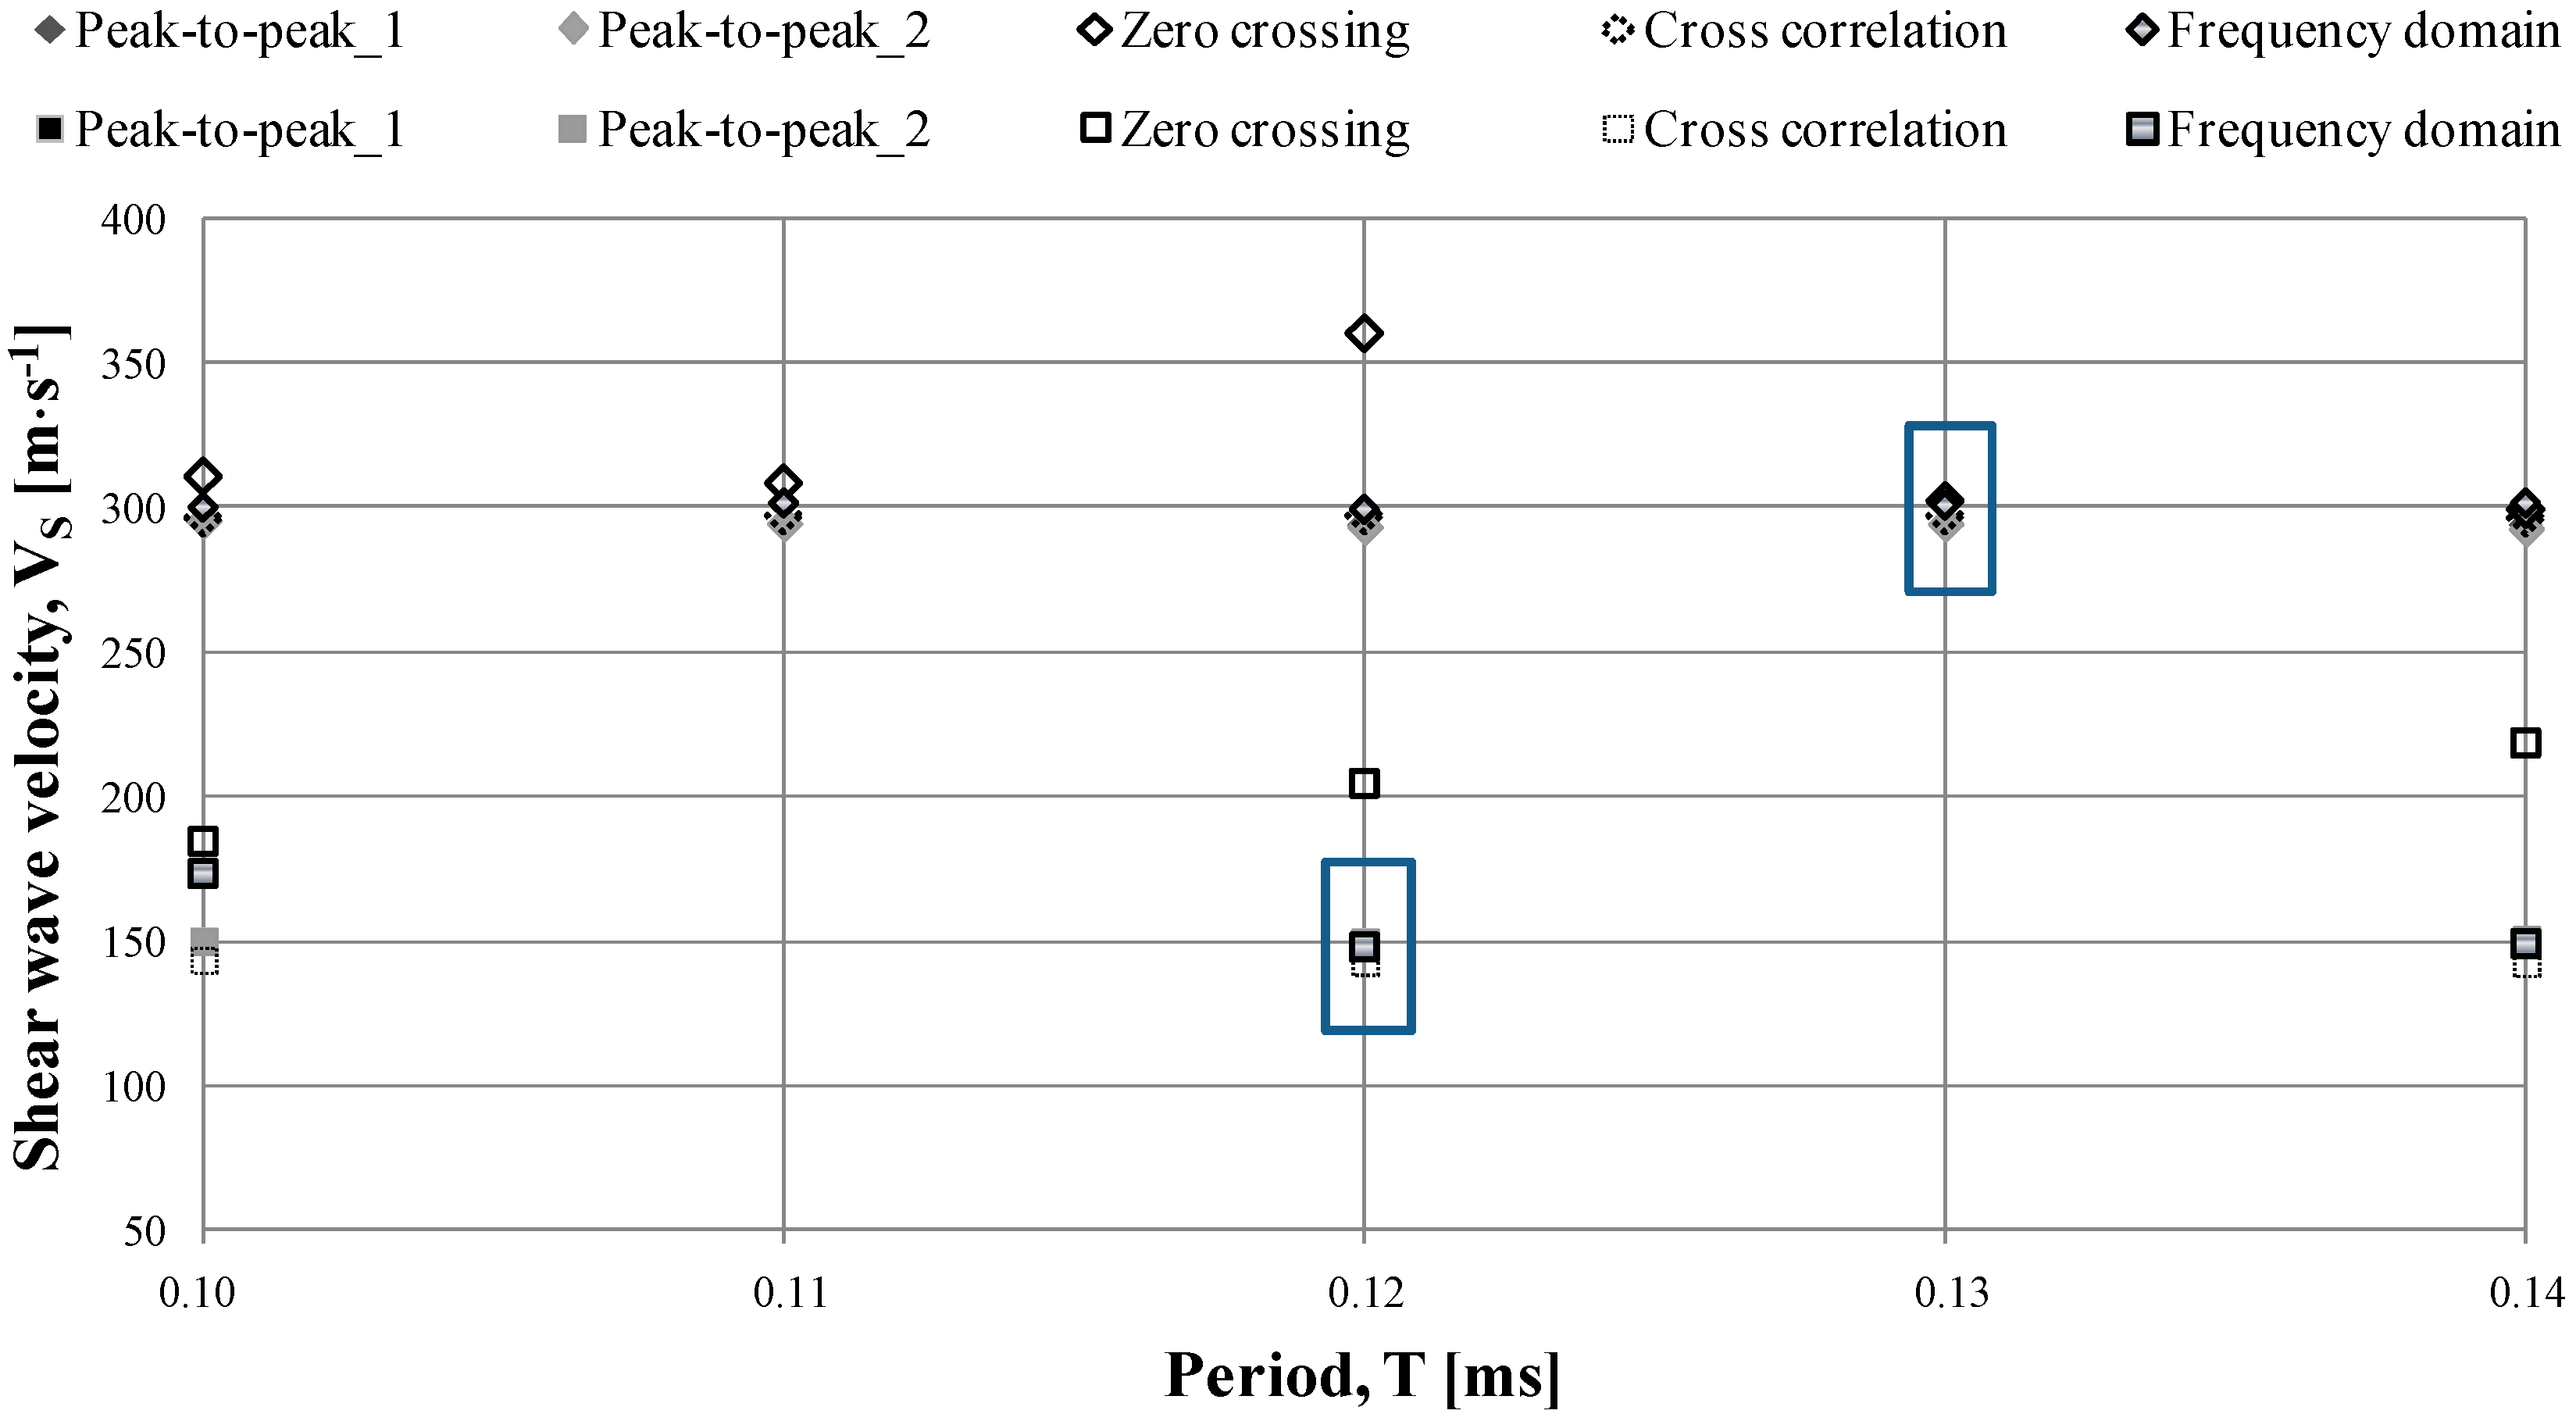
Subsequently, for further discussion, from each figure (
Figure 9,
Figure 10 and
Figure 11) certain wave’s periods were chosen, for which wave velocities were nearly identical at given mean effective stress. The selected periods differed slightly, depending on whether pure RCA or mixtures of RCA with rubber chips were analyzed, and what was the level of
p′ Then, from these wave periods finally one (marked by rectangle in
Figure 9,
Figure 10 and
Figure 11) was chosen, for which the difference between the
VS values from different methods was the lowest, from 1% up to maximum 16%. There are the following periods:
T = 0.20 ms for
p′ = 45 kPa, specimens No. 1 and 4,
T = 0.13 and 0.14 ms for
p′ = 90 kPa, specimens No. 2 and 5,
T = 0.13 and 0.12 ms for
p′ = 180 kPa, specimens No. 3 and 6.
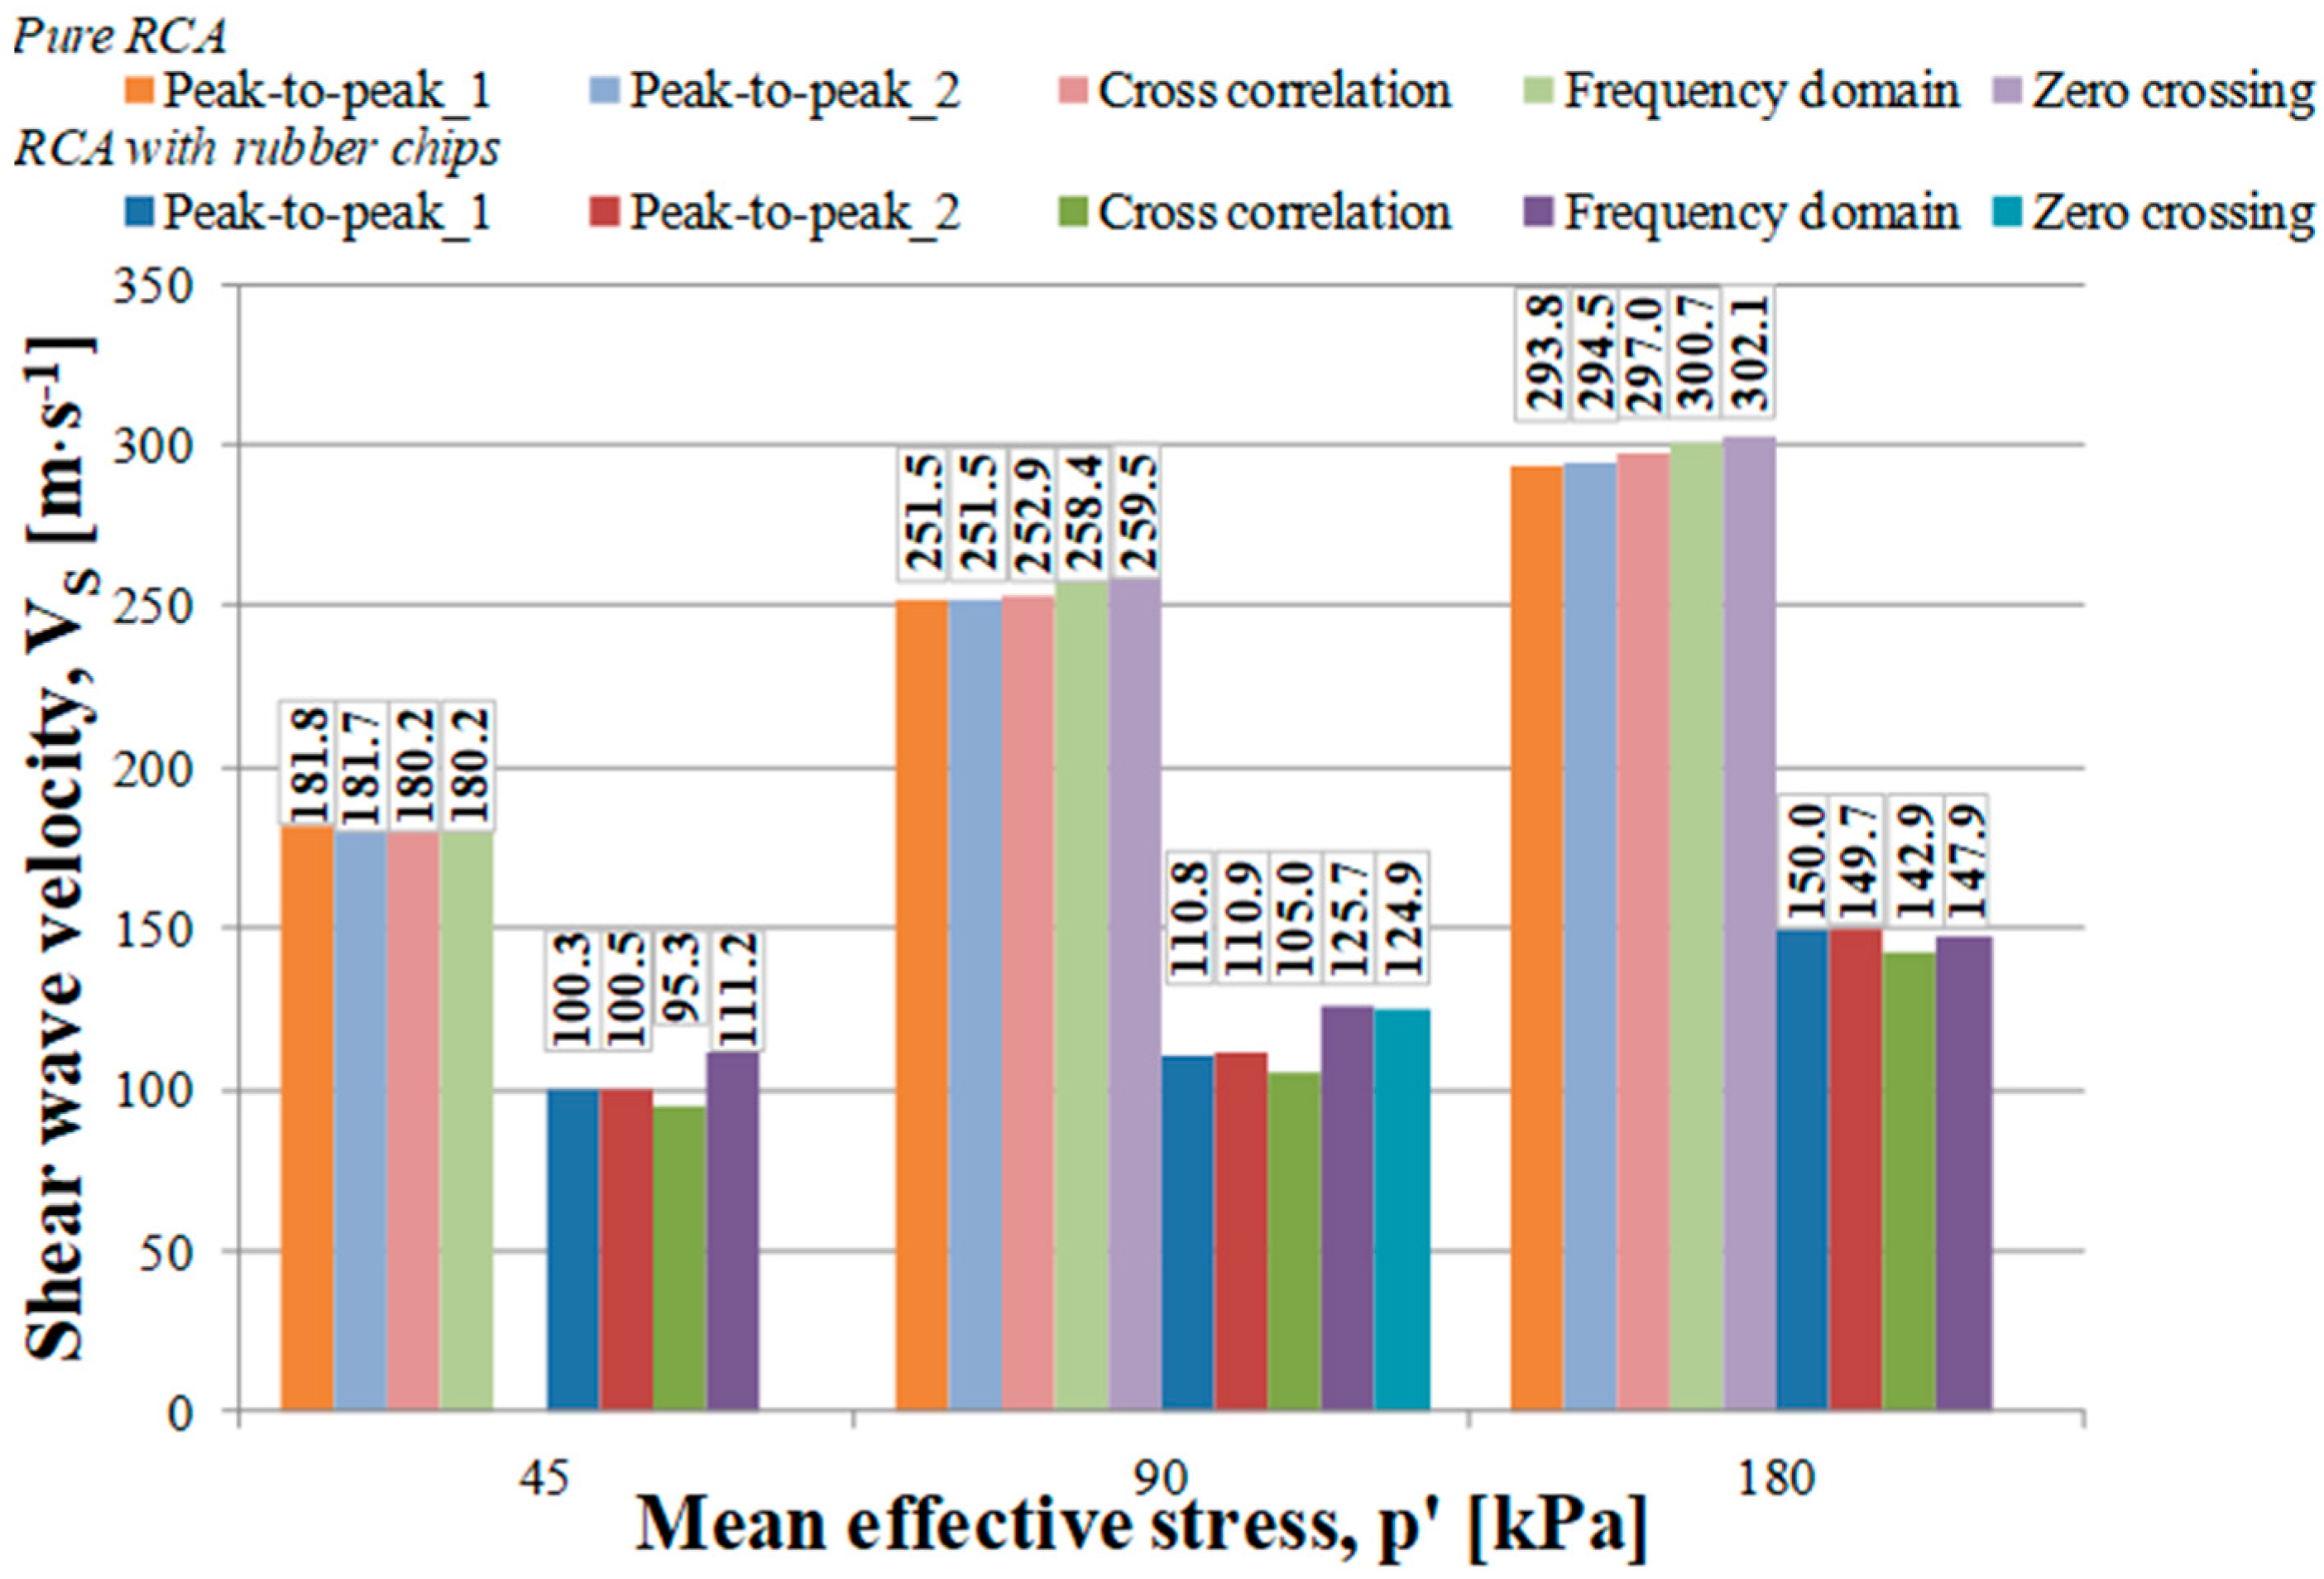
Based on the selected periods, the characteristic shear wave velocities were eventually received. In
Figure 12, the above-mentioned
VS values are shown as a function of mean effective stress, in order to compare with the reference method. The shear wave velocities vary between 180.2 and 302.1 m/s, as well as between 95.3 and 150.0 m/s (
Figure 12). In the case of modified concrete recycled aggregate, the test results are again more scattered. This can be explained, e.g., by the properties and behavior of rubber themselves. Rubber chips do not absorb water and behave differently that grain of soil. Hence, they cannot be saturated with water when the specimen is being saturated and can be very mobile during wave’s propagation. They can move simply inside the specimen. Two identical measurements are performed, but the conditions inside the specimen tested are already different, because of various arrangements of rubber grains. Therefore, in the case of this modified material, it is difficult to get consistent results.
It is evident that, regardless of the type of a test material, the VS values increase with the increase in the p′ values. As far as pure RCA specimens are concerned, this is an increase of an average of 29% when p′ changes from 45 to 90 kPa, and of 14% with an increase in p′ from 90 to 180 kPa. At first, VS changes are greater, than smaller, with higher p′. In the case of modified RCA, the VS values increase of about 10% and 23%, when mean effective stress increases respectively from 45 to 90 kPa and from 90 to 180 kPa. Here, the trend of VS changes is reverse, first there are smaller, than greater changes.
According to
Figure 12, the highest
VS values can be establish using zero crossing technique, next frequency domain and cross correlation, but only for higher stresses. This finding is not in concordance with the results for
p′ = 45 kPa, where the highest
VS give peak-to-peak methods. However, the difference between the various methods of BEs results interpretation is at the level of from 1% to the maximum 3%.
As it can be seen in
Figure 12, the highest
VS values for RCA with rubber chips at
p′ = 45 and 90 kPa concerns frequency domain method, whereas at
p′ = 180 kPa—peak-to-peak method. On the other hand, cross correlation method produces the lowest
VS values, in spite of the stress level. Moreover, the higher difference between the various methods of BEs results interpretation than for rubber-soil mixtures can be observed, i.e., from 5% to the maximum 16%.
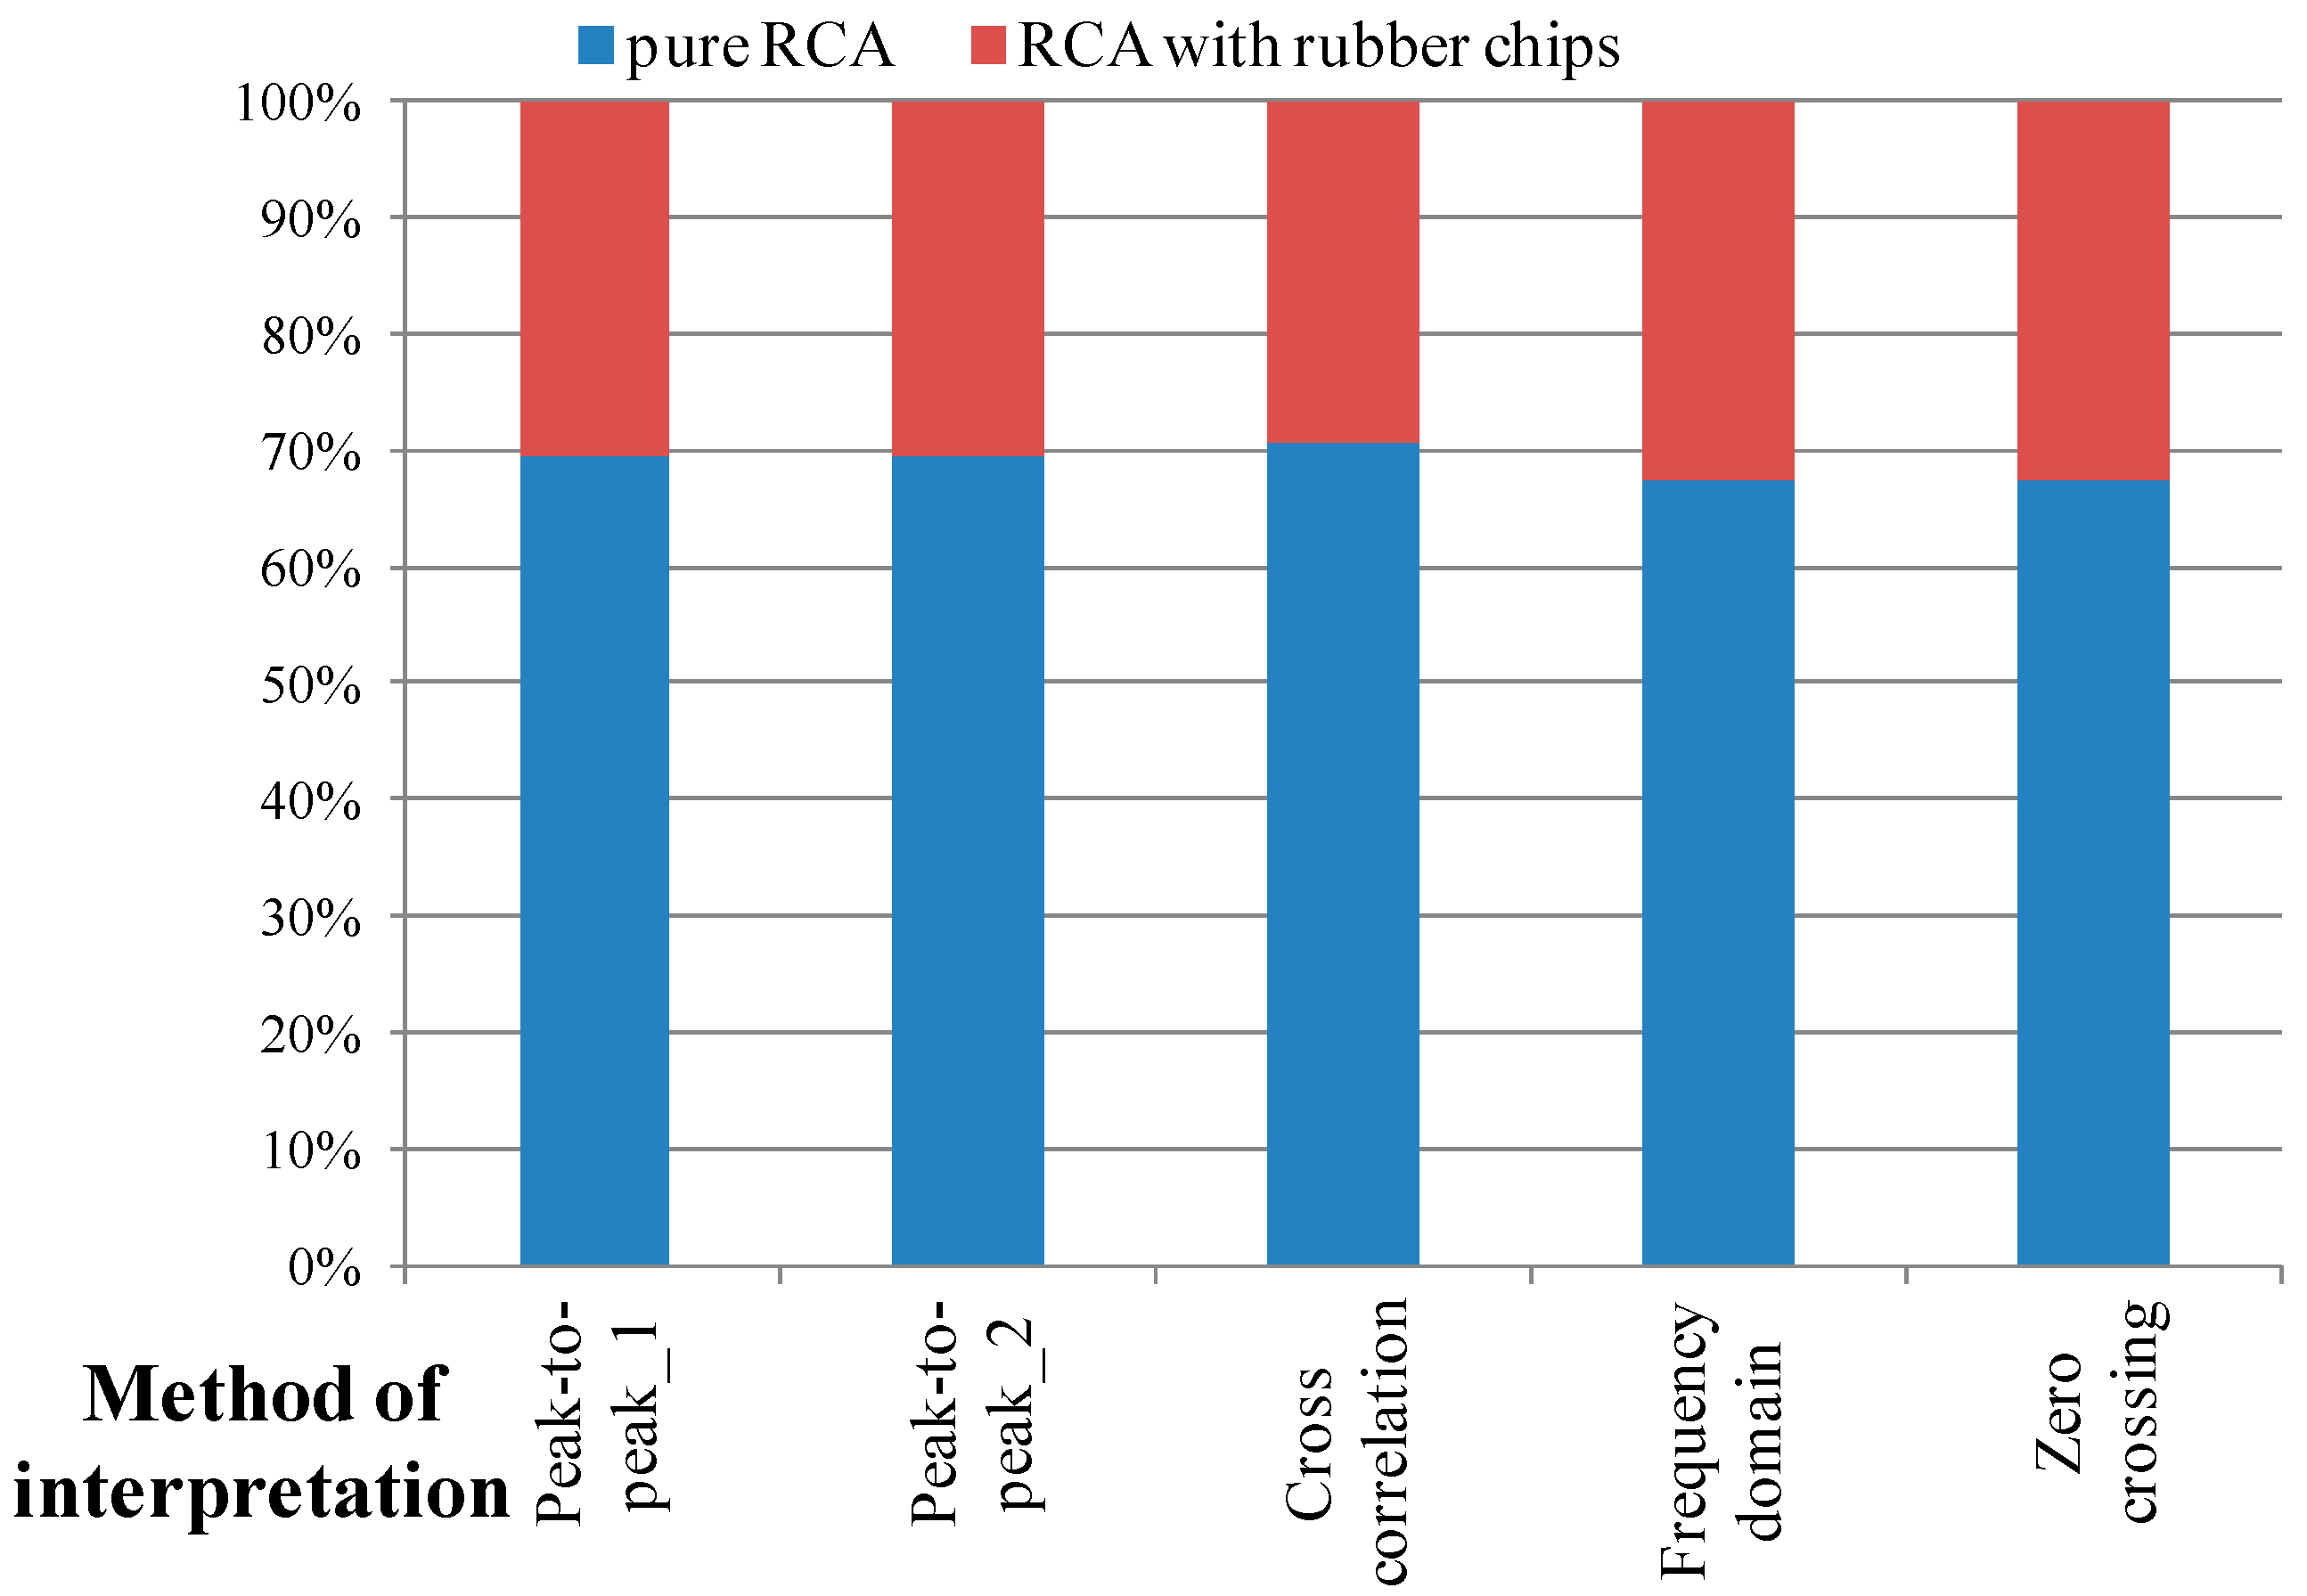
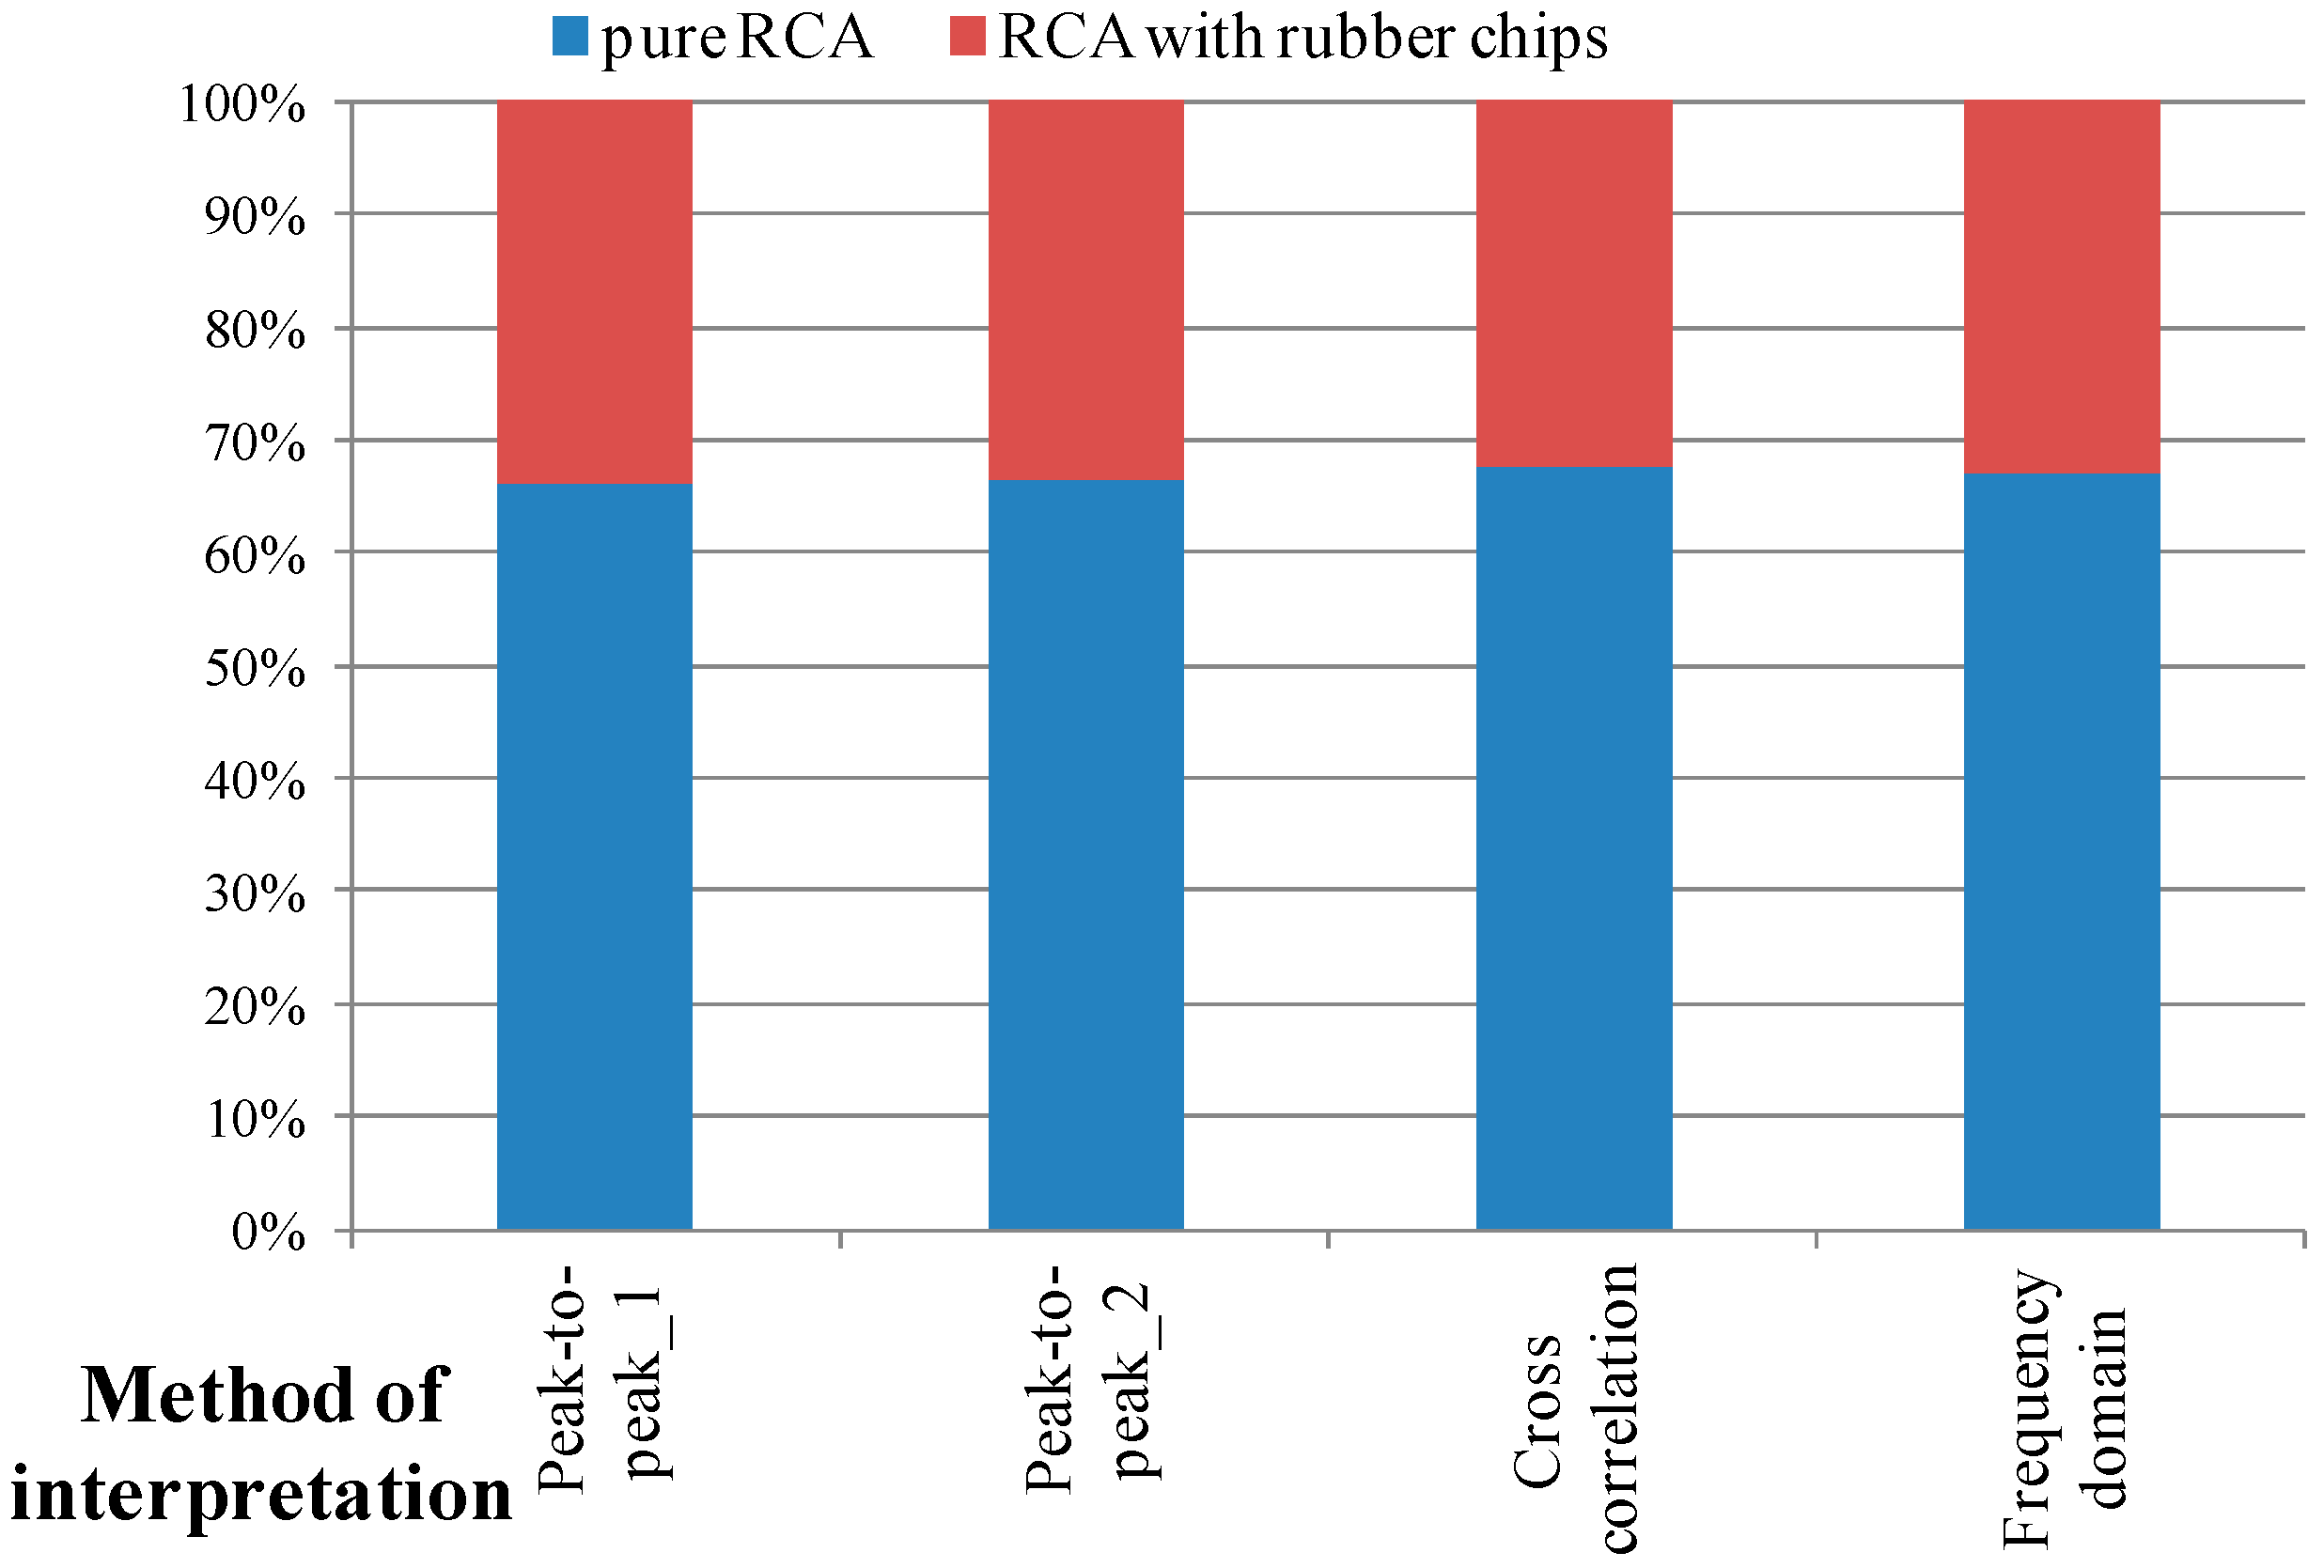
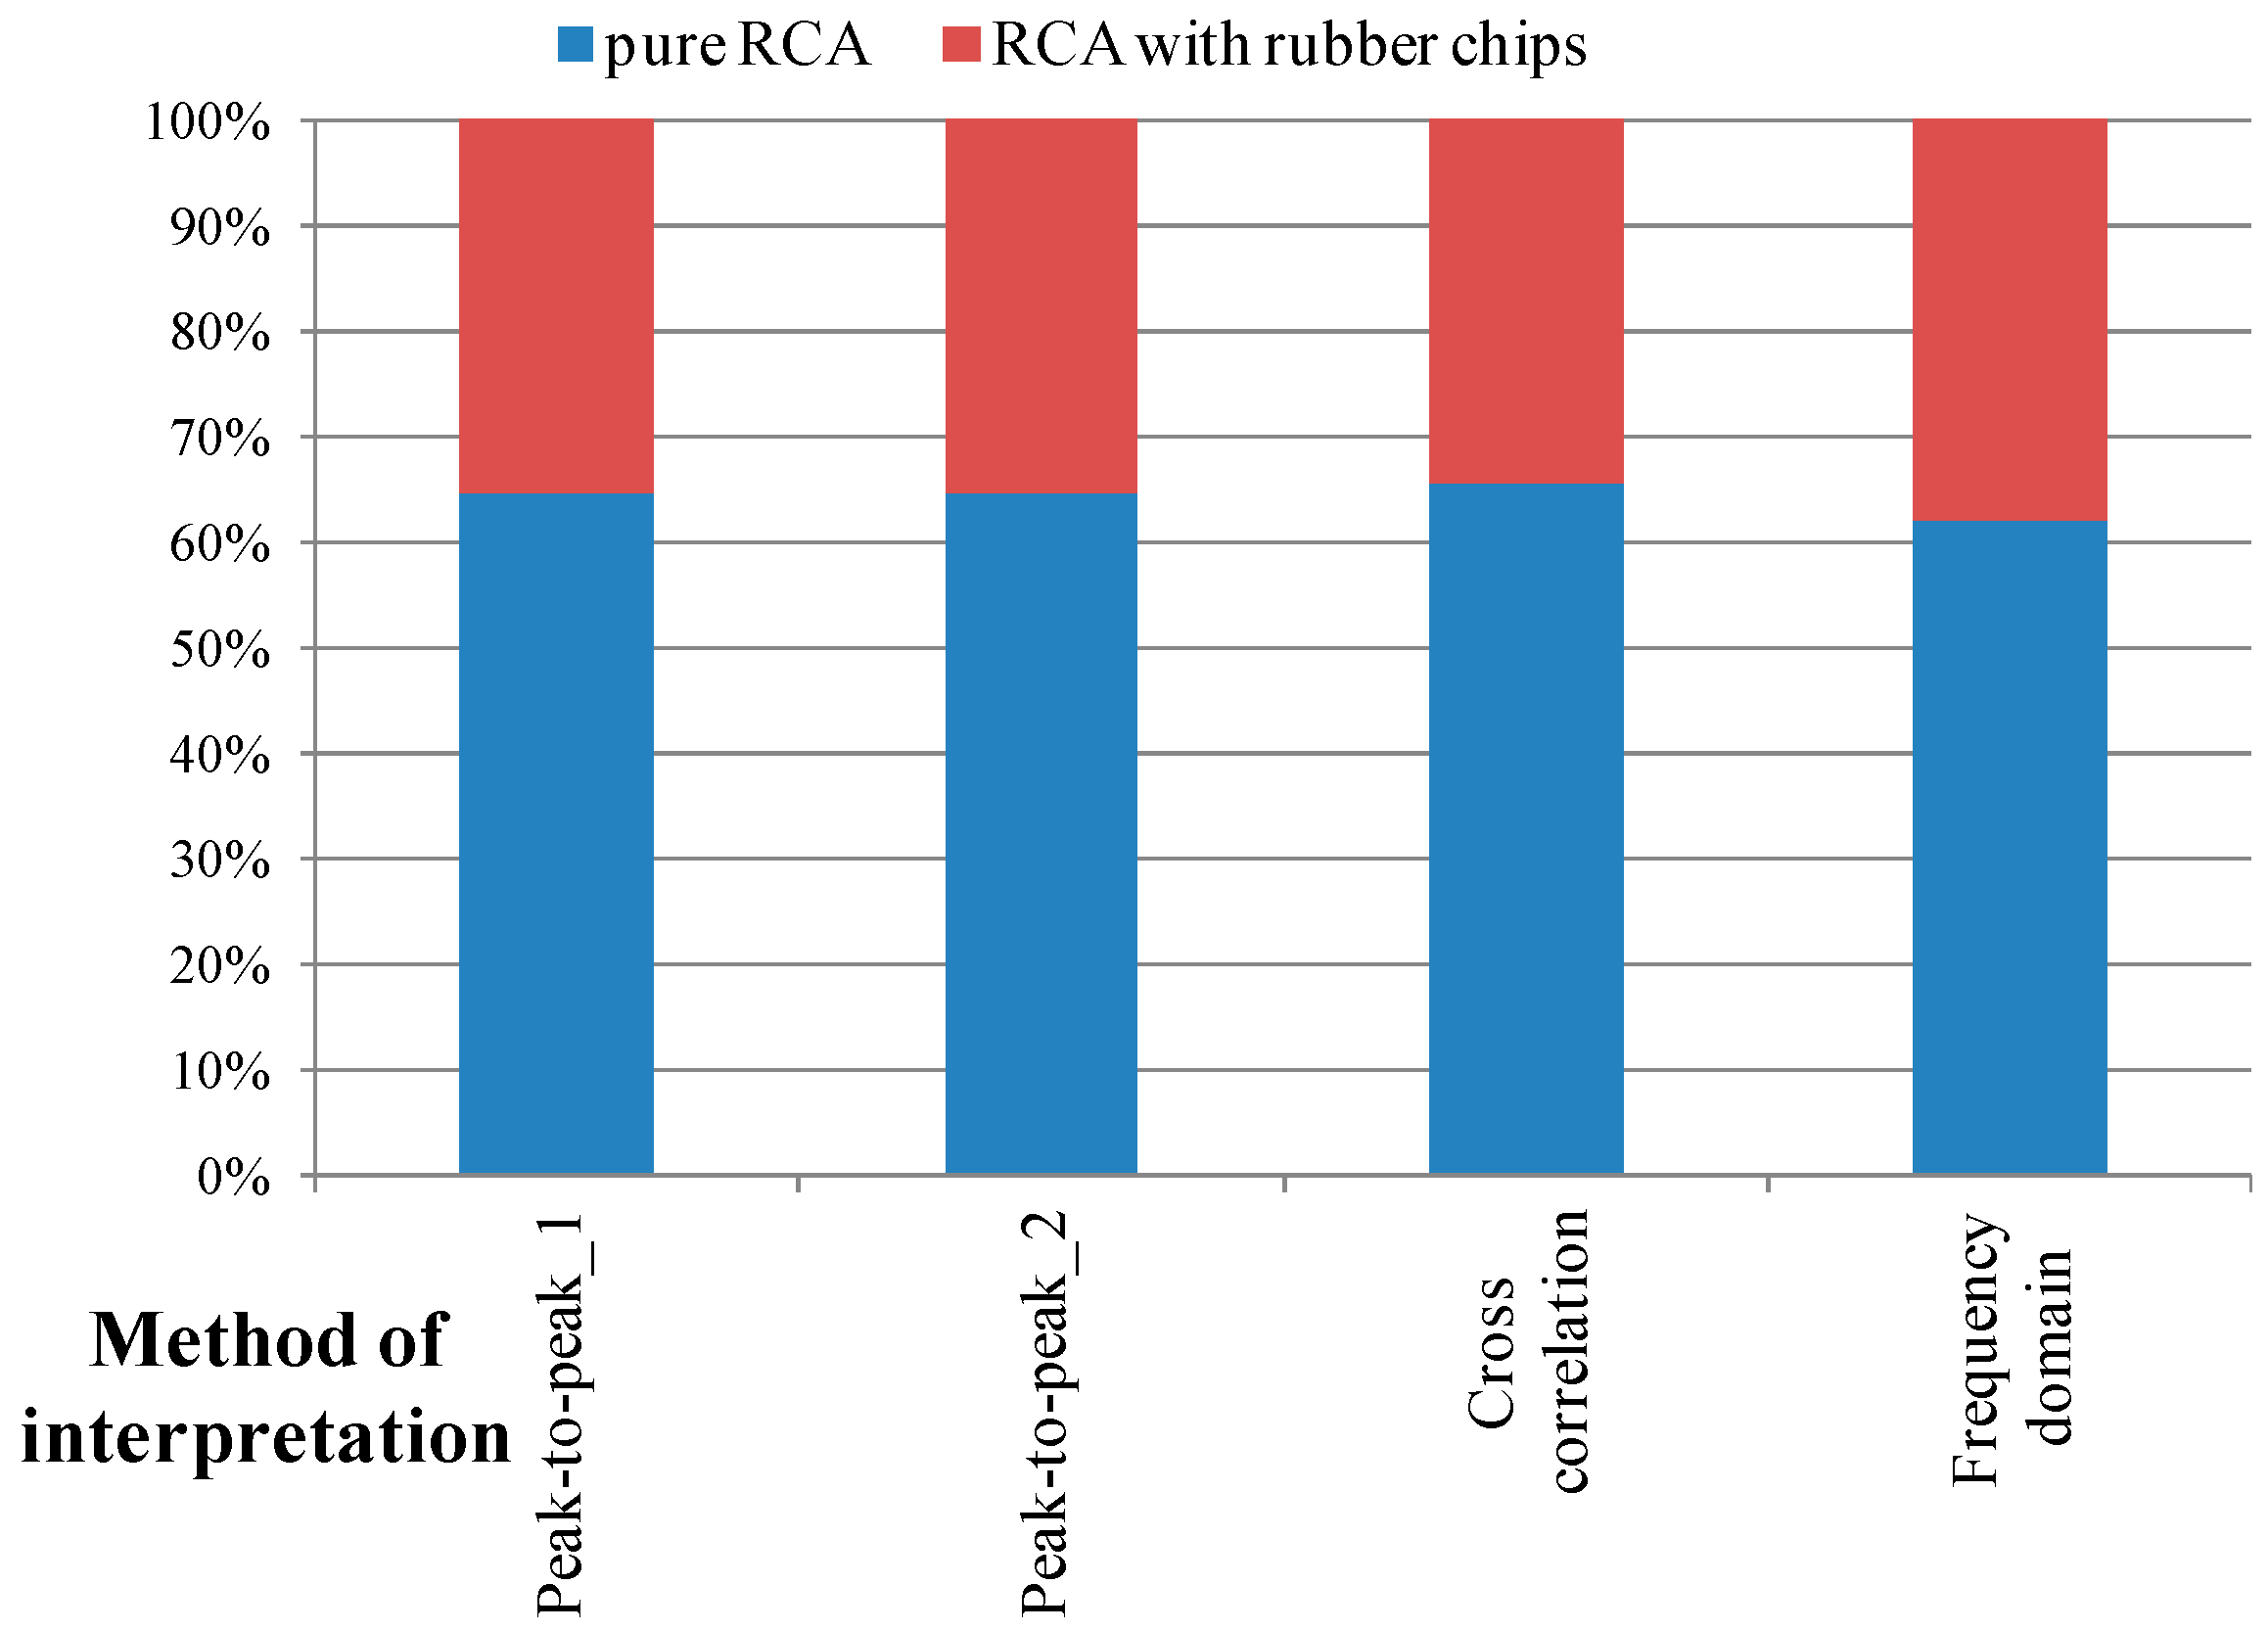
Figure 13,
Figure 14 and
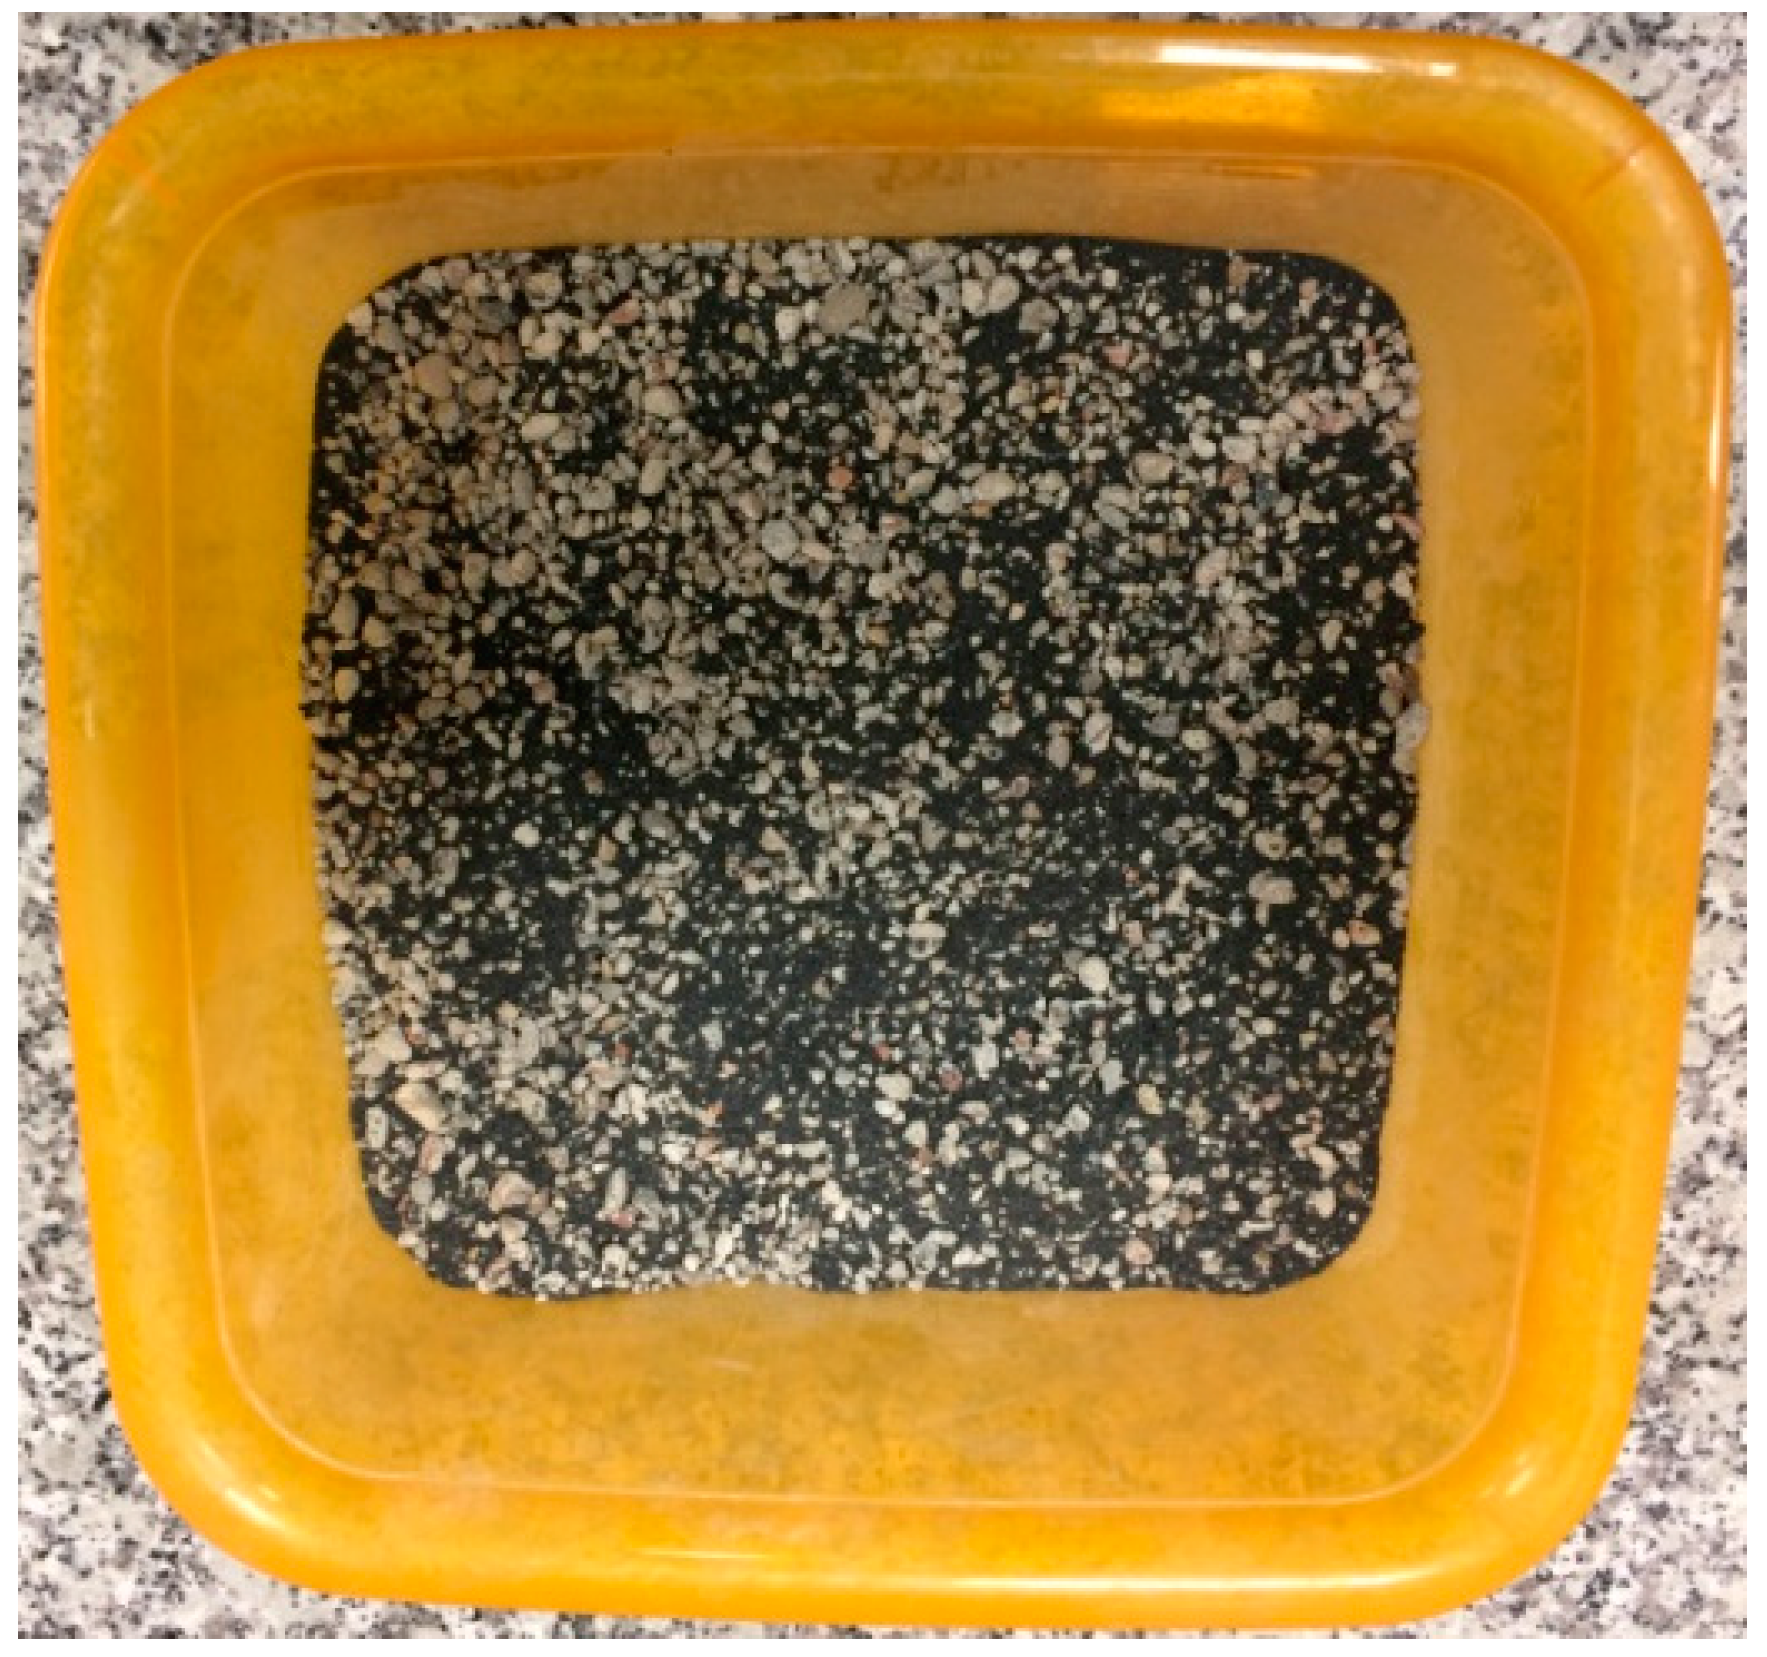
Figure 15 represent a comparison between the results for both examined materials: pure RCA and its composition with rubber. In the case of any applied methods of determination of shear wave velocity, the replacement of RCA by rubber chips, for 15%, causes a reduction in the
VS values. It is shown that this decrease in wave velocities is of the order of 20–40%, depending on the
p′ values. Generally, the same tendency is observed for all the mean effective stresses. With an increase in
p′, the greater differences in the
VS values for two tested materials are observed. This trend was predictable. According to the literature [
35], due to rubber insertion into soil, stiffness of this type of composition decreases, and then the
VS values too. RCA with rubber chips is softer material than pure RCA, because rubber itself is softer than soil. The softer is the system, the lower are the wave velocities and the more diverse.


