
DegoViz: An Interactive Visualization Tool for a Differentially Expressed Genes Heatmap and Gene Ontology Graph


Abstract
:1. Introduction
2. Materials and Methods
2.1. Related Works
2.2. Functions of DegoViz and Development Environment
3. Results
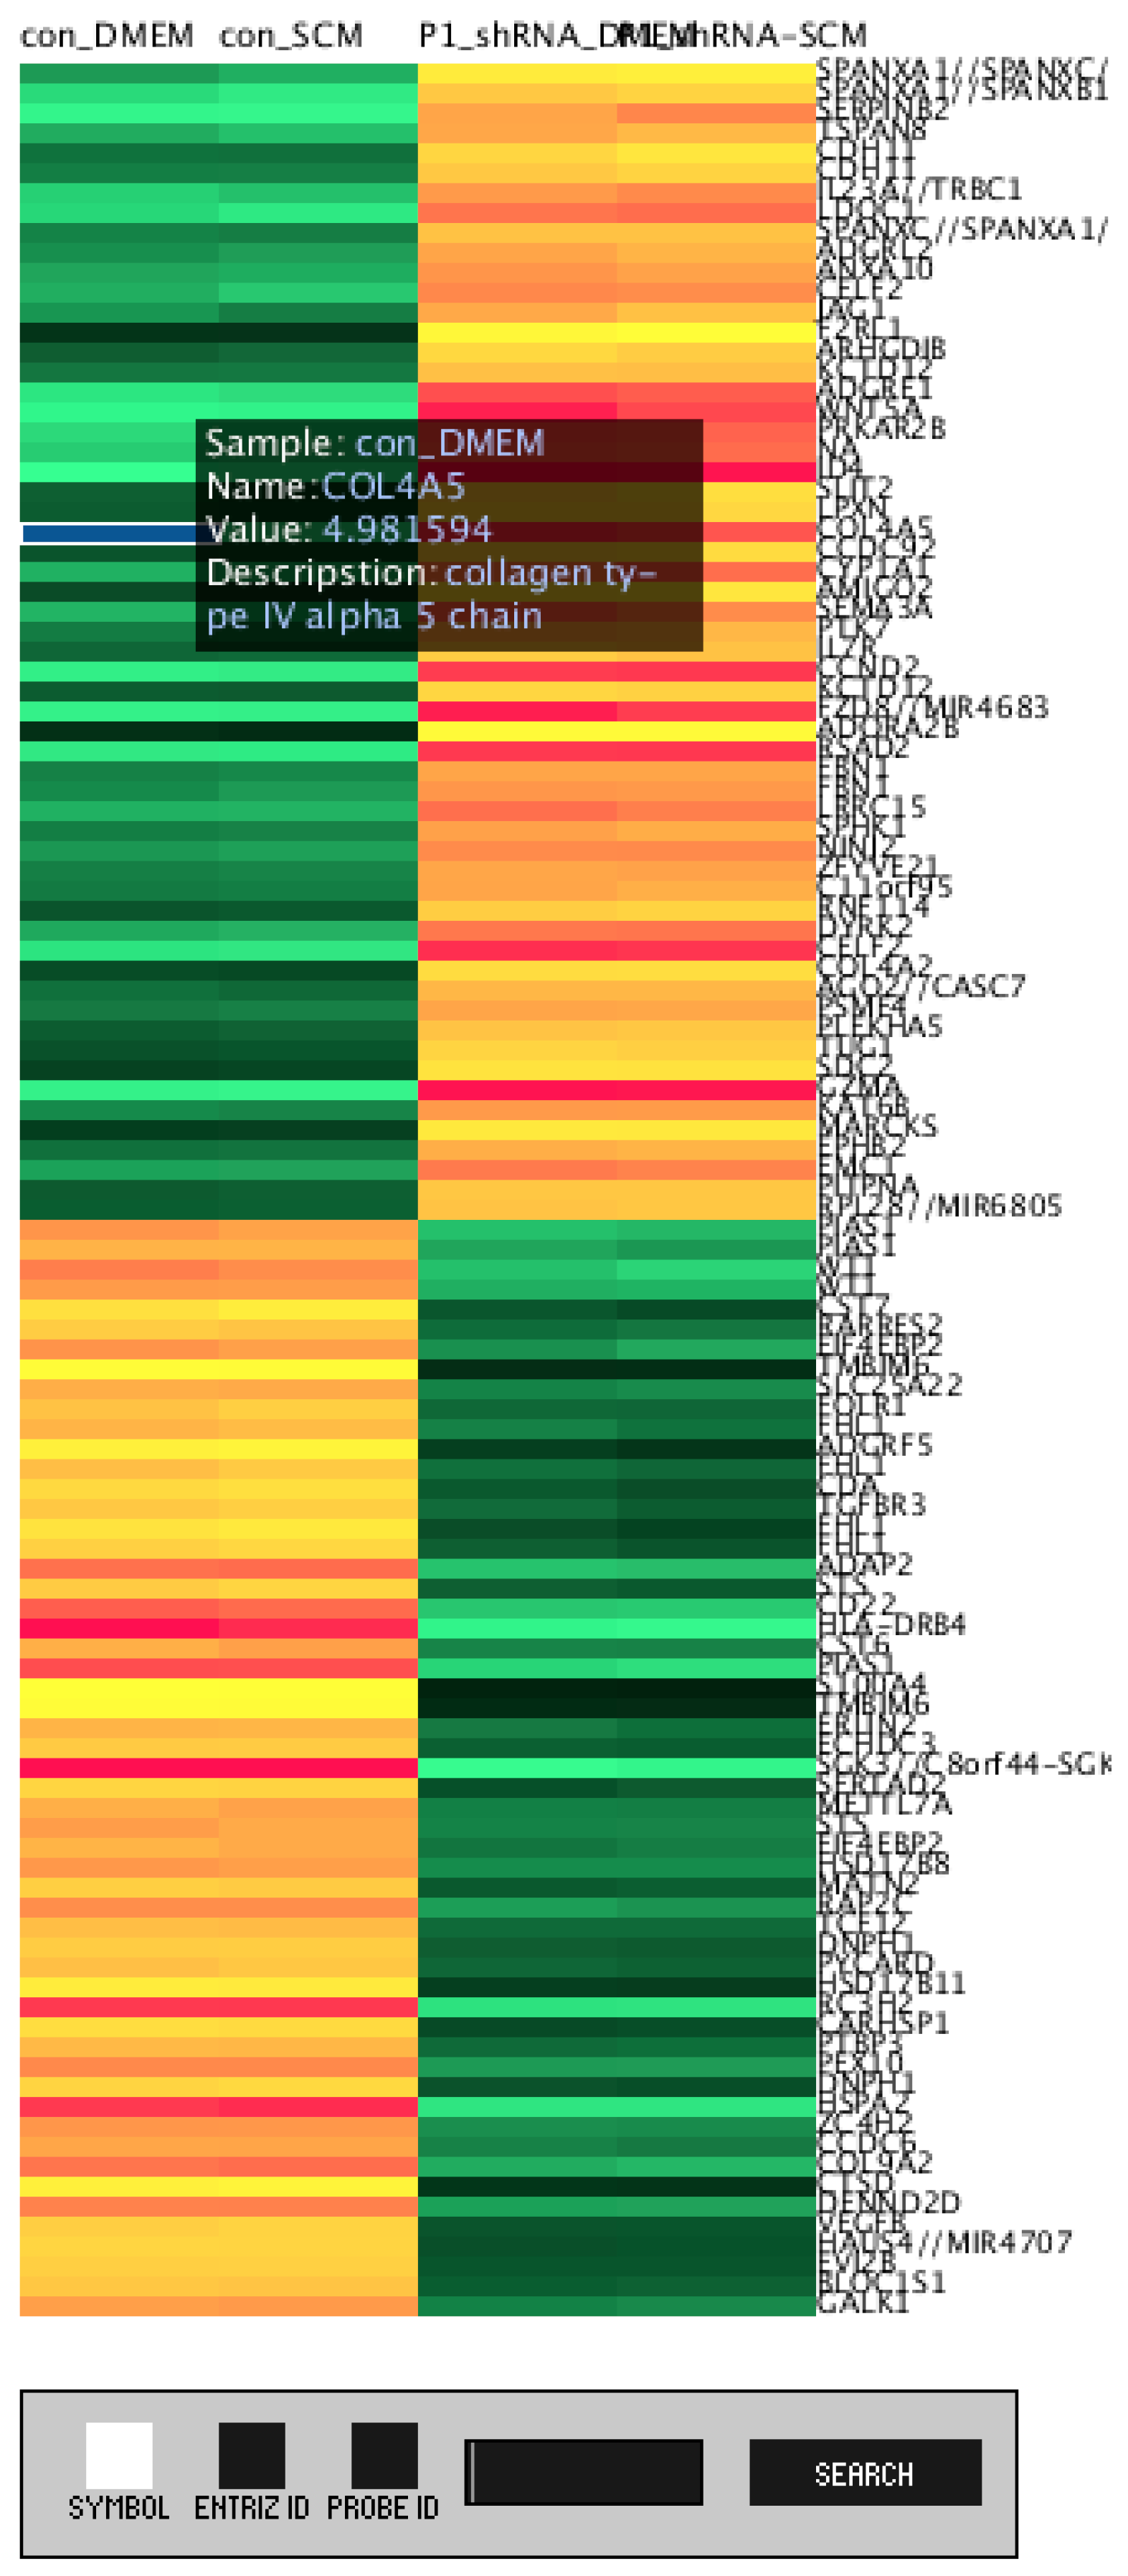
3.1. DEG Heatmap
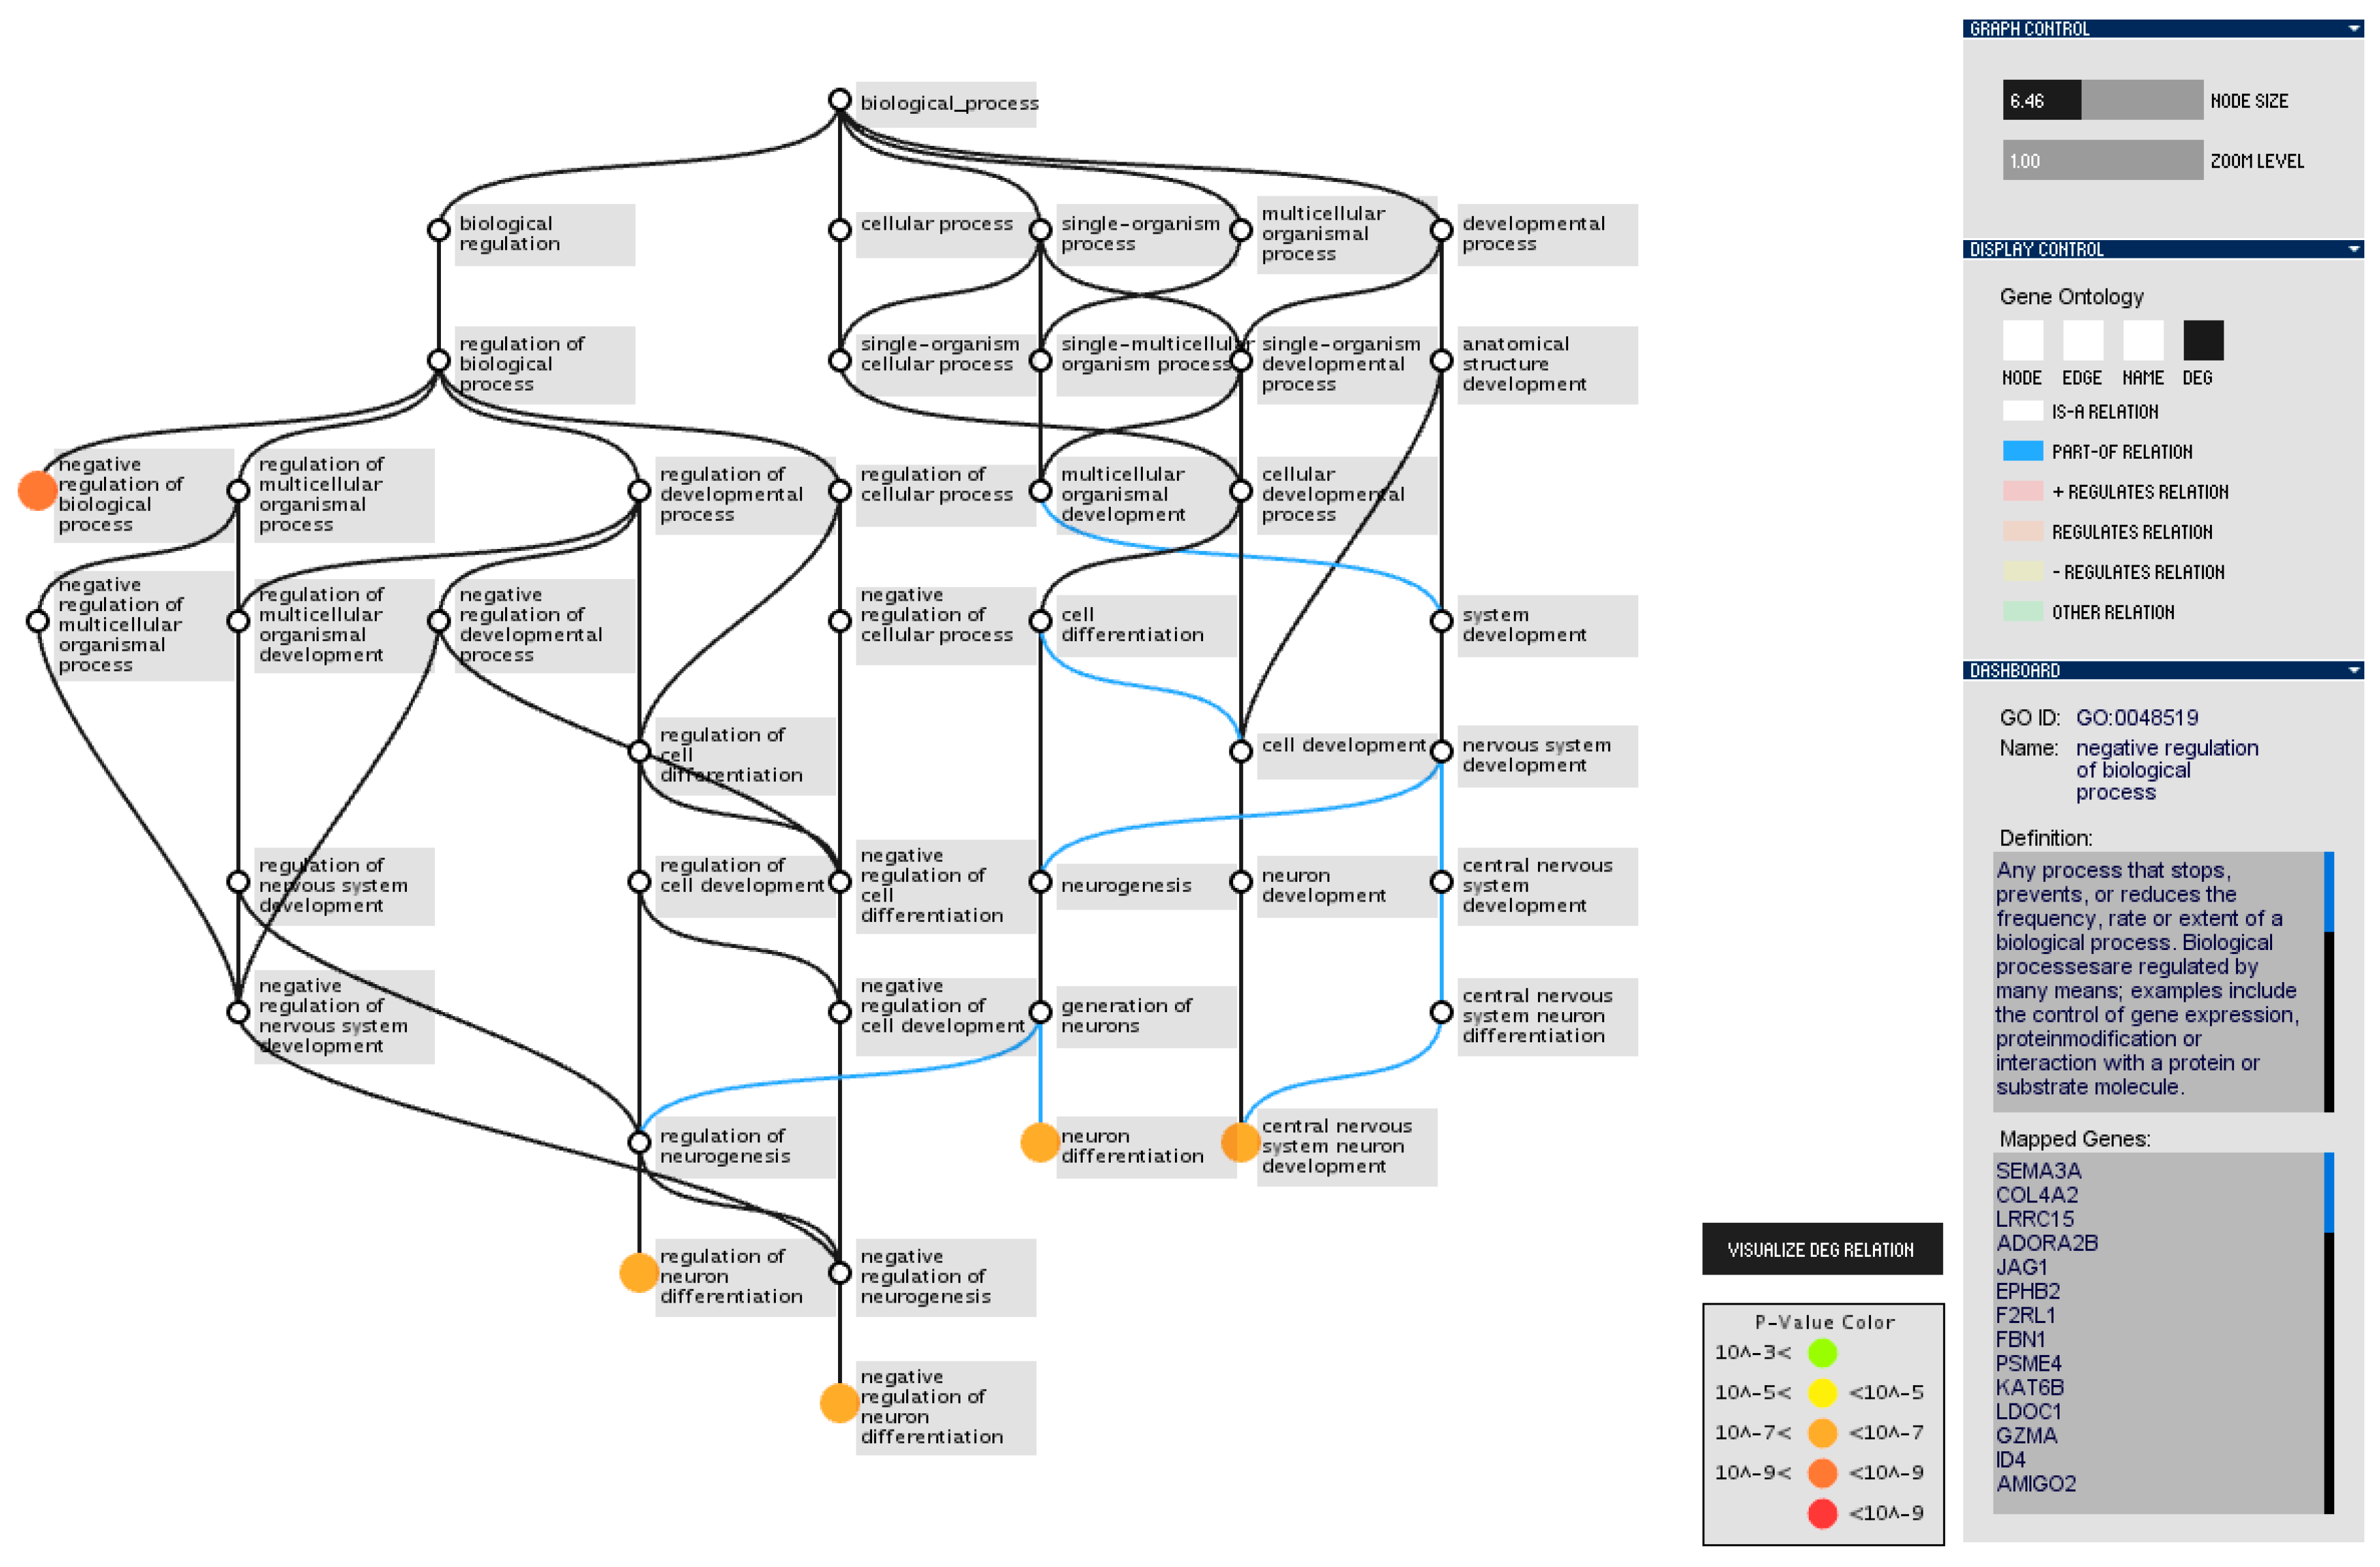
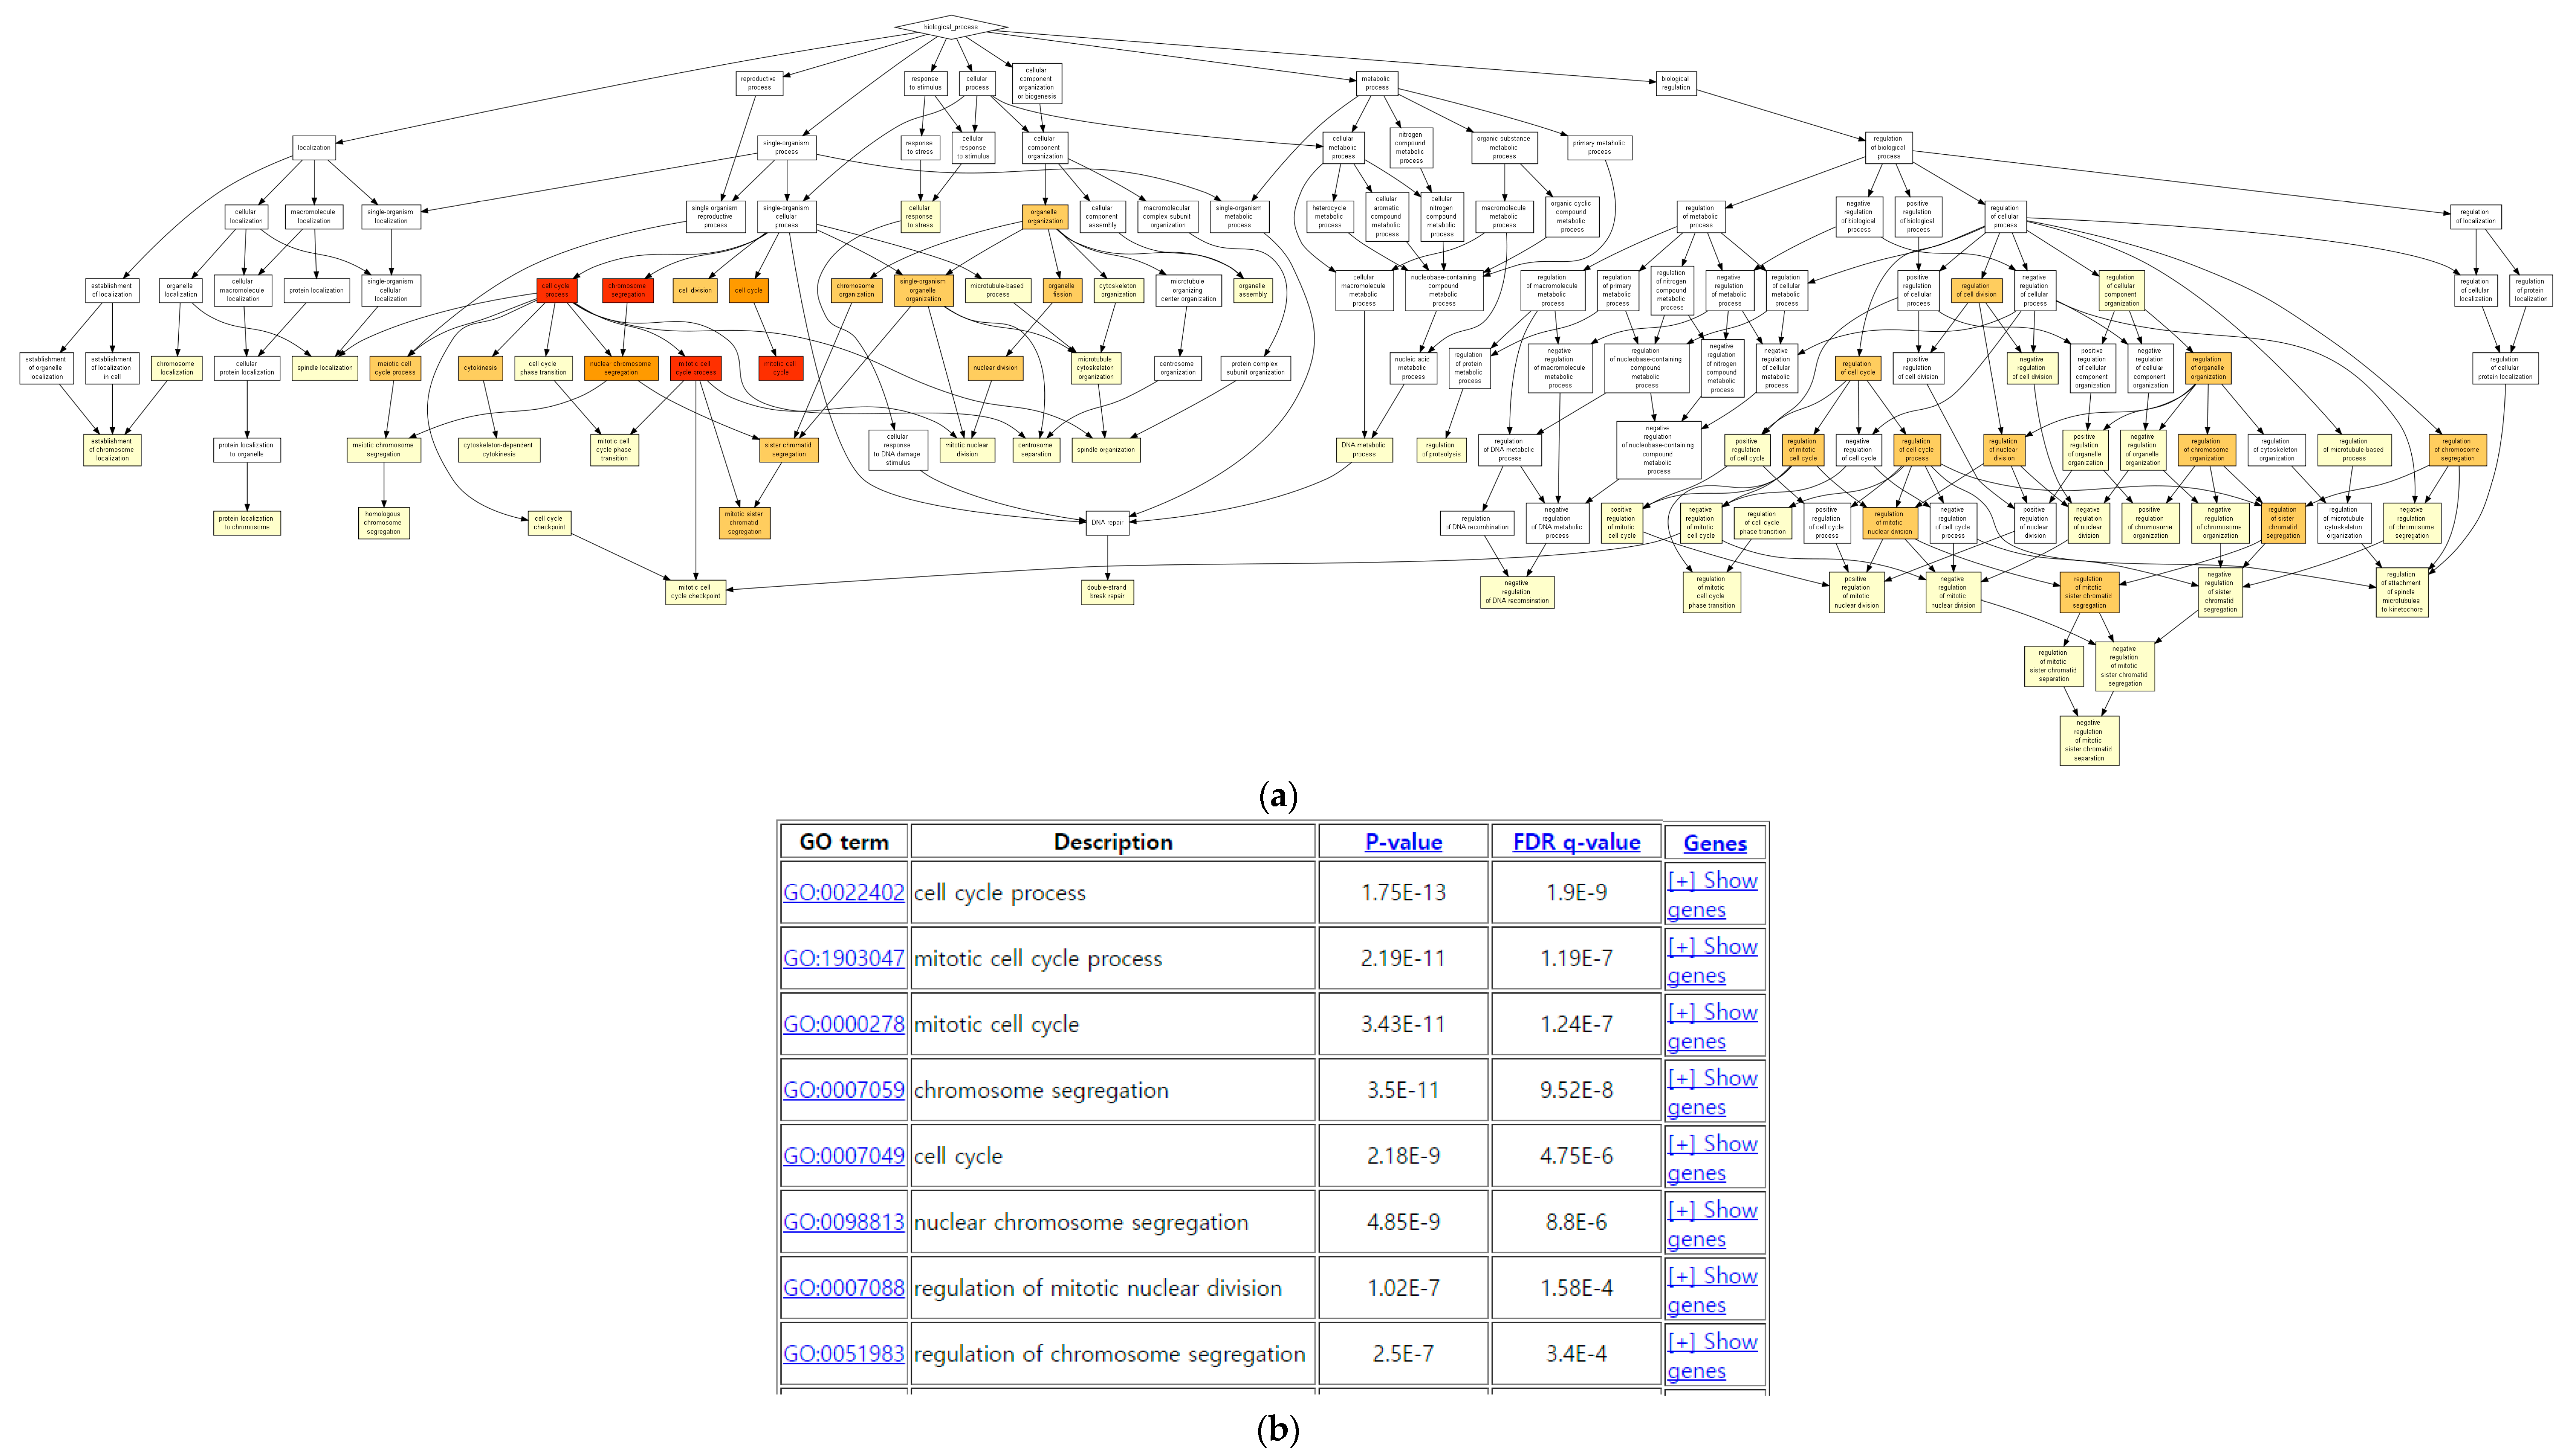
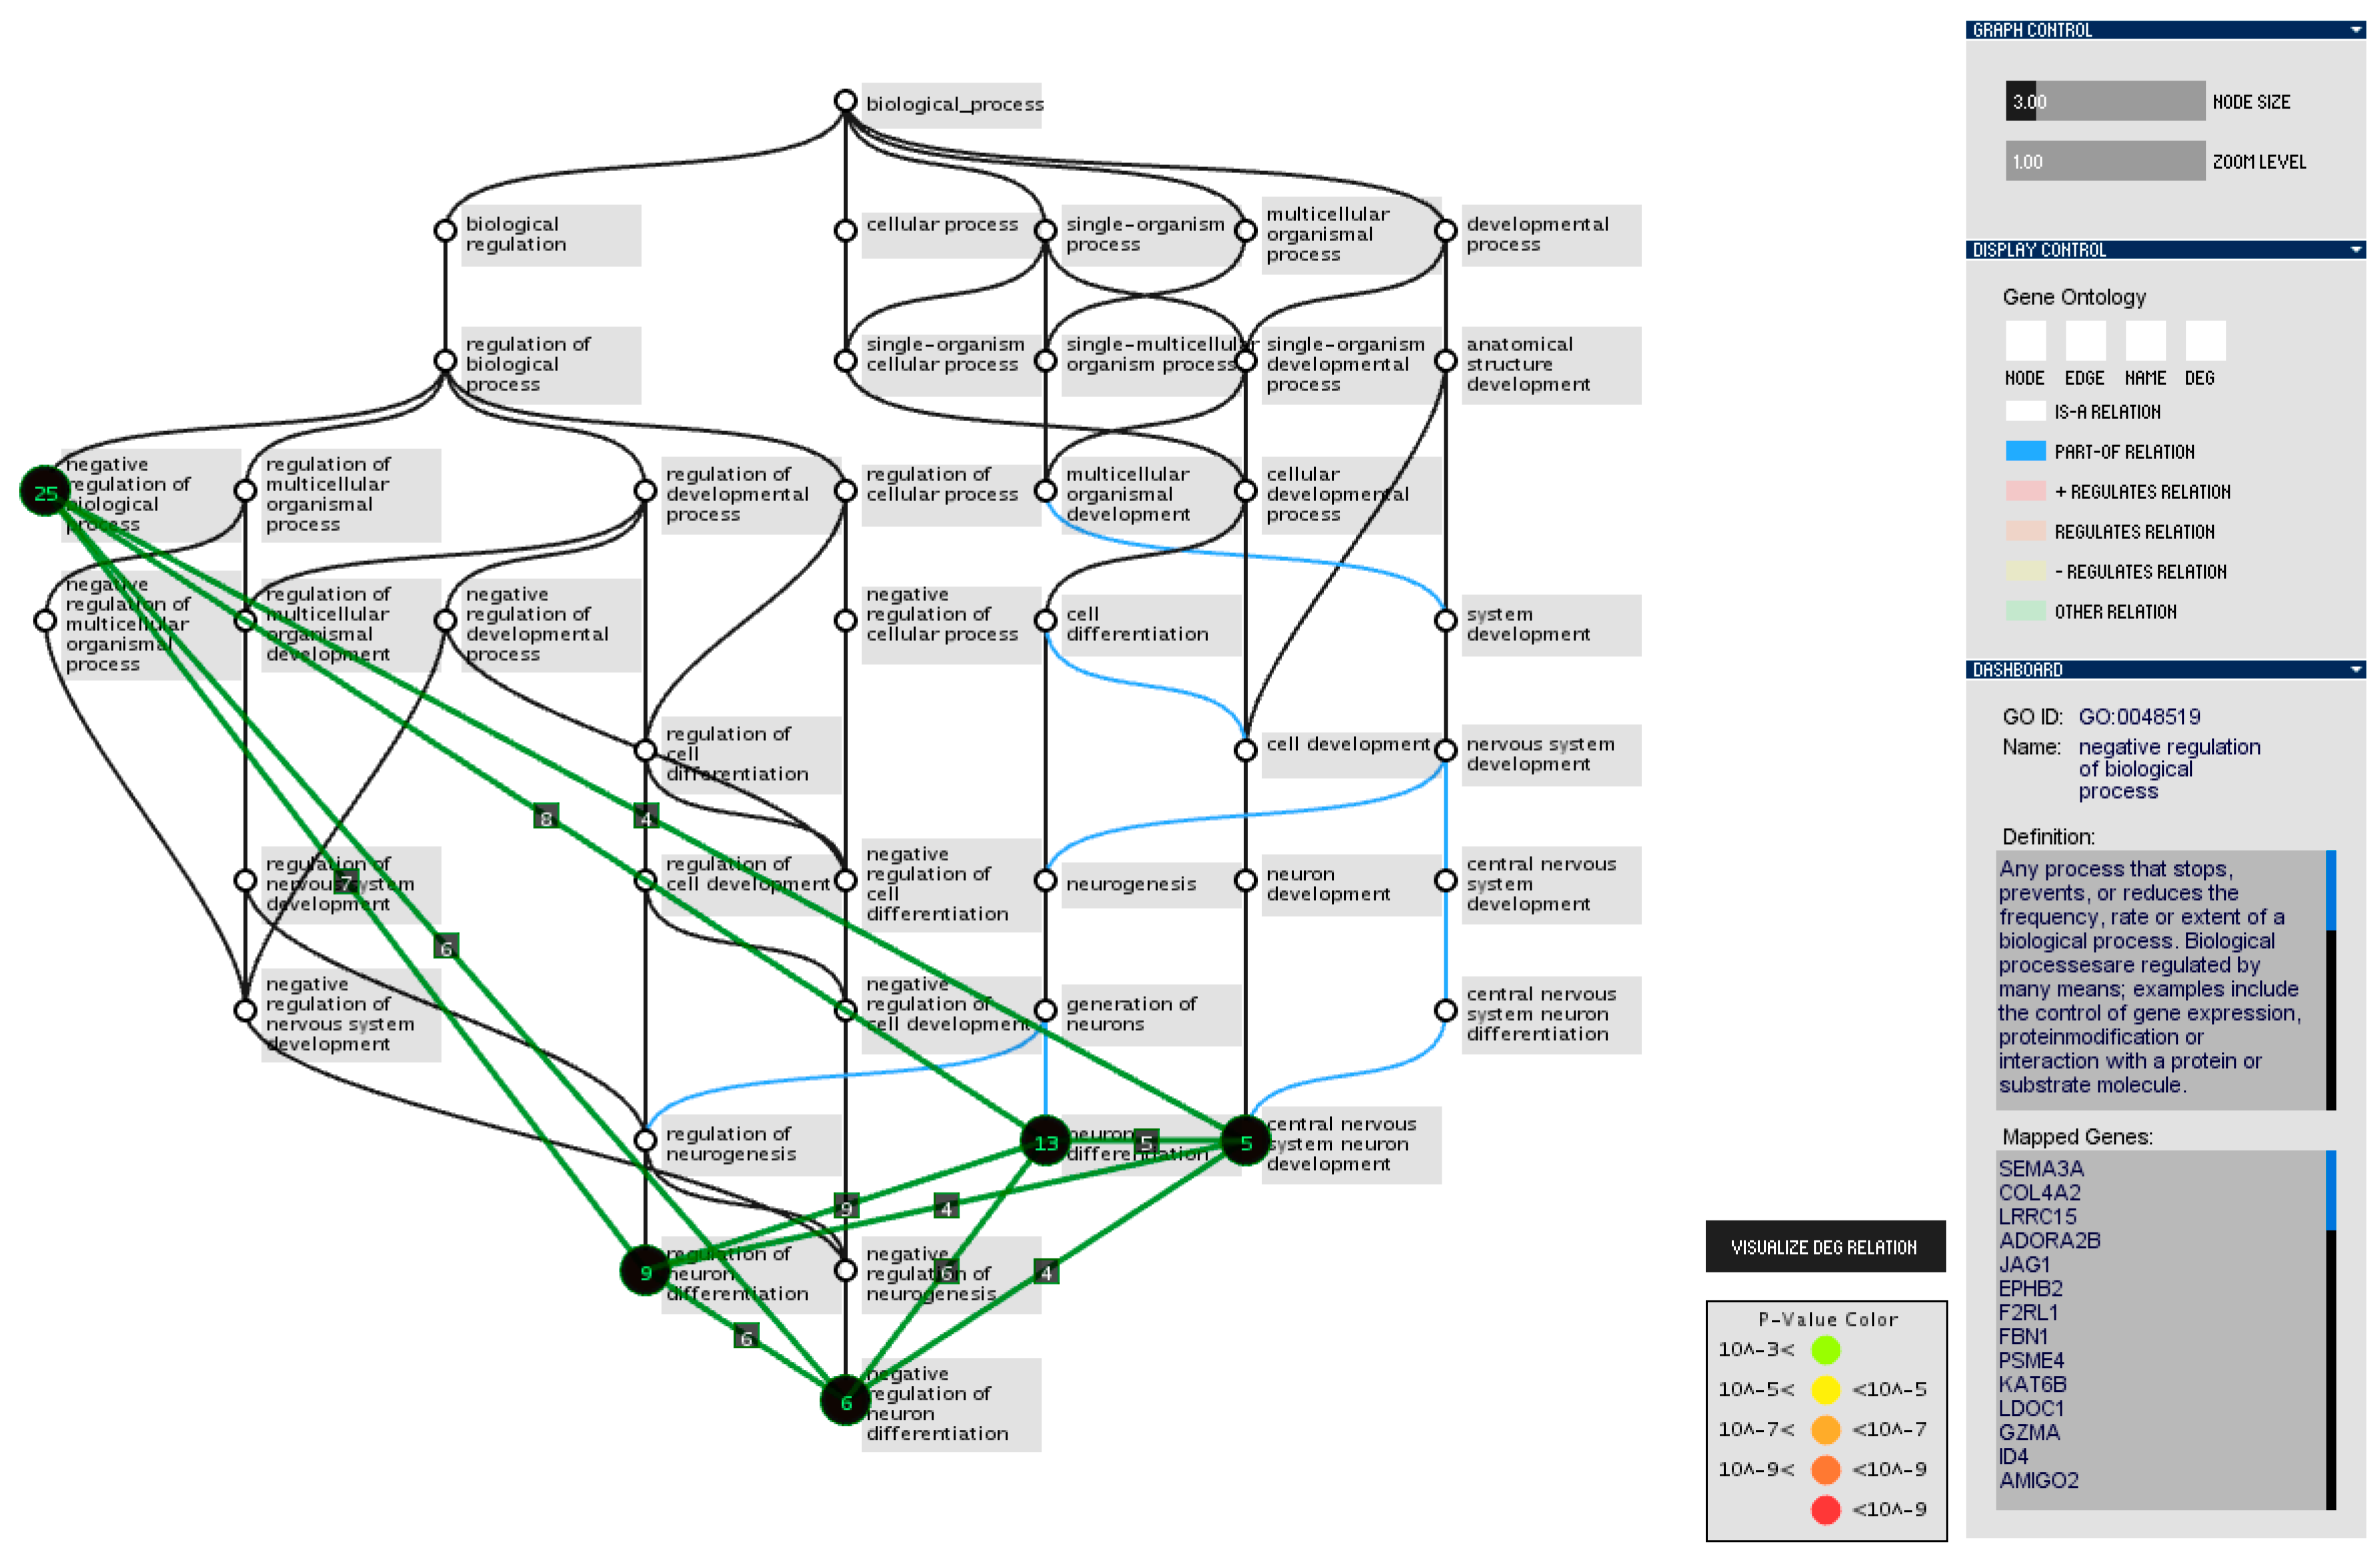
3.2. Gene Ontology Graph
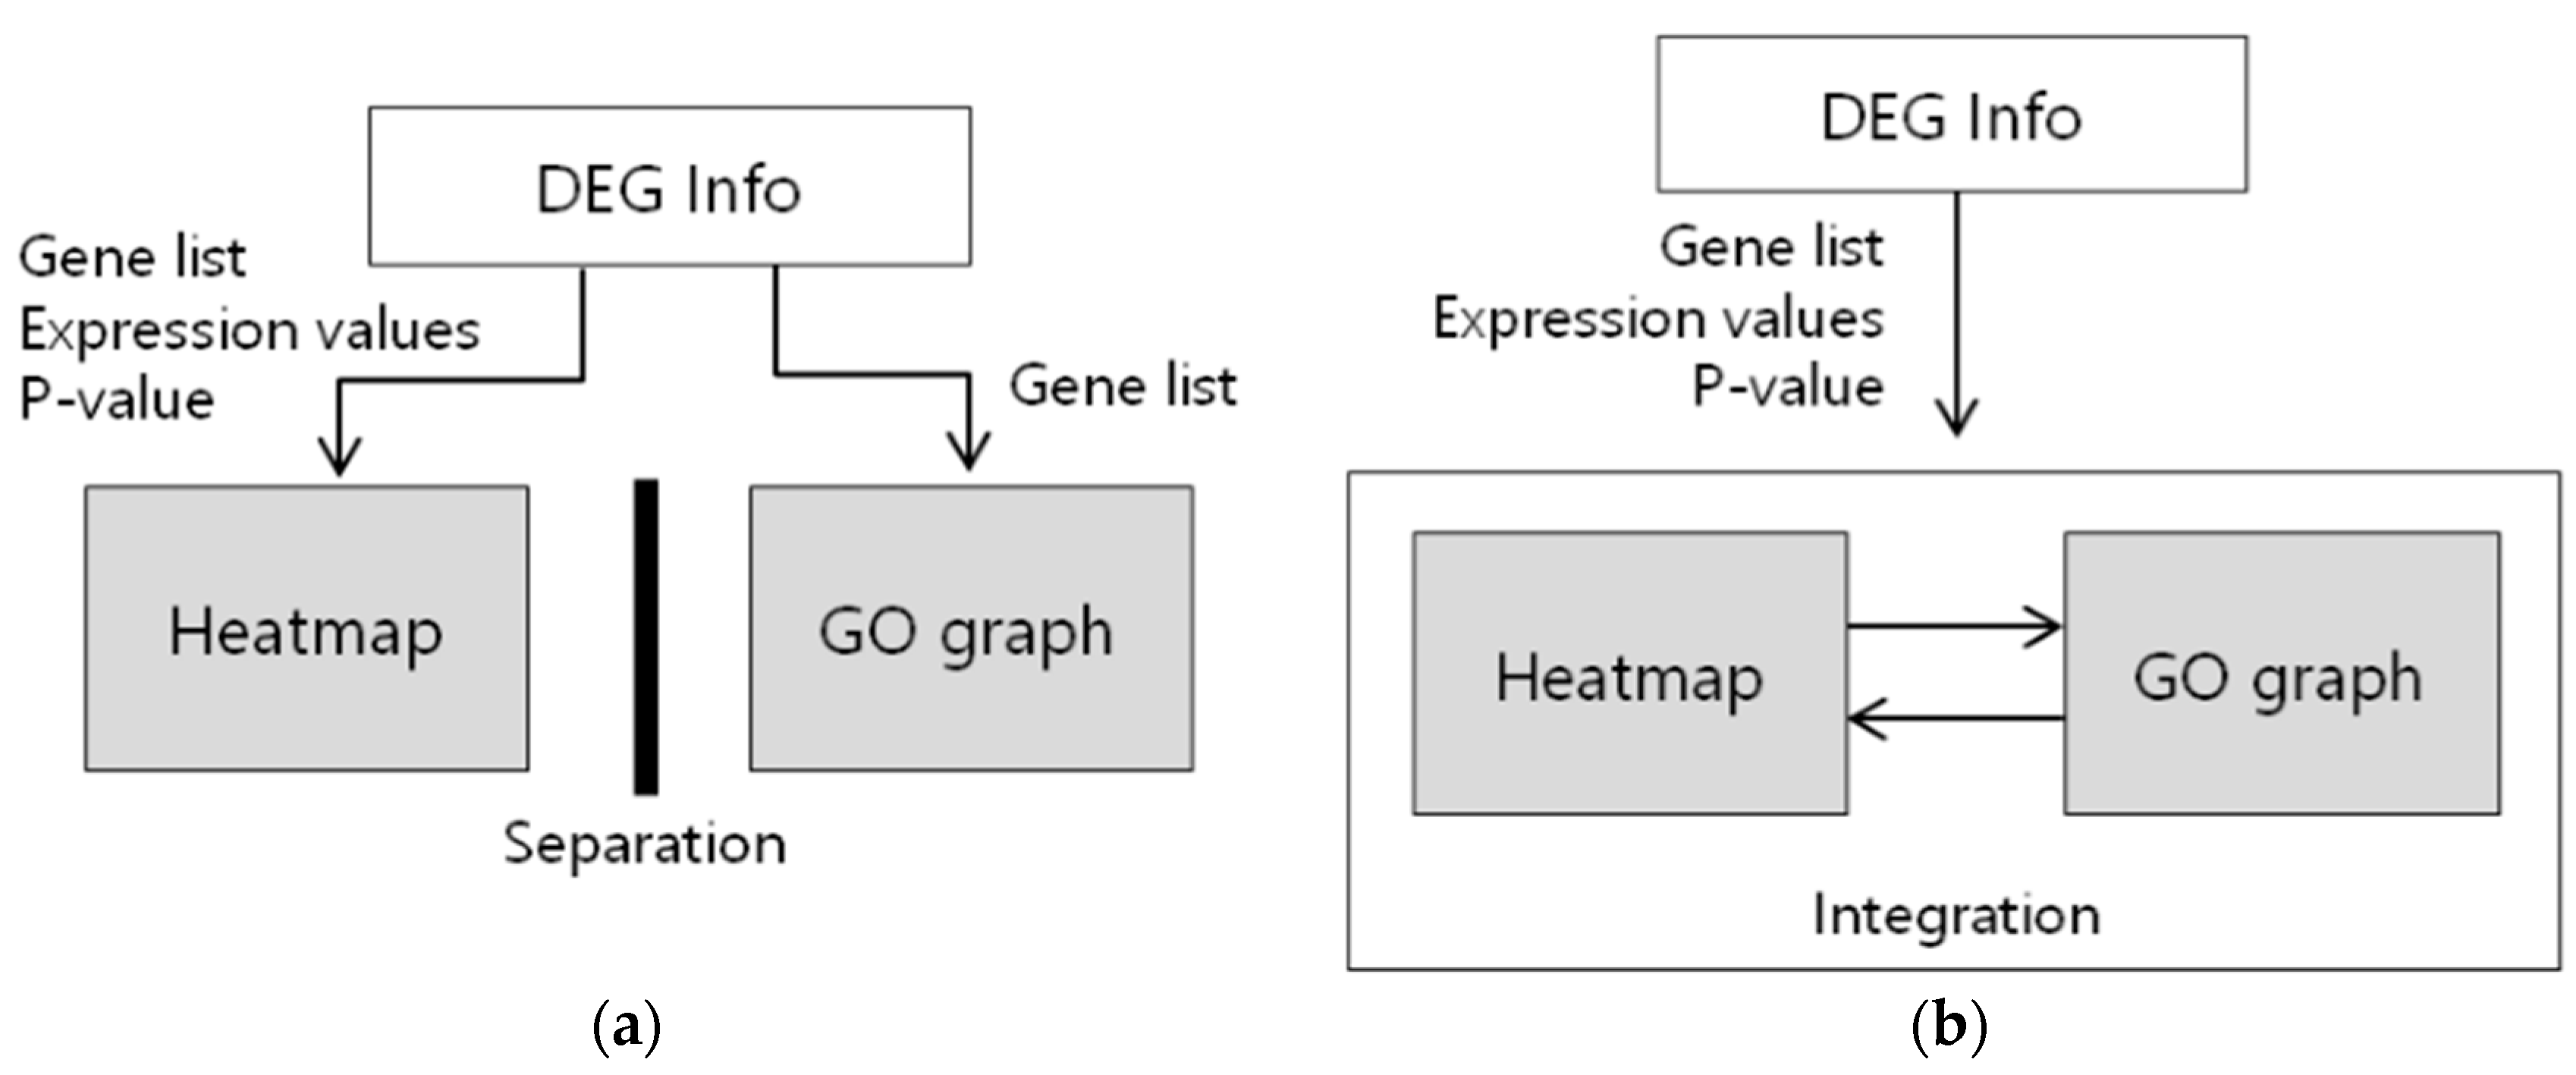
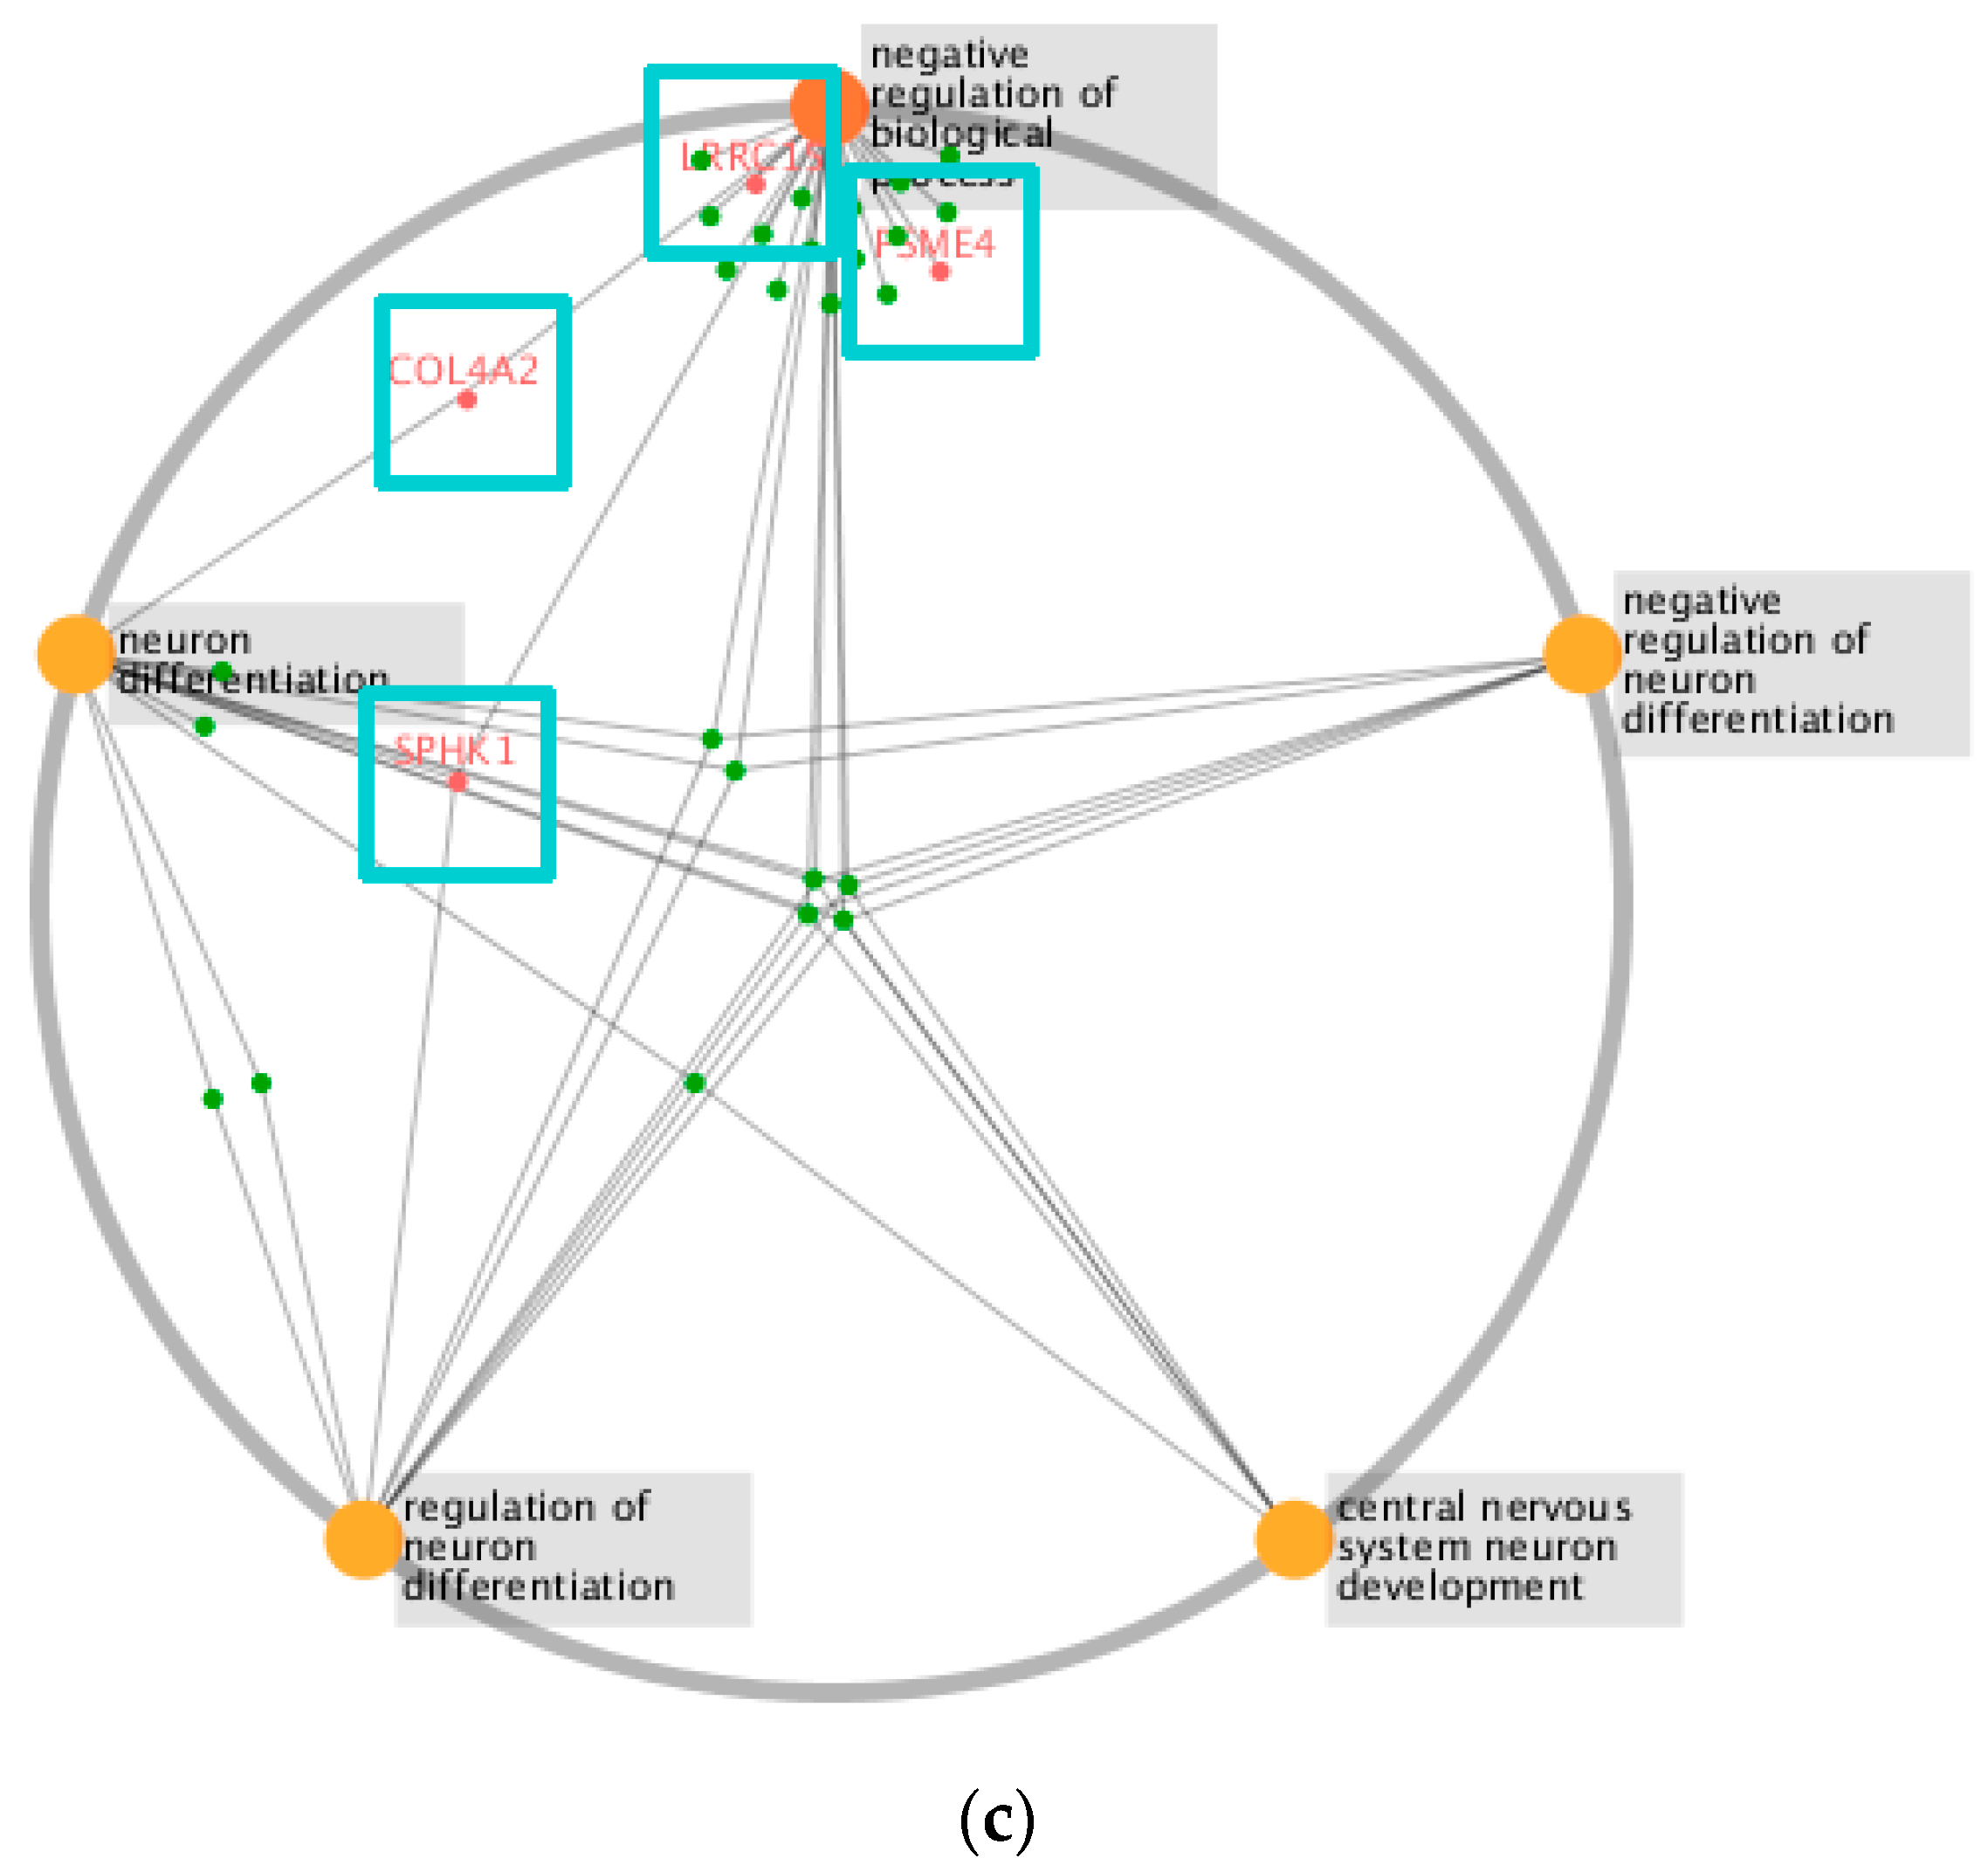
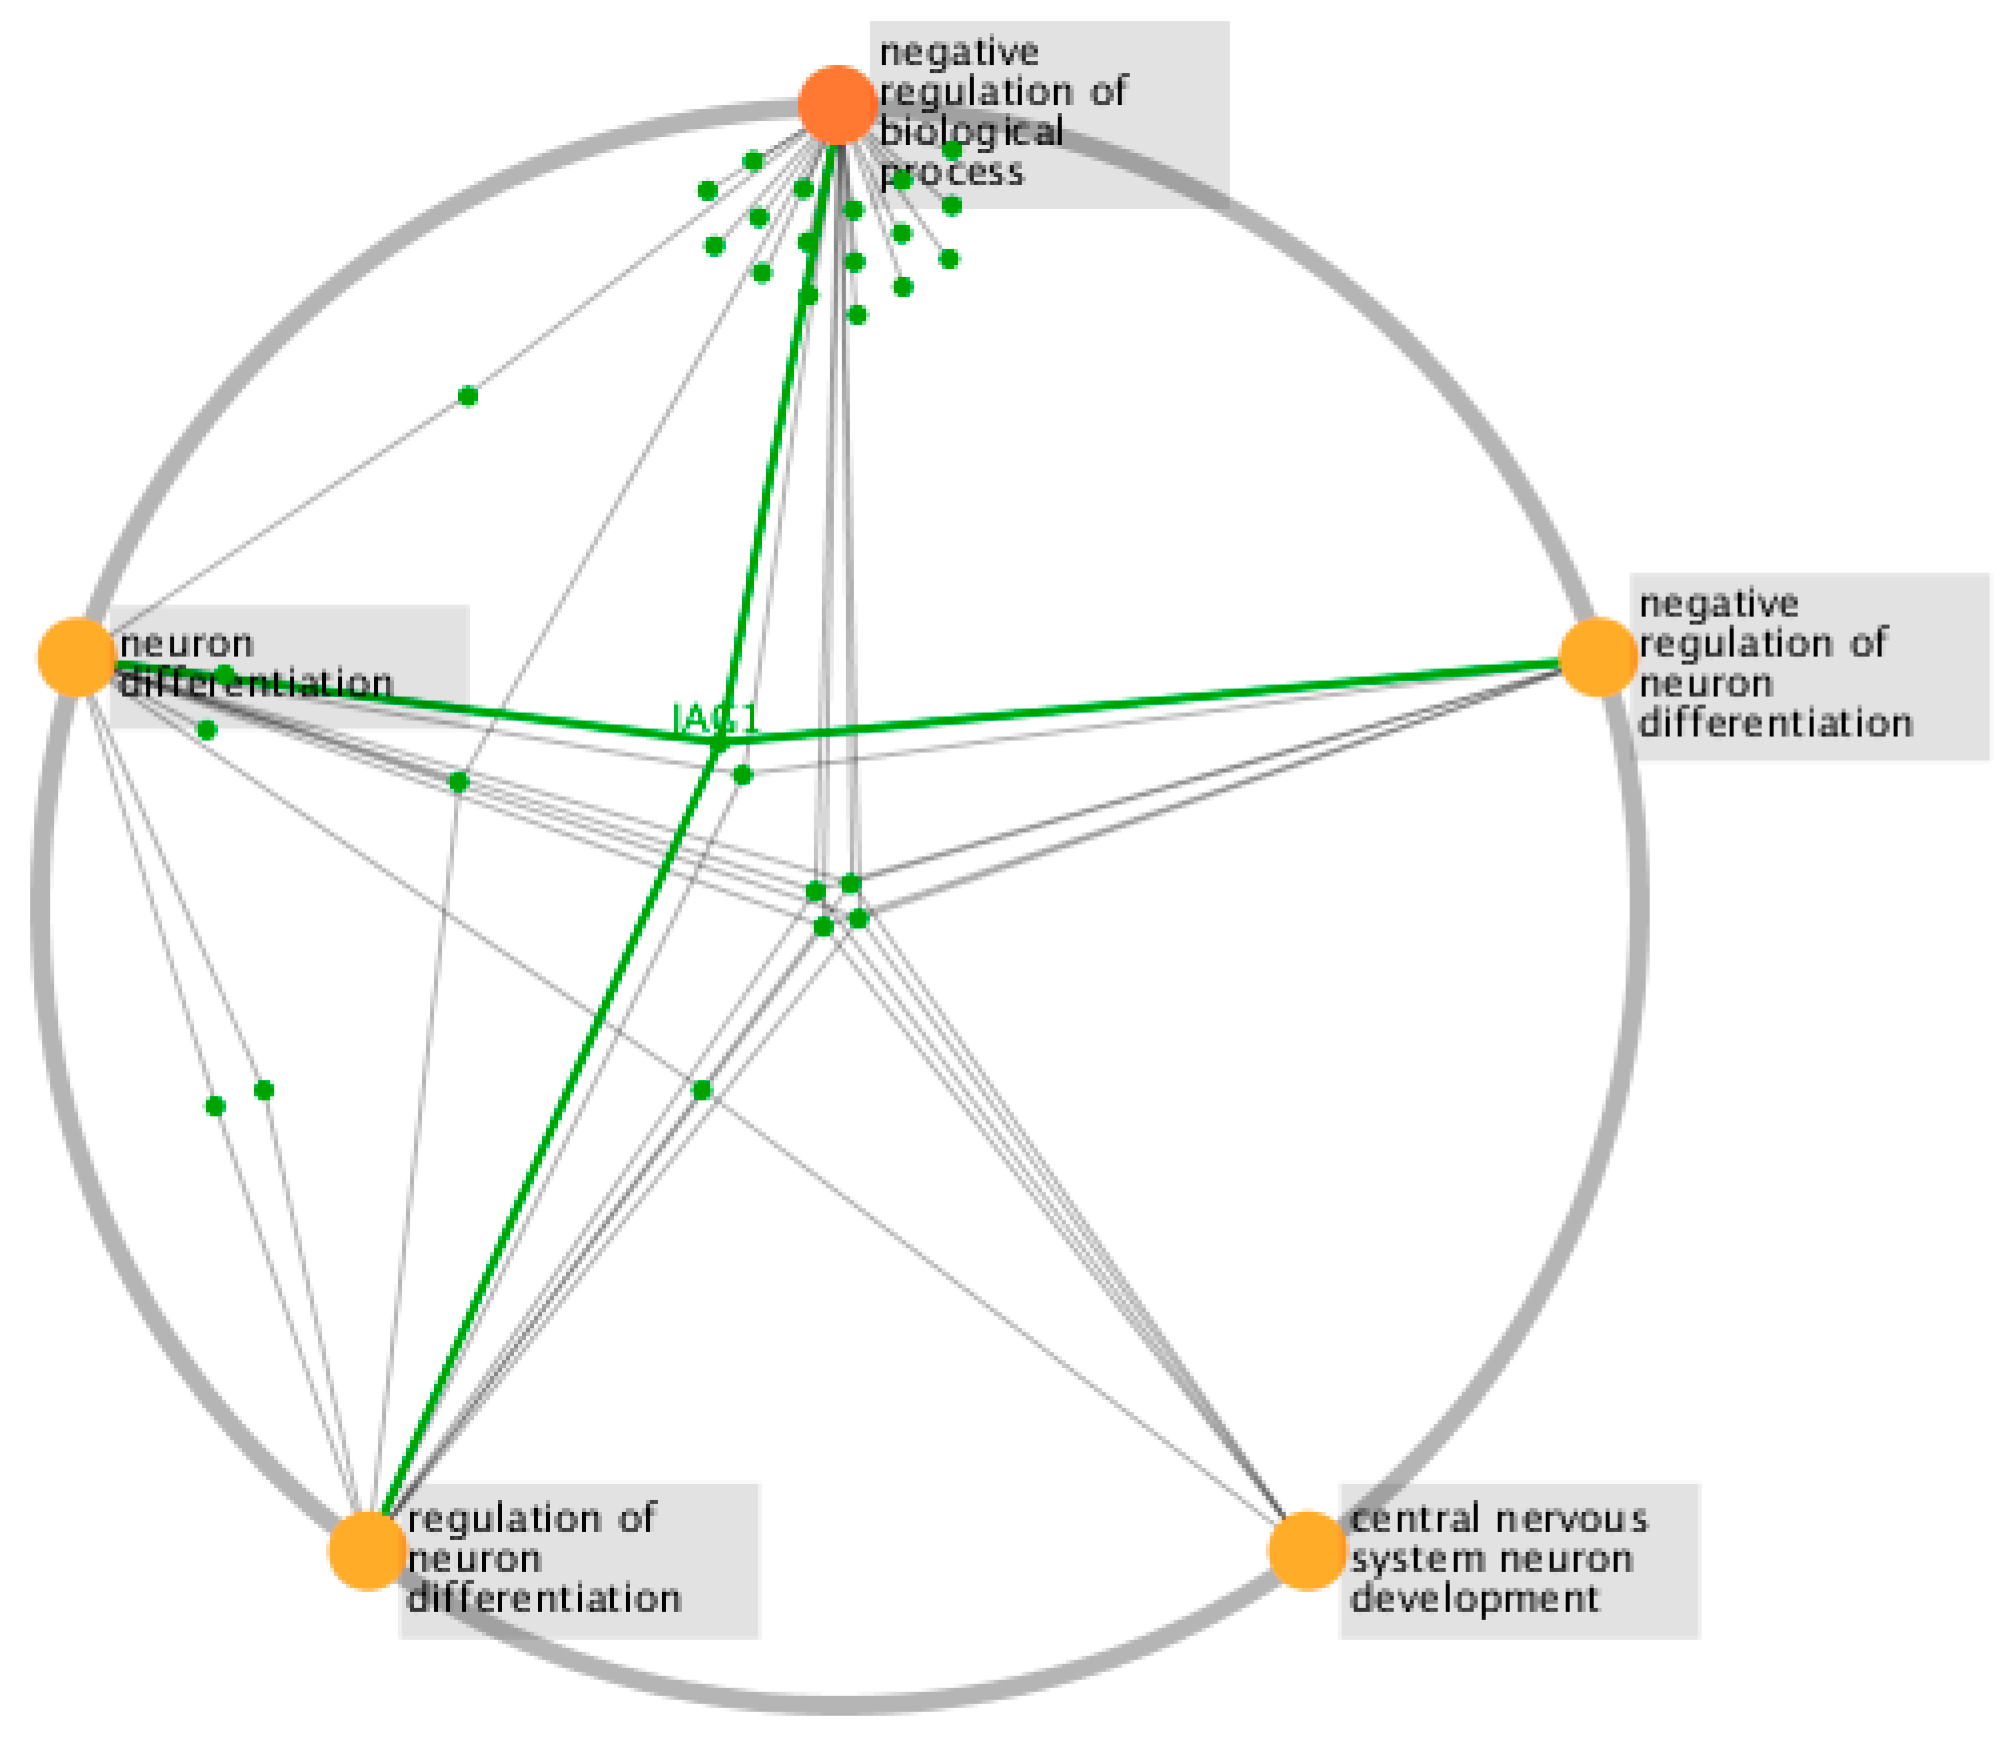
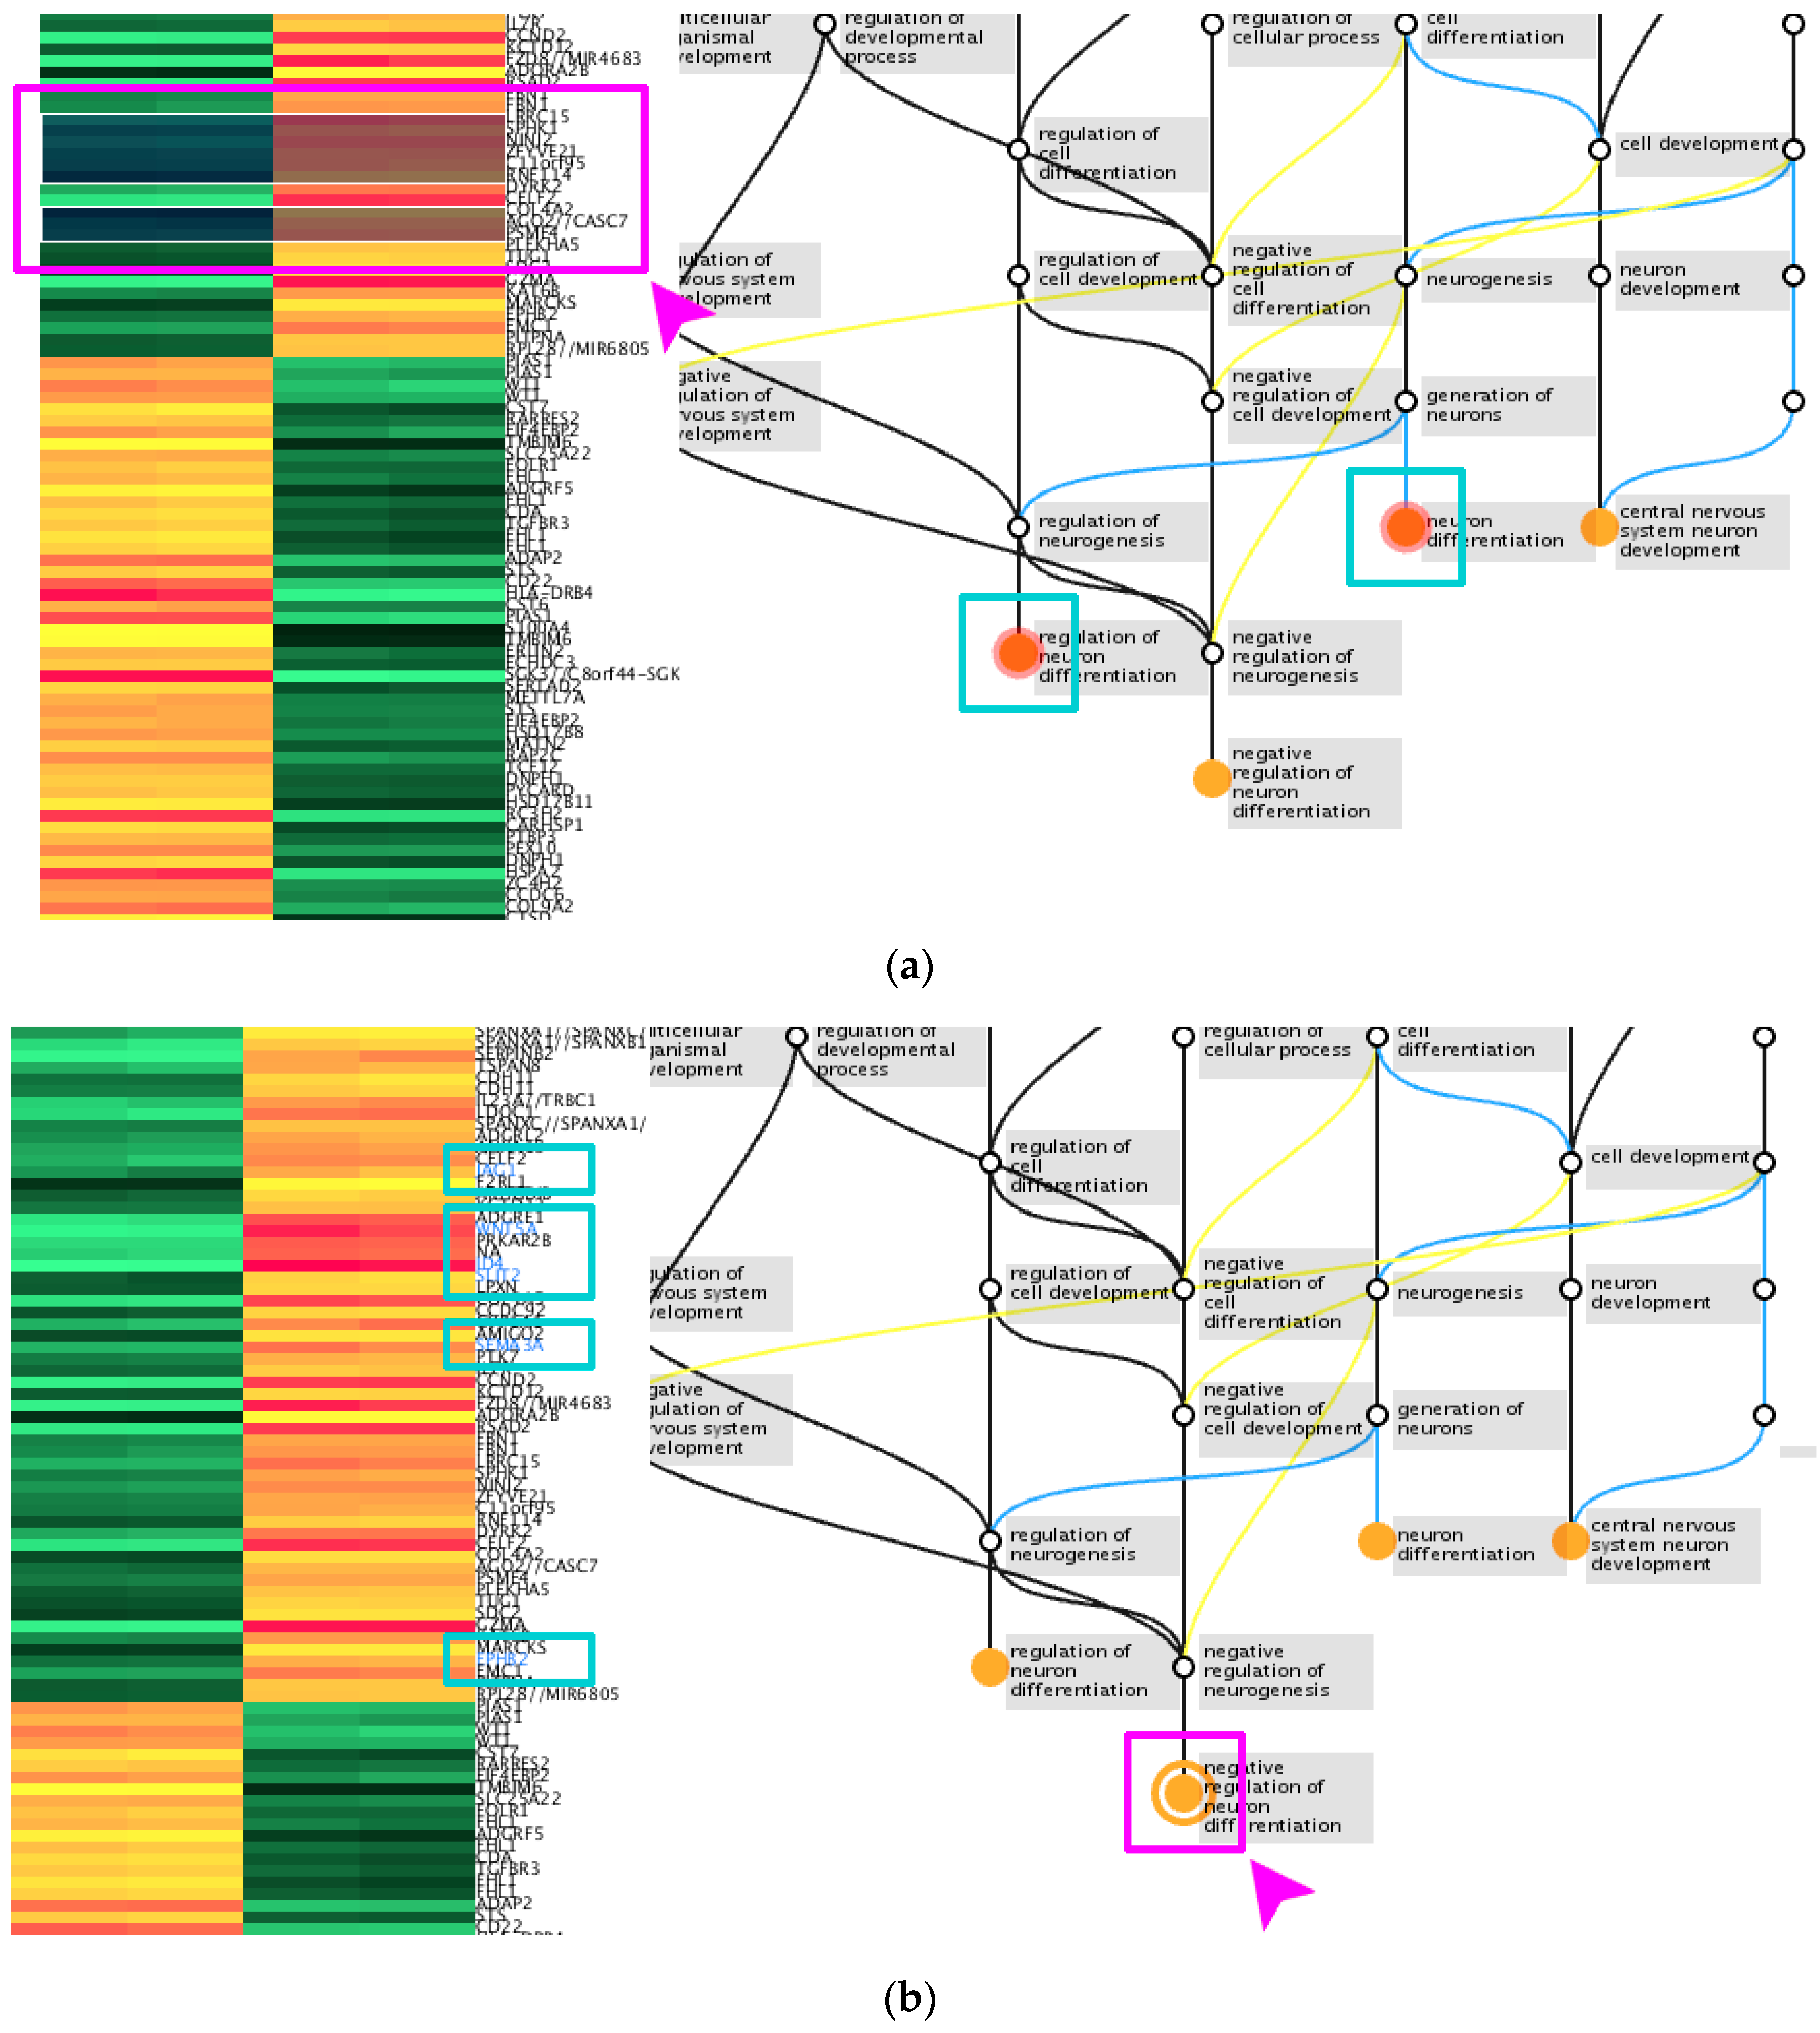
3.3. Interaction Design between Heatmap and Gene Ontology Graph
4. Discussion
Author Contributions
Conflicts of Interest
References
- Altman, N. Replication, variation and normalization in microarray experiments. Appl. Bioinform. 2005, 4, 33–44. [Google Scholar] [CrossRef]
- Wang, Z.; Gerstein, M.; Snyder, M. RNA-Seq: A revolutionary tool for transcriptomics. Nat. Rev. Genet. 2009, 10, 57–63. [Google Scholar] [CrossRef] [PubMed]
- Gene Ontology Consortium. The Gene Ontology (GO) database and informatics resource. Nucleic Acids Res. 2004, 32 (Suppl. 1), D258–D261. [Google Scholar]
- Cawthon, N.; Moere, A.V. The effect of aesthetic on the usability of data visualization. In Proceedings of the 11th International Conference on Information Visualization, IV’07, Zurich, Switzerland, 4–6 July 2007. [Google Scholar]
- Shannon, W.; Robert, C.; Jill, D. Analyzing microarray data using cluster analysis. Pharmacogenomics 2003, 4, 41–52. [Google Scholar] [CrossRef] [PubMed]
- Johnson, W.E.; Cheng, L.; Ariel, R. Adjusting batch effects in microarray expression data using empirical Bayes methods. Biostatistics 2007, 8, 118–127. [Google Scholar] [CrossRef] [PubMed]
- Xia, Q.; Cheng, D.; Duan, J.; Wang, G.; Cheng, T.; Zha, X.; Liu, C.; Zhao, P.; Dai, F.; Zhang, Z.; et al. Microarray-based gene expression profiles in multiple tissues of the domesticated silkworm, Bombyx mori. Genome Biol. 2007, 8, R162. [Google Scholar] [CrossRef] [PubMed]
- Al-Shahrour, F.; Ramón, D.; Joaquín, D. FatiGO: A web tool for finding significant associations of Gene Ontology terms with groups of genes. Bioinformatics 2004, 20, 578–580. [Google Scholar] [CrossRef] [PubMed]
- Doniger, S.W.; Salomonis, N.; Dahlquist, K.D.; Vranizan, K.; Lawlor, S.C.; Conklin, B.R. MAPPFinder: Using Gene Ontology and GenMAPP to create a global gene-expression profile from microarray data. Genome Biol. 2003, 4, R7. [Google Scholar] [CrossRef] [PubMed]
- Eden, E.; Navon, R.; Steinfeld, I.; Lipson, D.; Yakhini, Z. GOrilla: A tool for discovery and visualization of enriched GO terms in ranked gene lists. BMC Bioinform. 2009, 10, 48. [Google Scholar] [CrossRef] [PubMed]
- Ellson, J.; Gansner, E.; Koutsofios, L.; North, S.C.; Woodhull, G. Graphviz—Open source graph drawing tools. In Proceedings of the International Symposium on Graph Drawing, Vienna, Austria, 23–26 September 2001. [Google Scholar]
- Salazar-Henao, J.E.; Schmidt, W. An inventory of nutrient-responsive genes in arabidopsis root hairs. Front. Plant Sci. 2016, 7, 1–12. [Google Scholar] [CrossRef] [PubMed]
- Maere, S.; Heymans, K.; Kuiper, M. BiNGO: A Cytoscape plugin to assess overrepresentation of gene ontology categories in biological networks. Bioinformatics 2005, 21, 3448–3449. [Google Scholar] [CrossRef] [PubMed]
- Shannon, P.; Markiel, A.; Ozier, O.; Baliga, N.S.; Wang, J.T.; Ramage, D.; Amin, N.; Schwikowski, B.; Ideker, T. Cytoscape: A software environment for integrated models of biomolecular interaction networks. Genome Res. 2003, 13, 2498–2504. [Google Scholar] [CrossRef] [PubMed]
- Binns, D.; Dimmer, E.; Huntley, R.; Barrell, D.; O’donovan, C.; Apweiler, R. QuickGO: A web-based tool for Gene Ontology searching. Bioinformatics 2009, 25, 3045–3046. [Google Scholar] [CrossRef] [PubMed]
- Carbon, S.; Ireland, A.; Mungall, C.J.; Shu, S.; Marshall, B.; Lewis, S. Web Presence Working Group. AmiGO: Online access to ontology and annotation data. Bioinformatics 2009, 25, 288–289. [Google Scholar] [CrossRef] [PubMed]
- Oh, S.; Ha, J.; Lee, K.; Oh, S. Development of Integrated Visualization Tool for Differentially Expressed Genes and Gene Ontology Analysis. Int. J. Image Signal Syst. Eng. 2017, 1, 1–6. [Google Scholar] [CrossRef]
- Gautier, L.; Cope, L.; Bolstad, B.M.; Irizarry, R.A. Affy—Analysis of Affymetrix GeneChip data at the probe level. Bioinformatics 2004, 20, 307–315. [Google Scholar] [CrossRef] [PubMed]
- Ritchie, M.E.; Phipson, B.; Wu, D.; Hu, Y.; Law, C.W.; Shi, W.; Smyth, G.K. limma powers differential expression analyses for RNA-sequencing and microarray studies. Nucleic Acids Res. 2015, 43, e47. [Google Scholar] [CrossRef] [PubMed]
- Yu, G.; Wang, L.G.; Han, Y.; He, Q.Y. clusterProfiler: An R package for comparing biological themes among gene clusters. Omics 2012, 16, 284–287. [Google Scholar] [CrossRef] [PubMed]
- Carlson, M. A Set of Annotation Maps Describing the Entire Gene Ontology. Available online: https://bioconductor.org/packages/release/data/annotation/html/GO.db.html (accessed on 25 May 2017).
- Gentleman, R.C.; Carey, V.J.; Bates, D.M.; Bolstad, B.; Dettling, M.; Dudoit, S.; Ellis, B.; Gautier, L.; Ge, Y.; Gentry, J.; et al. Bioconductor: Open software development for computational biology and bioinformatics. Genome Biol. 2004, 5, R80. [Google Scholar] [CrossRef] [PubMed]
- Urbanek, S. Rserve—A Fast Way to Provide R Functionality to Applications. In Proceedings of the 3rd International Workshop on Distributed Statistical Computing, Vienna, Austria, 20–22 March 2003. [Google Scholar]
- Naveh, B.; Sichi, J.V. JGraphT a Free Java Graph Library. Available online: http://jgrapht.org/ (accessed on 11 December 2016).
- Reas, C.; Fry, B. Processing: Programming for the media arts. AI SOCIETY 2006, 20, 526–538. [Google Scholar] [CrossRef]
- Garland, K. Mr Beck’s Underground Map; Capital Transport Publishing: London, UK, 1994. [Google Scholar]
- Kieffer, S.; Dwyer, T.; Marriott, K.; Wybrow, M. Hola: Human-like orthogonal network layout. IEEE Trans. Vis. Comput. Gr. 2016, 22, 349–358. [Google Scholar] [CrossRef] [PubMed]
- Dessimoz, C.; Škunca, N. The Gene Ontology Handbook; Humana Press: New York, NY, USA, 2016. [Google Scholar]
- Gansner, E.R.; Koutsofios, E.; North, S.C.; Vo, K.P. A technique for drawing directed graphs. IEEE Trans. Softw. Eng. 1993, 19, 214–230. [Google Scholar] [CrossRef]
- Kruskal, J.B. Multidimensional scaling by optimizing goodness of fit to a nonmetric hypothesis. Psychometrika 1964, 29, 1–27. [Google Scholar] [CrossRef]
- Kruskal, J.B.; Wish, M. Multidimensional Scaling. In Sage University Paper Series on Quantitative Applications in the Social Sciences; Sage Publications: Beverly Hills, CA, USA, 1978. [Google Scholar]


| Module | Functions |
|---|---|
| Session management | Manage target microarray files |
| Store group information of microarray files | |
| Store species information | |
| Store results of data processing results | |
| Manage threshold values for determining DEGs | |
| Data processing | Determine DEG list according to threshold values |
| Identify GO terms related to DEGs | |
| Manage GO information including GO hierarchy structure | |
| Visualization | Draw and manipulate heatmap |
| Draw and manipulate GO graph | |
| Manage connection between heatmap and GO graph |
© 2017 by the authors. Licensee MDPI, Basel, Switzerland. This article is an open access article distributed under the terms and conditions of the Creative Commons Attribution (CC BY) license (http://creativecommons.org/licenses/by/4.0/).
Share and Cite
Oh, S.; Ha, J.; Lee, K.; Oh, S. DegoViz: An Interactive Visualization Tool for a Differentially Expressed Genes Heatmap and Gene Ontology Graph. Appl. Sci. 2017, 7, 543. https://doi.org/10.3390/app7060543
Oh S, Ha J, Lee K, Oh S. DegoViz: An Interactive Visualization Tool for a Differentially Expressed Genes Heatmap and Gene Ontology Graph. Applied Sciences. 2017; 7(6):543. https://doi.org/10.3390/app7060543
Chicago/Turabian StyleOh, Somyung, Junghyeon Ha, Kyungwon Lee, and Sejong Oh. 2017. "DegoViz: An Interactive Visualization Tool for a Differentially Expressed Genes Heatmap and Gene Ontology Graph" Applied Sciences 7, no. 6: 543. https://doi.org/10.3390/app7060543
APA StyleOh, S., Ha, J., Lee, K., & Oh, S. (2017). DegoViz: An Interactive Visualization Tool for a Differentially Expressed Genes Heatmap and Gene Ontology Graph. Applied Sciences, 7(6), 543. https://doi.org/10.3390/app7060543