Article

Optimization of Subcritical Water Extraction of Resveratrol from Grape Seeds by Response Surface Methodology

Beijing Key Laboratory of Lignocellulosic Chemistry, Beijing Forestry University, Beijing 100083, China
*
Authors to whom correspondence should be addressed.
Appl. Sci. 2017, 7(4), 321; https://doi.org/10.3390/app7040321
Submission received: 15 January 2017 / Revised: 16 March 2017 / Accepted: 21 March 2017 / Published: 24 March 2017
(This article belongs to the Section Chemical and Molecular Sciences)

Abstract

:
The subcritical water extraction (SWE) is a high-efficiency and environment-friendly extraction method. The extraction of resveratrol (RES) of grape seeds obtained from the wine production process was proposed using subcritical water extraction (SWE). The effects of different extraction process parameters on RES yield were investigated by single factors. Extraction optimization was conducted using response surface methodology (RSM). Extraction temperature was proven to be the most significant factor influencing RES yield. The optimal conditions was as follows: extraction pressure of 1.02 MPa, temperature of 152.32 °C, time of 24.89 min, and a solid/solvent ratio of 1:15 g/mL. Under these optimal conditions, the predicted extraction RES yield was 6.90 μg/g and the recoveries was up to 91.98%. Compared to other previous studies, this method required less pollution and less treatment time to extract RES from grape seeds. From these results, added economic value to this agroindustrial residue is proposed using environmentally friendly extraction techniques.

1. Introduction

Wine industry produces large amounts per year of residues and by-products in form of skins and seeds that are generally untapped. Indeed, around 1.4 kg of grapes are needed to obtain 1 L of wine, 0.042 kg of seeds are obtained from 1.4 kg of grapes [1]. According to the British Broadcasting Corporation reported on 21 October 2016, the world wine production has reached 25,950 million hectoliter [2]. This means that 1,089,900 ton of seeds are produced annually. So it is easy to conclude that grape seeds residues could represent an opportunity for green chemistry and associated technologies. Traditionally, these seeds are used to feed animals [3] or sold to the oil industry [4]. As a result of this treatment, the residual value of the seeds are not fully exploited. Grape seeds contain a large percentage of grape seeds oils but also phenolic compounds [5]. The antioxidant phenolic compounds present in the seeds account for 60%–70% of the total phenolic in the grape [6]. Therefore, their recovery should be more than interesting, taking into account that during vinification only a portion of those compounds is extracted. These functional phenolic compounds that are not completely extracted include procyanidins and resveratrol [7]. Procyanidins has a highly hydroxyl structure. It can act as an antioxidant and removes free radicals [8]. Resveratrol (3,5,4′-trihydroxystilbene, Figure 1a) is a polyphenolic compound with multiple therapeutic effects and pharmacological activities [9]. It has gained significant worldwide attention due to its ability to inhibit or retard a wide variety of diseases in animals [10], including cardiovascular disease and cancer [11], and can increase stress resistance and lifespan. Thus, the extraction of resveratrol from grape seeds is meaningful work.
Traditionally, resveratrol is extracted from natural products using organic solvents [12]. However, these techniques require long extraction times and result in low yields of extract. In recent years, some new techniques, such as extraction by supercritical fluids, extraction by pressurized liquids, and extraction assisted by microwave irradiation, have replaced conventional techniques like Soxhlet extraction for solid samples [13]. These alternative techniques simplify the process, considerably reduce the consumption of solvents, and also increase the rate of the extraction process [14]. For example, L. Casas gained resveratrol from the grape seeds, stems, skin, and pomace of the Palomino fino grape variety by supercritical carbon dioxide extraction. The best results were obtained by working at high pressure and low temperature using 5% v/v ethanol as a co-solvent [15]. Erkan Karacabey extraction of trans-resveratrol from milled grape canes using a pressurized low-polarity water extractor. Increasing ethanol concentration from 0% to 25% increased the extraction of total phenolics by 44% [16]. Even though these techniques improve the extraction yield and reduce the extraction time, they still use conventional solvents (ethanol, methanol, etc.). These organic solvents are problematic in the extraction/separation of resveratrol from the herb because of their toxicity, volatility, and inflammability. Therefore, green technologies are needed. In addition, the effects of the various parameters on the extraction yield in the extraction process need to be further explored.
The subcritical water, which is also called pressurized hot water or superheated water, is hot water that maintains in liquid state at temperatures between 100 and 374 °C under pressurized conditions. As a result of the breakdown of intermolecular hydrogen bonds, the dielectric constant of water decreases under subcritical conditions [17]. Modification of process parameters, such as temperature, affects the dielectric constant values and polarity. Water at room temperature has a high polarity and dielectric constant close to 80. The application of suitable pressure in order to keep water in liquid form at 250 °C leads to a decrease of the dielectric constant to 27, which is similar to that of ethanol [18]. The subcritical water extraction has shown its capability to selectively extract various groups of compounds by adjusting temperatures. At lower temperatures, more polar compounds are extracted, while higher temperatures are used for extraction of less polar compounds [19]. So far, subcritical water extraction has been shown to be a promising alternative for the conventional method for the extraction of polar and slightly non-polar compounds [20].
In this work, we reported the extraction of resveratrol from grape seeds by subcritical water extraction technique. This method can effectively extract the resveratrol from grape seeds without any organic solvent. In addition, the other main objective of this work was to investigate the influence of process parameters (pressure, temperature, time, and solid/solvent ratio) on resveratrol extraction yield from grape seeds. Applying a response surface methodology approach, optimal process conditions for preparation of extracts with the desired observed responses were established. It provided a reference of environmentally and human-friendly technologies for the industrial production of resveratrol.

2. Materials and Methods

2.1. Materials and Reagents

Grape seeds were purchased from an herbal supplier (Chun Yuantang Economic and Trade Co., Ltd., Hefei, China). The air-dried seeds were pulverized by a knife mill (BLF-YB1000, Blifu Co., Ltd., Shangyu, China), and were sieved to sizes of 60 mesh by mesh screen (φ 200 × 50, Xiaojin Co., Ltd., Shenzhen, China). All powder samples were subsequently packed into plastic bags and stored in desiccators at room temperature for latter extraction. Reference standard of RES (purity of solvents for HPLC analysis >97%) was purchased from Preferred Biological Technology Co., Ltd., Chengdu, China. HPLC-grade solvents for HPLC analysis, such as acetonitrile, were obtained from J&K Chemical Co., Ltd. (Beijing, China). Ethanol and all other chemicals were of analytical reagent grade.

2.2. Subcritical Water Extraction Procedure
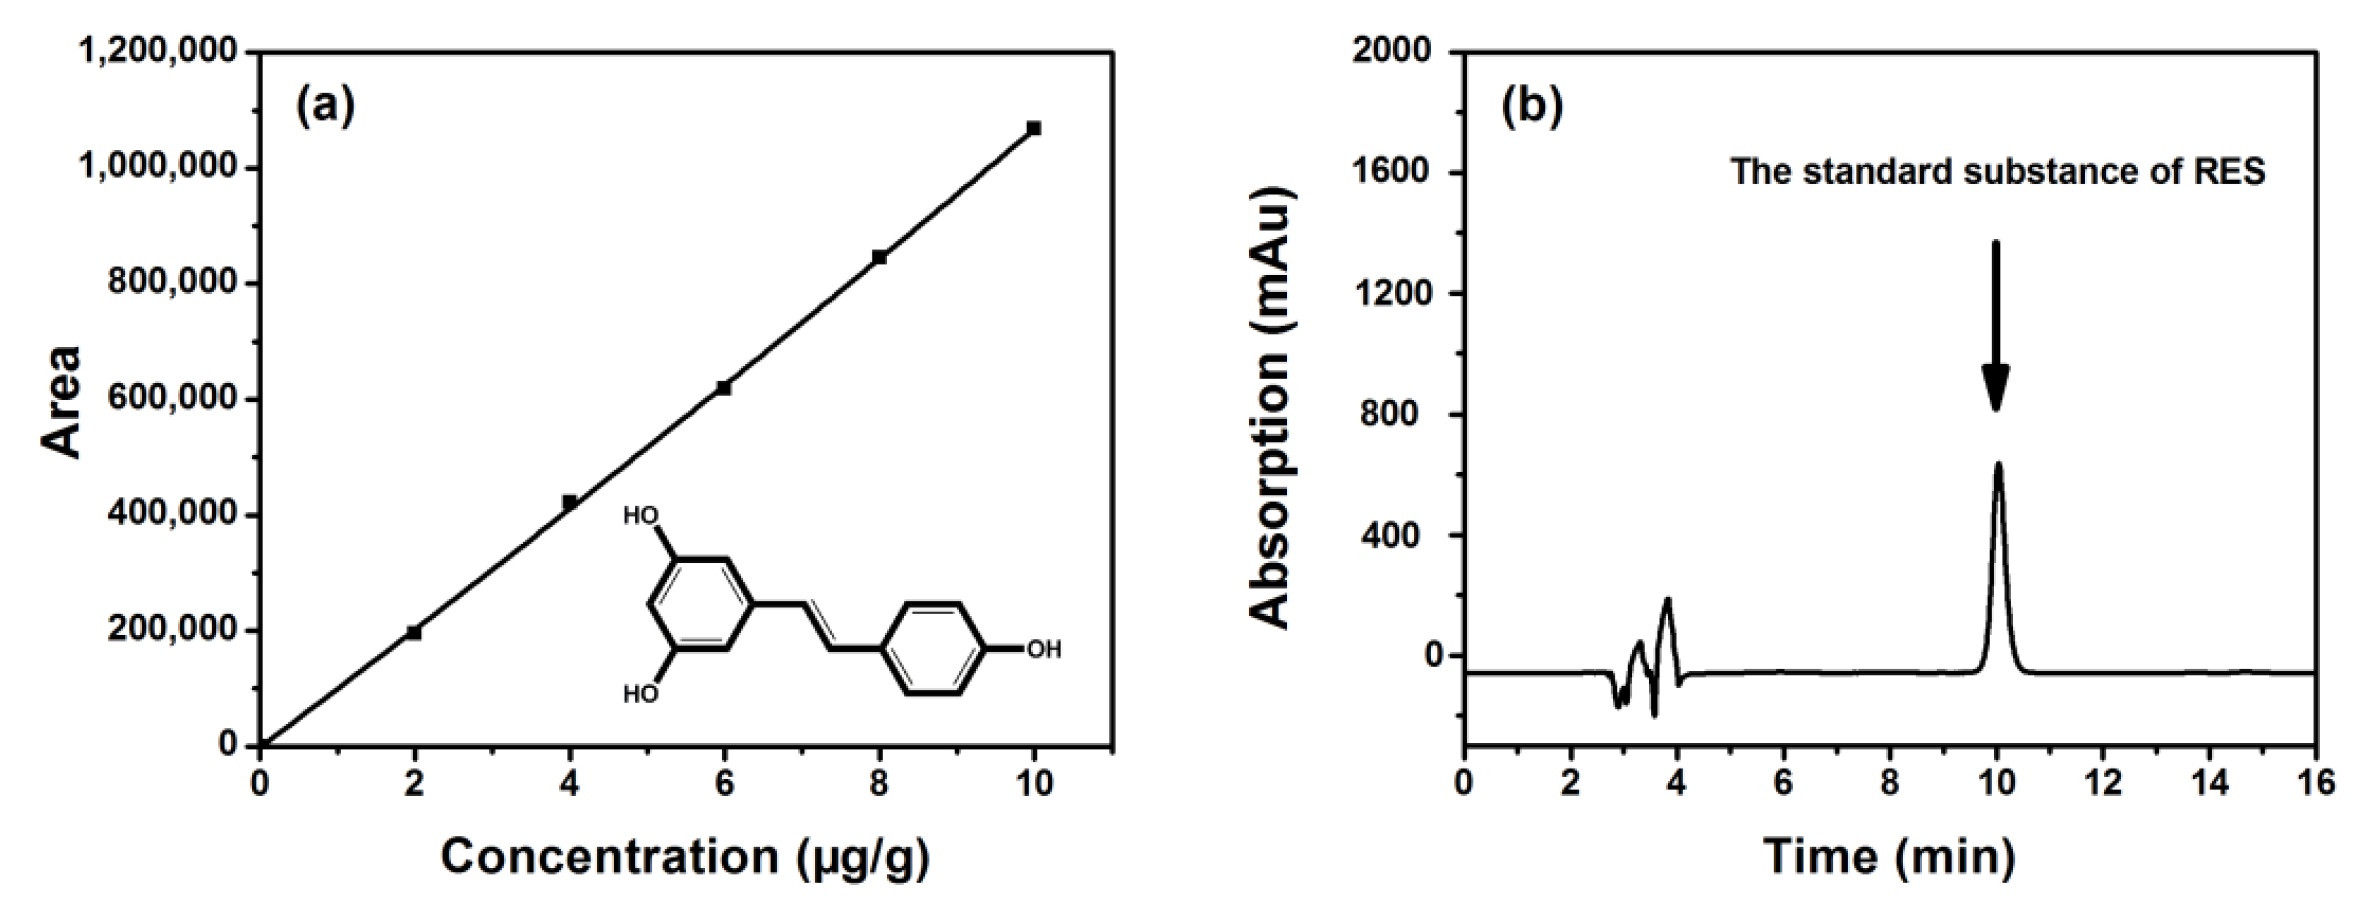
SWE was carried out using a batch reactor constructed by Beijing STWY Equipment Co., Ltd. (Model TGYF-A, Beijing, China). The reactor was made of stainless steel, with a volume of 100 mL. A sample of 2.00 g powder and 30 mL ultrapure water were added into the reactor, which was then closed tightly and purged with inert N2. The extractor pressure was controlled at a pre-set value. A thermocouple inserted into a tube and installed at the middle of the reactor was used to measure reaction temperature. Once the interior temperature of the reactor reached target level, extraction time was tracked. After the predetermined treatment time, the reactor was immersed rapidly in an ice bath to stop the extraction. Then, the mixture in the reactor was paper-filtered and stored for analysis.

2.3. HPLC Analyses

After subcritical water extraction, the mixtures were centrifuged at 4000 rpm for 10 min to remove the insoluble materials. Then the solution was passed through a 0.22 μm membrane filter (Jinteng Experimental Equipment Inc., Tianjin, China) prior to HPLC analysis. HPLC was performed using a Surwit system (LC3000 series, Surwit Technology Inc., Hangzhou, China) with a Agilent HC-C18 column (4.6 × 250 mm, 5 μm; Agilent Technologies, Santa Clara, CA, USA) and a UV detector (Variable Wavelength Detector, Agilent Technologies, Santa Clara, CA, USA). An aliquot (20 μL) of each extract was injected into the HPLC column and elution was carried out while acetonitrile:water (with 0.2% phosphoric acid) = 30:70, at a flow-rate of 1.0 mL/min. The mobile phase was pumped at room temperature and the UV spectrum was recorded at 303 nm. RES was identified by comparing its retention time with corresponding peak in the standard compound and its UV spectrum. The concentrations of RES identified were measured using the external standard method by calibration curves obtained for this compound over the range of concentrations observed. Calibration curves for standard RES were used to calculate the extraction yield (expressed in units of μg/g dried sample).

2.4. The Calculation of Yield of RES

The weight of the substance of RES, diluted with acetonitrile, was accurately gauged. Standard solutions with the concentration of 2.00 mg/L, 4.00 mg/L, 6.00 mg/L, 8.00 mg/L, 10.00 mg/L were prepared and the peak areas of those solutions were acquired by HPLC. Taking the concentration of solution as the abscissa and peak area as the ordinate, an RES standard curve was drawn. The standard curve of RES is shown in Figure 1. The calibration curve was liner in the range of 2.00–10.00 mg/L of RES with correlation coefficient Y being 0.9994 and the regression equation being Y = 106,947X − 10,053. The extraction yield of RES can be calculated using Equation (1).
Extraction   yield   of   RES   ( μ g / g )   =   concentration   of   RES   ( μ g / mL )   ×   volume   of   RES   ( mL ) weight   of   sample   powder   ( g )

2.5. Single Factor Experimental Design

Single-factor experiments were carried out to determine the more significant extraction variables and their preliminary ranges in RES extraction. Factors studied that control yield include extraction time (min), extraction temperature (°C), extraction pressure (MPa), and solid/solvent ratio (g/mL). During the optimization of experimental factors, only one factor was changed at same time, while other factors remained constant in each experiment.

2.6. Experimental Design of RSM

Based on the results of single-factor experiments, the Box-Behnken Design (BBK) for Response Surface Methodology (RSM) was used to optimize and analyze the selected factors. The advantage of BBK over other three-level factorial designs, such as central composite face-centered (CCF) design, was that BBK required fewer experiments to elucidate the three factors [21]. Experiments were established, based on BBK, with three factors at three levels, while each independent variable was coded at three levels: −1, 0, and +1. Solid/solvent ratio on the extraction rate was very small, so based on these preliminary experimental results, the three parameters chosen as key variables were extraction pressure (MPa), extraction time (min), and extraction temperature (°C), designated as X1, X2, and X3, respectively. RES yield (Y) was taken as the response of the designed experiments. The experimental design consisted of 17 trials including five replicates of the center point. Independent variables studied at three different levels were presented in Table 1. A second-order polynomial function was fitted to results in order to correlate the relationship of each factor to the response. For the three factors concerned, this equation was
Y   =   β 0 + i = 1 3 β i X i + i = 1 3 β ii X i 2 + i = 1 2   j = i + 1 3 β ij X i X j
Y was the predicted response, β0, βi , βii and βij were, respectively, the regressio co-efficients for intercept, linearity, square, and interaction, while Xi and Xj were the different independent variables (i ≠ j). Using a response surface analysis procedure (Design-Expert 7.1.6 Trial, State-Ease, Inc., Minneapolis, MN, USA). The experimental data collected from BBK testing was analyzed. Analysis of variance (ANOVA) was carried out to identify the adequacy of the developed model and the statistical significance of regression coefficients [22].

2.7. Spike Recovery Experiment

The content of resveratrol is related to many factors. The grape variety and the maceration time in the vinification process both affect the resveratrol content [23]. Therefore, on the extraction rate, we had to do a spike recovery experiment. The spiking recovery procedure was as follows: 2.00 g grape seeds samples were put into subcritical water extraction device. Then, three groups of RES standards were added (contents were 0.5 times, 1.0 times, and 2.0 times of resveratrol content in grape seeds samples). Three parallel experiments were performed simultaneously with each group. Extraction and determination were carried out according to the procedures in Section 2.3.

2.8. Comparison of Different Extraction Methods

In the present paper, some methods such as Reflux extraction (RE), ultrasonic extraction (UE), and microwave-assisted extraction (ME) were compared with SWE for their extraction efficiency of RES from grape seeds.

2.8.1. Reflux Extraction (RE)

Sample (2 g, 60 mesh) was mixed with 30 mL of ethanol (75%) into a round-bottom flask by heat reflux extraction, performed in a water bath for 6 h at 70 °C. The extract was filtered through a 0.22 μm membrane filter for HPLC analysis.

2.8.2. Ultrasonic Extraction (UE)

An ultrasonic broken extractor (SY-1000E, Beijing Hongxianglong Biotechnology Developing Co., Ltd., Beijing, China) was used for the RES experiments. Dried material (2 g, 60 mesh) was placed into a conical flask, into which 30 mL of ethanol (40%) was added. The mixture was extracted for 12 min under a sonic frequency of 50 KHz at 40 °C. Finally, the extract was filtered through a 0.22 μm membrane filter for HPLC analysis.

2.8.3. Microwave-Assisted Extraction (ME)

ME was carried out using microwave reactor (Multiwave 3000, Anton Paar, VA, USA). Sample (2 g, 60 mesh) was added into the extraction vessel and extracted with 30 mL of ethanol (60%) for 15 min under a constant microwave irradiation power of 500 W at 50 °C. The obtained extract was filtered through a 0.22 μm membrane filter for HPLC analysis.

2.9. Statistical Analysis

All experiments were carried out in triplicate. Results were expressed as mean ± standard deviation of replicate extraction. The analysis of variance (ANOVA) was used to analyze the significant terms in the models. The optimal extraction was estimated through regression analysis and three-dimensional response surface plots by using the Design Expert 8.0.6b Trial (State-Ease, Inc., Minneapolis, MN, USA).

3. Results and Discussion

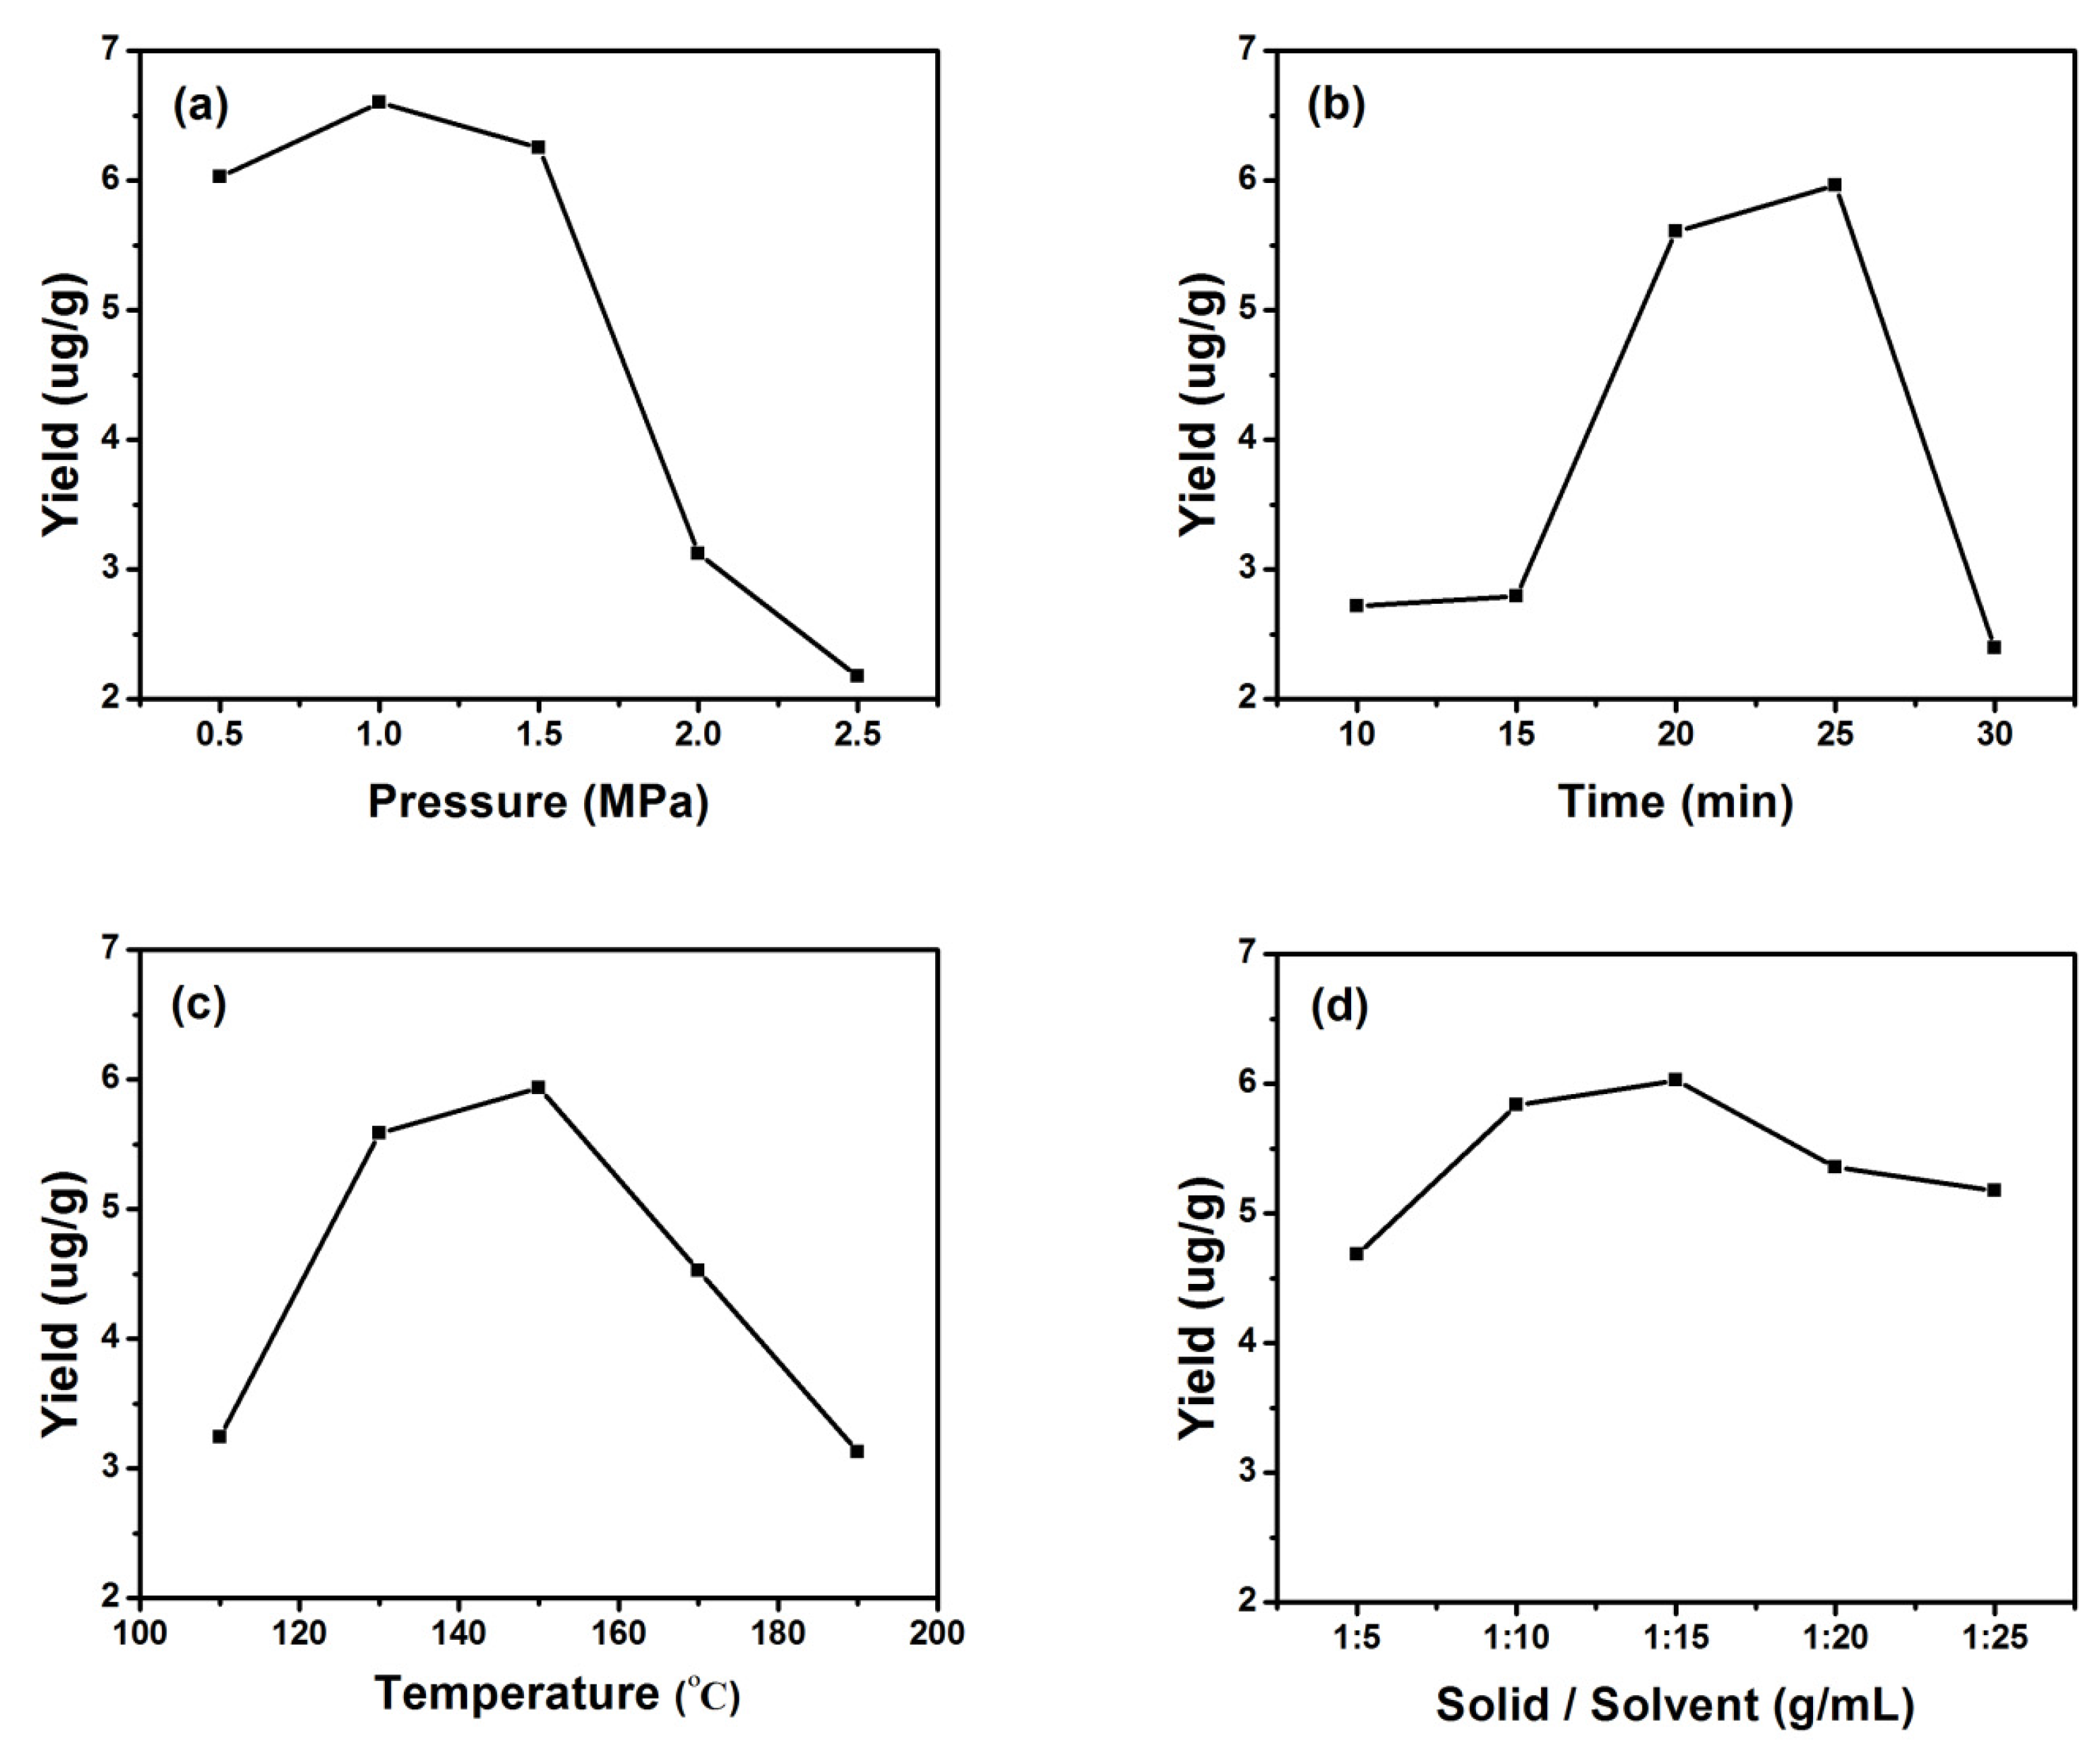
3.1. Single-Factor Experimental Analysis

The effects of extraction pressure on extraction yield of RES are depicted in Figure 2a. The other extraction variables were set as follows: extraction time of 20 min, extraction temperature at 150 °C and solid/solvent ratio of 1:15 g/mL. The results showed that RES yield increased from that of 0.5 MPa: in 1.0 MPa, the yield was highest (6.90 μg/g); from 1.0 MPa to 2.5 MPa, it decreased and intensively decreased during 1.5 MPa to 2.5 MPa. This was the result of the rupture speed of cell wall accelerating with the increasing of pressure and hence the enhanced extraction efficiency. However, the structure of RES would be damaged if the pressure was overly high [24]. The effects of extraction time on extraction yield of RES is depicted in Figure 2b. Extraction time was from 10 to 30 min, while other extraction variables were set as follows: extraction temperature at 150 °C, extraction pressure at 1.0 MPa, and solid/solvent ratio of 1:15 g/mL. Results demonstrated that maximum RES yield (5.96 μg/g) was reached during a 25 min extraction interval, from which point yield began to decrease. At the beginning of the extraction, solvent kept the diffusion from internal of grape seed to dissolve RES, then it reduced due to partial degradation of RES over time and high temperature [25]. In Figure 2c, we found that from 110 °C to 150 °C, the yield of RES changed significantly. An increase in temperature favored the extraction of phenolics by enhancing the diffusion coefficient of solvent, solubility of solutes, diffusion rate of analytes, and reducing solvent viscosity and surface tension [26]. At this point, the other conditions were set as follows: solid/solvent ratio, 1:15 g/mL; pressure, 1.0 MPa; and extraction time, 25 min. Compared with pressure, time, and temperature, we could clearly see in Figure 2d that the influence of solid/solvent ratio on the extraction rate was small. In the range from 1:5 to 1:25 g/mL, the yield hardly changed. Therefore, in the following optimization of the process, the solid/solvent ratio might be considered a constant value.

3.2. Fitting the Model

To optimize the mutual effect of three independent variables (extraction pressure, extraction time, and extraction temperature) on RES extraction yield, BBK was carried out using three factors and three levels. Table 2 lists RES yield under different conditions. In this condition, each experiment was repeated three times and the final results was the average of those data. The results showed that RES yield ranged from 4.43 to 6.90 μg/g. The data for our BBK experiment were analyzed by multiple regression analysis, by which a quadratic polynomial equation was derived to describe the relationship between RES yield and variables:
Y = 6.90 + 0.073X1 + 0.15X2 + 0.24X3 − 0.39X1X2 − 0.18X1X3 − 0.28X2X3 − 0.75 X12 − 0.97 X22 − 1.02 X32
where Y was the RES yield, while X1, X2, and X3 were the pressure, time, and temperature. Negative coefficients indicated an unfavorable effect on RES yield, while positive coefficients indicated a favorable effect on RES yield [27]. This equation demonstrated that the extracted RES yield depended most on temperature, followed by the time and pressure.

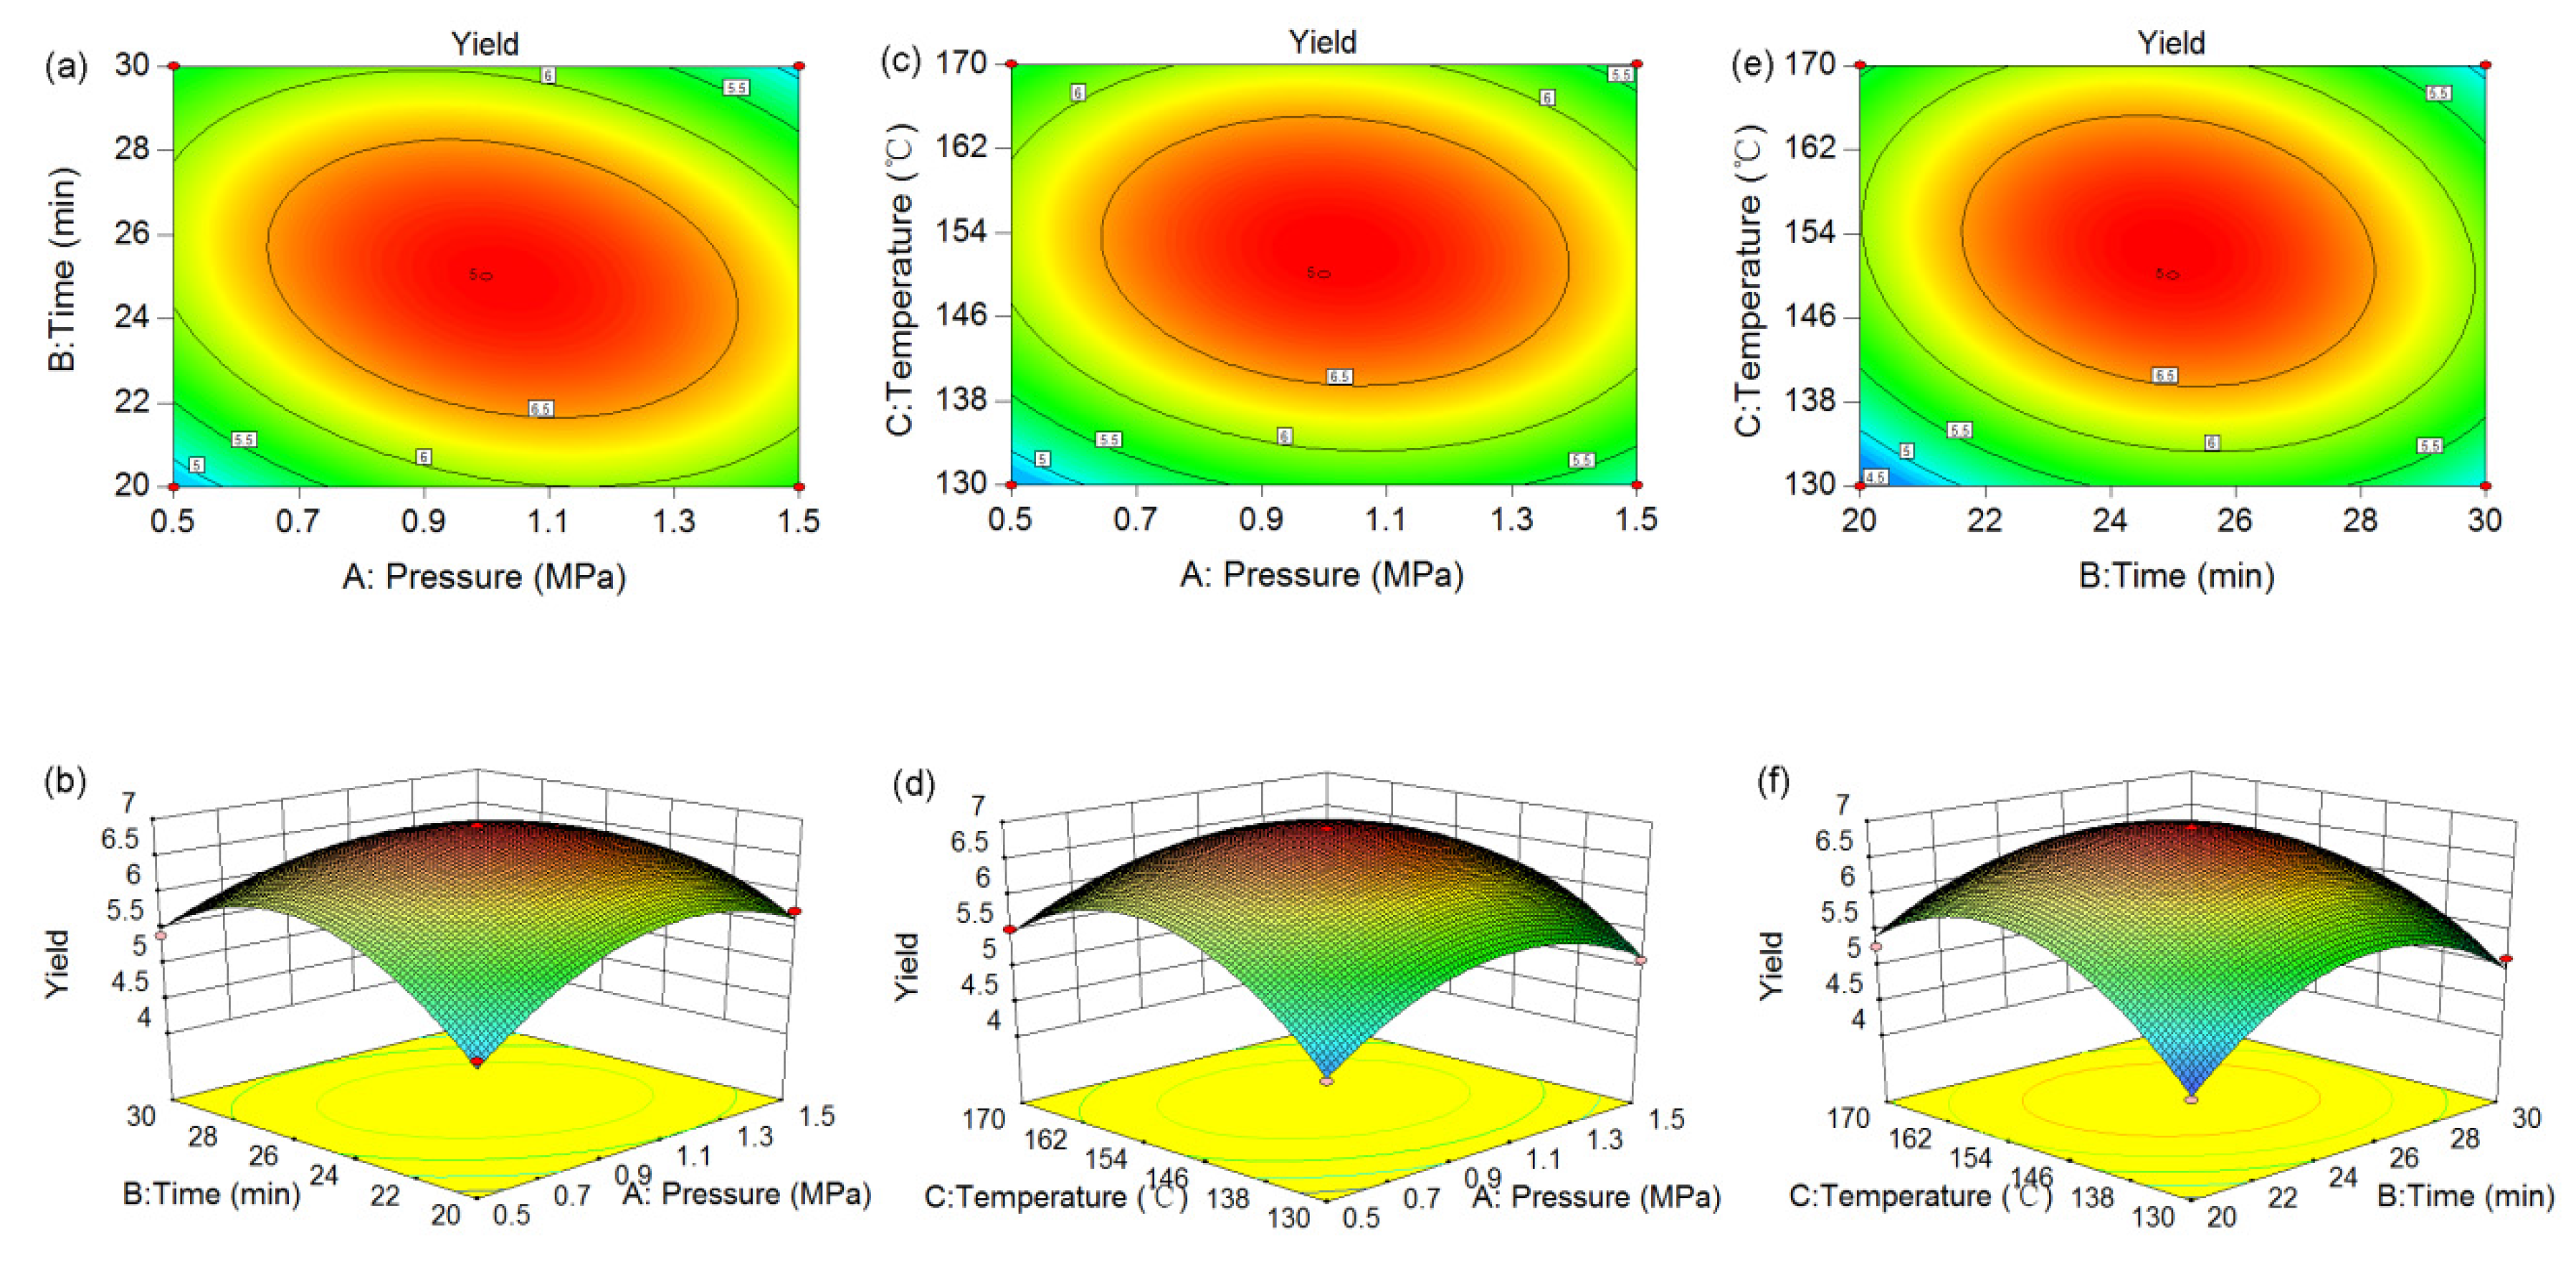
3.3. Modeling of the Extraction Process and Test of Significance

Analysis of variance (ANOVA) was used to analyze the significance of the developed model equation, the results of which are shown in Table 3. Two important indicators for ANOVA were the F-value and p-value. The model F-value of 107.09 implied that the model was significant. A p-value less than 0.001 also indicated that the model was significant [28]. It also could be seen from Table 3 that the linear co-efficients (X3) and a quadratic term co-efficient (X1X2, X2X3) were significant, with small p-values (p < 0.05). The other term co-efficients were not significant (p > 0.05). Therefore, X3, X1X2 and X2X3 were important factors in the SWE process of RES.

3.4. Optimization of Subcritical Water Extraction

The effects of variables and their interactions on the RES yield were elucidated by 3D response surface observations and 2D contour plots (Figure 3) that described the regression of Equation (2) by means of a graphic approach, which provided a method to visualize the relationships between RES yield and any two independent variables, while the third was fixed at its zero level (center value of the testing ranges). The maximum predicted response was located on the peak of the 3D response surface, the corresponding point for which was defined by the smallest ellipse in the contour diagram of the 2D contour plot [29].
Presented in Figure 3a,b are the effects of extraction pressure, time, and their interactions on RES yield. The RES yield increased with increasing extraction pressure, up to 1.02 MPa, and increasing extraction time, up to 24.89 min. Beyond an extraction pressure of 1.02 MPa or extraction time of 24.89 min, there was decrease in the RES yield. In general, the increase in pressure increased the rupture speed of the cell wall, enhancing extraction efficiency. However, the structure of RES was unstable and it could be damaged if the pressure was too high. The increase of extraction time increased exposure of the reactive site to the effective extraction process, which in turn enhanced RES yield. The reduction in RES yield was due to partial degradation of RES over extended time and high temperature. Figure 3c,d displayed the effects of extraction pressure and temperature on RES yield and their interactions. RES yield increased with increased pressure and temperature. The effects of extraction time, temperature, and their interactions on RES yield are depicted in Figure 3e,f. From these observations, we found that RES yield increased with temperature and time. This phenomenon was due to the fact that water at a higher temperature had a lower dielectric constant, reducing the energy required for division in solute-matrix interactions, and also reduced polarity due to weakened hydrogen bonds [30]. Furthermore, water in its subcritical state exhibited hydrolytic properties as its ionization constant increased, producing an increase in the RES extraction efficiency as temperature increased [31]. Beyond an extraction time of 24.89 min or extraction temperature of 152.32 °C, there was no further increase in the RES yield.
Figure 3 shows the optimal extraction conditions for the entire SWE process to be an extraction pressure at 1.02 MPa, extraction time of 24.89 min and extraction temperature at 152.32 °C. Furthermore, RSM predicted a maximum RES yield of 7.14 μg/g. The validation experiment was performed the above optimized extraction conditions, where RES yield reached 6.90 μg/g. This was closed with the predicted yield value.

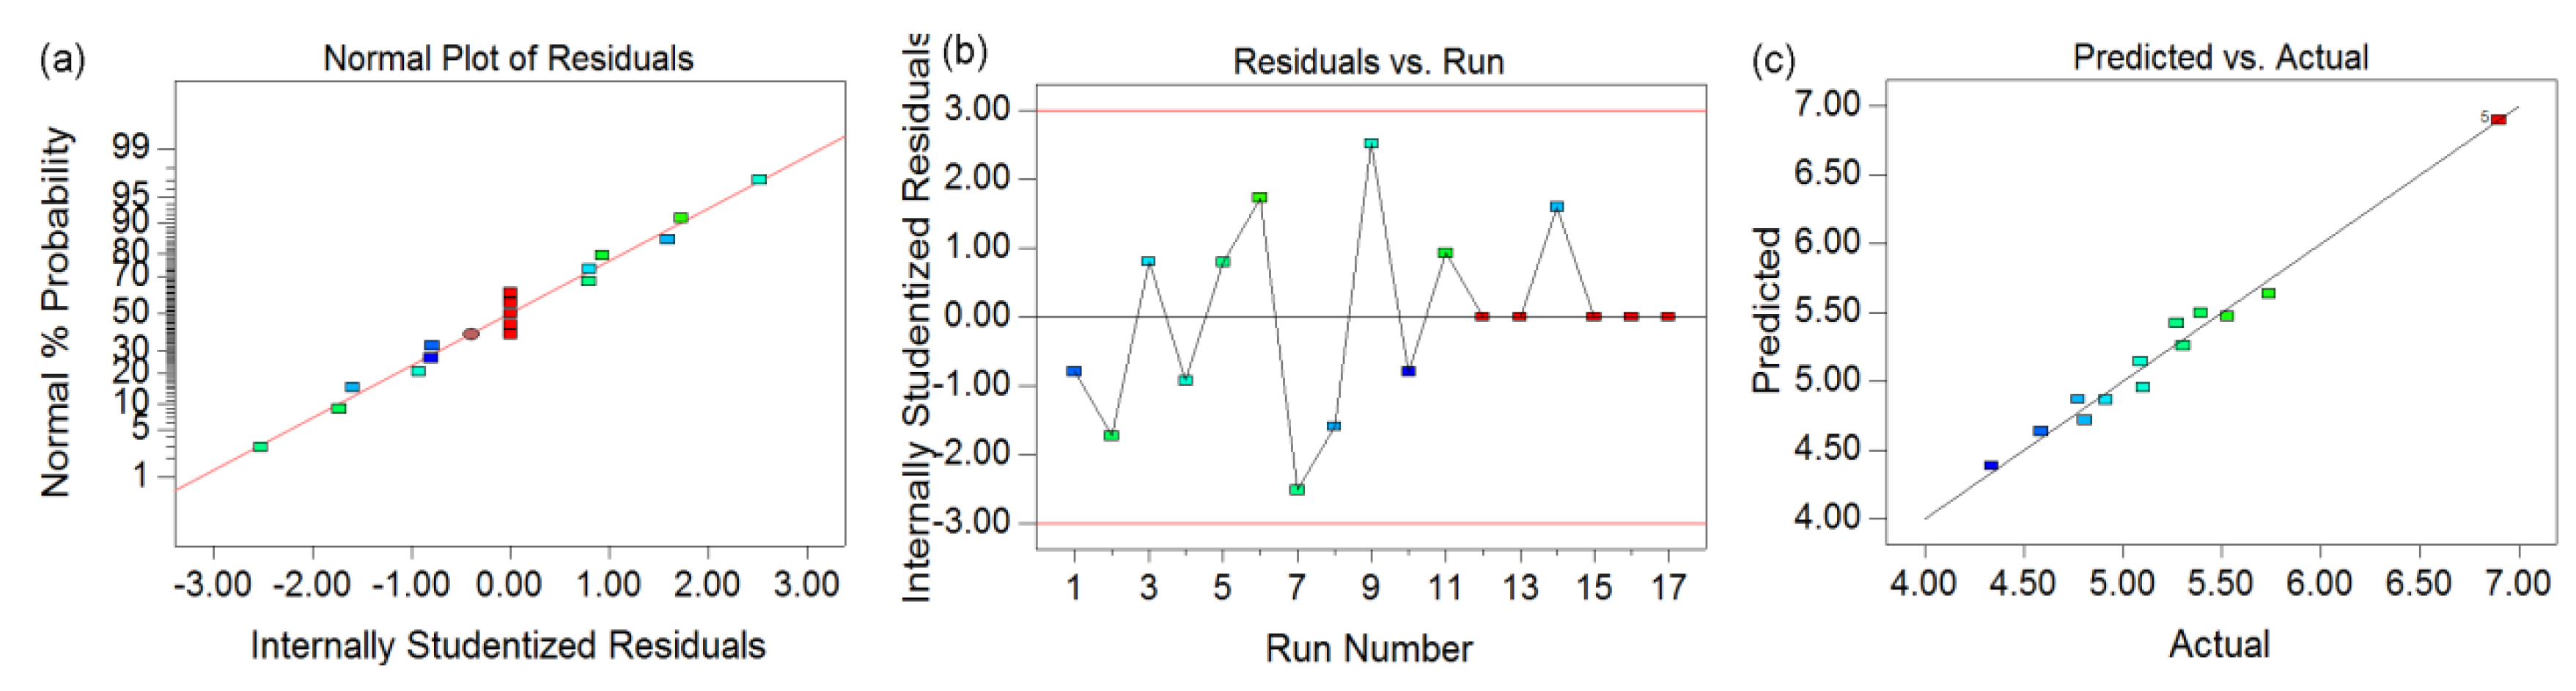
3.5. Analysis of Normal Probability Plot

To understand the nature of fitting, a normal probability plot could be applied to the residuals, i.e., the difference between the predicted and experimental values [32]. Figure 4a revealed that the residuals appeared to follow a straight grade, indicating that neither response transformation was required, nor was there any apparent problem with normality [33], thus affirming the analytical hypothesis. To ascertain the most satisfactory fit of the developed models, we used residuals runs for analysis, as shown in Figure 4b. It was particularly helpful to determine whether or not the order of observations influences the results. Our results confirmed that all data points lay within acceptable limits. Figure 4c shows the relationship between the actual and predicted values of RES yield, which indicated that the developed model was adequate, due to the small residual and the fact that the residual related closely to the diagonal line [21]. From the results in those figs, there appeared no evidence of error terms correlating with each other.

3.6. Spike Recovery Experiment

Spike recovery experiments largely reflect the accuracy of a measurement method. As can be seen from Table 4, the average recovery rate of three groups of experiments were 86.47%–91.98% for RES. At the same time, the relative standard deviation (RSD) value were less than 3%, indicating a good experimental repeatability.

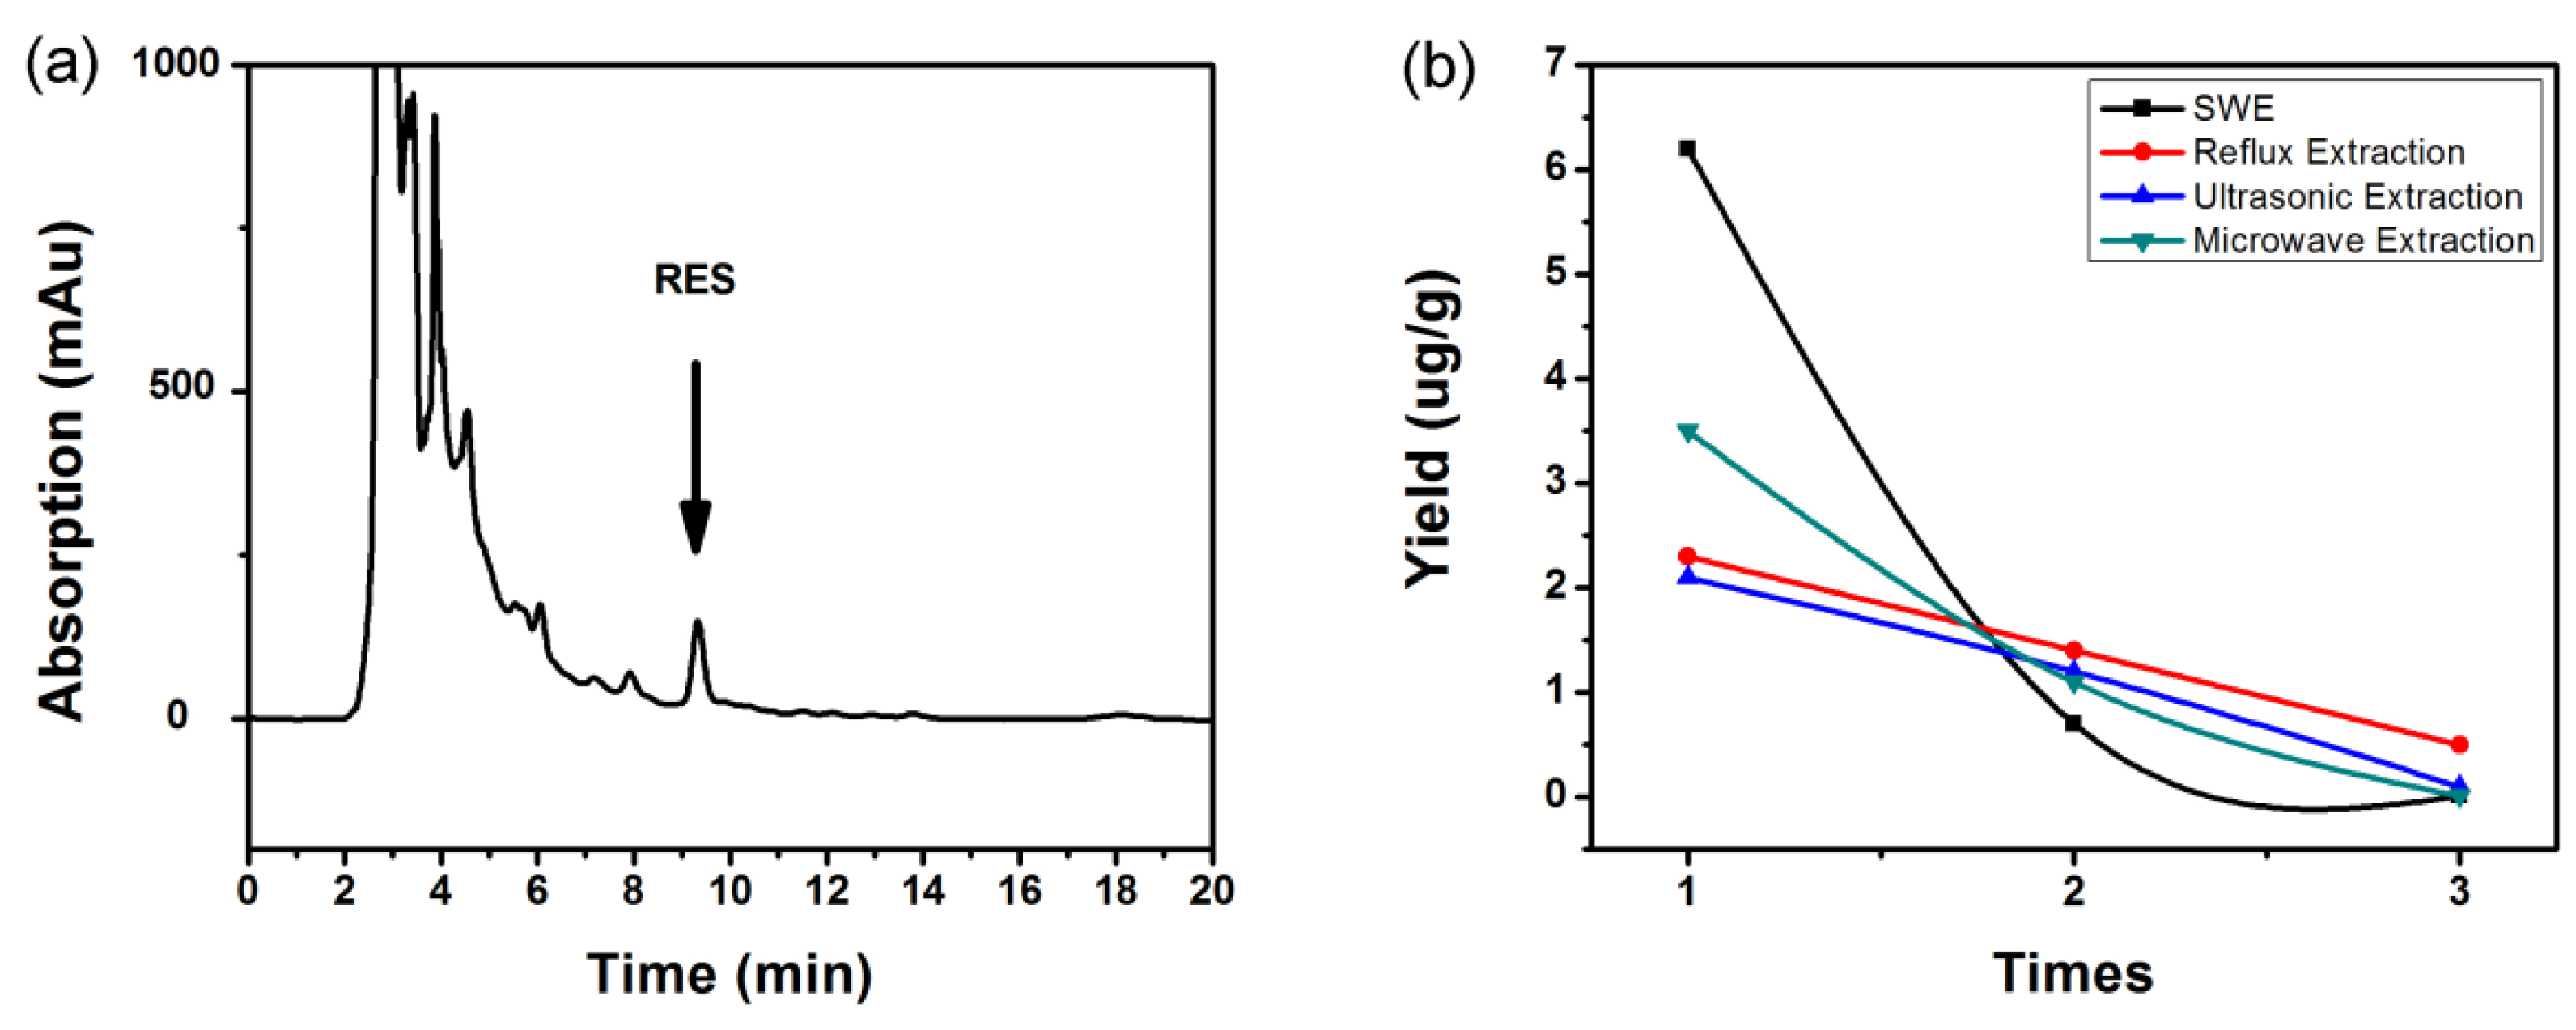
3.7. Comparison of SWE with Other Extraction Methods

The chromatogram of RES from grape seeds sample is displayed in Figure 5a. As we can see, there was a very obvious peak. However, there was difference in retention times of RES between the chromatogram of sample extract and standard. This difference was the result of two aspects. First, sample and standard were not measured at the same time: the concentration and pH of the mobile phase had a slightly difference. In addition, the sample contained lots of impurities and the influence of these impurities may have led to the difference of the retention time. In the spike recovery test, there was one peak rather than two overlapping peaks. Therefore, the method of subcritical water extraction of resveratrol from grape seeds proved to be feasible. As shown in Figure 5b, subcritical water extraction only once proved to gain highest RES yield, followed by microwave extraction, reflux extraction, and ultrasonic extraction. The results affirmed that extraction by subcritical water at high temperature modified the dielectric constant of water to allow the increased solubility of weakly polar compounds. Therefore, subcritical water extraction of RES is an efficient method and this method is suitable for extraction on active natural product ingredients.
A general definition of green chemistry is the invention, design, and application of chemical products and processes to reduce or to eliminate the use and generation of hazardous substances [34]. In the case of the green extraction of natural products, the process also should reduce energy consumption and extraction time, allow for the use of alternative solvents, obtain useful co-products, and ensure a safe and high quality of product [35]. In our research, the SWE process of RES from grape seeds was consistent with the above principles. Apart from the higher extraction rate, the high added value of extraction RES by SWE was proven by the data of different methods in Table 5. First, compared to other methods, water was used instead of organic solvent. Second, extraction time was significantly reduced. Additionally, the raw materials (grape seeds) are a by-product of grape processing; while extracting resveratrol, procyanidin was also extracted and extraction yield up to 87.12 mg/g. This method was also easy to operate. Although high temperature and high pressure operating conditions were required during subcritical water extraction, a shorter period of time meant less energy consumption, which could be further reduced by energy recovery. For example, a prototype of eco-evaporator able to recover up to 55% of the energy was developed in the south of France for steam distillation of lavender. The overall saving in thermal energy was around 80%, with no impact on the product’s quality [34]. To sum up, compared to other methods, extraction RES from grape seeds by SWE has a high added value.

4. Conclusions

In this work, resveratol (RES) was extracted from grape seeds by subcritical water extraction method. Based on the results of single-factor experiments, the Box-Behnken (BBK) design for response surface methodology (RSM) was used to identify optimal treatment conditions. It was demonstrated that optimal values of extraction pressure, extraction time, extraction temperature, and solid/solvent ratio were 1.02 MPa, 24.89 min, 152.32 °C, and 1:15 g/mL, respectively. The RES yield reached 6.90 μg/g under the above optimized conditions. The concentration of RES in the extracts was determined by HPLC, and those results were compared to RES obtained by different methods (reflux extraction, ultrasonic extraction, microwave extraction, hot-water extraction, and SWE). Overall, in terms of extraction from natural plants, subcritical water extraction had the advantages of efficiency, low cost, and being environmentally friendly. However, the product of SWE contains more impurities. Therefore, work on the purification of substance extracted by SWE requires further investigation.

Acknowledgments

The authors wish to thank the Innovative program for college students of China (No. 2015-10022038) and the National Natural Science Foundation of China (No. 21576029) for the support of this study.

Author Contributions

Jing He and Jiandu Lei proposed the idea for this research work; Yajie Tian designed and performed the experiments; Yingsa Wang, Yunyun Ma, Pengbo Zhu contributed to analyzing the data; Yajie Tian wrote the paper. All the authors read and approved the final manuscript.

Conflicts of Interest

The authors declare no conflict of interest.

References

  1. Marques, J.L.; Della Porta, G.; Reverchon, E.; Renuncio, J.A.R.; Mainar, A.M. Supercritical antisolvent extraction of antioxidants from grape seeds after vinification. J. Supercrit. Fluids. 2013, 82, 238–243. [Google Scholar] [CrossRef]
  2. International Organisation of Vine and Wine. Available online: http://www.oiv.int/ (accessed on 19 September 2016).
  3. Yilmaz, E.; Ozvural, E.; Vural, H. Extraction and identification of proanthocyanidins from grape seed (Vitis vinifera) using supercritical carbon dioxide. J. Supercrit. Fluids 2011, 55, 924–928. [Google Scholar] [CrossRef]
  4. Kurabachew, S.D.; Alessandro, A.C.; Hatem, B.M.; Patrizia, P.; Luca, F. Extraction of polyphenols from grape skins and defatted grape seeds using subcritical water: Experiments and modeling. Food Bioprod. Process. 2015, 94, 29–38. [Google Scholar]
  5. Ben, M.H.; Duba, K.S.; Fiori, L.; Abdelgawed, H.; Tlili, I.; Tounekti, T.; Zrig, A. Bioactive compounds and antioxidant activities of different grape (Vitis vinifera L.) seed oils extracted by supercritical CO2 and organic solvent. LWT Food Sci. Technol. 2016, 74, 557–562. [Google Scholar]
  6. Locatelli, M.; Travaglia, F.; Coisson, J.D.; Bordiga, M.; Arlorio, M. Phenolic composition of Nebbiolo grape (Vitis vinifera L.) from Piedmont: Characterization during ripening of grapes selected in different geographic areas and comparison with Uva Rara and Vespolina cv. Eur. Food Res. Technol. 2016, 242, 1057–1068. [Google Scholar] [CrossRef]
  7. Gabriel, D.P.; Inigo, A.; Maria, R. Grape seed extract: Additive and functional ingredient. Agro Food Ind. Hi-Tech 2013, 24, 41–43. [Google Scholar]
  8. Jin, H.F.; Liu, M.C.; Zhang, X.; Pan, J.J.; Han, J.Z.; Wang, Y.D.; Lei, H.X.; Ding, Y.C.; Yuan, Y.H. Grape seed procyanidin extract attenuates hypoxic pulmonary hypertension by inhibiting oxidative stress and pulmonary arterial smooth muscle cells proliferation. J. Nutr. Biochem. 2016, 36, 81–88. [Google Scholar] [CrossRef] [PubMed]
  9. Alexandre, E.C.; Calmasini, F.B.; de Oliveira, M.G.; Silva, F.H.; da Silva Carmem, P.V.; Andre, D.M.; Leonardo, F.C.; Delbin, M.A.; Antunes, E. Chronic treatment with resveratrol improves overactive bladder in obese mice via antioxidant activity. Eur. J. Pharmacol. 2016, 788, 29–36. [Google Scholar] [CrossRef] [PubMed]
  10. Joseph, A.B.; Kevin, J.P.; Nathan, L.P.; Hamish, A.J.; Carles, L.; Avash, K.; Vinayakumar, V.P.; Joanne, S.A.; Guillermo, L.L.; Kaitlyn, L.; et al. Resveratrol improves health and survival of mice on a high-calorie diet. Nature 2006, 444, 337–342. [Google Scholar]
  11. Mikami, S.; Ota, I.; Masui, T.; Asako, I.H.; Shobatake, R.; Okamoto, H.; Takasawa, S.; Kitahara, T. Effect of resveratrol on cancer progression through the REG III expression pathway in head and neck cancer cells. Int. J. Oncol. 2016, 49, 1553–1560. [Google Scholar] [PubMed]
  12. Chen, F.L.; Zhang, X.L.; Du, X.Q.; Yang, L.; Zu, Y.G.; Yang, F.J. A new approach for obtaining trans-resveratrol from tree peony seed oil extracted residues using ionic liquid-based enzymatic hydrolysis in situ extraction. Sep. Purif. Technol. 2016, 107, 294–305. [Google Scholar] [CrossRef]
  13. Lin, J.A.; Kuo, C.H.; Chen, B.Y.; Li, Y.; Liu, Y.C.; Chen, J.H.; Shieh, C.J. A novel enzyme-assisted ultrasonic approach for highly efficient extraction of resveratrol from Polygonum cuspidatum. Ultrason Sonochem. 2016, 32, 258–264. [Google Scholar] [CrossRef] [PubMed]
  14. Mantell, C.; Rodríguez, M.; de la Ossa, E.M. Ascreening analysis o fthe high-pressure extraction of anthocyanins from red grape pomace with carbondioxide+co-solvent. Eng. Life Sci. 2003, 3, 38–42. [Google Scholar] [CrossRef]
  15. Lourdes, C.; Mantell, C.; Rodriguez, M.; Ana, B. Extraction of resveratrol from the pomace of Palomino fino grapes by supercritical carbon dioxide. J. Food Eng. 2010, 96, 304–308. [Google Scholar]
  16. Erkan, K.; Giuseppe, M.; Levent, B.; Nevzat, A. Extraction of Bioactive Compounds from Milled Grape Canes (Vitis vinifera) Using a Pressurized Low-Polarity Water Extractor. Food Bioprocess Technol. 2012, 5, 359–371. [Google Scholar]
  17. Lu, W.; Chen, X.W.; Wang, J.M.; Yang, X.Q.; Qi, J.R. Enzyme-assisted subcritical water extraction and characterization of soy protein from heat-denatured meal. J. Food Eng. 2016, 169, 250–258. [Google Scholar] [CrossRef]
  18. Wang, H.Y.; Lu, Y.C.; Chen, J.; Li, J.C.; Liu, S.H. Subcritical water extraction of alkaloids in Saphora flavescens Ait. and determination by capillary electrophoresis with field-amplified samples stacking. J. Pharm. Biomed. 2012, 58, 146–151. [Google Scholar] [CrossRef] [PubMed]
  19. Kubatova, A.; Lagadec, A.J.; Miller, D.J.; Hawthorne, S.B. Selective extraction of oxygenates from savory and peppermint using subcritical water. J. Flavour Fragr. 2001, 16, 64–73. [Google Scholar] [CrossRef]
  20. Vladic, J.; Canli, O.; Pavlic, B.; Zekovic, Z.; Vidovic, S.; Kaplan, M. Optimization of Satureja montana subcritical water extraction process and chemical characterization of volatile fraction of extracts. J. Supercrit. Fluids 2017, 120, 86–94. [Google Scholar] [CrossRef]
  21. Wang, J.; Wang, H.P.; Wang, X.; Cui, H.; Lu, F. Statistical analysis of process parameters to eliminate hot cracking of fiber laser welded aluminum alloy. Opt. Laser Technol. 2015, 66, 15–21. [Google Scholar] [CrossRef]
  22. Abdussamet, S.; Bayram, S.; Irfan, K. Multi-objective optimization of a honeycomb heat sink using Response Surface Method. Int. J. Heat. Mass Trans. 2016, 101, 295–302. [Google Scholar]
  23. Geana, E.I.; Dinca, O.R.; Lonete, R.E.; Artem, V.; Niculescu, V.C. Monitoring trans-Resveratrol in Grape Berry Skins during Ripening and in Corresponding Wines by HPLC. Food Technol. Biotechnol. 2015, 53, 73–80. [Google Scholar] [CrossRef] [PubMed]
  24. Chainukool, S.; Goto, M.; Hannongbua, S.; Shotipruk, A. Subcritical Water Extraction of Resveratrol from Barks of Shorea roxburghii G. Don. Sep. Sci. Technol. 2014, 49, 2073–2078. [Google Scholar] [CrossRef]
  25. Rodriguez-Cabo, T.; Rodriguez, I.; Ramil, M.; Cela, R. Comprehensive evaluation of the photo-transformation routes of trans-resveratrol. J. Chromatogr. A 2015, 1410, 129–139. [Google Scholar] [CrossRef] [PubMed]
  26. Xu, H.G.; Wang, W.Y.; Liu, X.; Yuan, F.; Gao, Y.X. Antioxidative phenolics obtained from spent coffee grounds (Coffea arabica L.) by subcritical water extraction. Ind. Crop Prod. 2015, 76, 946–954. [Google Scholar] [CrossRef]
  27. Selin, S.; Rüya, S. Optimization of olive leaf extract obtained by ultrasound-assisted extraction with response surface methodology. Ultrason Sonochem. 2013, 20, 595–602. [Google Scholar]
  28. Nermeen, A.E.; Hassan, A.H.; Ebrahim, G.M.; Abou, E. Response Surface Methodology as a Tool for Optimizing the Production of Antimicrobial Agents from Bacillus licheniformis SN2. Curr. Res. Bacteriol. 2009, 39, 1–14. [Google Scholar]
  29. Li, P.; Zhou, L.; Mou, Y.; Mao, Z. Extraction optimization of polysaccharide from Zanthoxylum bungeanum using RSM and its antioxidant activity. Int. J. Biol. Macromol. 2015, 72, 19–27. [Google Scholar] [CrossRef] [PubMed]
  30. Ko, M.J.; Cheigh, C.I.; Chung, M.S. Optimization of Subcritical Water Extraction of Flavanols from Green Tea Leaves. J. Agric. Food Chem. 2014, 62, 375–381. [Google Scholar] [CrossRef] [PubMed]
  31. Liu, J.; Chen, P.; Yao, W.J.; Wang, J.; Wang, L.Y.; Deng, L.H.; He, J.; Zhang, G.F.; Lei, J.D. Subcritical water extraction of betulinic acid from birch bark. Ind. Crop Prod. 2015, 74, 557–565. [Google Scholar] [CrossRef]
  32. Gu, T.; Chen, Z.; Jiang, X.; Zhou, L.; Liao, Y.; Duan, M.; Wang, H.; Pu, Q. Synthesis and inhibition of N-alkyl-2-(4-hydroxybut-2-ynyl) pyridinium bromide for mild steel in acid solution: Box–Behnken design optimization and mechanism probe. Corros. Sci. 2015, 90, 118–132. [Google Scholar] [CrossRef]
  33. Kirmizakis, P.; Tsamoutsoglou, C.; Kaya, B.; Kalderis, D. Subcritical water treatment of landfill leachate: Application of response surface methodology. J. Environ. Manag. 2014, 146, 9–15. [Google Scholar] [CrossRef] [PubMed]
  34. Chemat, F.; Vian, M.A.; Cravotto, G. Green Extraction of Natural Products: Concept and Principles. Int. J. Mol. Sci. 2012, 13, 8615–8627. [Google Scholar] [CrossRef] [PubMed]
  35. Rombaut, N.; Tixier, A.S.; Bily, A.; Chemat, F. Green extraction processes of natural products as tools for biorefinery. Biofuels Bioprod. Biorefin. 2014, 8, 530–544. [Google Scholar] [CrossRef]
Figure 1. Standard curve of extraction of resveratrol (RES) (a); liquid chromatographic chart of RES (b).
Applsci 07 00321 g001
Figure 2. Effects of different extraction parameters on RES extraction yield. Extraction pressure (a); extraction time (b); extraction temperature (c); solvent/solid ratio (d).
Applsci 07 00321 g002
Figure 3. Contour plots and response indicating the interactive effects of two factors on the extraction yield of RES: pressure and time (a,b); pressure and temperature (c,d); time and temperature (e,f).
Applsci 07 00321 g003
Figure 4. The normal probability plot of residuals (a); plot of internally residuals versus experimental runs (b); and plot of predicted and actual values (c).
Applsci 07 00321 g004
Figure 5. The chromatogram of RES (a); comparison of times with reported methods (b).
Applsci 07 00321 g005
Table 1. Variables and levels in response surface design.
VariablesLevels
−10+1
X1: Extraction pressure (MPa)0.51.01.5
X2: Extraction time (min)202530
X3: Extraction temperature (°C)130150170
Table 2. Box-Behnken design with independent variables and response values.
RunParameters and LevelsRES Yields (μg/g Material)
A: Pressure (MPa)B: Time (min)C: Temperature (°C)
10.5251304.59 ± 0.02
20.5301505.39 ± 0.01
31.0301704.91 ± 0.04
41.5251305.09 ± 0.03
51.5251705.30 ± 0.06
61.5201505.74 ± 0.08
71.0201705.27 ± 0.02
81.5301504.77 ± 0.03
91.0301305.10 ± 0.06
101.0201304.34 ± 0.01
110.5251705.53 ± 0.04
121.0251506.90 ± 0.03
131.0251506.90 ± 0.03
140.5201504.81 ± 0.04
151.0251506.90 ± 0.03
161.0251506.90 ± 0.03
171.0251506.90 ± 0.03
Table 3. Analysis of variance (ANOVA) of the quadratic model and lack of fit.
SourceSum of SquaresDegrees of FreedomMean SquareF-Valuep-Value
Model13.5391.50107.09<0.0001
X10.04310.0433.060.1235
X20.1210.1214.640.9312
X30.4510.4532.300.0007
X1X20.6010.6042.830.0003
X1X30.1310.139.390.0182
X2X30.3210.3222.520.0021
X122.3712.37168.79<0.0001
X223.9713.97238.09<0.0001
X324.4114.41313.87<0.0001
Residual0.09870.014--
Lack of fit0.09830.033--
Pure error0.00040.000--
Total13.6316---
Table 4. The results of average absolute recovery.
No.Added (μg/g)Detection Value (μg/g)Rate of Recovery (%)Average Absolute Recovery (%)RSD
1 9.9087.00
23.459.7883.6086.470.03
3 9.9688.80
1 13.1089.90
26.9012.9487.5487.780.02
3 12.8385.90
1 19.7393.00
213.8019.6192.0791.980.01
3 19.4490.87
Table 5. Comparison of extraction methods for their solvent type, solvent consumption, time-consumption, and extraction efficiency.
MethodSolvent TypeOrganic Solvent Consumption (%)Extraction TimeRES Yield (μg/g Material)
SWEUltrapure water025 min6.90 ± 0.03
REEthyl acetate60~905~12 h4.16 ± 0.2
UEMethanol30~75>10 min3.42 ± 0.26
MEAcetone30~75>10 min4.66 ± 0.25

