Article

Dielectric Characterization of Chinese Standard Concrete for Compressive Strength Evaluation

1
School of Civil Engineering, Qingdao University of Technology, Qingdao 266033, China
2
School of Civil Engineering, Shenyang Jianzhu University, Shenyang 110168, China
*
Author to whom correspondence should be addressed.
Appl. Sci. 2017, 7(2), 177; https://doi.org/10.3390/app7020177
Submission received: 27 December 2016 / Revised: 28 January 2017 / Accepted: 7 February 2017 / Published: 17 February 2017
(This article belongs to the Special Issue Structural Health Monitoring (SHM) of Civil Structures)

Abstract

:
Dielectric characterization of concrete is essential for the wireless structural health monitoring (SHM) of concrete structures. Guo Biao (GB) concrete refers to the concrete mixed and cast in accordance with the Chinese standard. Currently, China is the largest producer and consumer of concrete in the world. However, minimal attention has been paid to the dielectric properties of GB concrete. This paper presents the results of the dielectric constant of GB concrete, where three regression models have been used to present the measurement data from 10 MHz to 6 GHz. The objective is to provide a data set of nominal values of the dielectric constant for ordinary GB concrete. The final goal is to facilitate a compressive strength evaluation via the measured dielectric constant. Measurements of the dielectric constant and compressive strength for five types of ordinary concrete have been undertaken, after 28 days of curing. As the main contribution in this work, the correlation model between the compressive strength and dielectric constant of GB concrete is realized.

1. Introduction

Concrete is a heterogeneous cementitious material and the second most consumed material in the world. Concrete has long been used for all types of civil structures worldwide. In China, abundant megaprojects use cement concrete as basic building blocks, or as precast beam components in civil structures. According to the Chinese National Bureau of Statistics, China’s commodity concrete production was 1.64 billion cubic meters (BCMs) in 2015, and when compared to the value of 0.74 BCMs in 2011, it has increased by 222% [1]. This value indicates that China is the largest producer and consumer of concrete in the world, and its production roughly occupies about 15% of global production. The concrete which is mixed and cast to conform to the Chinese standard is termed the Guo Biao (GB) concrete [2,3]. There are many similarities between the Chinese standard concrete (JGJ55) and the European one (EN206-1). For example, the compressive strengths are both classified as C30, C35, C40, and so on, indicating that the minimum values of the corresponding compressive strengths are 30 MPa, 35 MPa, 40 MPa, and so on. However, the use of superplasticizer is recommended by the EN206-1, whereas the Chinese concrete does not strictly require this in JGJ55. The main differences among the worldwide standards are the physical properties (e.g., density) of the raw materials used, such as cement, sand, and coarse aggregate.
Ordinary cement concrete behaves like a brittle material, where cracks occur in the course of its long-term use. Such cracks are inevitable due to a variety of natural or man-made factors, and cause the compressive strength to decline, leading to structure deformation, and thus affecting the performance of structural integrity. Numerous nondestructive testing or evaluation (NDT/E) methods have been developed for the prediction of compressive strength, development monitoring, and the evaluation of standard concretes [4,5,6,7,8,9,10,11,12,13,14,15,16]. Conventional NDT/E techniques, such as visual inspection, rebound hammers, the pull-off resistance correlation method [4,5], and the maturity test [6], etc., often suffer from inaccuracy, being cost-intensive and time-consuming. Recently, state-of-the-art NDT techniques were developed for the monitoring, prediction, and evaluation of the mechanical deformation of concrete structures [7,8,9,10,11,12,13,14,15,16,17,18,19,20]. In particular, the piezoceramic-based smart aggregates play a significant role in concrete structural health monitoring (SHM) [7,8,9,10], wherein the determination of concrete properties was performed by using the travel time of longitudinal waves over a known distance, between smart aggregates. Electrical resistance and resistivity measurements were employed as a relation to the microstructure development of concrete mix, such as pore structure, porosity, and pore-size distribution, etc., and hence, for compressive strength prediction and evaluation [11,12,13,14,15]. Electrical conductance at microwave frequency has also been used in [16], as a function of the mobility and concentration of the ions in the pore solution of cementitious composites. More recently, novel methods were proposed, based on the communication of electromagnetic waves at low (stress wave) [17,18], highly nonlinear solitary wave [19], and high (microwave) [20] frequencies, used for concrete characterization, concrete surface moisture detection, and strength estimation, respectively. Their ultimate purpose was to detect damages, evaluate health conditions, alleviate hazards, and extend the working life of civil structures.
All of the described DNT techniques have their relative pros and cons, and no unique technique has been identified as perfect in all aspects, including the reduction of the life-cycle cost (LCC) [21]. The LCC comprises the initial cost, maintenance or repair cost, and cost of failure, power efficiency, and effectiveness. With the increasingly international widespread use of GB concrete, the demand for novel NDT/E techniques and those combining multiple techniques [22] for concrete-based structures, in terms of compressive strength prediction, evaluation, and other mechanical properties, is highly expected. Thus, this topic is of importance in the areas of cross-disciplinary research. One of the most important physical properties that governs electromagnetic wave propagation, is the relative dielectric constant (εr′) of the concrete. Thus far, studies on the dielectric properties of cementitious materials have received great attention in civil engineering [23,24,25,26,27,28,29,30,31]. The use of real-time dielectric constant measurements to evaluate the corresponding variation in the compressive strength of concrete, is a technique that will be well suited for SHM.
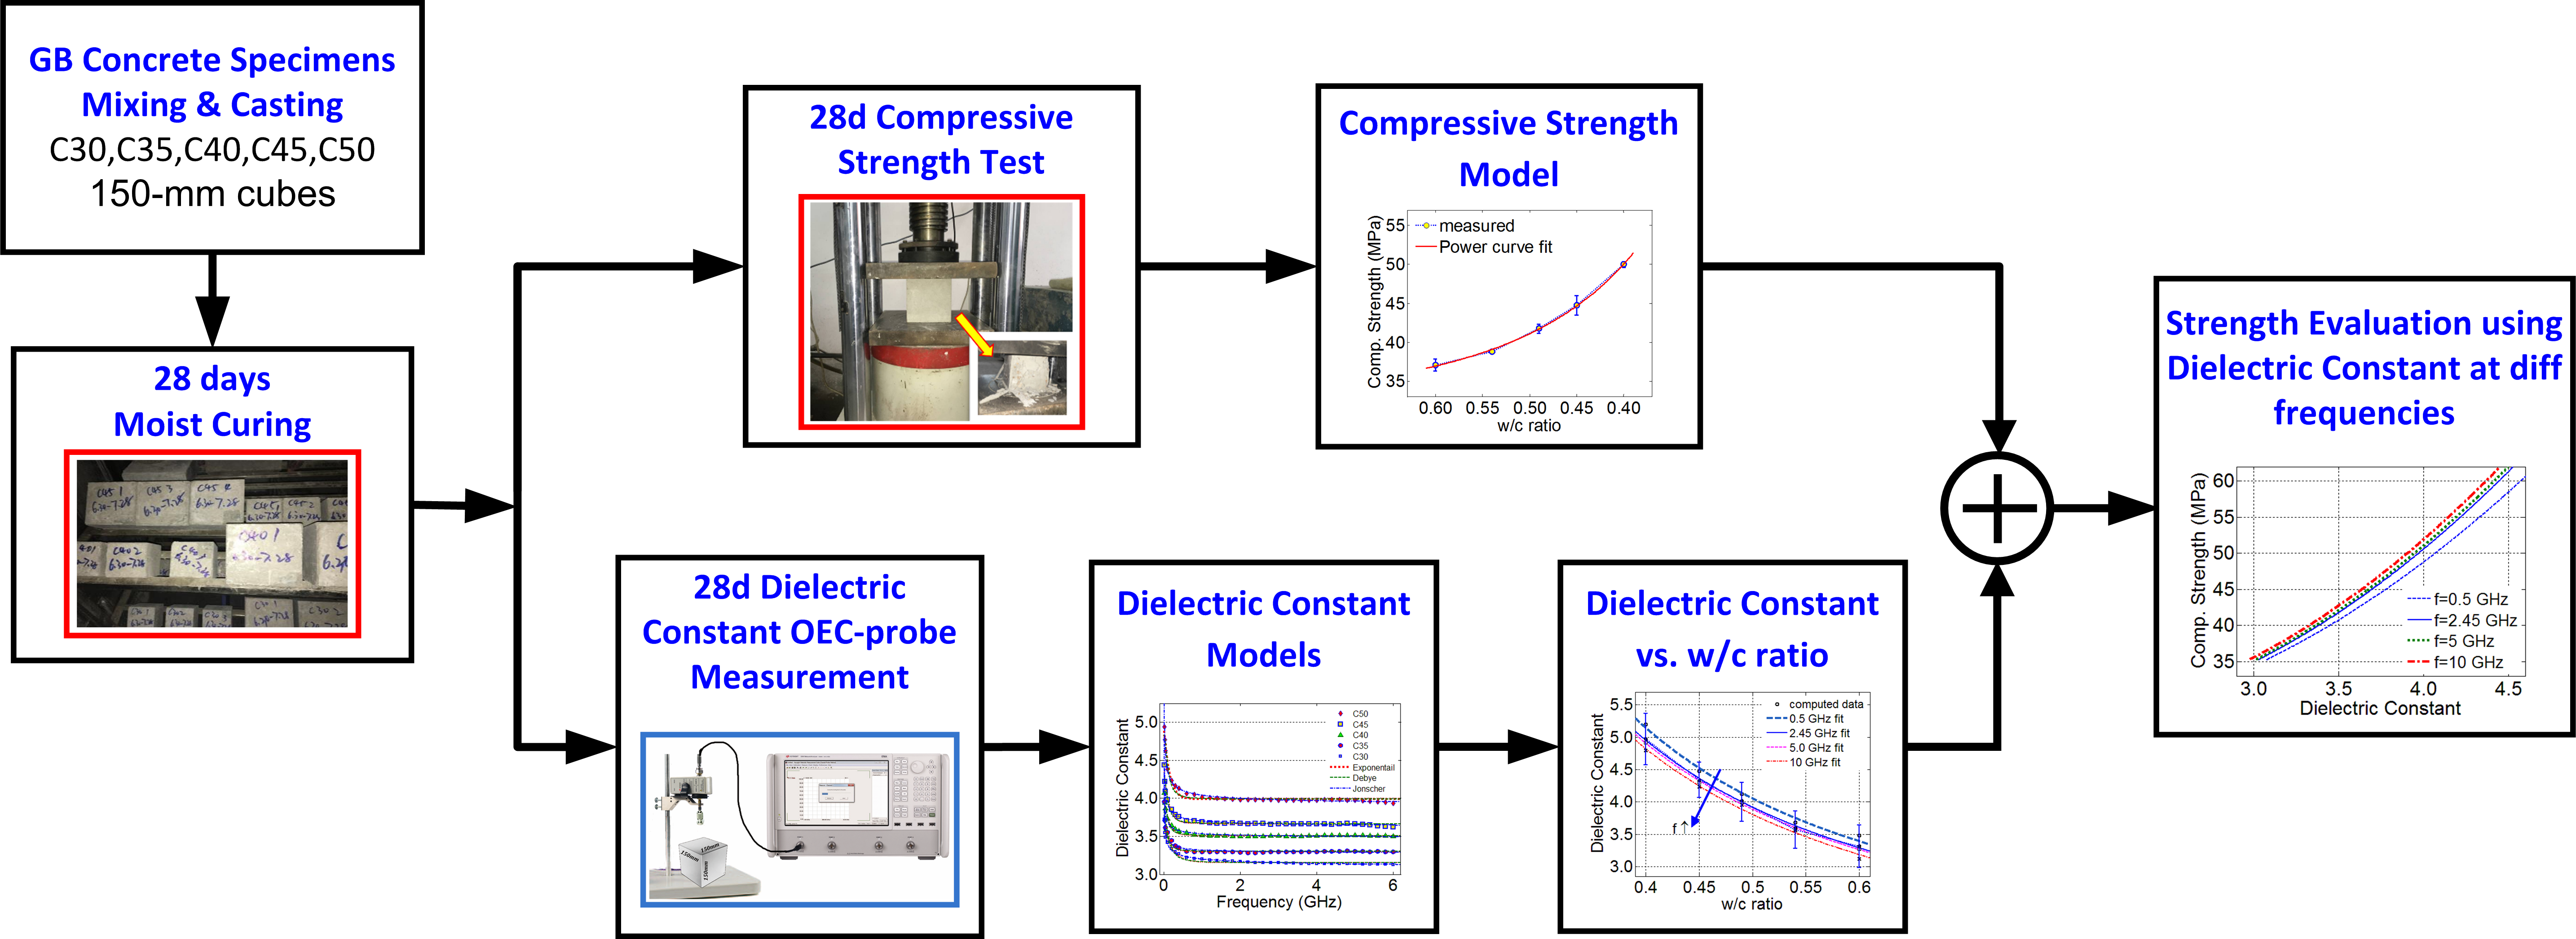
In this paper, the authors present experimental results on the dielectric characterization of standard concrete. Regression modeling of the measured values and analysis, against the water-to-cement ratio of the 28-day concrete, will be considered. 
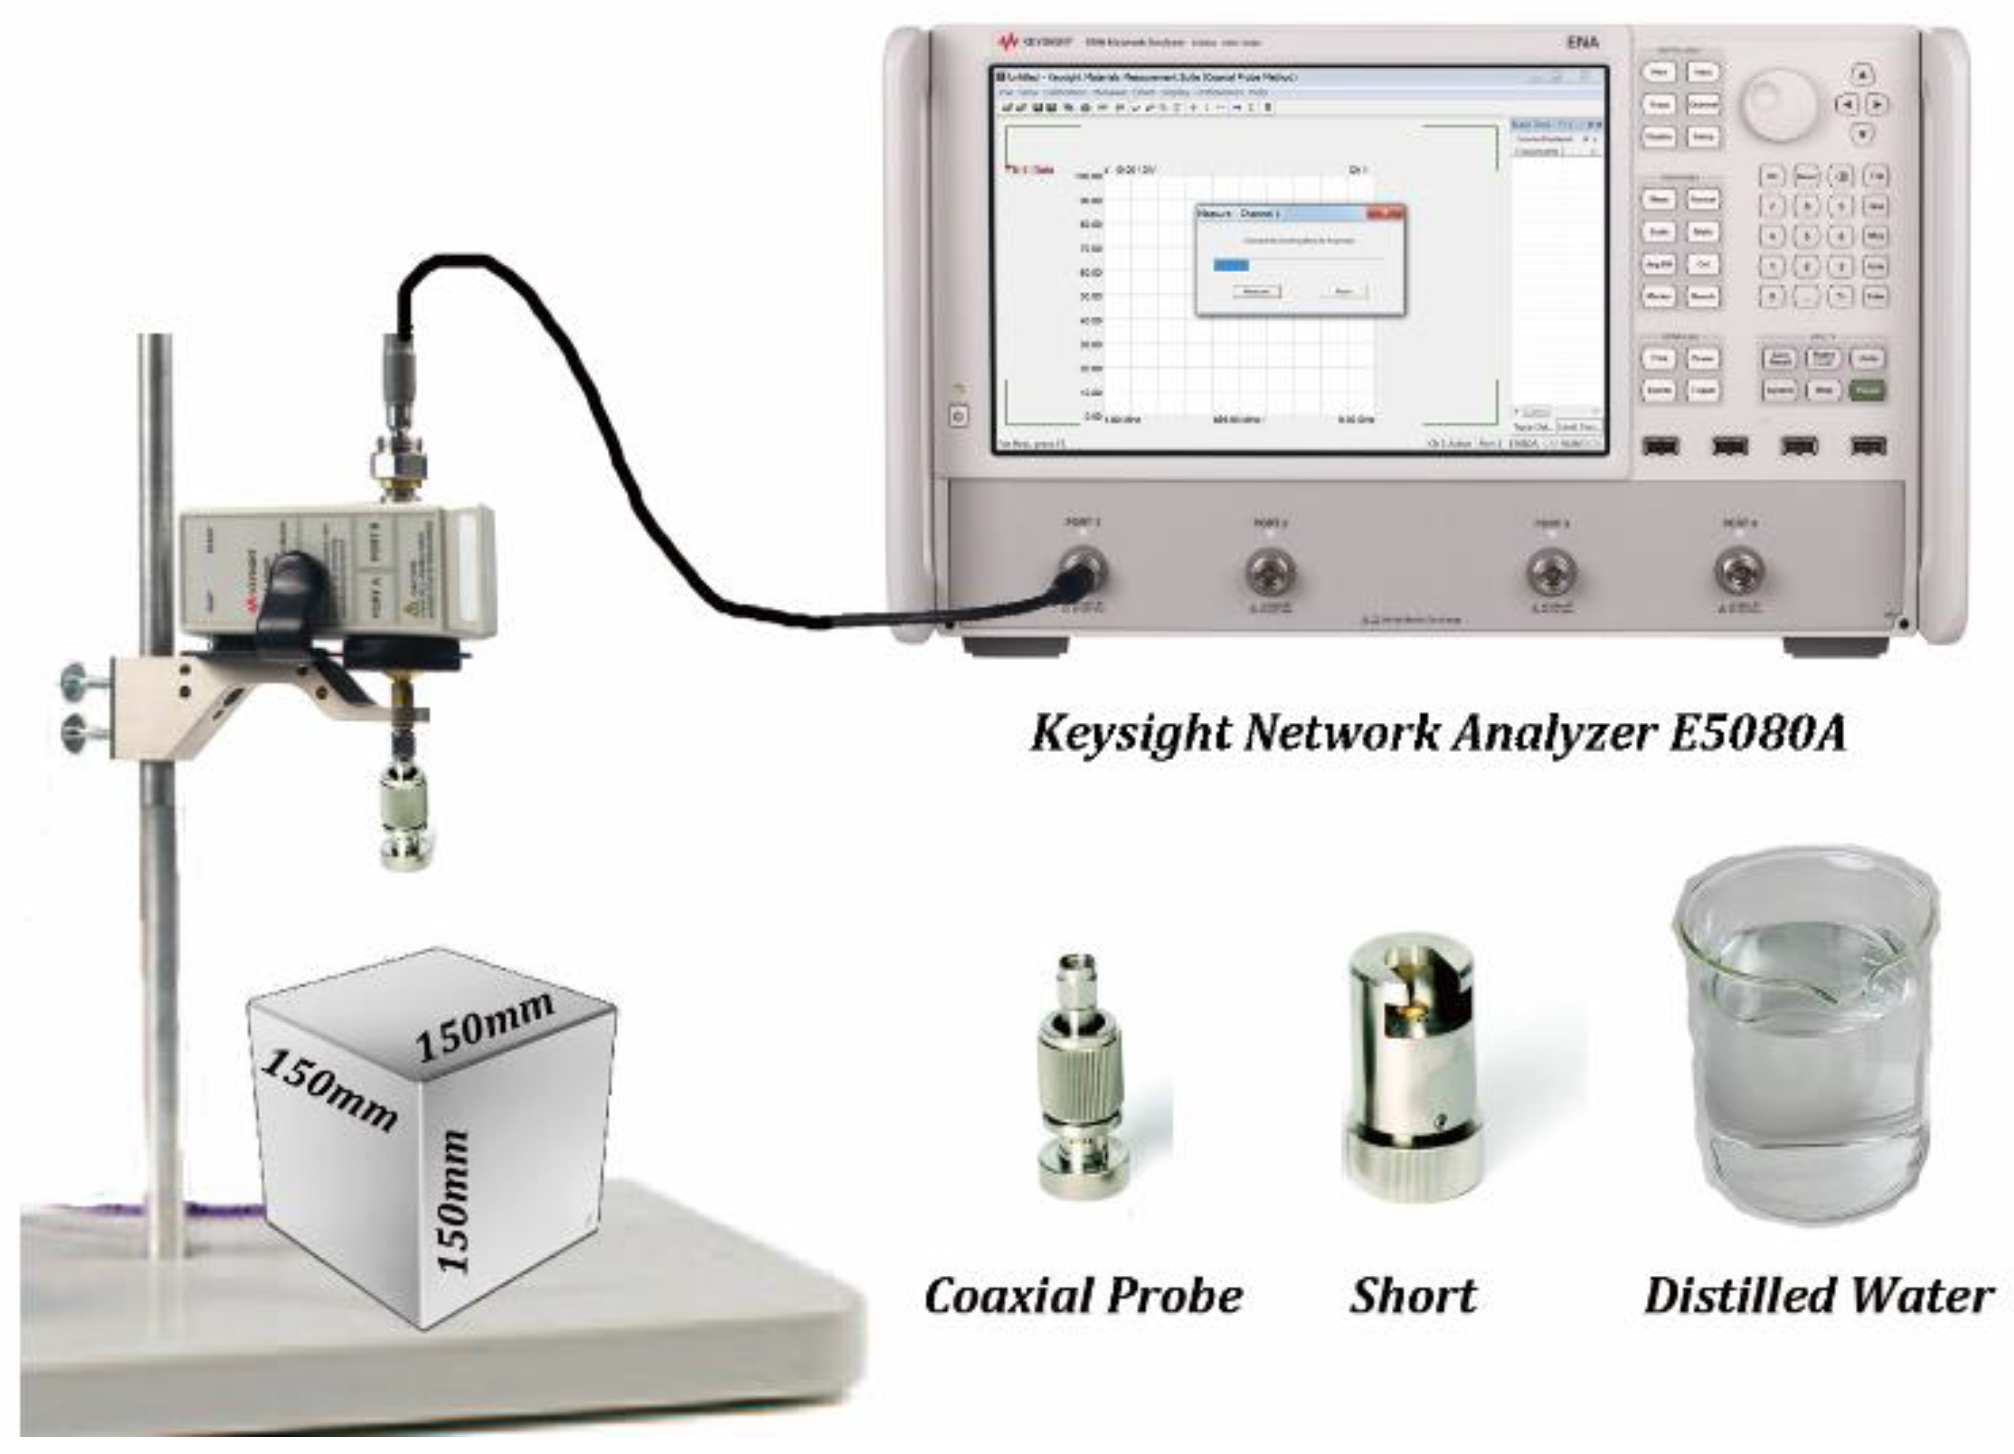
Figure 1 illustrates a big picture of the dual-disciplinary experimental work on the dielectric constant and compressive strength of standard concrete. The objective of this study is to develop a data set of nominal values of the dielectric constant for the GB concrete, in accordance with the Chinese standard JGJ55-2011 [2]. Correlations between the dielectric constants and compressive strengths will be considered. Ordinary concrete is a heterogeneous porous material. When the maximum size of the coarse aggregates (31.5 mm used in this study) are comparable to the signal’s wavelength, extreme heterogeneous dielectric characteristics may arise. Therefore, a signal frequency of 10 GHz is the highest frequency of interest in this study.

2. Materials and Methods

2.1. Design and Fabrication of GB Concrete

In order to study the relationship between the compressive strength and respective dielectric constant of GB concrete, common ordinary GB concrete with a number of different water to cement (w/c) ratios, was investigated. The aim of this research was to study the dielectric behaviors of the ordinary concrete that only contained basic raw materials, namely water, cement, sand, coarse aggregate, and air (in the form of porosity). It is known that the dielectric constant of cementitious materials is influenced by the addition of chemical admixtures, supplementary cementitious materials, or fibers [23,24]. Therefore, as a primary study, no other admixtures, such as superplasticizer or chemical agents, were included in the concrete mix.
Second to water, cement is the crucial, yet non-negligible, constituent for making concrete. The three major standards of internationally-used Portland cement are the American ASTM C159, the Chinese GB175, and the European EN197. In this study, the cement used was the ordinary type of Portland cement P.O. 42.5 that conformed to GB175-2007, and was supplied by Shanshui Cement Group Ltd. The minimum 28-day compressive strength of P.O. 42.5 is 42.5 MPa, which is equivalent to CEM 42.5N when considering the EN197. Medium silica sand was used, with mean and maximum sizes of 1.1 mm and 5.0 mm, respectively, whereas the maximum particle size of the coarse aggregate was 31.5 mm. In both the compressive strength test and dielectric test, relatively small sizes of concrete specimens were used, rather than large concrete structures. Throughout the experimental study, the authors consciously chose the required raw materials, and computed the required quantities in accordance with the design code of the Chinese standard concrete, JGJ55-2011 [2]. In order to maintain the flow-ability of the fresh concrete, the selected concrete unit water content was 205 kg/m3 (mw0), as superplasticizer was not used. Accordingly, the GB concrete specimens (C30, C35, C40, C45, and C50), which had a dimension of 150 mm × 150 mm ×150 mm [3], with respective w/c ratios, were calculated as summarized in Table 1. The accurate amounts of mix proportions were determined by using the volume method, as given by [2]:
m c 0 ρ c + m g 0 ρ g + m s 0 ρ s + m w 0 ρ w + 0.01 α = 1 ,
β s = m s 0 m g 0 + m s 0 × 100 % .
where
  • mc0—cement content per cubic meter of concrete;
  • mg0—coarse aggregate content per cubic meter of concrete;
  • ms0—sand content per cubic meter of concrete;
  • mw0—water content per cubic meter of concrete;
  • ρc—density of cement, 3000 kg/m3, the mid-range suggested by [2];
  • ρg—density of coarse aggregate, 2700 kg/m3;
  • ρs—density of sand, 2650 kg/m3;
  • ρw—density of water, 1000 kg/m3;
  • α—percentage of entrapped air in concrete mix, 1.0;
  • βs—sand rate, determined in accordance with the Chinese standard (GB) [2].
In addition to the proportions of raw materials (Table 1), both the physical and chemical properties of the cement affect the dielectric properties of GB concrete. The chemical composition as a percentage of weight, and the physical properties of the ordinary type of Portland cement P.O. 42.5, were considered, as listed in Table 2 and Table 3, respectively. The slump values recorded for all types of fresh concrete fell in the range of 75–90 mm, which met the requirements of the standard JGJ55-2011 [2]. It is known that a high percentage of entrapped air will likely reduce the concrete’s physical density, thus reducing the compressive strength, but increasing the water permeability. Therefore, all of the cast concrete specimens of each batch were placed onto a vibrating table (Figure 2) for compacting, until no further air bubbles were noticeable, before natural curing. In this study, four specimens per GB concrete type were prepared. Three specimens were used for the 28-day compressive strength test, whereas one specimen was reserved for the purpose of dielectric characterization.
Figure 2a shows the removing of concrete from the anchor concrete mixer, ready for pouring into 150-mm cubic molds, whereas Figure 2b displays the vibration table used for uniform vibration, to rid the specimens of air bubbles. The weight variations of raw materials against the GB concrete type were examined. Table 1 shows that the amount of cement gradually reduces, whereas the sand usage increases with increasing w/c. This, in turn, indicates the reasonable cost increment when using the GB concrete type. After mixing and casting, all of the specimens were demolded after 24-h of natural air curing, and were then moved into a standard curing room (RH = 100%, T = 22 ± 2 °C) for a moist curing period of 28 days.

2.2. Method of Dielectric Constant Measurement

Dielectric properties describe the physical-chemical properties related to the energy storage and energy dissipation of the concrete materials subjected to an external electric field excitation. A complex relative permittivity, which consists of real and imaginary parts (εr− jεr′′), is commonly used to quantitatively and qualitatively define the dielectric characterization of concrete materials [27,28,29,30,31]. The real part of the complex permittivity is also known as the dielectric constant, which indicates the amount of energy stored inside the concrete element.
In this study, we used the dielectric probe measurement method, wherein an open-ended coaxial (OEC) probe was used, to determine the dielectric constant of GB concrete after 28 days of curing. The OEC probe method is one of the most popular techniques for measuring the dielectric properties of cement-based materials [32,33,34,35]. The method has the advantages of being simple, yet maintaining direct-contact, being nondestructive, and having a wide operating bandwidth in the microwave frequency regime. Its well-developed theory makes it possible to obtain sufficiently accurate results for both medium-loss and high-loss media [35,36]. However, the 28-day concrete becomes low-loss dielectric material, and its loss factor (imaginary part of complex permittivity) is known to be small, approaching zero. Unfortunately, these loss values could not be accurately determined by using Keysight’s measurement solutions, particularly at frequencies below 200 MHz [37]. In view of this obstacle, the research scope of this paper is therefore limited to the investigation of the real part of the relative complex permittivity. Hereafter, we simply use the term “dielectric constant” to indicate the real part of the relative complex permittivity (εr′).
During the measurement, a Keysight vector network analyzer (E5080A) was used to measure the reflection coefficient. In order to minimize the measurement errors, air, a metallic short-circuit block, and distilled water were used for the calibration, as shown in Figure 3. A total of 20 randomly selected, non-overlapping positions on four side surfaces, were measured by using the OEC probe. Namely, five measurements took place on each surface while discarding the top and bottom faces, in order to avoid surface roughness. The complex permittivity was automatically computed from the measured reflection coefficient, via the Keysight materials measurement suite (N1500A). The dielectric constant was computed and recorded in the computer-based network analyzer E5080A, which connected with the OEC probe and an electronic calibration-kit through a 1-meter long flexible cable, as illustrated in Figure 3. Throughout the dielectric measurement, the average value, regarded as the dielectric constant, along with the standard deviation of each GB concrete specimen, was taken. The measuring frequency was set in the range of 10 MHz to 6 GHz, which covered the most popular cellular phone and WiFi communication frequencies.

3. Experimental Results

In this section, measurement results of the compressive strength and dielectric constants of GB concrete after 28 days of curing, will be presented and discussed. The real part of the complex relative permittivity, or the dielectric constant of each type of GB concrete, will be modelled by the Jonscher model. The aim of this study is to obtain the value at any frequency from 100 MHz, up to a very high frequency (e.g., 10 GHz). Further, the correlation between the compressive strength and dielectric constant of each GB concrete can be determined at any frequency up to 10 GHz.

3.1. Compressive Strength after 28-Day Curing

In order to obtain the average strength values, three 150-mm cubes were used for the compressive strength tests of the GB concrete: C30, C35, C40, C45, and C50. All concrete specimens were moist-cured in a curing room for 28 days. The compression test was undertaken after the measurements of complex permittivity had been recorded, wherein all surfaces of the concrete specimens were deliberately dried, as the surface moisture will sensitively affect the accuracy of the measured permittivity. Figure 4 shows the average strength of each GB concrete type with the corresponding standard deviation, where the nonlinear relationship between the compressive strength and water-to-cement (w/c) ratio, was observed. From the strength results, all fabricated GB concretes were verified as fulfilling the Chinese standard JGJ55-2011 [2]. The average 28-day compressive strengths grow nonlinearly with decreasing w/c ratios, in a way that follows a 2-term power law, as given by:
f c s ( w / c ) = 1.57 ( w / c ) 2.75 + 30.5
Equation (3) is obtained by the curve fitting of the six measured data, with the essential goodness-of-fit, as shown in Figure 4. One can estimate the compressive strength of the GB concrete using Equation (3), as long as the w/c is given in the range of 0.40 to 0.60.

3.2. Measured Dielectric Constants

Through the measurement using the OEC probe, the average values of the dielectric constant (real-part of relative permittivity) versus the frequency, for all types of GB concrete after 28 days of moist curing, namely, C30, C35, C40, C45, and C50, were manipulated. The measurement was performed under laboratory conditions (T = 23 ± 2 °C, RH = 50% ± 10%). The measured average dielectric constant versus the frequency of all GB concrete, is displayed in Figure 5. It is noted that very interesting and reasonable results were achieved, wherein the average values were obtained in the order of the GB concrete types.

3.3. Dielectric Constant Modelling

In order to characterize the measured dielectric constants of GB concrete, which have a common dispersive nature with increasing frequency, three types of mathematical regression models were considered, and will be discussed in this section.

3.3.1. First-Order Exponential Model

In many natural quantitative problems, the first-order exponential function is recognized to be well-suited for analysing the quantities of decay, when both the initial (K + C) and final (C) values are known. The real-part of the dielectric permittivity (relative dielectric constant) can be described as an exponential function of frequency (f), as given by:
ε r ( f ) = K   e x p ( b f ) + C
where b is a time constant in seconds. As f = 1/b, the first term is exponentially decayed by 36.8%.

3.3.2. Debye Model

The 28-day concrete is basically a low-loss heterogeneous dielectric material. Peter J. W. Debye postulated that dielectric excitation and relaxation responds according to the relaxation mode [38]. The following expressions describe the relaxation phenomenon which occurred in the concrete dielectrics [39]:
ε r ( f ) = ε s t a t i c ε 1 + ( 2 π f τ ) 2 + ε
ε r ( f ) = ( ε s t a t i c ε ) 1 + ( 2 π f τ ) 2 2 π f τ
where εstatic and ε are limiting values at very low and very high frequencies, respectively; τ is the relaxation time in seconds.

3.3.3. Jonscher Model

The Jonscher model uses complex electric susceptibility (χe) to describe the sum of various susceptibilities related to polarizations responding to an applied electric field. A real part of the relative effective permittivity at the very high frequency (ε), was used to describe the limiting low value of the dielectric constant, whereas the complex permittivity holds a format of εr′ − r′′, as given by [40,41]:
ε r ( f ) = χ r ( f f r ) n 1 + ε
ε r ( f ) = χ r ( f f r ) n 1 cot ( n π 2 )
where
  • n is an empirical parameter in the range of 0 to 1 for modelling the dielectric loss;
  • χr is the real part of χe;
  • fr is an arbitrarily chosen reference frequency. In this study, we picked fr = 0.1 GHz.
The three dielectric constant regression models all involve three fitting parameters, respectively, as expressed in Equations (4)–(8). Although the exponential model only gives a real-part description, its frequency response is found to be very similar to that from the Debye model. Figure 6 shows curve fitting of the three models, in both the linear- and log-frequency scale. The use of the log-scale gives a clear insight into the regressions at low frequencies, whereas the linear scale plots provide the fit conditions at high frequencies, viz., 2 to 6 GHz. While dielectric permittivity models were only available in the literature up to 1 or 2 GHz, e.g., [29,41], the dielectric dispersion of concrete at higher frequencies is therefore the focus in this study. This is owing to the current popularity of wireless communication signals, such as the 4G cellular phone signals and the indoor WiFi signals, whose penetration abilities through concrete walls very much depend on the dielectric properties. From Figure 6b, it is observed that, in general, the Jonscher model provides the best fit to the measured data in all cases, when compared to the other models, whereas the Debye model identifies the same trends of decay as the exponential model. By comparing expressions (4) and (5), one can express the relation of the time constant (b) in terms of the relaxtion time (τ), as shown below.
With C equals ε (see Table 4 and Table 5):
K e f b = Δ ε 1 + ( 2 π f τ ) 2   ,
b 2 f l n ( 2 π f τ ) 1 f l n ( Δ ε K )   f o r   ( 2 π f τ ) 2 1
An interesting finding has been observed, where the limiting values of the dielectric constant increase in order with the GB concrete types. The mathematical relations of the dielectric constant, compressive strength, and initial water contents of GB concrete, will be further examined and discussed in the next section. All regression coefficients (with 95% confidence bounds) and goodness-of-fits of the three models are summarized in Table 4, Table 5 and Table 6, respectively. The goodness-of-fit was obtained by using the curve-fitting tools in MATLAB, which are represented by the sum of squares due to error (SSE) and the R-square (R2) [42]. These two indications are interrelated, and are sufficient to validate the regression model by using any values between 0 and 1. When R2 = 1 and SSE = 0, the proposed regression model is indicated as a perfect fit for the observation data.
Based on the values of the goodness-of-fit listed in Table 4, Table 5 and Table 6, the authors can justifiably state that the Jonscher model outperforms the other models for the whole frequency range of 0.1 to 6 GHz. This corroborates the previous finding reported in [40,41]. Therefore, one can use the dielectric constant values obtained from the Jonscher model for further correlation with compressive strength and GB concrete. The ultimate goal is to establish tracking variables for the purpose of civil structural health monitoring.

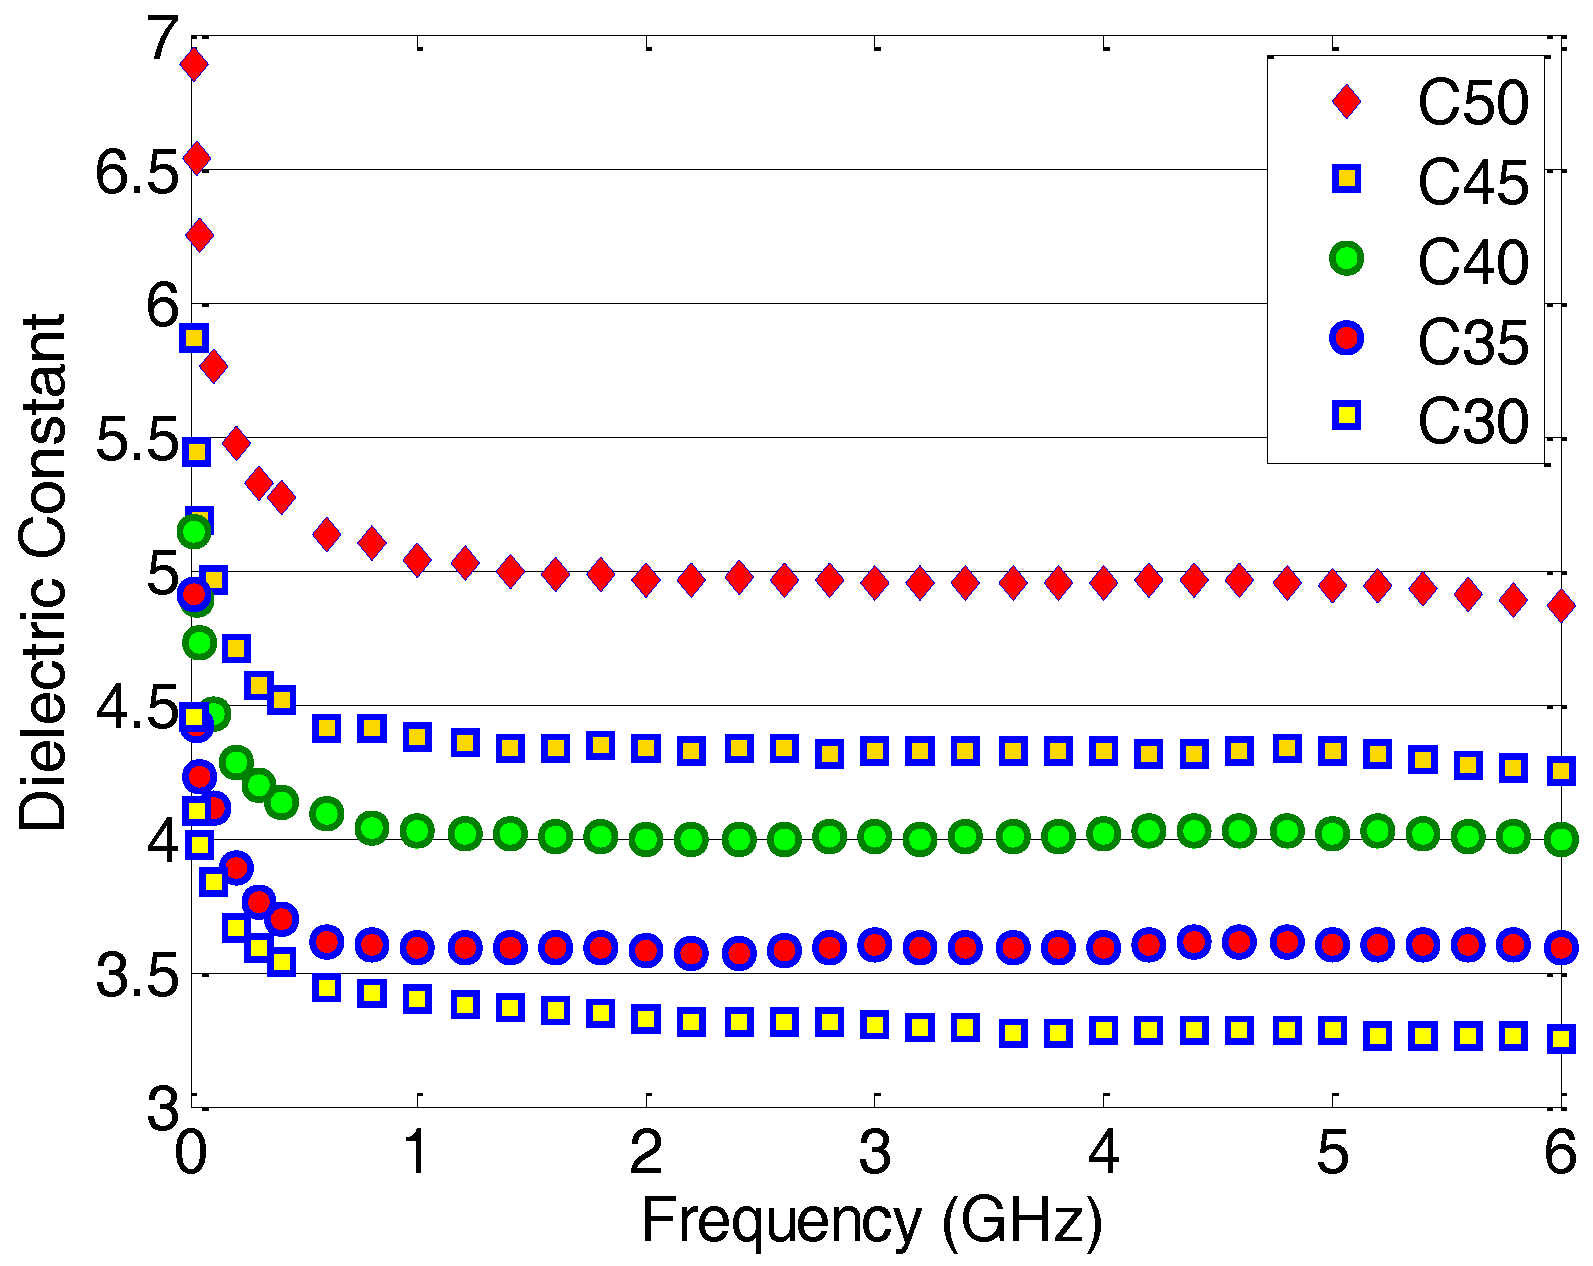
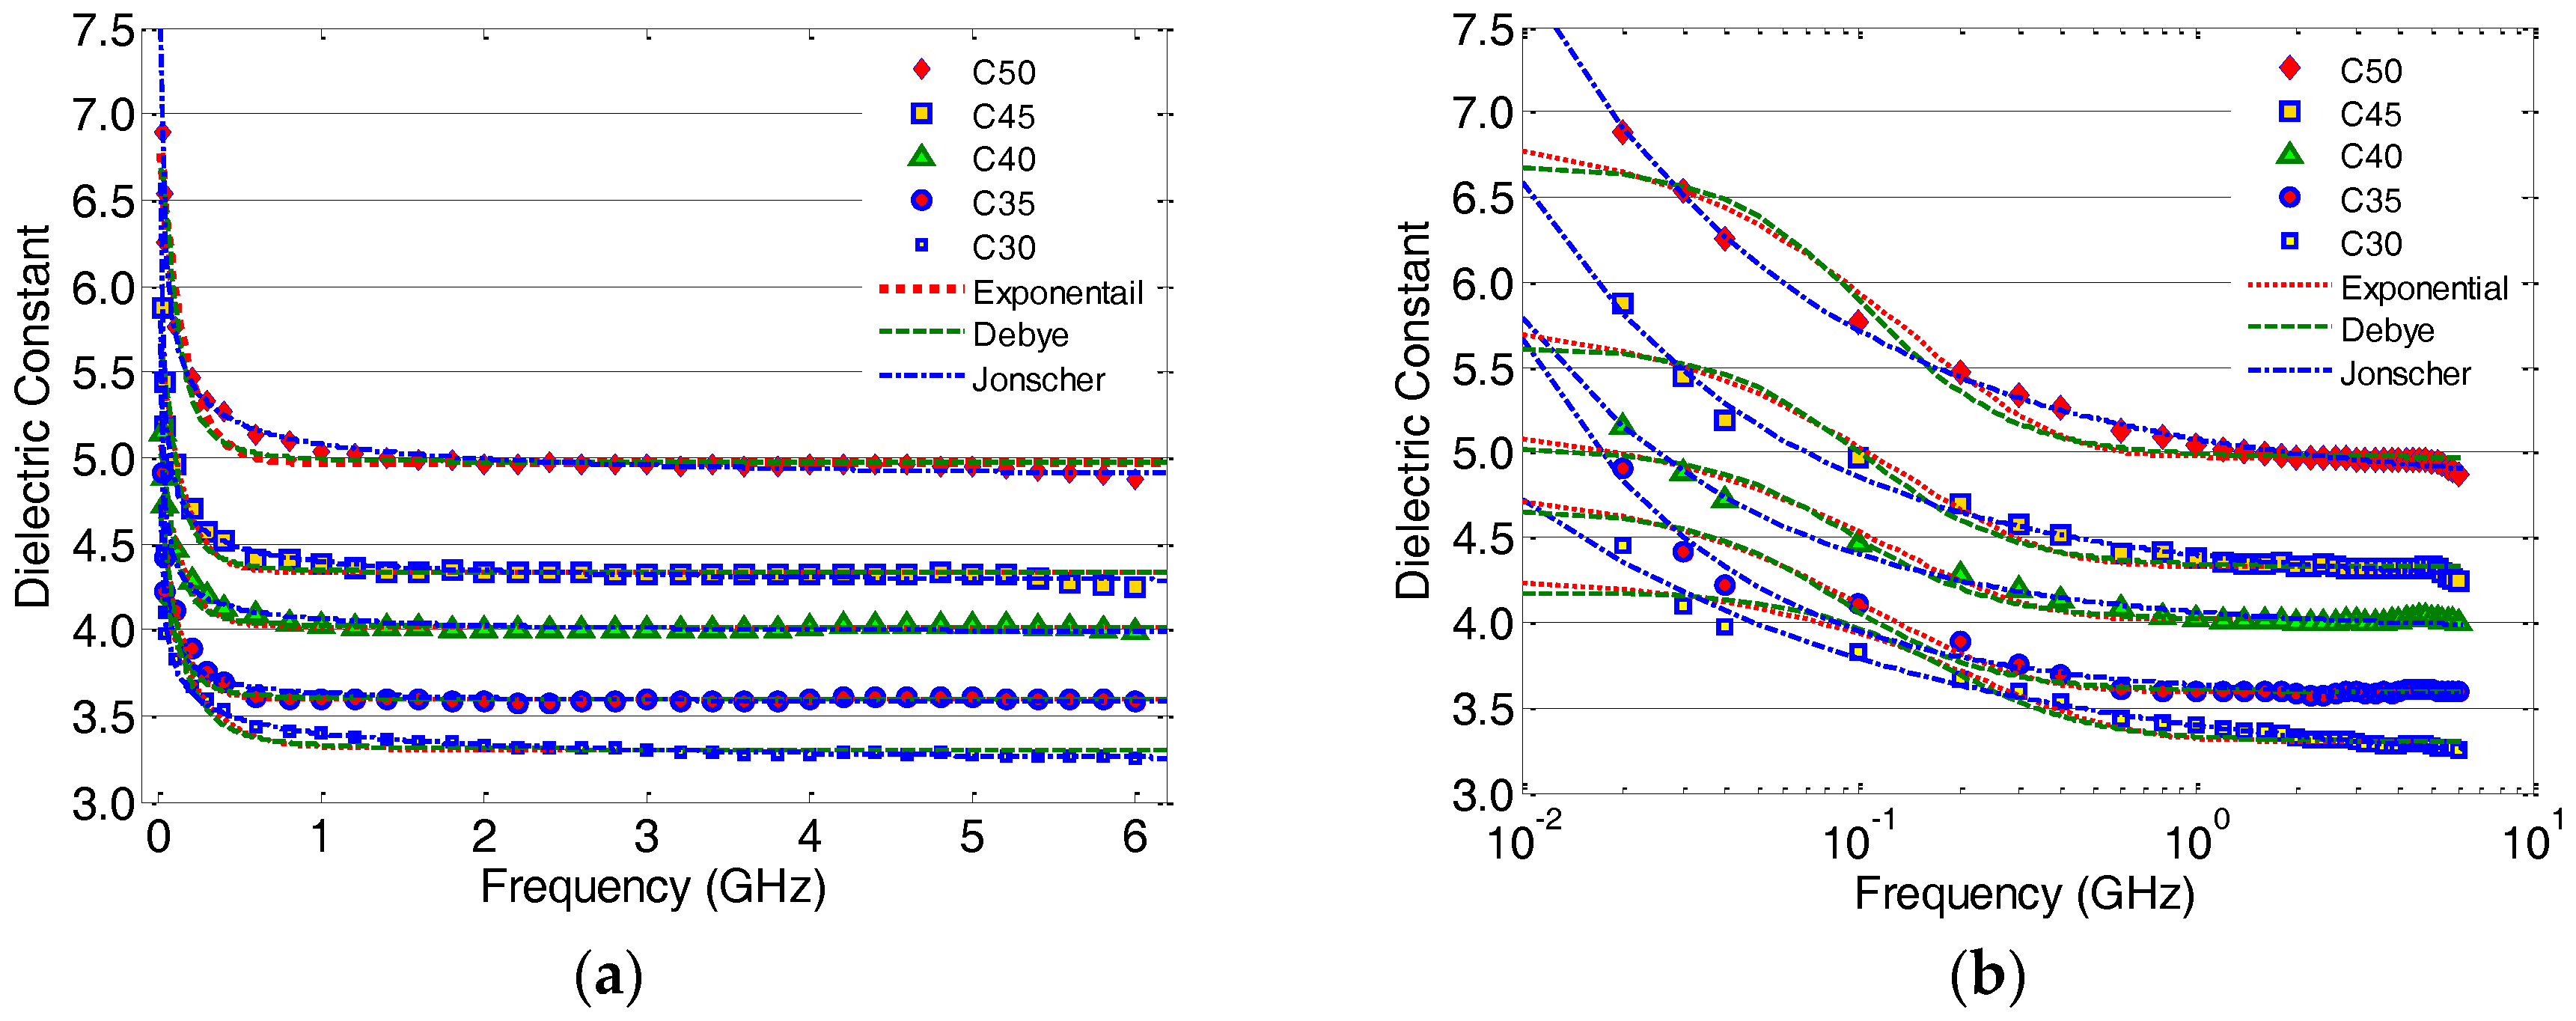
4. Correlation between Compressive Strength and Dielectric Constant

Using the results of the Jonscher model of GB concrete, the dielectric constant values at 0.5 GHz, 2.45 GHz, 5.0 GHz, and 10 GHz were computed and compared, as summarized in Table 7. It is known that the compressive strength of concrete is a decreasing function of increasing w/c, whereas the dielectric constant is a function of frequency and the initial values of w/c. Therefore, the computed dielectric constant at various frequencies can be further described by a double power law, as a function of w/c and f, given by:
ε r ( w c , f ) = ( w c ) p + ( f ) q
where p and q are the regression coefficients for the w/c and f, respectively.
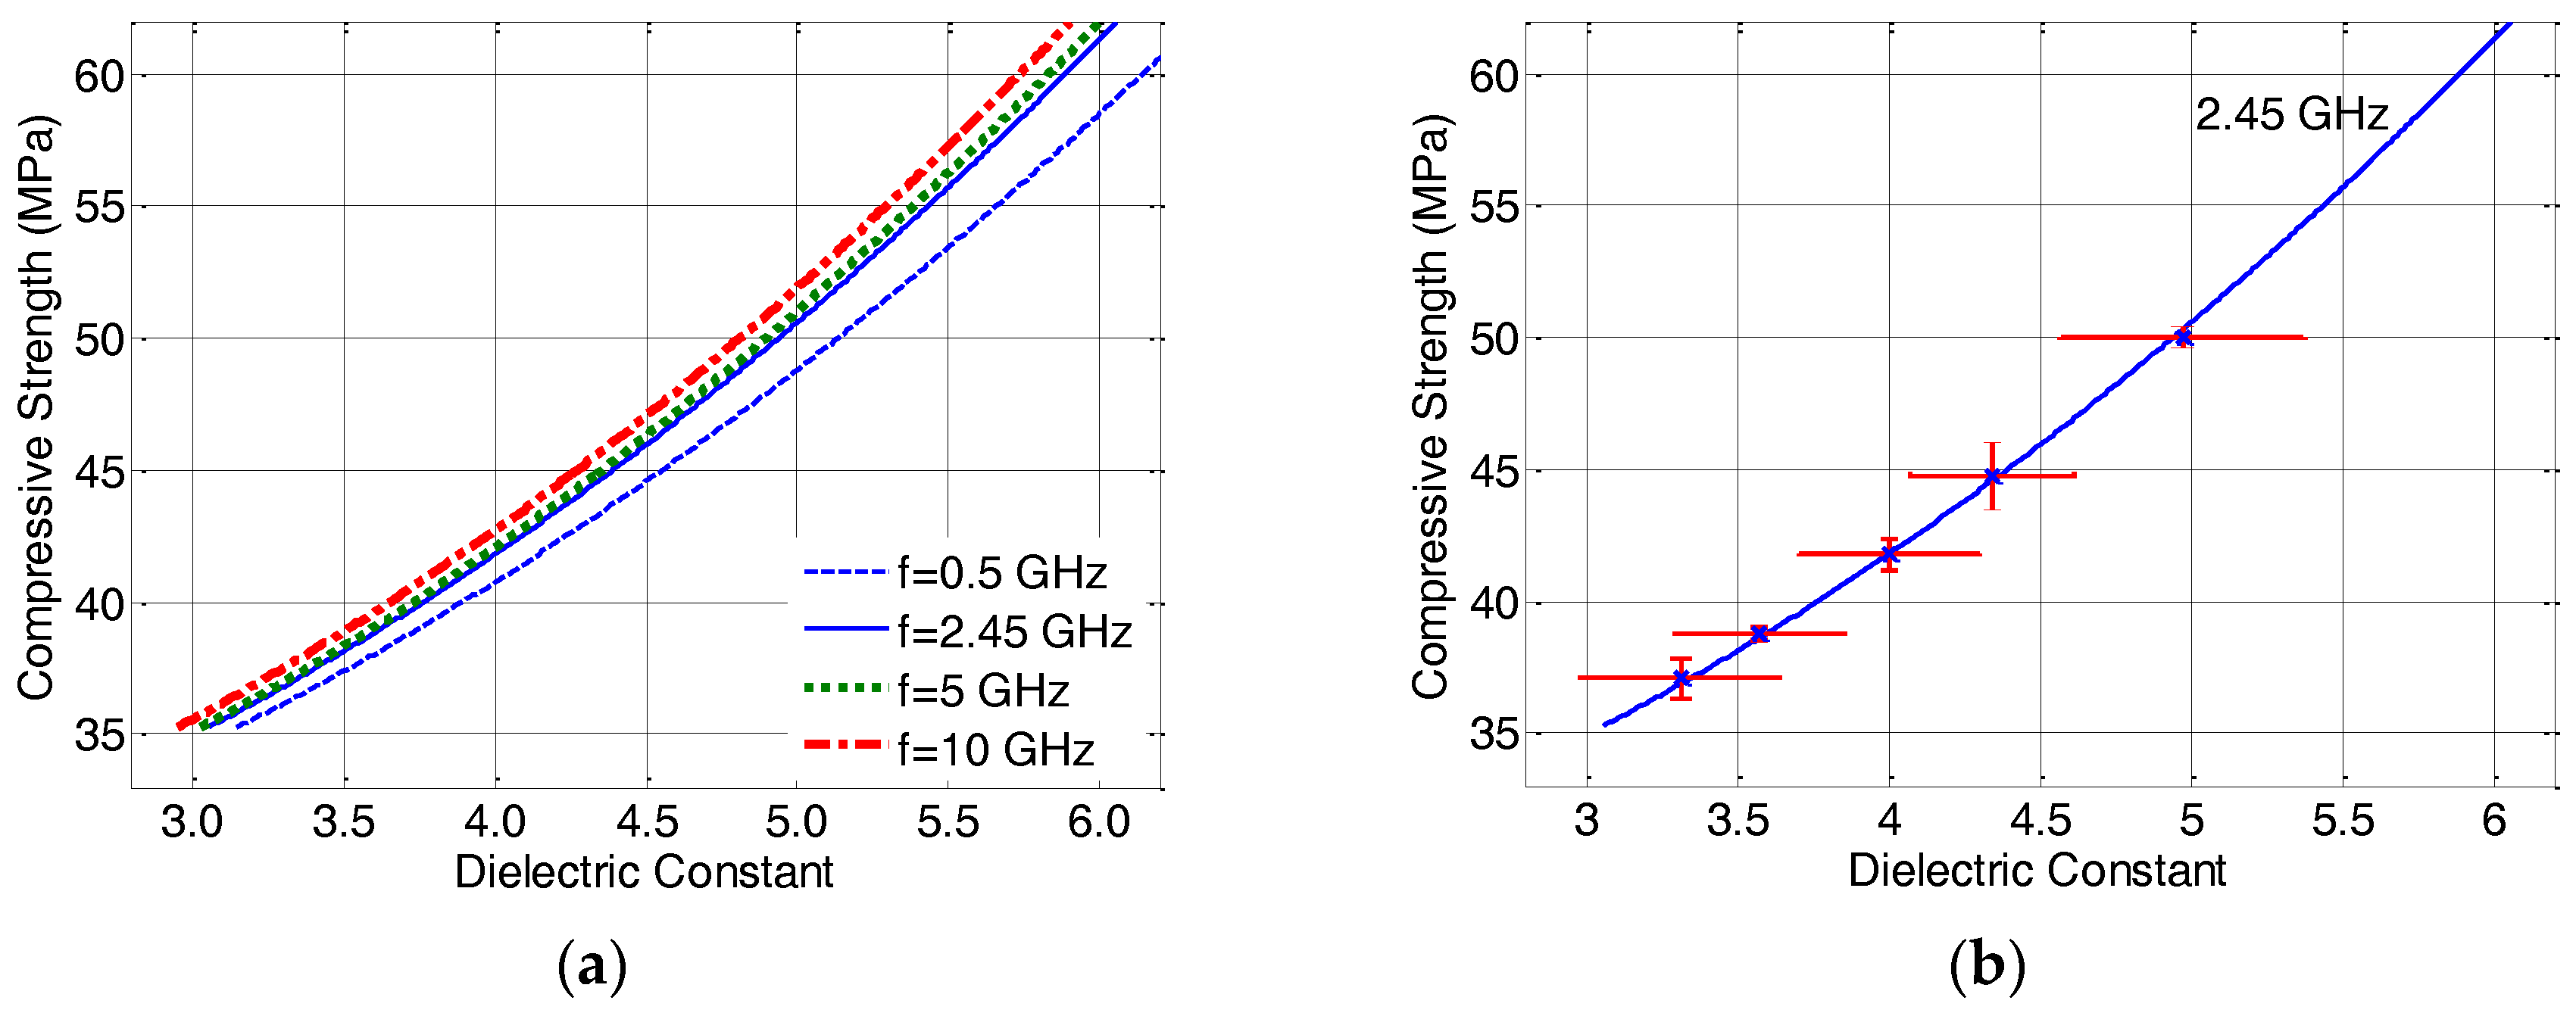
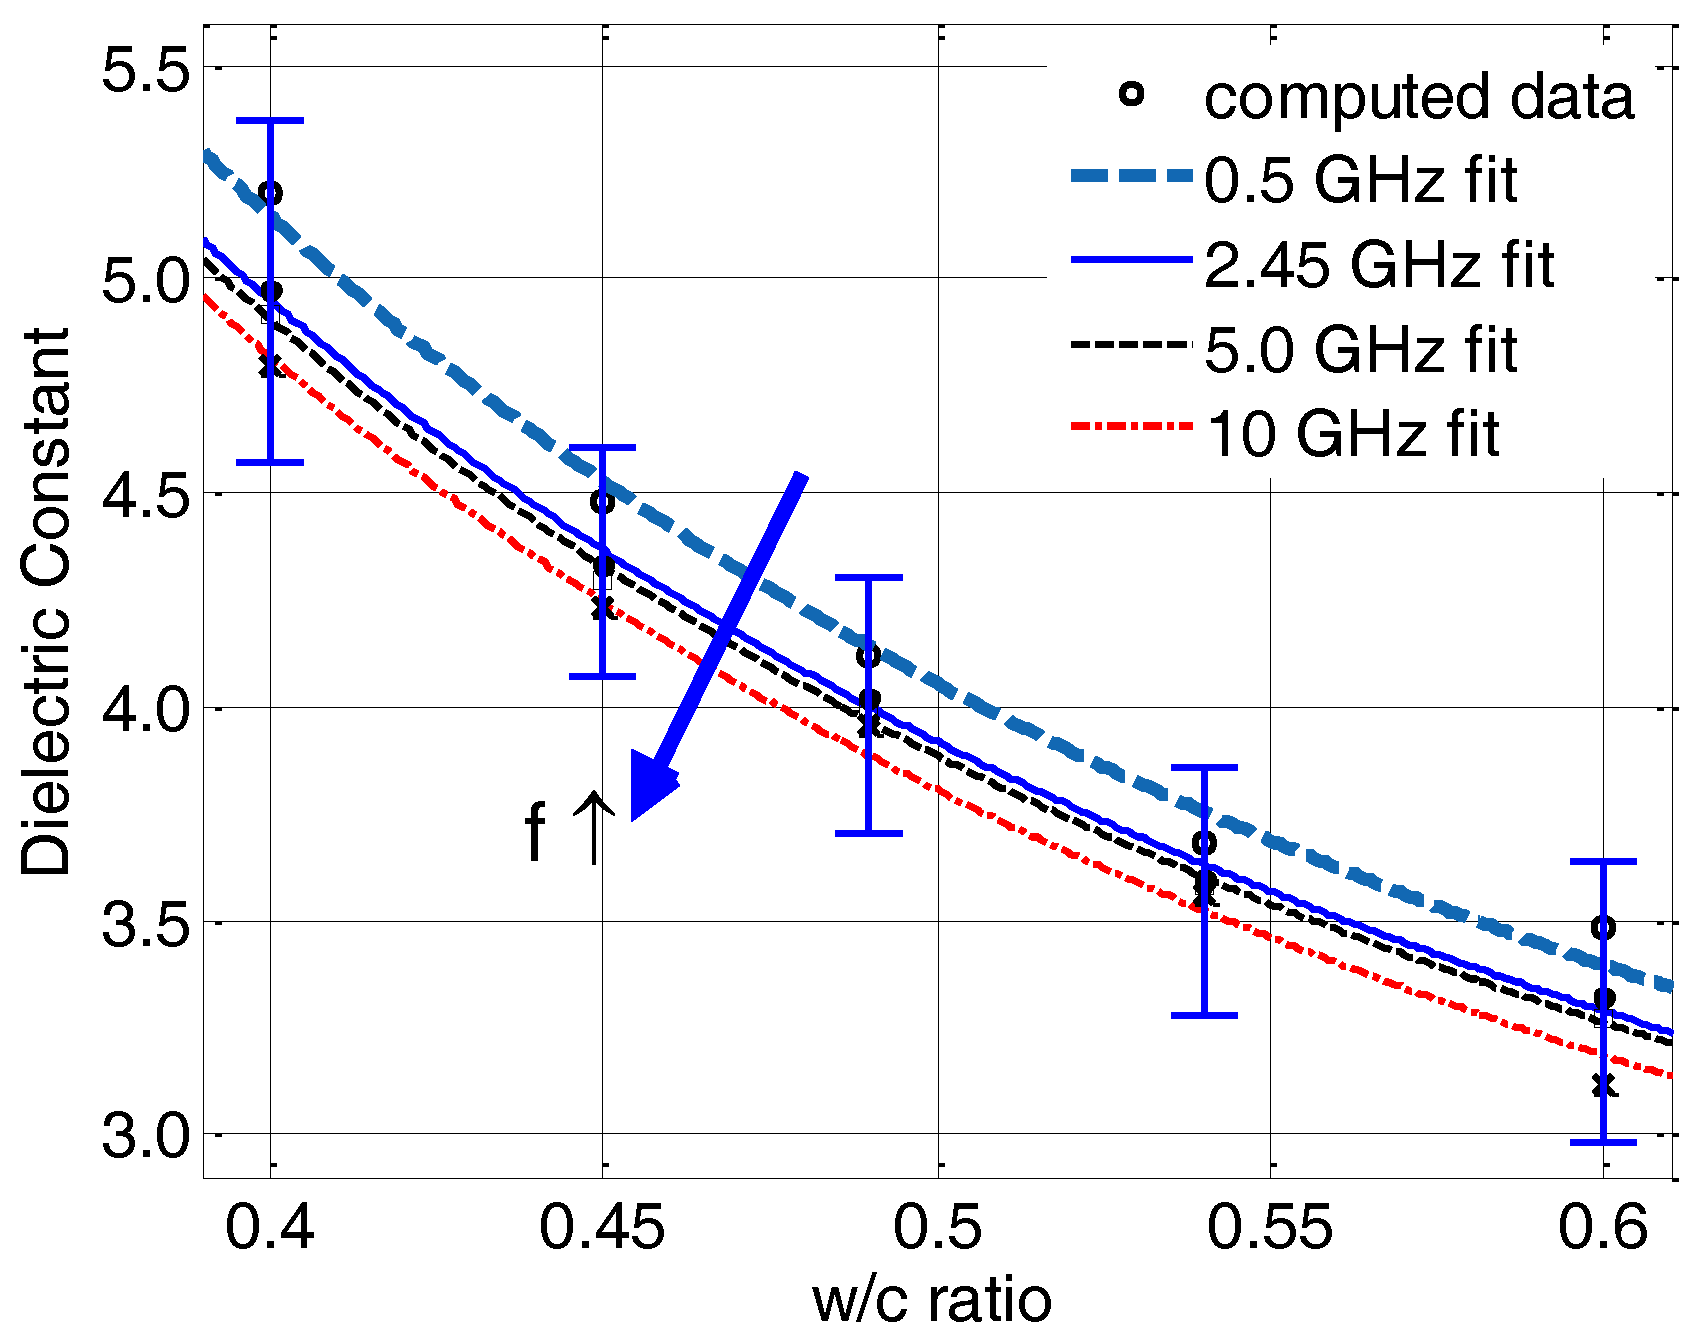
Figure 7 shows the regression curves of the computed dielectric constant versus the water-to-cement ratio, whereas the regression coefficients and the goodness-of-fits are listed in Table 8. As can be seen, all curves are virtually consistent, presenting decreasing trends with an increasing w/c ratio. A small dispersion with a frequency increasing beyond 0.5 GHz is observed. It is worth noting that, apart from the limiting case of 0.5 GHz, the difference between the pair of power curves, e.g., 2.45 GHz and 5.0 GHz, is sufficiently small, particularly within the standard deviations of the measured data at 2.45 GHz. Therefore, the frequency dispersion has a minimal effect on the computed values of the dielectric constant, as shown in Figure 7.
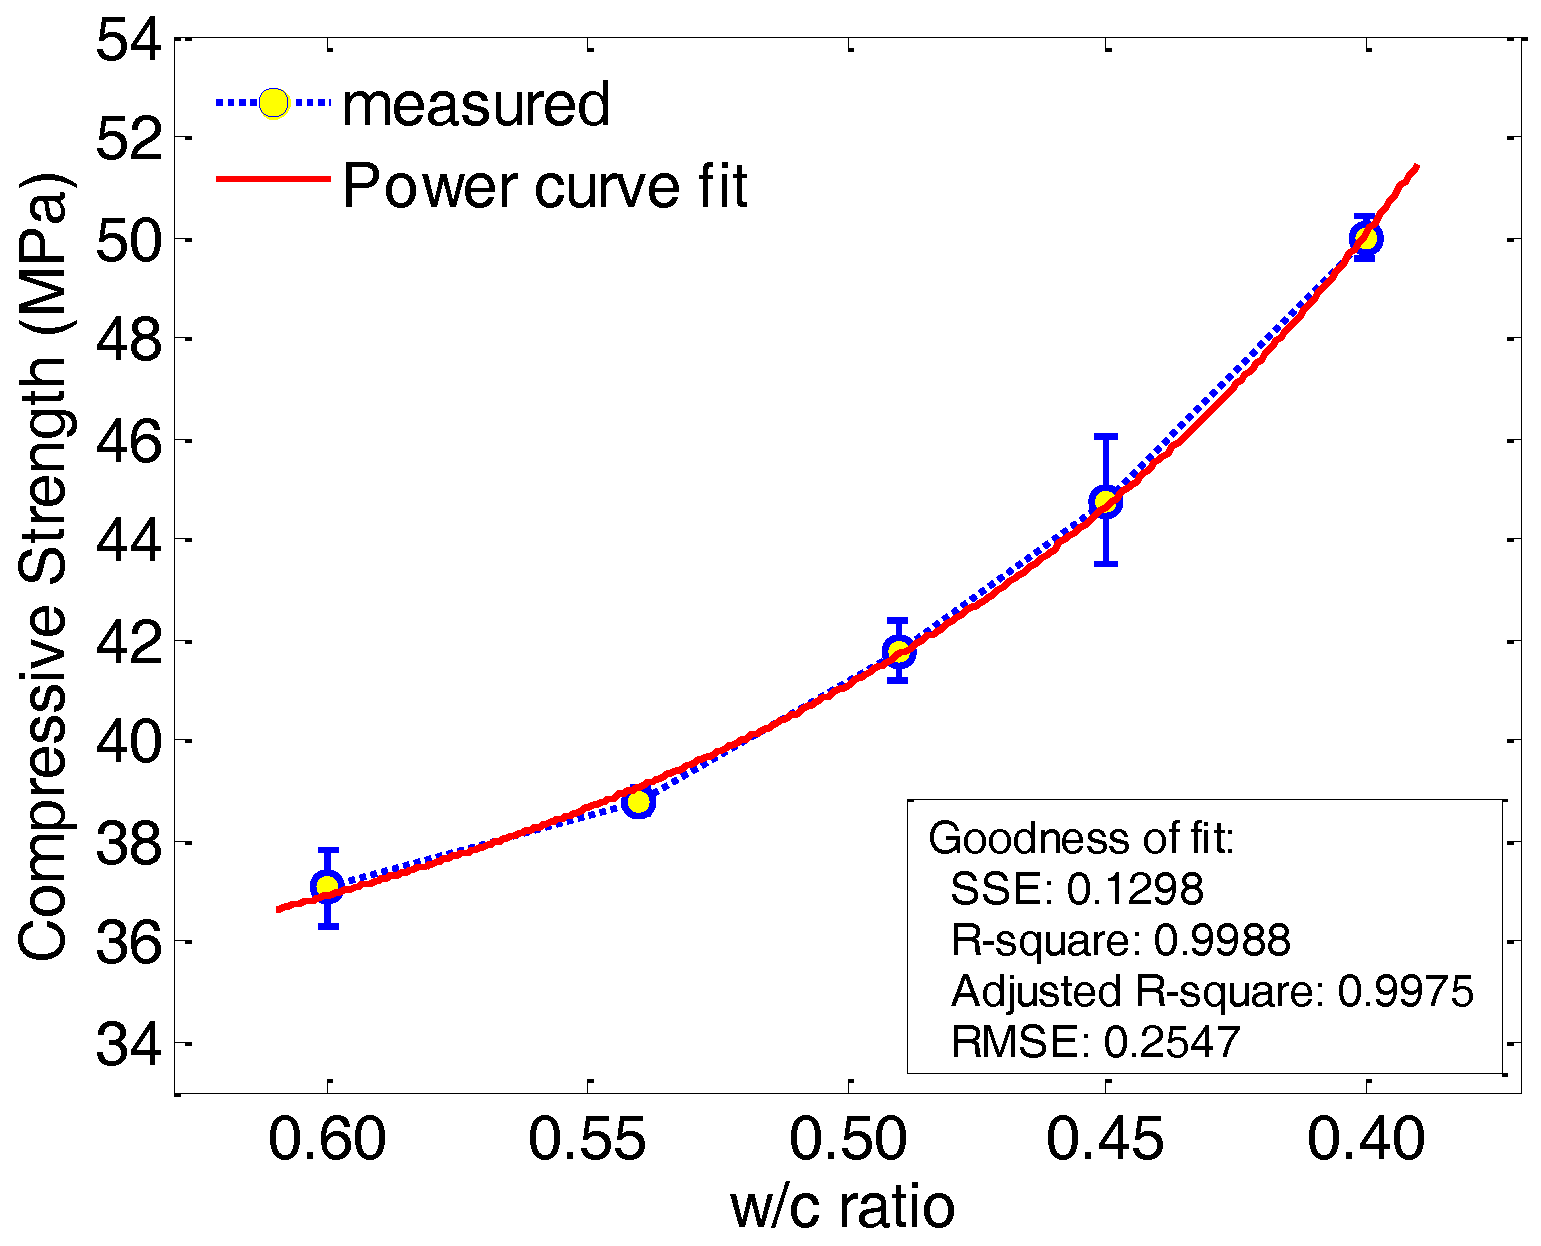
By combining Equations (3) and (11), one can establish the correlation between the compressive strength and the dielectric constant of GB concrete, via the common variable of w/c, as given by:
f c s ( ε r ,   f ) = ( ε r ) r + A ,
where r and A are the regression coefficients, whose values and the goodness-of-fits are summarized in Table 9.
Figure 8a shows the correlations between the compressive strength and dielectric constant of GB concrete, at various frequencies. The correlation has been described by the power law function expressed in (12). By further considering the standard deviations of both of the measured data, Figure 8b illustrates the correlation at a frequency of 2.45 GHz. It is noteworthy to describe that the frequency dispersion has a minimal effect on the dielectric constants, where the discrepancies are far less than the standard deviations from the measurement. The relatively high standard deviation from the dielectric constant is attributed to the high heterogeneity of the GB concrete, where the maximum size of the coarse aggregates used in the fabrication was 31.5 mm.

5. Conclusions

This paper presents the dielectric characterization of GB concrete, using three permittivity models. Namely, the first-order exponential model, the Debye model, and the Jonscher model were used to characterize the measured dielectric constants. The five common types of GB concrete, C30, C35, C40, C45, and C50, were fabricated in accordance with the Chinese standard JGJ55-2011, whereas their measured compressive strengths were analyzed against the water-to-cement ratio. The purpose of this study was to develop an innovative model for the correlation between the compressive strength and the dielectric constant of the standard GB concrete. The ultimate goal was to establish a model of dielectric constants for future SHM of concrete structures. The following remarkable findings can be drawn within the scope of this study:
  • The measured dielectric constant of 28-day concrete is best regressed and predicted by using the Jonscher model, rather than the other selected models, whereas the first-order exponential model and Debye model have a similar and equivalent performance.
  • The modeled dielectric constant of 28-day concrete decreases with increasing w/c. The nonlinear variation can be described by using a double power-law function.
  • The compressive strength of 28-day concrete increases with an increasing average dielectric constant in a power-law function. This correlation model shows that the compressive strength of concrete will decrease, due to the reduction of the dielectric constant of concrete structures. For instance, cracks occurring inside the concrete structure.
  • The presented results will be very useful for the future design of concrete-embedded antennas [43,44] and wireless power transfer to embedded sensors [45]. Nevertheless, further investigation into the imaginary part of complex permittivity, namely the loss factor of concrete, which has a different initial water content, is one of the immediate research works.

Acknowledgments

The research is supported by the National Natural Science Foundation of China (Project No. 51678322 and 51650110509), and the Taishan Scholar Priority Discipline Talent Group program, funded by the Shan Dong Province.

Author Contributions

Kwok Chung, Li Sun and Chunwei Zhang initiated and designed the methodology; Lei Yuan and Songtao Ji performed the experiments; Kwok Chung and Lei Yuan analyzed the measurement data; Chengping Qu and Chunwei Zhang contributed reagents/materials/analysis tools; Kwok Chung, Lei Yuan and Songtao Ji drafted the paper; Li Sun and Chunwei Zhang revised the manuscript.

Conflicts of Interest

The authors declare no conflict of interest.

References

  1. Ju, L. CCPA: China’s Production of Commodity Concrete in 2015. Available online: http://www.ccpa.com.cn/ccpa/content/1095-8319967782405.html (accessed on 22 December 2016).
  2. Ding, W.; Leng, F.G. Specification for Mix Proportion Design of Ordinary Concrete (JGJ55-2011), 1st ed.; China Building Industry Press: Beijing, China, 2011; pp. 6–10. [Google Scholar]
  3. Rong, J.M.; Lu, J.W. Shape and Tolerances of Test Specimens. Standard for Test Methods of Mechanical Properties of Ordinary Concrete GB/T 50081-2002; China Building Industry Press: Beijing, China, 2003; pp. 3–5. [Google Scholar]
  4. Testing Concrete. Recommendations for the Assessment of Concrete Strength by Near-To-Surface Tests; BS 1881-207:1992; British Standards Institution (BSI): London, UK, 1992.
  5. Standard Test Method for Pull-Off Strength of Coatings Using Portable Adhesion Testers; ASTM D 4541-109e1; ASTM International Press: West Conshohocken, PA, USA, 2002.
  6. Standard Practice for Estimating Concrete Strength by the Maturity Method; ASTM C 1074-11; ASTM International Press: West Conshohocken, PA, USA, 2004.
  7. Song, G.; Gu, H.; Mo, Y.L.; Hsu, T.T.C.; Dhonde, H. Concrete structural health monitoring using embedded piezoceramic transducers. Smart Mater. Struct. 2007, 16, 959–968. [Google Scholar] [CrossRef]
  8. Lim, Y.Y.; Kwong, K.Z.; Liew, W.Y.H.; Soh, C.K. Non-destructive concrete strength evaluation using smart piezoelectric transducer—A comparative study. Smart Mater. Struct. 2016, 25, 085021. [Google Scholar] [CrossRef]
  9. Kong, Q.; Feng, Q.; Song, G. Water presence detection in a concrete crack using smart aggregates. Int. J. Smart Nano Mater. 2015, 6, 149–161. [Google Scholar] [CrossRef]
  10. Kong, Q.; Robert, R.H. Cyclic crack monitoring of a reinforced concrete column under simulated pseudo-dynamic loading using piezoceramic-based smart aggregates. Appl. Sci. 2016, 6, 341. [Google Scholar] [CrossRef]
  11. Chung, D.D.L. Structural health monitoring by electrical resistance measurement. Smart Mater. Struct. 2001, 10, 624–636. [Google Scholar] [CrossRef]
  12. Ferreira, R.M.; Jalali, S. NDT measurements for the prediction of 28-day compressive strength. NDT & E Int. 2010, 43, 55–61. [Google Scholar]
  13. Xiao, L.; Li, Z. Early-age hydration of fresh concrete monitored by non-contact electrical resistivity measurement. Cem. Concr. Res. 2008, 38, 312–319. [Google Scholar] [CrossRef]
  14. Wei, X.; Xiao, L.; Li, Z. Prediction of standard compressive strength of cement by the electrical resistivity measurement. Constr. Build. Mater. 2012, 31, 341–346. [Google Scholar] [CrossRef]
  15. Chang, C.; Song, G.; Gao, D.; Mo, Y.L. Temperature and mixing effects on electrical resistivity of carbon fiber enhanced concrete. Smart Mater. Struct. 2013, 22, 035021. [Google Scholar] [CrossRef]
  16. Chung, K.L.; Luo, J.L.; Yuan, L.; Zhang, C.; Qu, C. Strength correlation and prediction of engineered cementitious composites with microwave properties. Appl. Sci. 2016, 6, 448. [Google Scholar] [CrossRef]
  17. Siu, S.; Ji, Q.; Wu, W.; Song, G.; Ding, Z. Stress wave communication in concrete: I. Characterization of a smart aggregate based concrete channel. Smart Mater. Struct. 2014, 23, 125030. [Google Scholar] [CrossRef]
  18. Siu, S.; Qing, J.; Wang, K.; Song, G.; Ding, Z. Stress wave communication in concrete: II. Evaluation of low voltage concrete stress wave communications utilizing spectrally efficient modulation schemes with PZT transducers. Smart Mater. Struct. 2014, 23, 125031. [Google Scholar] [CrossRef]
  19. Rizzo, P.; Nasrollahi, A.; Deng, W.; Vandenbossche, J.M. Detecting the presence of high water-to-cement ratio in concrete surfaces using highly nonlinear solitary waves. Appl. Sci. 2016, 6, 104–119. [Google Scholar] [CrossRef]
  20. Zoughi, R.; Gray, S.D.; Nowak, P.S. Microwave nondestructive estimation of cement paste compressive strength. ACI Mater. J. 1995, 92, 64–70. [Google Scholar]
  21. Sumitro, S.; Hida, K.; Le Diouron, T. Structural Health Monitoring Paradigm for Concrete Structures. Available online: www.cipremier.com/e107_files/downloads/Papers/100/28/100028059.pdf (accessed on 25 December 2016).
  22. Lim, M.L.; Cao, H. Combining multiple NDT methods to improve testing effectiveness. Constr. Build. Mater. 2013, 38, 1310–1315. [Google Scholar] [CrossRef]
  23. Wen, S.; Chung, D.D.L. Effect of admixtures on the dielectric constant of cement paste. Cem. Concr. Res. 2001, 31, 673–677. [Google Scholar] [CrossRef]
  24. Keddam, M.; Takenouti, H.; Novoa, X.R.; Takenouti, H. Study of the dielectric characteristics of cement paste. Cem. Concr. Res. 1997, 27, 15–28. [Google Scholar]
  25. Kwon, S.J.; Maria, Q.F.; Park, T.W.; Na, U.J. An experimental study on evaluation of compressive strength in cement mortar using averaged electromagnetic properties. Int. J. Concr. Struct. Mater. 2009, 3, 25–32. [Google Scholar] [CrossRef]
  26. Zhong, Y.H.; Zhang, B.; Shi, W.; Wang, T. Experimental research on relationships between dielectric constant of cement concrete materials and measuring frequency. In Proceedings of the 2012 14th International Conference on Ground Penetrating Radar (GPR), Shanghai, China, 4–8 June 2012; IEEE: Piscataway, NJ, USA, 2012. [Google Scholar]
  27. Rhim, H.C.; Buyukozturk, O. Electromagnetic properties of Concrete at microwave frequency range. ACI Mater. J. 1998, 95, 262–271. [Google Scholar]
  28. Robert, A. Dielectric permittivity of concrete between 50 MHz and 1 GHz and GPR measurements for building materials evaluation. Appl. Geophys. 1998, 40, 89–94. [Google Scholar] [CrossRef]
  29. Soutsos, M.N.; Bungey, J.H.; Millard, S.G.; Shaw, M.R.; Patterson, A. Dielectric properties of concrete and their influence on radar testing. NDT & E Int. 2001, 34, 419–425. [Google Scholar]
  30. Meng, M.L.; Wang, F.M. Theoretical analyses and experimental research on cement concrete dielectric model. Mater. Civ. Eng. 2013, 25, 1959–1963. [Google Scholar] [CrossRef]
  31. AI-Qadi, I.L. Dielectric properties of Portland cement concrete at low radio frequencies. Mater. Civ. Eng. 1995, 7, 192–198. [Google Scholar] [CrossRef]
  32. Mirotznik, M.; Foster, K.R. Noninvasive electrical characterization of materials at microwave frequencies using an open-ended coaxial line: Test of an improved calibration technique. IEEE Trans. Microw. Theory Tech. 1990, 38, 8–14. [Google Scholar]
  33. Nyshadham, A.; Sibbald, C.L.; Stuchly, S.S. Permittivity measurements using open-ended sensors and reference liquid calibration-An uncertainty analysis. IEEE Trans. Microw. Theory Tech. 1992, 40, 305–313. [Google Scholar] [CrossRef]
  34. Bilal, F.; Boone, F. Design and calibration of a large open-ended coaxial probe for the measurement of the dielectric properties of concrete. IEEE Trans. Microw. Theory Tech. 2008, 56, 2322–2328. [Google Scholar]
  35. Piladaeng, N.; Angkawisittpan, N.; Homwuttiwong, S. Determination of relationship between dielectric properties, compressive strength, and age of concrete with rice husk ash using planar coaxial probe. Meas. Sci. Rev. 2016, 16, 14–20. [Google Scholar]
  36. Keysight Corp. Basics of Measuring the Dielectric Properties of Materials; Keysight Technologies: Santa Rosa, CA, USA, 2015. [Google Scholar]
  37. Keysight Corp. N1501A Dielectric Probe Kit 10 MHz to 50 GHz Technical Overview; Keysight Technologies: Santa Rosa, CA, USA, 2015; Volume 11, pp. 4–5. [Google Scholar]
  38. McConnell, J. Rotational Brownian Motion and Dielectric Theory; Academic Press: New York, NY, USA, 1980. [Google Scholar]
  39. Sandrolini, L.; Reggiani, U.; Ogunsola, A. Modelling the electrical properties of concrete for shielding effectiveness prediction. Phys. D Appl. Phys. 2007, 40, 5366–5372. [Google Scholar] [CrossRef]
  40. Bourdi, T.; Rhazi, J.E. Application of Jonscher model for the characterization of the dielectric permittivity of concrete. Appl. Phys. D 2008, 41, 205410. [Google Scholar] [CrossRef]
  41. Bourdi, T.; Rhazi, J.E.; Boone, F.; Ballivy, G. Modelling the dielectric-constant values of concrete: An aid to shielding effectiveness prediction and ground-penetrating radar wave technique interpretation. Appl. Phys. D 2012, 45, 205410. [Google Scholar] [CrossRef]
  42. Evaluating Goodness of Fit, MATLAB Documentation. Available online: https://cn.mathworks.com/help/curvefit/evaluating-goodness-of-fit.html (accessed on 21 January 2017).
  43. Jin, X.; Ali, M. Embedded antennas in dry and saturated concrete for application in wireless sensors. Prog. Electromagn. Res. 2010, 102, 197–211. [Google Scholar] [CrossRef]
  44. Yi, X.H.; Wu, T. Sensitivity modeling of an RFID-Based strain-sensing antenna with dielectric constant change. IEEE Sens. J. 2015, 15, 6147–6155. [Google Scholar] [CrossRef]
  45. Ji, S.; Chung, K.L.; Zhang, C. Optimal bandwidth of concrete embedded antenna for wireless power transmission. In Proceedings of the 2016 IEEE International Workshop on Electromagnetics: Applications & Student Innovation Competition, Nanjing, China, 16–18 May 2016; pp. 1–3.
Figure 1. A big picture illustrating the cross-disciplinary work for compressive strength evaluation, using the dielectric constant of 28-day cement concrete.
Applsci 07 00177 g001
Figure 2. Photographs for GB concrete mixing and casting: (a) anchor type of concrete mixer; (b) elimination of entrapped air from specimens using vibration table.
Applsci 07 00177 g002
Figure 3. Experimental setup of dielectric constant measurement.
Applsci 07 00177 g003
Figure 4. Measured average compressive strength and standard deviation versus w/c ratio.
Applsci 07 00177 g004
Figure 5. Average values of the measured dielectric constant versus frequency.
Applsci 07 00177 g005
Figure 6. Dielectric characterization of GB concrete via curve fitting to measured data using the first-order exponential model, Debye model, and Jonscher model, expressed in (a) linear scale; (b) log-frequency scale.
Applsci 07 00177 g006
Figure 7. Dielectric constant versus water-to-cement ratio of GB concrete.
Applsci 07 00177 g007
Figure 8. Compressive strength versus dielectric constant of GB concrete, (a) at various frequencies; (b) at 2.45 GHz with both the standard deviations from measurement.
Applsci 07 00177 g008
Table 1. Chinese Standard Concrete mix proportions.
GB ConcreteWater (kg/m3)Cement (kg/m3)Sand (kg/m3)Coarse Aggregate (kg/m3)w/c
C30205342760.151037.510.60
C35205380697.051067.630.54
C40205418638.711092.210.49
C45205456602.831095.290.45
C50205513560.211087.470.40
Table 2. Chemical Composition (wt %) of Portland cement, ordinary type P.O. 42.5.
CaOSiO2Al2O3SO3MgOFeOK2OLOI
61.222.45.63.51.92.20.42.8
Table 3. Physical Properties of Portland cement, ordinary type P.O. 42.5, conforms to GB175-2007.
Density (kg·m−3)Setting TimeFlexural Strength (MPa)Compressive Strength (MPa)
Initial SettingFinal Setting3-day28-day3-day28-day
2900–3100≥45 min≤10 h≥3.5≥6.5≥16.0≥42.5
Table 4. First-order Exponential Model: Fitting Coefficients and Goodness of Fit for Equation (4).
GB Concretew/cKbCR2SSE
C300.600.9674.2683.3050.9380.155
C350.541.2138.4963.5970.9390.170
C400.491.1488.0174.0180.9750.063
C450.451.4667.3744.3320.9560.189
C500.401.9266.8624.9730.9710.226
Table 5. Debye Model: Fitting Coefficients and Goodness of Fit for Equation (5).
GB Concretew/cτεstaticε∞dR2SSE
C300.600.8914.1773.3030.9280.181
C350.541.7984.6613.5980.9270.202
C400.491.6895.0294.0180.9700.076
C450.451.5295.6214.3310.9490.222
C500.401.4816.6924.9730.9670.256
Table 6. Jonscher Model: Fitting Coefficients with fr = 0.1 GHz and Goodness of Fit for Equation (7).
GB Concretew/cnχrε∞jR2SSE
C300.600.6220.6743.1160.9870.032
C350.540.2730.3963.5590.9730.075
C400.490.3850.4463.9550.9910.022
C450.450.4220.6244.2330.9900.042
C500.400.4850.9214.7970.9970.020
Table 7. Calculated dielectric constant at 0.5, 2.45, and 5.0 GHz using the Jonscher model, Equation (7).
GB Concretew/cε′(0.5)ε′(2.45)ε′(5.0)ε′(10) = ε
C300.603.483.323.273.116
C350.543.683.603.583.559
C400.494.124.024.003.955
C450.454.484.334.304.233
C500.405.204.974.924.797
Table 8. Regression coefficients (with 95% confidence bounds) and goodness-of-fits for Equation (11).
f (GHz)pqR2SSE
0.50−1.482−0.33580.99020.018
2.45−1.4450.19920.99760.004
5.0−1.4380.10100.99850.002
10−1.4340.04280.99290.012
Table 9. Regression coefficients (with 95% confidence bounds) and goodness-of-fits for Equation (12).
f (GHz)rAR2SSE
0.501.94325.990.99960.5606
2.451.98826.070.99960.5970
5.01.99726.120.99850.5931
102.01026.490.99970.4922

