Abstract
The results of numerical and experimental investigation of trapezoidal cantilevers with irregular cross-sections are presented in this paper. Modifications of the cross-section were made in order to increase strain and improve its distribution in the piezo ceramic layer of a cantilever. The proposed modifications allowed improving the energy conversion coefficient and increasing the power density. The numerical investigation revealed that modifications have a positive influence on strain and its distribution characteristics. Moreover, the electrical characteristics of piezoelectric cantilevers were investigated by employing a numerical model. The analysis of the results revealed that modifications of the cross-section have positively affected the electrical outputs of the cantilevers. The results of the numerical investigation were validated by experimental investigation. Experimental investigation showed that output voltage density was increased by 9.9%, output current density by 6.9% and power density by more than three-times compared with a conventional cantilever.
1. Introduction
The power supply for wireless sensors and low power electronics is an important research topic driven by the disadvantages of conventional power supply methods, such as short life time, high cost of service and environmental pollution [1,2]. Therefore, there is the need to replace conventional power sources with harvested energy sources provided suitable energy exists in the application environment. One promising solution is kinetic energy harveslting technology that can provide permanent power supply and ensure low cost service. Moreover, this technology is environmentally friendly [3].
Kinetic energy harvesting can be carried out by electromagnetic, electrostatic, piezoelectric and triboelectric transducers. Electromagnetic, electrostatic and triboelectric transducers have low power density and a complex design. In addition, electrostatic transducers need an external power supply. Hence, these characteristics have a negative impact on the practical application of such technologies [4]. Piezoelectric energy harvesting transducers are more suitable for practical applications because of their simple design, high power density and low cost. Therefore, piezoelectric energy harvesting becomes the most promising power supply technology for wireless electronic devices [5].
In most cases, a piezoelectric kinetic energy harvesting device consists of a bimorph cantilever beam with one or two piezoelectric layers. Usually, structural motions of the host excite a cantilever beam. Structural motions of the host induct dynamic strains in piezoelectric layers; therefore, an alternating voltage is generated on the electrodes of the piezoelectric layers [6]. The best output performance of the piezoelectric energy harvesting devices can be achieved by matching the vibration frequency of the host and the natural frequency of the cantilever; i.e., when the system operates in resonant mode [7].
Numerous theoretical and experimental investigations related to piezoelectric energy harvesting have been performed in recent years. Usually, two common models are used for the theoretical investigation of piezoelectric energy harvesting systems: the lumped parameter model and the equivalent circuit model [8,9,10]. The lumped parameter model analyzes only the mechanical behavior of the system, and it is highly simplified; therefore, such a model is highly inaccurate. The equivalent circuit model describes the mechanical and electrical conjunction of the system and provides a good understanding of the electromechanical behavior of the energy harvesting system.
There are many papers related to research on cantilevers used for energy harvesting. Baker et al. analyzed three different designs of the cantilever beams with the goal of obtaining the highest power density [11]. It was concluded that one of the most promising designs is a cantilever beam with a trapezoidal shape. The analysis of the results showed that this design gives more than 30% higher power output compared to the cantilever beams with rectangular or triangular shapes.
Benasciutti et al. conducted modeling and experimental research dedicated to two types of cantilever beams: trapezoidal and reversed trapezoidal cantilevers [12]. The research revealed that both proposed geometries of the cantilevers allow one to considerably increase the output power in comparison with rectangular cantilevers. The author has achieved a specific value of power per volume that is close to the power requirements of wireless sensors.
Rosa and De Marqui Junior conducted research on the modeling and experimental verification of electromechanically-coupled beams with varying cross-sectional areas [13]. The results of the modeling and experimental verification of the proposed model were reported and compared to Erturk and Inman’s reported results [14]. Based on the results obtained during the three-stage research, the authors have concluded that when the electrical term is neglected in the mechanical equation, the resulting expression for the optimum load resistance to get the maximum power output is inaccurate, especially for systems with large electromechanical coupling. The proposed research, i.e., modeling and experimental work, concentrated on cantilever width and optimal resistance load values in order to obtain maximum power output. On the other hand, the authors neglected the possibility for improving the electrical outputs of the system by various design of the cross-section area.
Ben Ayed et al. conducted research related to the coupled electromechanical model, which accounts for the mechanical behavior of the structure using the Euler–Lagrange equation and piezoelectric behavior using the Gauss law [15]. On the basis of the modeling results, the authors concluded that the fundamental natural frequency and mode shape are strongly affected by varying the shape of a cantilever beam. Moreover, the authors claimed that the load resistance has a strong influence on the level of the harvested power for variably-shaped cantilevers. Modeling revealed that there are specific load resistances that give the opportunity to harvest energy at low frequency and with a higher performance than the classical harvesters.
Goldschmidtboeing and Woias published results on the characterization of different beam shapes for piezoelectric energy harvesting [16]. The research was based on modeling the well-established Rayleigh–Ritz method, as well as the verification of the results by experimental work. On the basis of the investigation, the authors concluded that the shape has only a small influence on efficiency, but can have an enormous effect on the maximum tolerable excitation amplitude and, thus, on the maximum output power. On the other hand, the authors neglected an opportunity in the modeling and experimental work to improve the efficiency of the system through various designs of the cross-section areas.
Jackson et al. performed research related to the design and performance of variably-shaped cantilevers [17]. The authors developed an electromechanically-coupled model and verified the results of the modeling by experimental work. The model was based on the Euler-Lagrange equation for mechanical behavior; electrical behavior was modeled by the Gauss law equations. The target of the investigation achieved 2.5 mW/cm3/g2 at a wide-band excitation frequency when the area for the energy harvesting system is fixed at 4 cm2. The authors performed modeling and experimental work for three cases; i.e., an array of wide rectangular cantilevers and arrays of narrow rectangular and trapezoidal cantilevers. Based on the research results, the authors claimed that the best power density was obtained with wide cantilevers, but the operational bandwidth for such systems is narrow. The case with narrow cantilevers showed that power density in comparison with wide cantilevers is lower, but the operational bandwidth is much wider. The analysis of the trapezoidal cantilever case showed that such a system can be employed as a compromise in power density and bandwidth.
This paper provides the results of numerical and experimental research on the piezoelectric trapezoidal cantilever beams with an irregular design of the cross-section area. Cylindrical and trapezoidal gaps were used for cross-section area modifications. The goal of the modifications was to increase strain and its distribution at the piezo ceramic layer and, as a result to, improve the power density of the energy harvesting system based on trapezoidal cantilevers.
2. The Design of Trapezoidal Cantilevers with an Irregular Design of the Cross-Section
Cantilevers used for energy harvesting usually vibrate at the first out-of-plane bending mode. The cantilever beam with a uniform cross-section area has linear characteristics of the strain distribution along the length of the beam. Therefore, the generated output voltage is proportional to the strain inducted in the piezo ceramic. The strain of the piezo ceramic layer can be expressed as follows:
where ε(x) is strain; is a vertical force that is acting on the free end of the cantilever with a seismic mass; h is the distance between the centers of the cantilever and the piezo electric layer; YPiezo is the Young modulus of the piezoelectric material; lb is the length of the beam; le is the length of the piezoelectric material, which is covered by an electrode; I(x) is the second moment of inertia as a function of distance x from the fixed end of the cantilever.
The function of the second moment of inertia can be expressed as shown below:
where w(x) is the width of the cantilever as a function of distance x from the fixed end of the cantilever; tc is the thickness of the piezo ceramic layer; h is the distance between the centers of the cantilever and the piezo electric layer; ts is the thickness of the cantilever; ηs is the ratio between the Young’s modulus of the piezo electric and cantilever materials, and it can be expressed as ηs = YPiezo/YCantilevers.
Therefore, the relation between voltage and strain can be written as follows [2]:
where YPiezo is the Young’s modulus of the piezo ceramic; Cp is the capacitance of the piezo ceramic layer; b is the thickness of the piezo ceramic layer; d31 is the piezoelectric coefficient; ε(x) is the strain in the piezo ceramic layer; l is the length of the piezo ceramic layer.
Based on Equation (3), it can be concluded that the integral of the strain function must be increased in order to increase the output voltage. One of the ways to obtain that is to change the strain function, so that it would be a constant or close to the constant along the length of the piezo ceramic layer. Such a strain function can be obtained by modifications of the cross-section area, herewith modifications of the second moment of inertia in the cantilever. Therefore, trapezoidal cantilever beams with an irregular cross-section are proposed and analyzed.
The principle design of the trapezoidal cantilevers with an irregular cross-section area is given in Figure 1. It consists of a bronze plate, a piezo ceramic plate and a seismic mass. The piezo ceramic plate has a constant thickness and length of 0.5 mm and 30 mm, respectively. Furthermore, each cantilever has a constant length equal to 70 mm; therefore, the ratio of the piezo ceramic length and cantilever length is 0.42. Moreover, each cantilever has a seismic mass, and its weight is 8.71 g. The seismic mass was used to reduce the resonant frequency of the cantilever. Cantilevers were clamped to the host through the plastic support structure. The cross-section areas of two cantilevers were modified (Figure 1a,b). The modifications were made by employing cylindrical and trapezoidal gaps. Such types of gaps were chosen based on their geometrical functions. A conventional design of the cross-section area (Figure 1c) was chosen in order to obtain reference data for comparison. The proposed improvements of the cross-section area could provide almost a uniform strain distribution along the length of the piezo ceramic plate. Potentially, improvements could have an influence on the electrical characteristics and natural frequencies of the cantilevers.
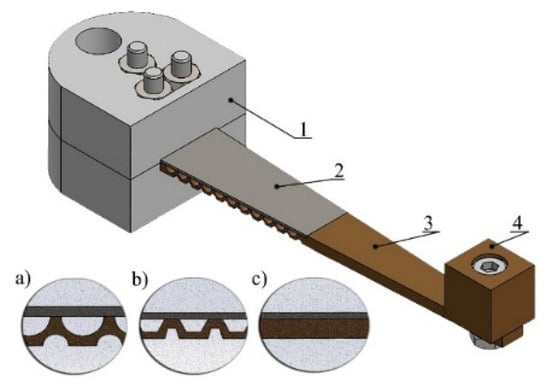
Figure 1.
Design of the cantilever: (a) cross-section area with cylindrical gaps; (b) cross-section area with trapezoidal gaps; (c) conventional design of the cross-section area; 1, plastic clamping frame; 2, piezo ceramic; 3, cantilever beam; 4, seismic mass.
3. Numerical Investigation of Modified Trapezoidal Cantilever Beams
Numerical investigation of the cantilevers with conventional and two irregular cross-section designs was performed. A geometrical optimization problem for each cantilever was set as presented in Equation (6). The geometrical parameters and a side view of each investigated cross-section area design are presented in Figure 2 and Table 1, respectively. As shown in Figure 2, the cross-section modifications were made only under the piezo ceramic. The length of the modified cross-section area is equal to the length of the piezo ceramic LPiezo, i.e., 30 mm. This was made in order to obtain a constant strain and its distribution in this part of the cantilever.
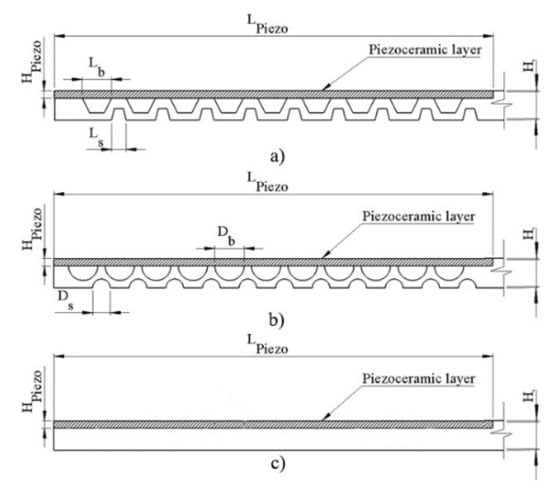
Figure 2.
Geometrical characteristics of cross-section areas: (a) cross-section area with trapezoidal gaps; (b) cross-section area with cylindrical gaps; (c) conventional cross-section area.

Table 1.
Geometrical parameters of the trapezoidal cantilevers.
At first, modal analysis was performed in order to obtain the modal shapes and natural frequencies of each cantilever. After that, a study based on harmonic excitation of the base was performed in order to obtain the electrical and mechanical characteristics of each cantilever.
Finite Element Modeling (FEM) software Comsol Multiphysics 5.2 (Comsol Inc., Burlington, MA, USA) was used for investigation. A FEM model was built, and boundary conditions were set, as well (Figure 3). Mechanical boundary conditions were set as follows: host structure acceleration was set to 0.5 m/s2; the weight of the seismic mass was equal to 8.71 g; gravity force was included, as well; the resistive load connected in parallel with the piezo ceramic was set as an electrical boundary condition. The value of the resistive load for each cantilever was calculated as presented below [2]:
where ωn is the natural frequency of the beam and Cp is the capacitance of the piezoelectric layer. The equation related to piezoelectric layer capacitance can be written as shown below [2]:
where ε33 is the dielectric constant, ε0 is the permittivity of free space, and it is equal to 8.9 × 10⁻¹² (F/m), A is the area of an electrode and t is the distance between two electrodes.
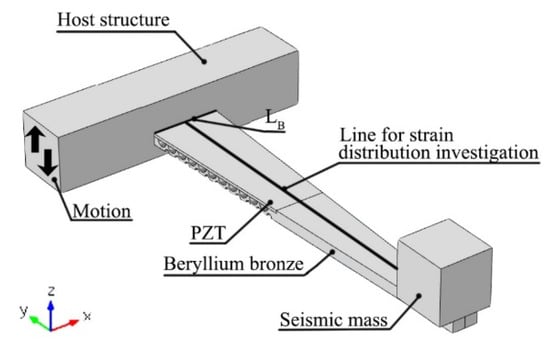
Figure 3.
FEM (Finite Element Modeling) model of the trapezoidal cantilever beam. PZT-Lead Zirconate Titanate.
Finally, material properties were added to the model. Beryllium bronze DIN (German Institute for Standardization) 2.1247 was used as a base layer of the trapezoidal beam and soft modified lead zirconate titanate PIC255 piezo ceramic (Physik Instrumente, Lindenstraße, Germany) for active layer modeling. The isotropic loss factor for beryllium bronze was defined. The characteristics of the material properties are given in Table 2.
Table 2.
Material properties used for modeling.
The results of the modal analysis of each cantilever are given in Figure 4 and compared in Table 3. The aim of this investigation was to find the natural frequencies of the first out-of-plane bending mode for each beam.
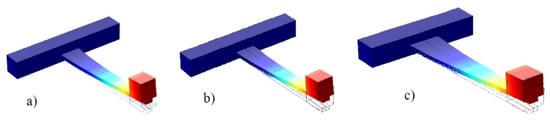
Figure 4.
Results of modal analysis: (a) conventional trapezoidal cantilever beam, ωn = 80.6 Hz; (b) trapezoidal cantilever beam with cylindrical gaps, ωn = 89.5 Hz; (c) trapezoidal cantilever beam with trapezoidal gaps, ωn = 119.1 Hz.
Table 3.
Comparison of numerical and experimental results.
The next step of the investigation was the base harmonic excitation case. The aim of this investigation was to obtain output voltage, current, average power and strain conducted in the YY direction. The strain distribution at the middle line of the trapezoidal beam was analyzed (Figure 4).
The parametric sweep of cantilever base length LB was performed in order to obtain the highest strains at the middle line of the trapezoidal beam. The optimization problem for the cantilevers’ parameters can be written as follows:
where ε is the strain in the piezo ceramic layer; ωmin is the lowest excitation frequency; ωmax is the highest excitation frequency; Lmin is the minimal width of the base; Lmax is maximum width of the base; LB1, LB2 and LB3 are the optimal base widths of conventional cantilevers and cantilevers modified by cylindrical and trapezoidal gaps. The optimal width of the base will be determined from the viewpoint of the maximum value of strain in the piezo ceramic. LTip is the width of the cantilever`s tip; it is constant for all cases. The value of LTip is given in Table 2.
During the parametric sweep, the following values were used: ωmin = 50 Hz, ωmax = 500 Hz, Lmin = 10 mm, Lmax = 30 mm. The first parametric sweep was made for LB1. It is the base width of the conventional trapezoidal cantilever. The results of the parametric sweep are given in Figure 5. The parametric sweep step was set to 2 mm.
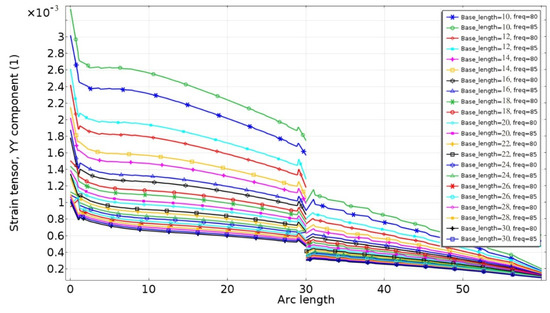
Figure 5.
Strain characteristics of the conventional trapezoidal cantilever; freq–frequency in Hertz.
The analysis of the graph showed that the highest strain was achieved when the trapezoidal cantilever base width was 10 mm. This value was obtained when the excitation frequency was 85 Hz, and it is almost equal to the natural frequency of the beam (Figure 4.). The obtained strain value is directly related to cantilevers’ stiffness. As can be noticed in Figure 5, the highest value of the strain was obtained at the lowest base width, when the cross-section design is unmodified. The difference of the strain values at the fixed end of the cantilever and at LPiezo is 25.23%. Constant decreasing of the strain shows that the piezo ceramic is strained unevenly and inefficiently; moreover, the standard sample deviation of strain values is 7.4 × 10⁻⁴. According to the results of the parametric investigation, it can be concluded that the electrical outputs will be at the highest level when the base width is 10 mm.
Next, the parametric sweep was conducted for the trapezoidal cantilever base LB2. The cantilever cross-section area was modified by cylindrical gaps. The frequency range was set according to the optimization problem in Equation 6. The strain characteristics are presented in Figure 6.
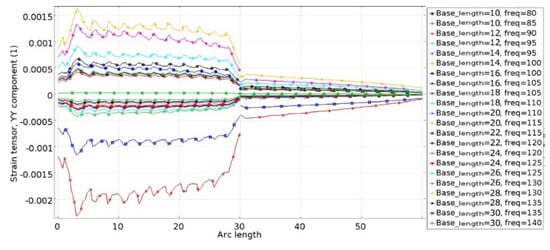
Figure 6.
Strain characteristics of the trapezoidal cantilever with cylindrical gaps; freq–frequency in Hertz.
The analysis of the graph revealed that the highest strain value was achieved when LB2 was equal to 12 mm. This value was obtained when the excitation frequency was 90 Hz, and it matches the natural frequency of the cantilever (Figure 3). According to this, it can be said that the cantilever stiffness characteristic has the lowest value when the base width is 12 mm; considering this, it can be concluded that modifications decreased the stiffness of the cantilever, and this ensured approximately the same strain as in the conventional cantilever, but in a larger volume of the piezo ceramic. The graph shows that the strain characteristics along the piezo ceramic layer have a nonlinear behavior and constantly decrease. The difference of the strain values at the fixed end of the cantilever and at LPiezo is 12.16%. This is more than two-times lower in comparison with the conventional cantilever, and it shows that the strain distribution becomes more, even than in the case before; moreover, the standard sample deviation of the strain is 9.3 × 10⁻⁴. Such results can be explained by the nonlinear inertia moment in the cantilever cross-section. The nonlinearity of the inertia moment is caused by cross-section modifications that ensure more effective usage of the piezo ceramic layer; hence, the electrical characteristics of the cantilever will be improved.
The third parametric sweep was conducted for the trapezoidal cantilever with trapezoidal gaps. The frequency range was set as in the previous two cases. The obtained strain characteristics are given in Figure 7. The analysis of the graph revealed that higher strain and its best distribution in the piezo ceramic were achieved when the width of the base was equal to 16 mm. Moreover, the strain increased significantly, and it is evenly distributed along LPiezo. The difference of the strain values at the fixed end and LPiezo is 14.16%, and it is 1.5-times lower in comparison with the conventional cantilever. The standard sample deviation of strain is 19.6 × 10⁻⁴. According to these results, it can be concluded that modifications of the cross-section area improved the strain and its distribution characteristics. Considering this, the electrical characteristics will be improved, as well.
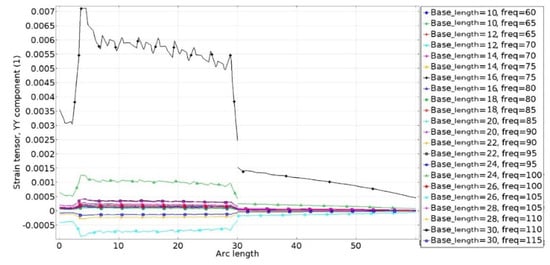
Figure 7.
Strain characteristics of the trapezoidal cantilever with trapezoidal gaps. freq–frequency in Hertz.
Summarizing this part of the numerical investigation, it can be concluded that modifications of the cross-section area have improved the strain level and its distribution. The analysis of the differences in strain values along LPiezo showed that the strain distribution was increased more than 1.5-times in comparison with the conventional one. Moreover, as shown above in Figure 6 and Figure 7, the strain characteristics’ curve became nonlinear in comparison with Figure 5. The nonlinearity of the strain characteristics was caused by modifications of the cross-section area of the cantilevers. The modifications ensure the decreasing of the second moment of inertia, and thus, strain in the modified part of the cantilever is increased; therefore, the piezo ceramic is employed more efficiently. The highest level of strain and its distribution were obtained for the cantilever with trapezoidal gaps. The comparisons of the strain distribution functions are given in Figure 8. This summary reveals that the strain distribution in the modified cantilevers has a more constant behavior for the piezo ceramic in comparison with the conventional one. The summary of the strain average values shows that the strain level in modified cantilevers was increased more than 2.7-times compared to the conventional cantilever. According to this summary, the geometrical parameters of the trapezoidal cantilever beams were chosen for further investigation; the values are given in Table 2.
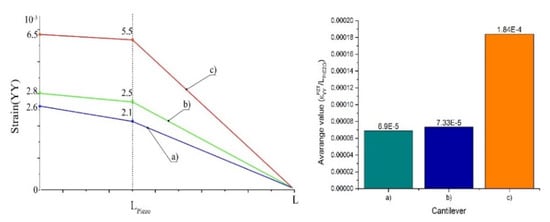
Figure 8.
Strain functions and average values of strain: (a) conventional cantilever; (b) cantilever with cylindrical gaps; (c) cantilever with trapezoidal gaps.
Numerical investigation related to the electrical characteristics of the trapezoidal cantilevers was performed. Resistance load was included in an FEM model. A resistor was connected in parallel to the piezo ceramic layer. The other parameters of the model were set as in the previous cases. The value of optimal resistive load Ropt was chosen according to Equation (4).
Firstly, the conventional trapezoidal cantilever was analyzed. A frequency response study was employed for this investigation. The frequency range from 50 Hz to 500 Hz was analyzed. The results of the electric outputs as a function of excitation frequency are presented in Figure 9. It can be noticed that the highest values of the electrical outputs were obtained at the resonant frequency of the trapezoidal cantilever. The output voltage on the electrical load is equal to 2.8 V. Moreover, the current is equal to 2.6 μA, and the average power of the system is 6.6 μW.
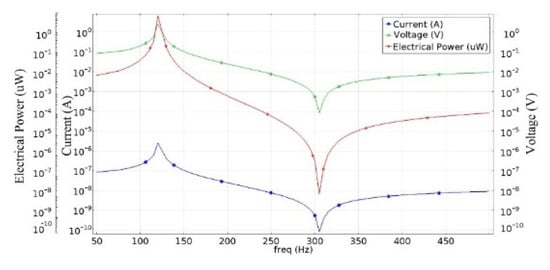
Figure 9.
Electrical characteristics of the conventional trapezoidal cantilever.
Figure 10 represents the electrical characteristics of the trapezoidal cantilever with trapezoidal gaps. It can be noticed that the electrical characteristics of the system reach the highest values at the resonant frequency of 80.6 Hz. Voltage generated by a modified trapezoidal cantilever is equal to 9 V, and it is 3.2-times larger in comparison to the conventional beam. Current generated by a cantilever is equal to 8 μA and is 3.1-times higher in comparison with the conventional beam. The average output power is equal to 80 μW, and it is 12.1-times higher in comparison with the conventional beam. Summarizing the results of this investigation, it can be concluded that the modification of the cross-section gives a positive impact on the electrical characteristics of the beam.
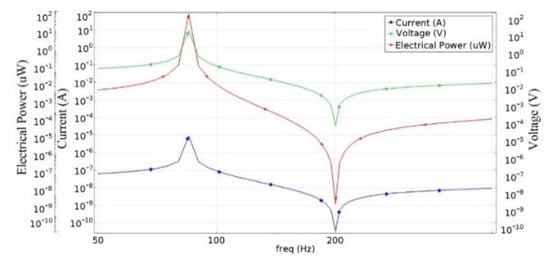
Figure 10.
Electrical characteristics of the trapezoidal cantilever with trapezoidal gaps.
Figure 11 represents the electrical characteristics of a trapezoidal cantilever with cylindrical gaps. It can be noticed that the output voltage is equal to 8.3 V at a resonant frequency of 90 Hz, and it is 2.96-times higher in comparison with the conventional cantilever. The analysis of the output current and average power shows that the highest values are also in the same frequency. Current reached 7.2 μA, and average power become equal to 59.76 μW; these are 2.76- and 9.05-times higher in comparison with the conventional cantilever. In summary, it could be said that the modification performed for a trapezoidal cantilever has a notable impact on the electrical characteristics.
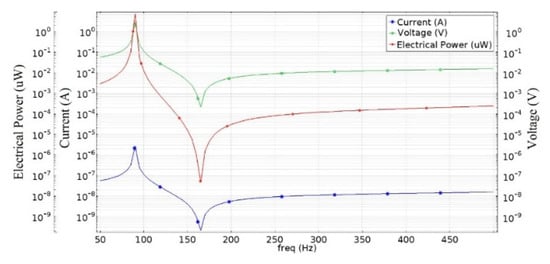
Figure 11.
Electrical characteristics of the trapezoidal cantilever with cylindrical gaps.
In order to accurately compare the electrical characteristics of the cantilevers, the ratios between the used volume of the piezo ceramic and the output voltage, current and power were set as critical. Such a means of comparison was chosen due to the differences in piezo ceramic volumes used in each cantilever. Therefore, parameters like V/mm3, μA/mm3 and μW/mm3 were used for comparison. The results of the comparison are given in Figure 12.
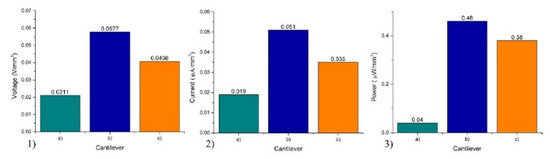
Figure 12.
Comparison of the cantilever beams: (1) voltage density; (2) current density; (3) power density; (a) conventional cantilever; (b) cantilever with cylindrical gaps; (c) cantilever with trapezoidal gaps.
According to Figure 12, the voltage generated with modified cantilevers from 1 mm3 is more than 2.2-times higher in comparison with the conventional cantilever. The generated current has more than a 2.5-times higher value, whereas the power is higher by more than 11.5-times. As a result, Figure 12 shows that the best power/piezo ceramic volume ratio is for a cantilever beam with cylindrical gaps.
4. Experimental Investigation of Modified Trapezoidal Cantilevers
The experimental investigation was performed in order to validate the results of numerical investigation. Electrical and mechanical characteristics of the prototypes were measured and analyzed. Prototype cantilevers with the optimal dimensions were made (Figure 13). The material properties are given in Table 2. Moreover, plastic clamping structures were designed and manufactured for each cantilever.
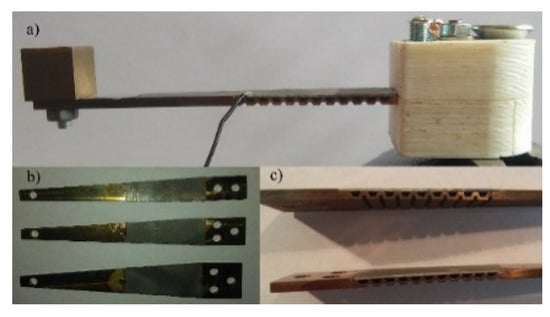
Figure 13.
Prototypes of the cantilevers: (a) view of the assembled system; (b) front view; (c) side view.
The resonant frequency of the first bending mode of the prototypes was measured employing the vibrometer POLYTEC PSV 500 (Polytec, Dexter St., MI, USA). The shapes of the vibrations are presented in Figure 14, and resonant frequencies are given in Table 3.
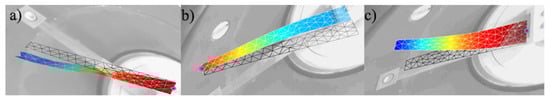
Figure 14.
Shapes of the cantilever vibrations: (a) conventional cantilever beam, ωa 70.05 Hz; (b) cantilever with cylindrical gaps, ωb 79.68 Hz; (c) cantilever with trapezoidal gaps, ωc 101.25 Hz.
It can be noticed that the values of the measured resonant frequencies and natural frequencies obtained during the numerical investigation are similar; however, the highest difference is up to 17.69%. Furthermore, it can be seen that the measured resonant frequencies have lower values than natural frequencies. The errors mainly occur because of the simplified numerical model and high vibration damping in the plastic clamping frame used for prototype clamping.
Summarizing this part of the investigation, it can be concluded that the calculated natural frequencies and measured resonant frequencies have acceptable differences. The resonant frequencies are lower in comparison with natural ones; therefore, the lowest resonant frequencies could have a positive influence on the electrical characteristics of the cantilevers. Lower resonant frequency ensures greater cantilever tip displacements and results in a higher strain value and better electrical characteristics.
The next step of experimental study was to investigate the cantilever response to the different excitations of the base and measure electrical output densities versus resistance load. An experimental setup was built for this purpose. The principle scheme of the setup is given in Figure 15. It consists of two optical displacement sensors used for displacement control at the base and tip of the cantilever; a special plastic clamping frame was used to attach the cantilever to an electromagnetic shaker; a computer was used for displacement data recording and analysis; a function generator and a power amplifier were employed for driving the electromagnetic shaker; a variable resistive load was used as the electrical load of the cantilever; a micro current probe was used for low current measurements; an oscilloscope was used for control and recording of the current and voltage values.
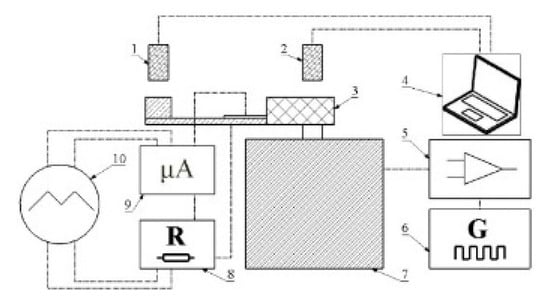
Figure 15.
Experimental setup: 1,2, optical displacement sensor; 3, plastic clamping frame; 4, computer; 5, power amplifier; 6, function generator; 7, electromagnetic shaker; 8, variable resistive load; 9, micro current probe; 10, oscilloscope.
The measured cantilever at base excitation response characteristics show the dependency of the ratio zBase/LB to the tip displacement of each cantilever (Figure 16a). Displacements of the base and tip were measured by optical sensors (Figure 15). The resistance load during this stage of the investigation was equal to the input resistance of the oscilloscope; i.e., 10 MΩ, so displacement characteristics were measured in open circuit conditions. Excitation frequencies were set to the resonant frequency for each cantilever. The characteristics of the open circuit voltage density versus tip displacement were investigated at the same conditions for each cantilever. The results are given in Figure 16b.
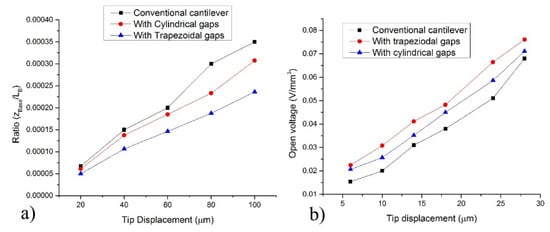
Figure 16.
Cantilever response and open circuit voltage density characteristics: (a) displacement characteristics; (b) open circuit voltage density characteristics.
The ratio between base displacement and the width of the base was chosen as a critical parameter in order to compare cantilevers. The analysis of Figure 16a revealed that a cantilever with trapezoidal gaps has the best response to the base excitation. Considering cantilever base widths, LB3 (Table 1), it could be concluded that trapezoidal gaps have a positive influence on the base excitation response of the system. These gaps reduced the stiffness of the cantilever, and thus, the response characteristic was improved.
Furthermore, the generated voltage from the unit of the piezo ceramic volume was chosen as a criterion to compare cantilevers from the view point of open circuit voltage density. Figure 16b reveals that a cantilever with trapezoidal gaps has the best open voltage density characteristic. This is caused by gaps that reduced the cantilevers’ stiffness and improved strain in the piezo ceramic. The open circuit voltage density of the modified cantilever has a 3% higher value in comparison with the conventional beam.
The output voltage density tip displacement characteristics for each cantilever were measured. The output voltage was measured by the oscilloscope Yokogawa DL2000 (Yokogawa, Tokyo, Japan). Variable resistance load was attached in parallel to the piezo ceramic. The tip displacement was controlled by optical sensors. The results of the investigation are given in Figure 17.
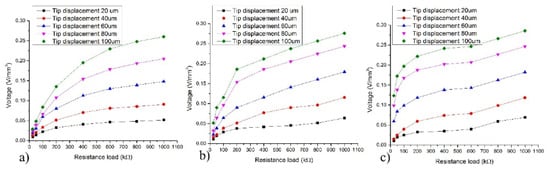
Figure 17.
Output voltage density tip displacement characteristics: (a) conventional cantilever; (b) with cylindrical gaps; (c) with trapezoidal gaps.
Graphs of Figure 17 show that modified cantilevers have higher values of output voltage density. Therefore, it can be concluded that modifications of the cross-section area have a positive influence on the electrical characteristics of the cantilevers. Comparing the maximum values of output voltage density, it can be seen that the output voltage density of modified cantilevers was increased up to 9.9% compared to the conventional cantilever (Figure 18). Considering this, it can be concluded that modification of the cross-section can ensure higher output voltage density. Moreover, such modifications ensure more effective piezo ceramic employment.
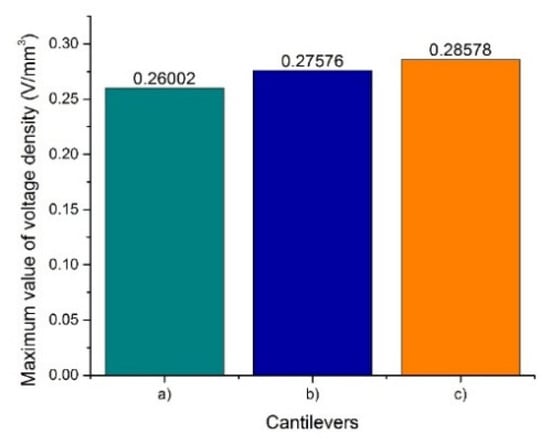
Figure 18.
Summary for maximum values of output voltage density: (a) conventional cantilever; (b) with cylindrical gaps; (c) with trapezoidal gaps.
The output current density versus tip displacement were measured for each cantilever, as well. Current was measured by a micro current probe that employs the Burden voltage phenomenon. The probe was connected to the oscilloscope, and the values were recorded. The results of the investigation are given in Figure 19.
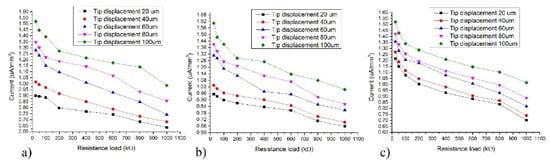
Figure 19.
Output current density tip displacement characteristics: (a) conventional cantilever; (b) with cylindrical gaps; (c) with trapezoidal gaps.
The results of the measurements showed that output current density was improved for cantilevers with a modified cross-section. Considering the results, it could be concluded that modifications of the cross-section area have a positive influence on the output current density. Comparing the maximum values for the output current density, it can be noticed that cross-section modifications increased output current density up to 6.9% in comparison with the conventional cantilever (Figure 20). According to the results of this investigation, it can be concluded that the energy conversion coefficient was improved by modifications of the cross-section area.
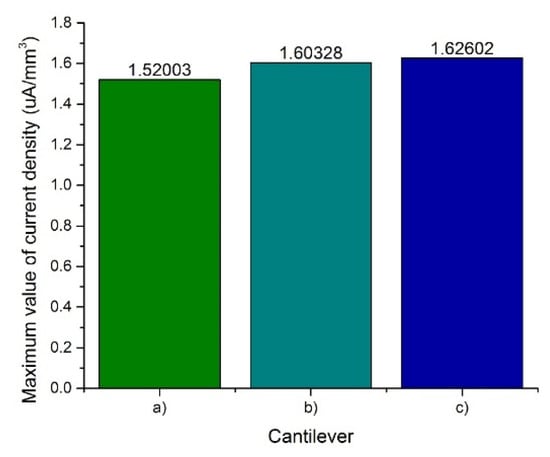
Figure 20.
Summary of the maximum values of output current density: (a) conventional cantilever; (b) with cylindrical gaps; (c) with trapezoidal gaps.
The comparison of the power density was made for each cantilever, as well. Such a comparison reveals the efficiency of each cantilever beam. Electrical power at 1 MΩ with the tip displacement of 100 μm was chosen as a critical parameter. The results are presented in Figure 21. A cantilever with cylindrical gaps has the best power density of 8.8 μW/mm3. This power density value is 3.14-times higher in comparison with the conventional cantilever.
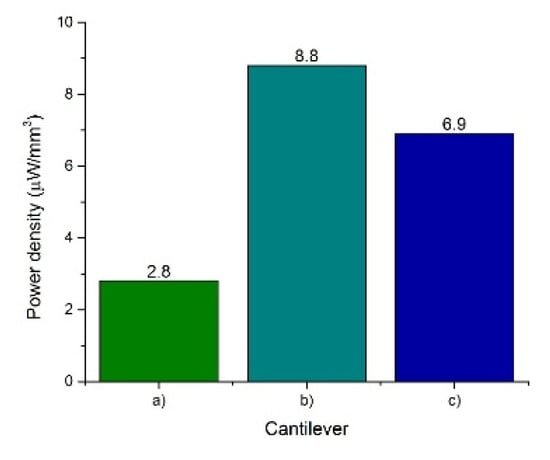
Figure 21.
Power density: (a) conventional cantilever; (b) cantilever with cylindrical gaps; (c) cantilever with trapezoidal gaps.
5. Conclusions
The numerical and experimental investigation of piezoelectric trapezoidal cantilevers with an irregular cross-section area was performed. The numerical investigation revealed that the strain and electrical characteristics of the piezoelectric cantilevers depend on the cross-section design. Strain variation along the length of the trapezoidal cantilever is nonlinear because of the irregular cross-section design.
The differences between the natural frequency obtained during numerical modeling and experimental measurement is up to 17.69%. The errors mainly come because of the simplified numerical model and high vibration damping in the plastic structure used for prototype clamping. The numerical investigation showed that the generated electric power of the modified piezoelectric cantilevers is more than 11.5-times greater than the power obtained from the conventional cantilever.
The experimental investigation in principle validated the results of the numerical investigation. Measurement of the electrical characteristics showed that the output voltage density has a 9.9% higher value compared with the conventional cantilever. The output current density was increased 6.9%, and the power density has more than a three-times higher value compared with the conventional cantilever. The results of the numerical and experimental investigations showed that the energy conversion coefficient of cantilevers can be improved by employing an irregular design of the cantilever cross-section area.
Author Contributions
Andrius Čeponis designed and fabricated the prototypes, performed the numerical and experimental investigation and contributed to the manuscript preparation. Dalius Mažeika conceived of the idea, supervised the experiments, analyzed the data and contributed to the manuscript preparation. Vytautas Bakanauskas conducted the measurements of the prototypes.
Conflicts of Interest
The authors declare no conflict of interest.
References
- Priya, S.; Inman, D.J. Energy Harvesting Technologies; Springer Science + Business Media: New York, NY, USA, 2009. [Google Scholar] [CrossRef]
- Roundy, S.; Kenneth, P.; Wright, J.; Rabaey, M. Energy Scavenging for Wireless Sensor Networks; Springer Science + Business Media: New York, NY, USA, 2004. [Google Scholar] [CrossRef]
- Kazmierski, T.J.; Beeby, S. Energy Harvesting Systems; Springer Science + Business Media: New York, NY, USA, 2011. [Google Scholar] [CrossRef]
- Spreemann, D.; Manoli, Y. Electromagnetic Vibration Energy Harvesting Devices; Springer Science + Business Media: New York, NY, USA, 2012. [Google Scholar] [CrossRef]
- Erturk, A.; Inman, D.J. Piezoelectric Energy Harvesting; John Wiley and Sons: Hoboken, NJ, USA, 2011. [Google Scholar]
- Elvin, N.; Erturk, A. Advances in Energy Harvesting Methods; Springer Science+Business Media: New York, NY, USA, 2013. [Google Scholar] [CrossRef]
- Lu, F.; Lee, H.P.; Lim, S.P. Modeling and analysis of micro piezoelectric power generators for micro-electromechanical-systems applications. Smart Mater. Struct. 2003, 13, 57. [Google Scholar] [CrossRef]
- Erturk, A.; Inman, D.J. On Mechanical Modeling of Cantilevered Piezoelectric Vibration Energy Harvesters. J. Intell. Mater. Syst. Struct. 2008, 19. [Google Scholar] [CrossRef]
- Park, C.H. On the Circuit Model of Piezoceramics. J. Intell. Mater. Syst. Struct. 2001, 12. [Google Scholar] [CrossRef]
- Guan, M.J.; Liao, W.H. On the Equivalent Circuit Models of Piezoelectric Ceramics. Ferroelectrics 2009, 386. [Google Scholar] [CrossRef]
- Baker, J. Alternative Geometries for Increasing Power Density in Vibration Energy Scavenging. In Proceedings of the 3rd International Energy Conversion Engineering Conference, San Francisco, CA, USA, 15–18 August 2005.
- Benasciutti, D.; Moro, L.; Zelenika, S.; Brusa, E. Vibration energy scavenging via piezoelectric bimorphs of optimized shapes. Microsyst. Technol. 2010, 16. [Google Scholar] [CrossRef]
- Rosa, M.; De Marqui, C., Jr. Modeling and analysis of a piezoelectric energy harvester with varying cross-sectional area. Shock Vib. 2014, 2014. [Google Scholar] [CrossRef]
- Erturk, A.; Inman, D.J. An experimentally validated bimorph cantilever model for piezoelectric energy harvesting from base excitations. Smart Mater. Struct. 2009, 18, 025009. [Google Scholar] [CrossRef]
- Ben Ayed, S.; Abdelkefi, A.; Najar, F.; Hajj, M.R. Design and performance of variable-shaped piezoelectric energy harvesters. J. Intell. Mater. Syst. Struct. 2014, 25. [Google Scholar] [CrossRef]
- Goldschmidtboeing, F.; Woias, P. Characterization of different beam shapes for piezoelectric energy harvesting. J. Micromec. Microeng. 2008, 18. [Google Scholar] [CrossRef]
- Jackson, N.; O’Keeffe, R.; Waldron, F.; O’Neill, M.; Mathewson, A. Evaluation of low-acceleration MEMS piezoelectric energy harvesting devices. Microsyst. Technol. 2014, 20. [Google Scholar] [CrossRef]
© 2017 by the authors. Licensee MDPI, Basel, Switzerland. This article is an open access article distributed under the terms and conditions of the Creative Commons Attribution (CC BY) license ( http://creativecommons.org/licenses/by/4.0/).