
Wetting Resistance of Commercial Membrane Distillation Membranes in Waste Streams Containing Surfactants and Oil

 ,
, 
Abstract
:
1. Introduction
2. Materials and Methods
3. Results
3.1. Membrane Characterization
3.2. Prediction of Membrane Wetting with Sodium Dodecyl Sulfate
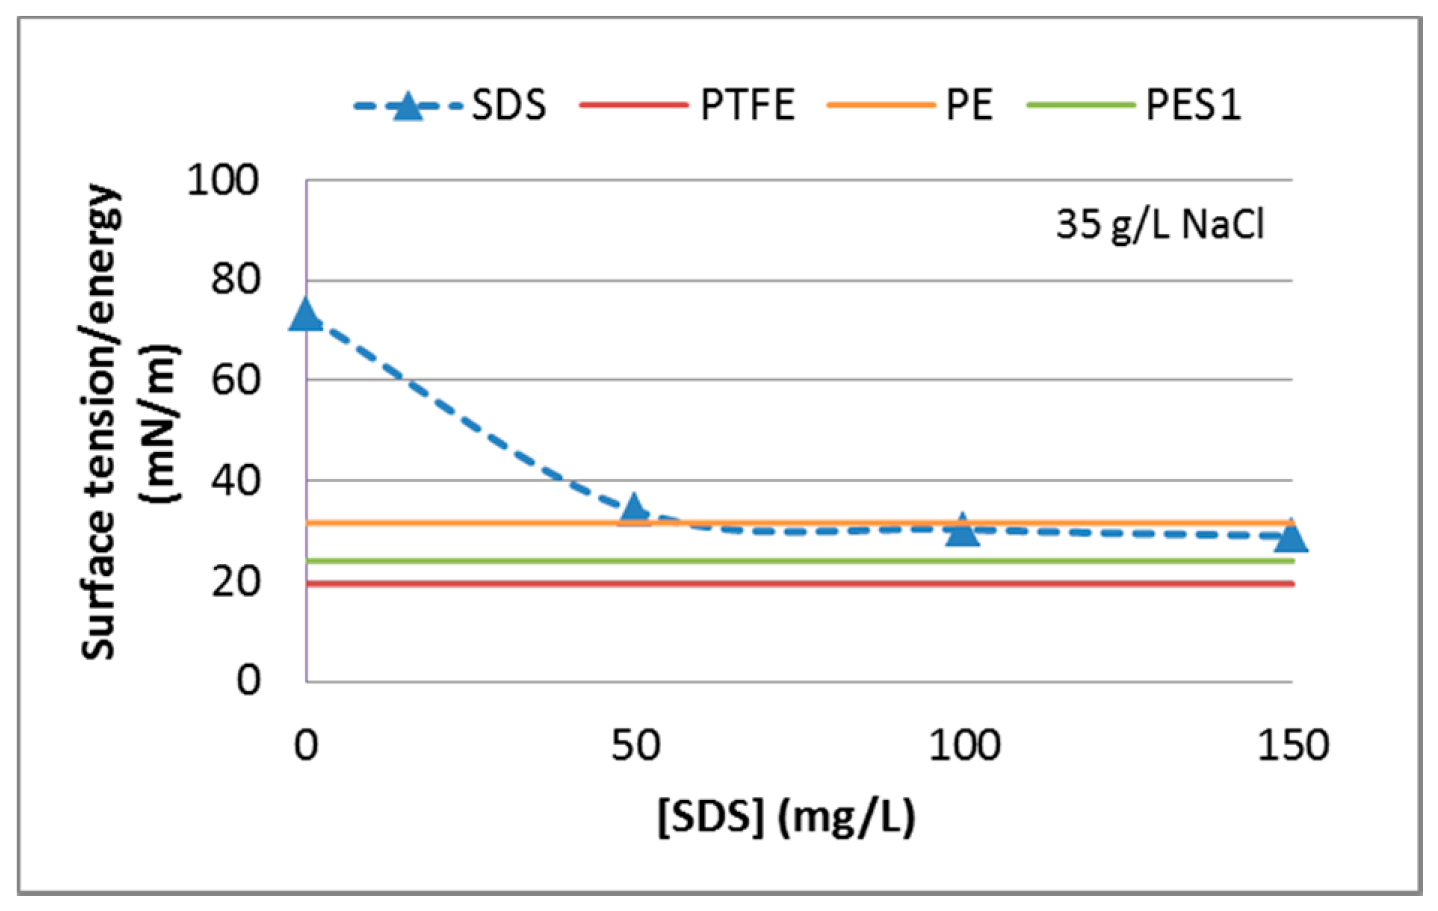
3.2.1. Surface Tension
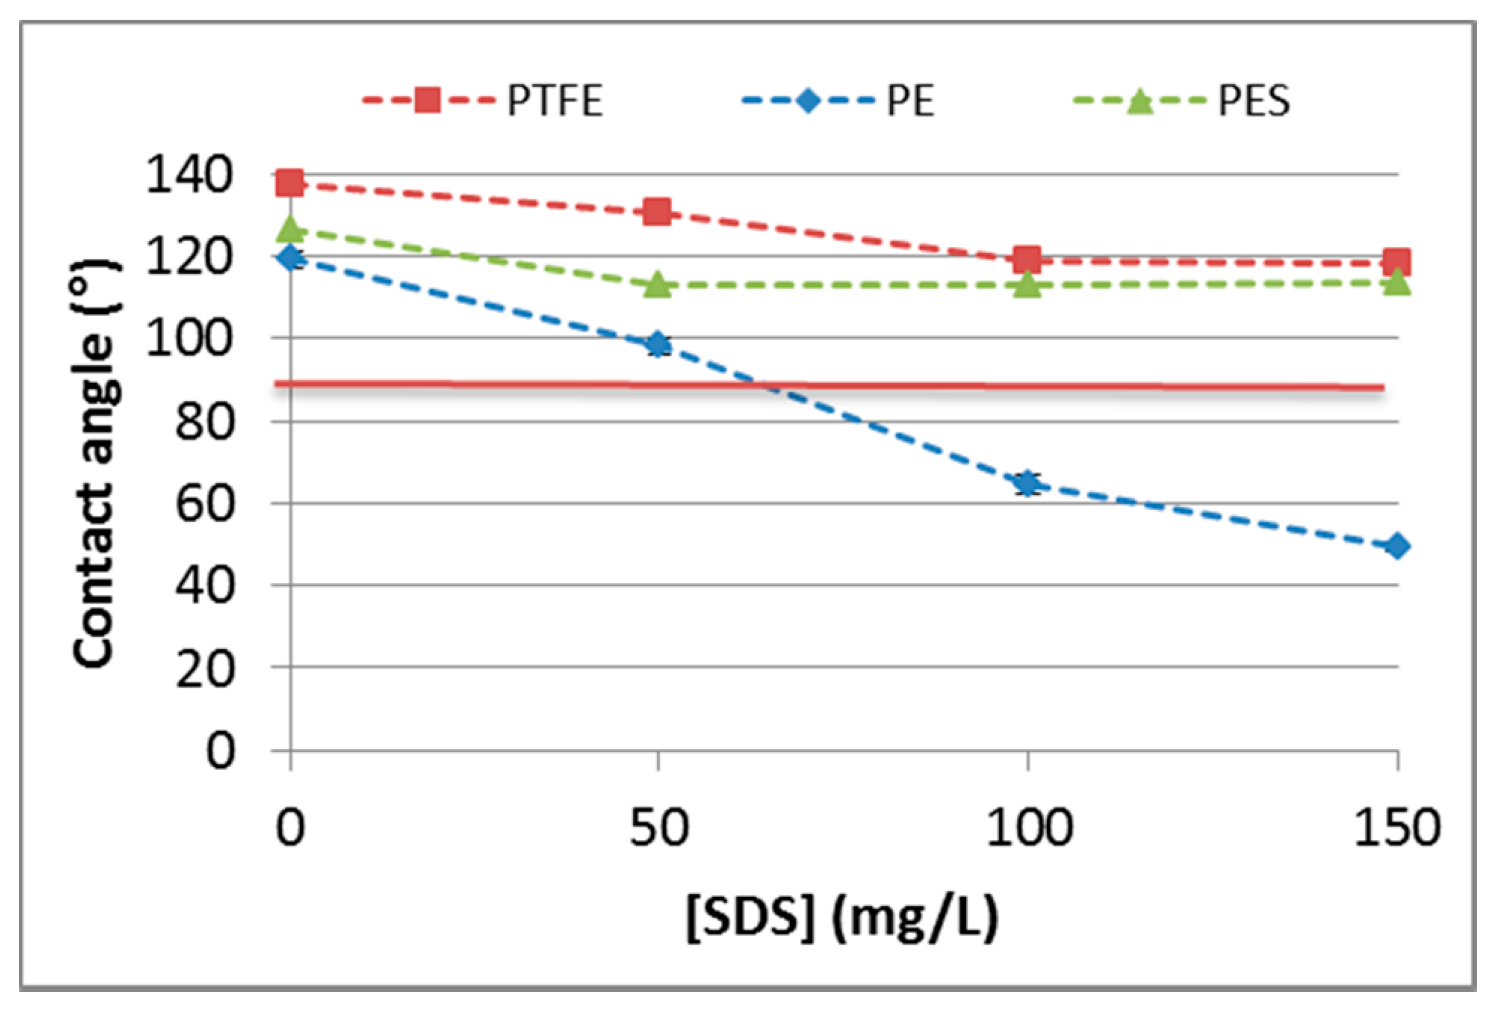
3.2.2. Contact Angle
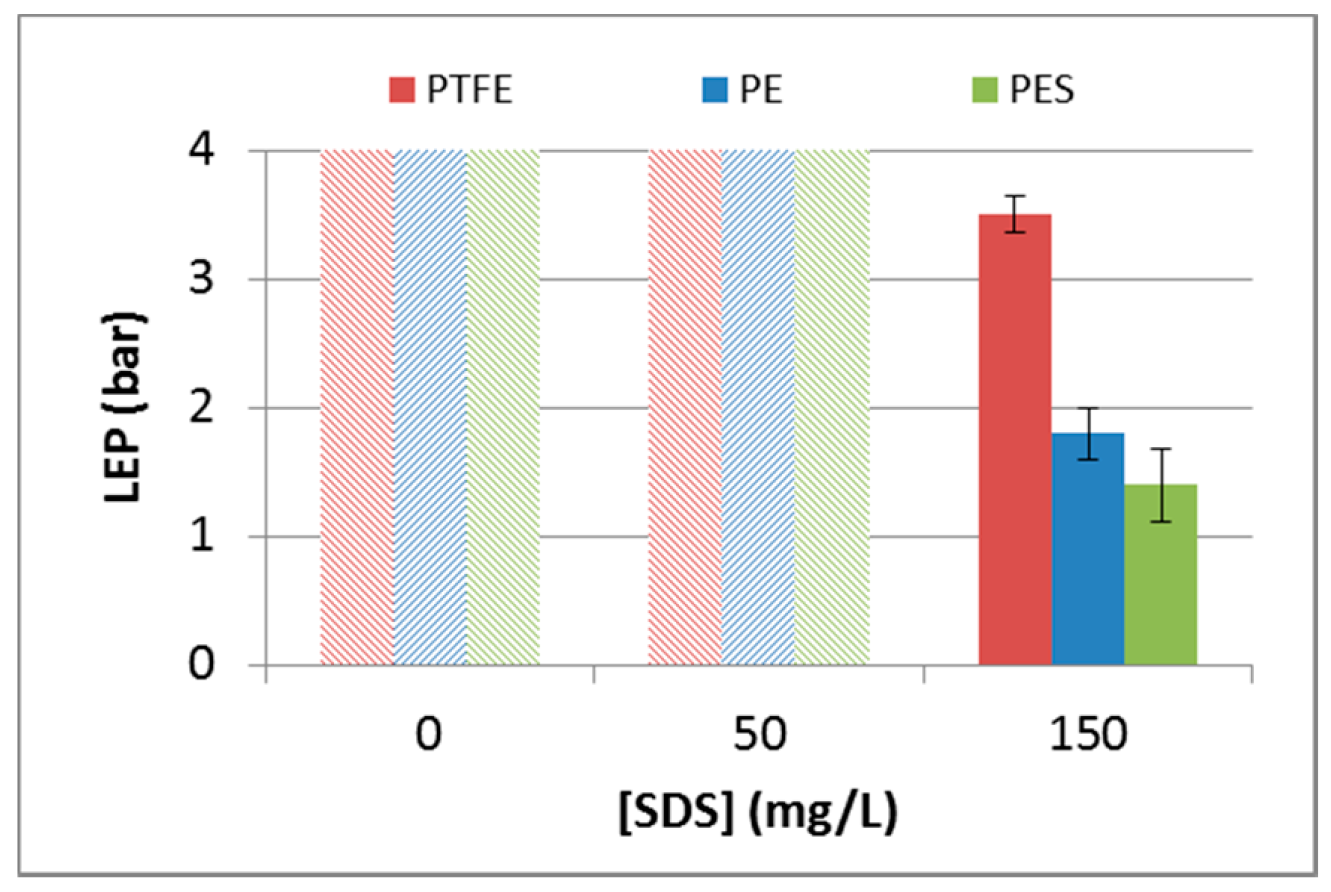
3.2.3. Liquid Entry Pressure
3.2.4. Wetting Prediction
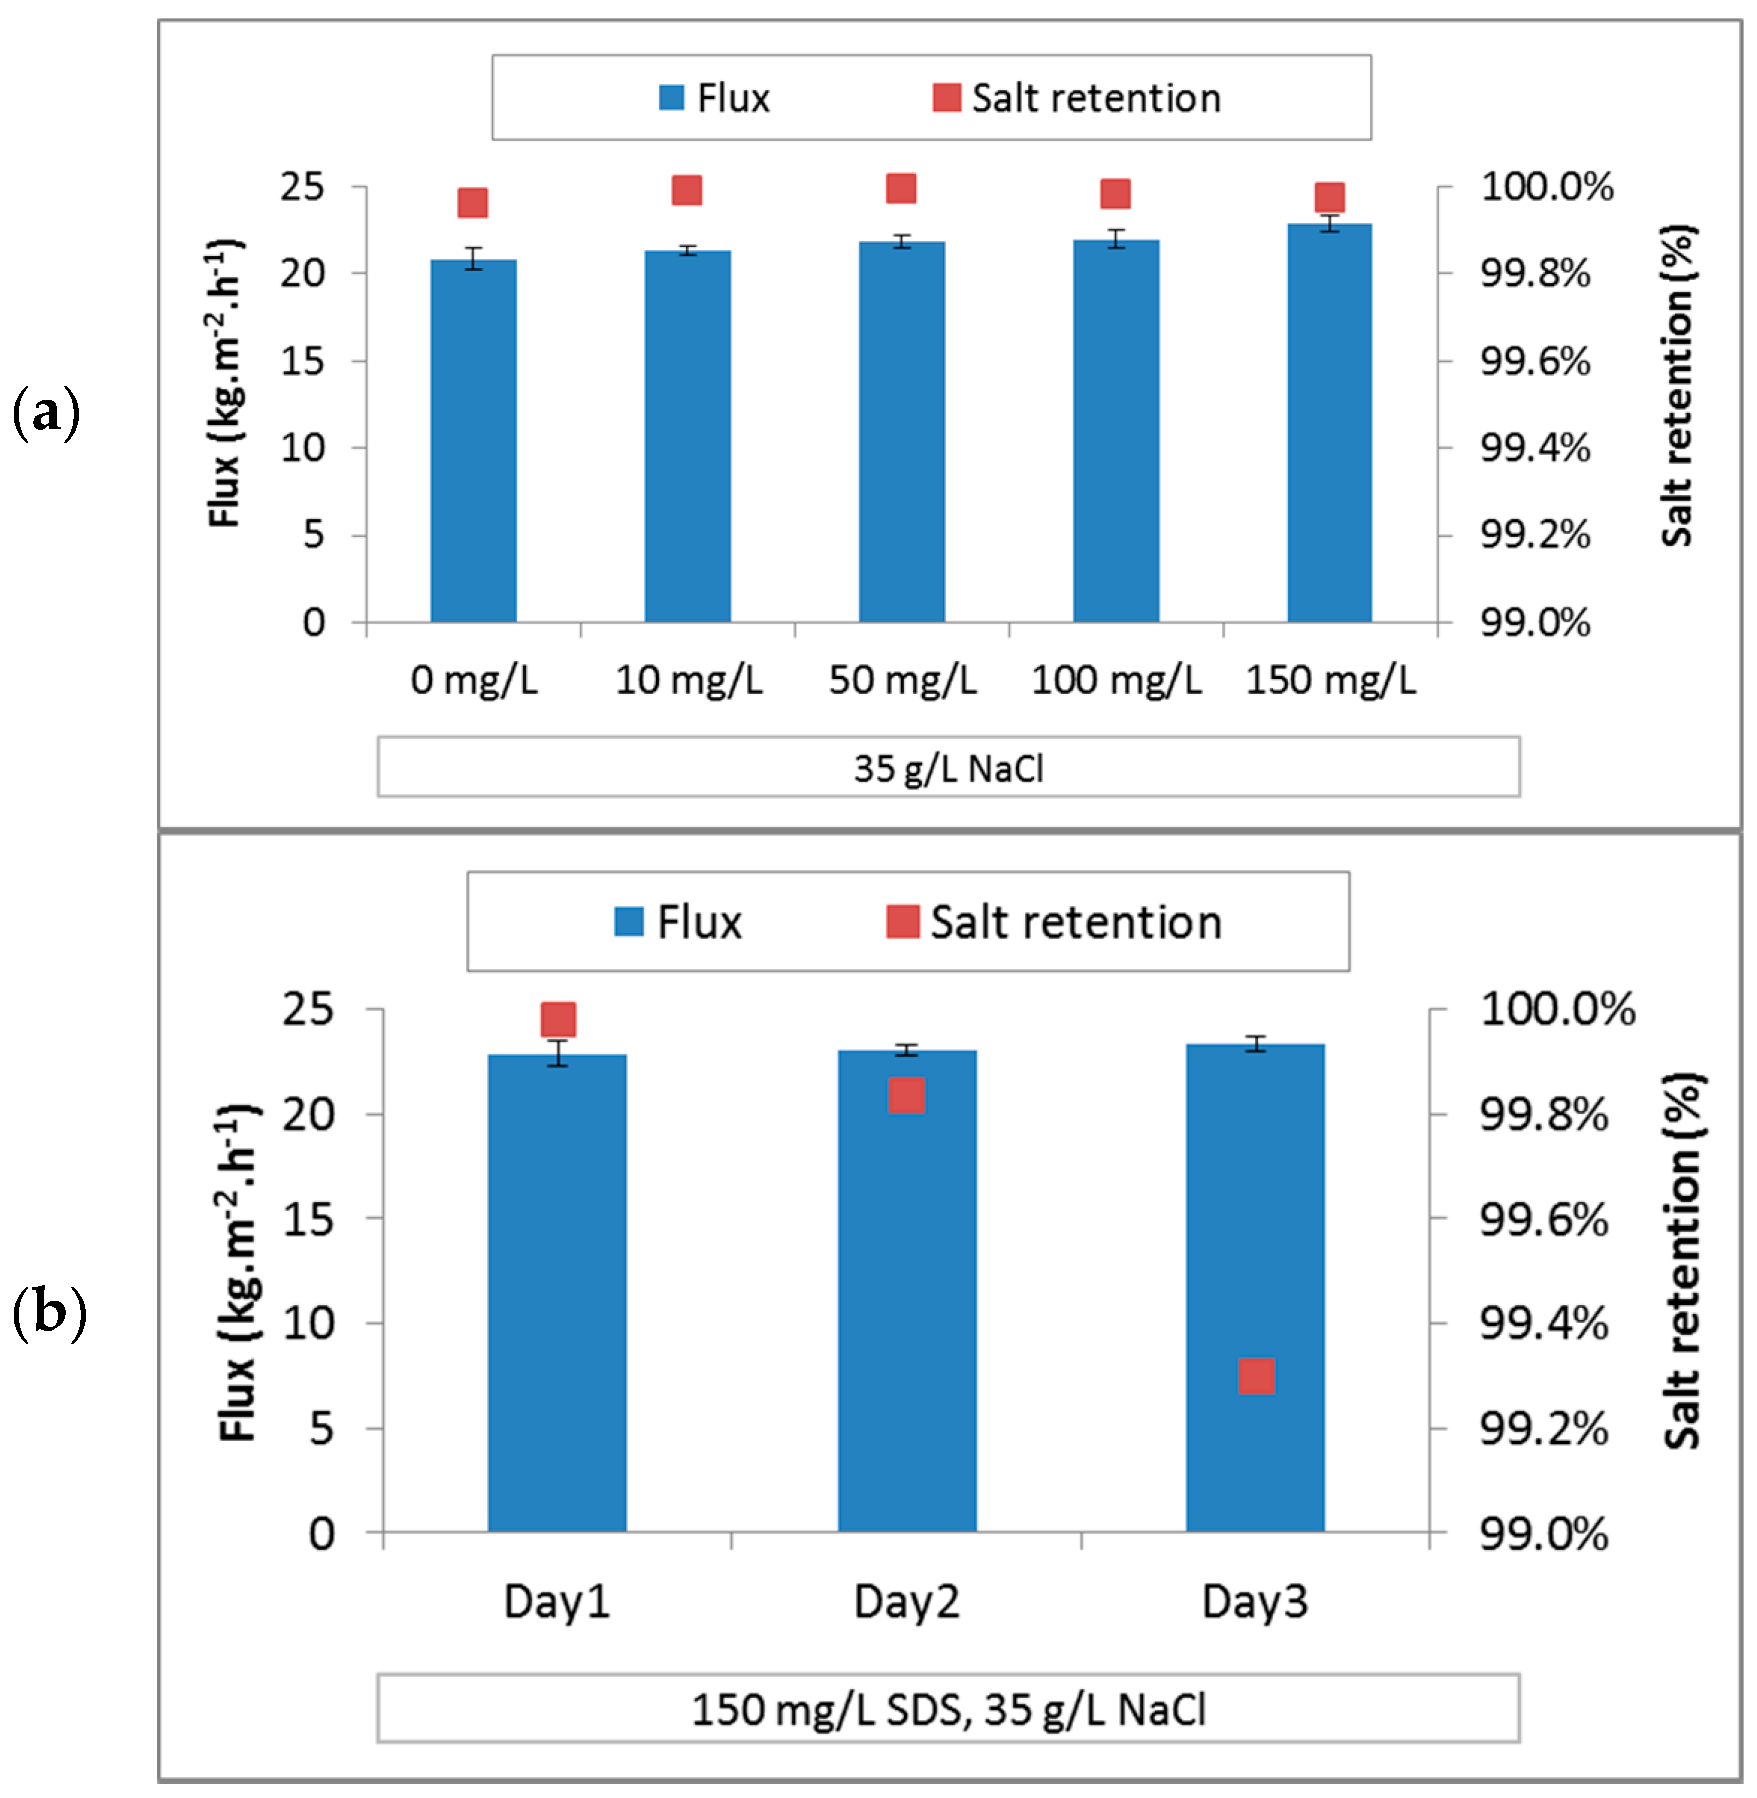
3.3. Membrane Distillation with SDS
3.3.1. PE
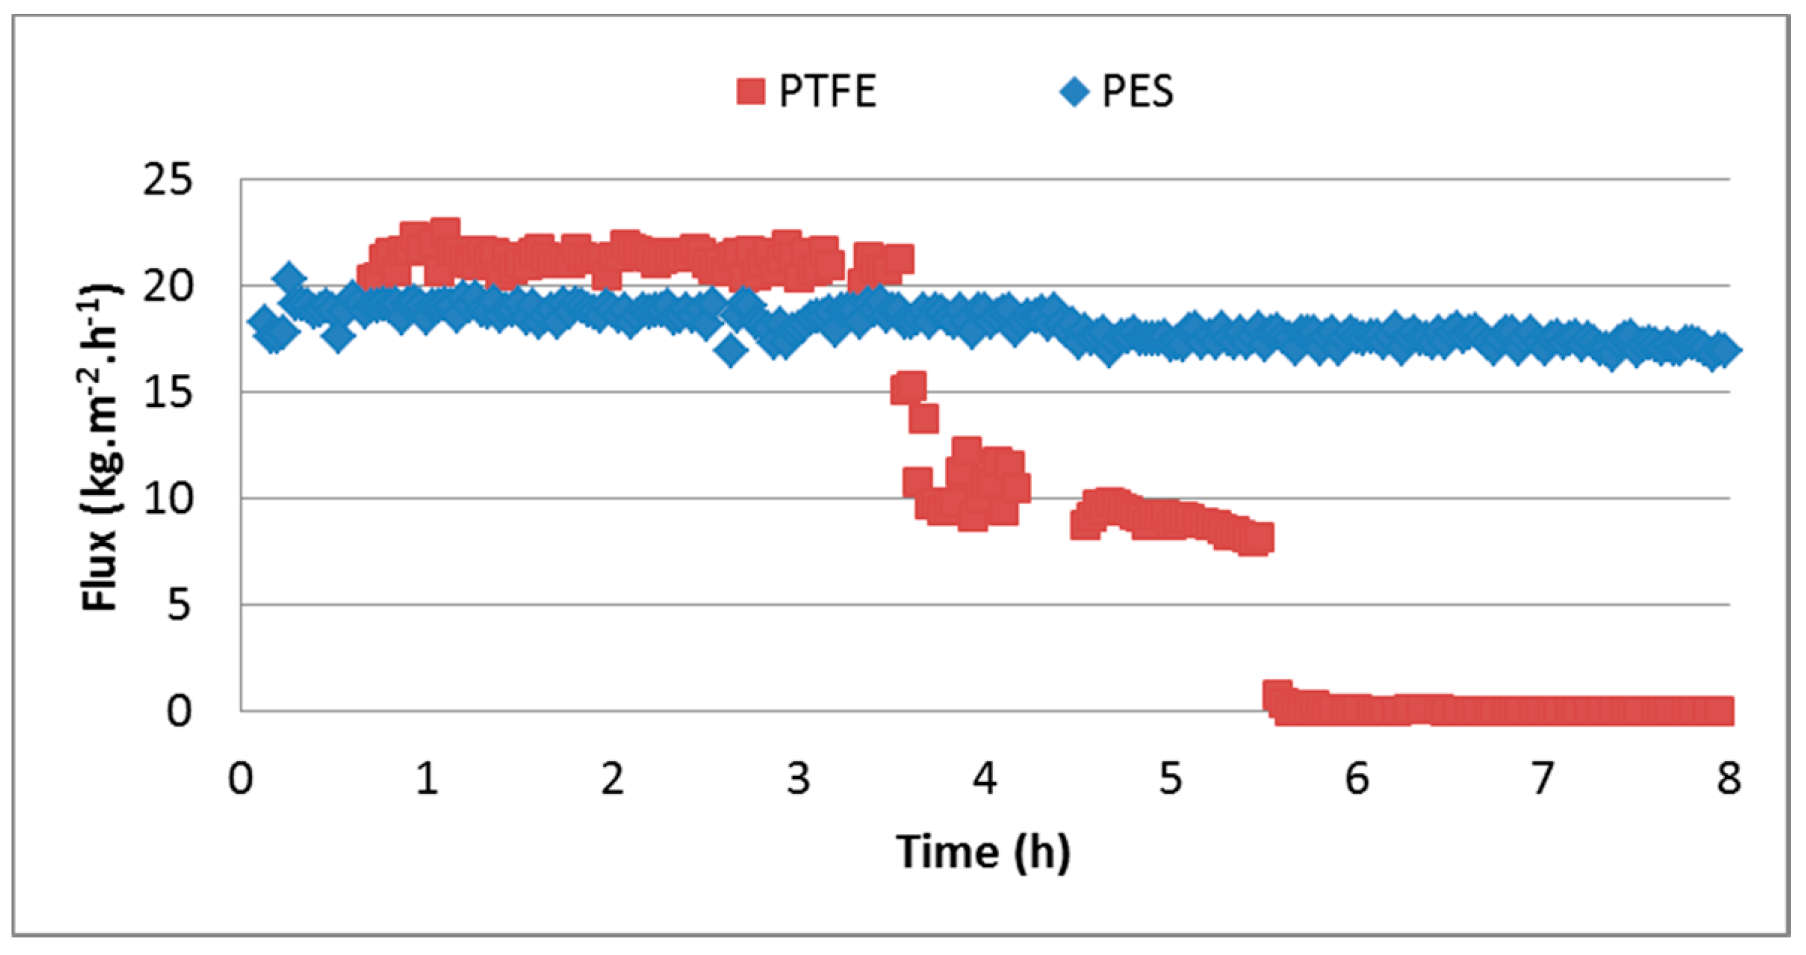
3.3.2. PTFE
3.3.3. PES
3.3.4. Summary
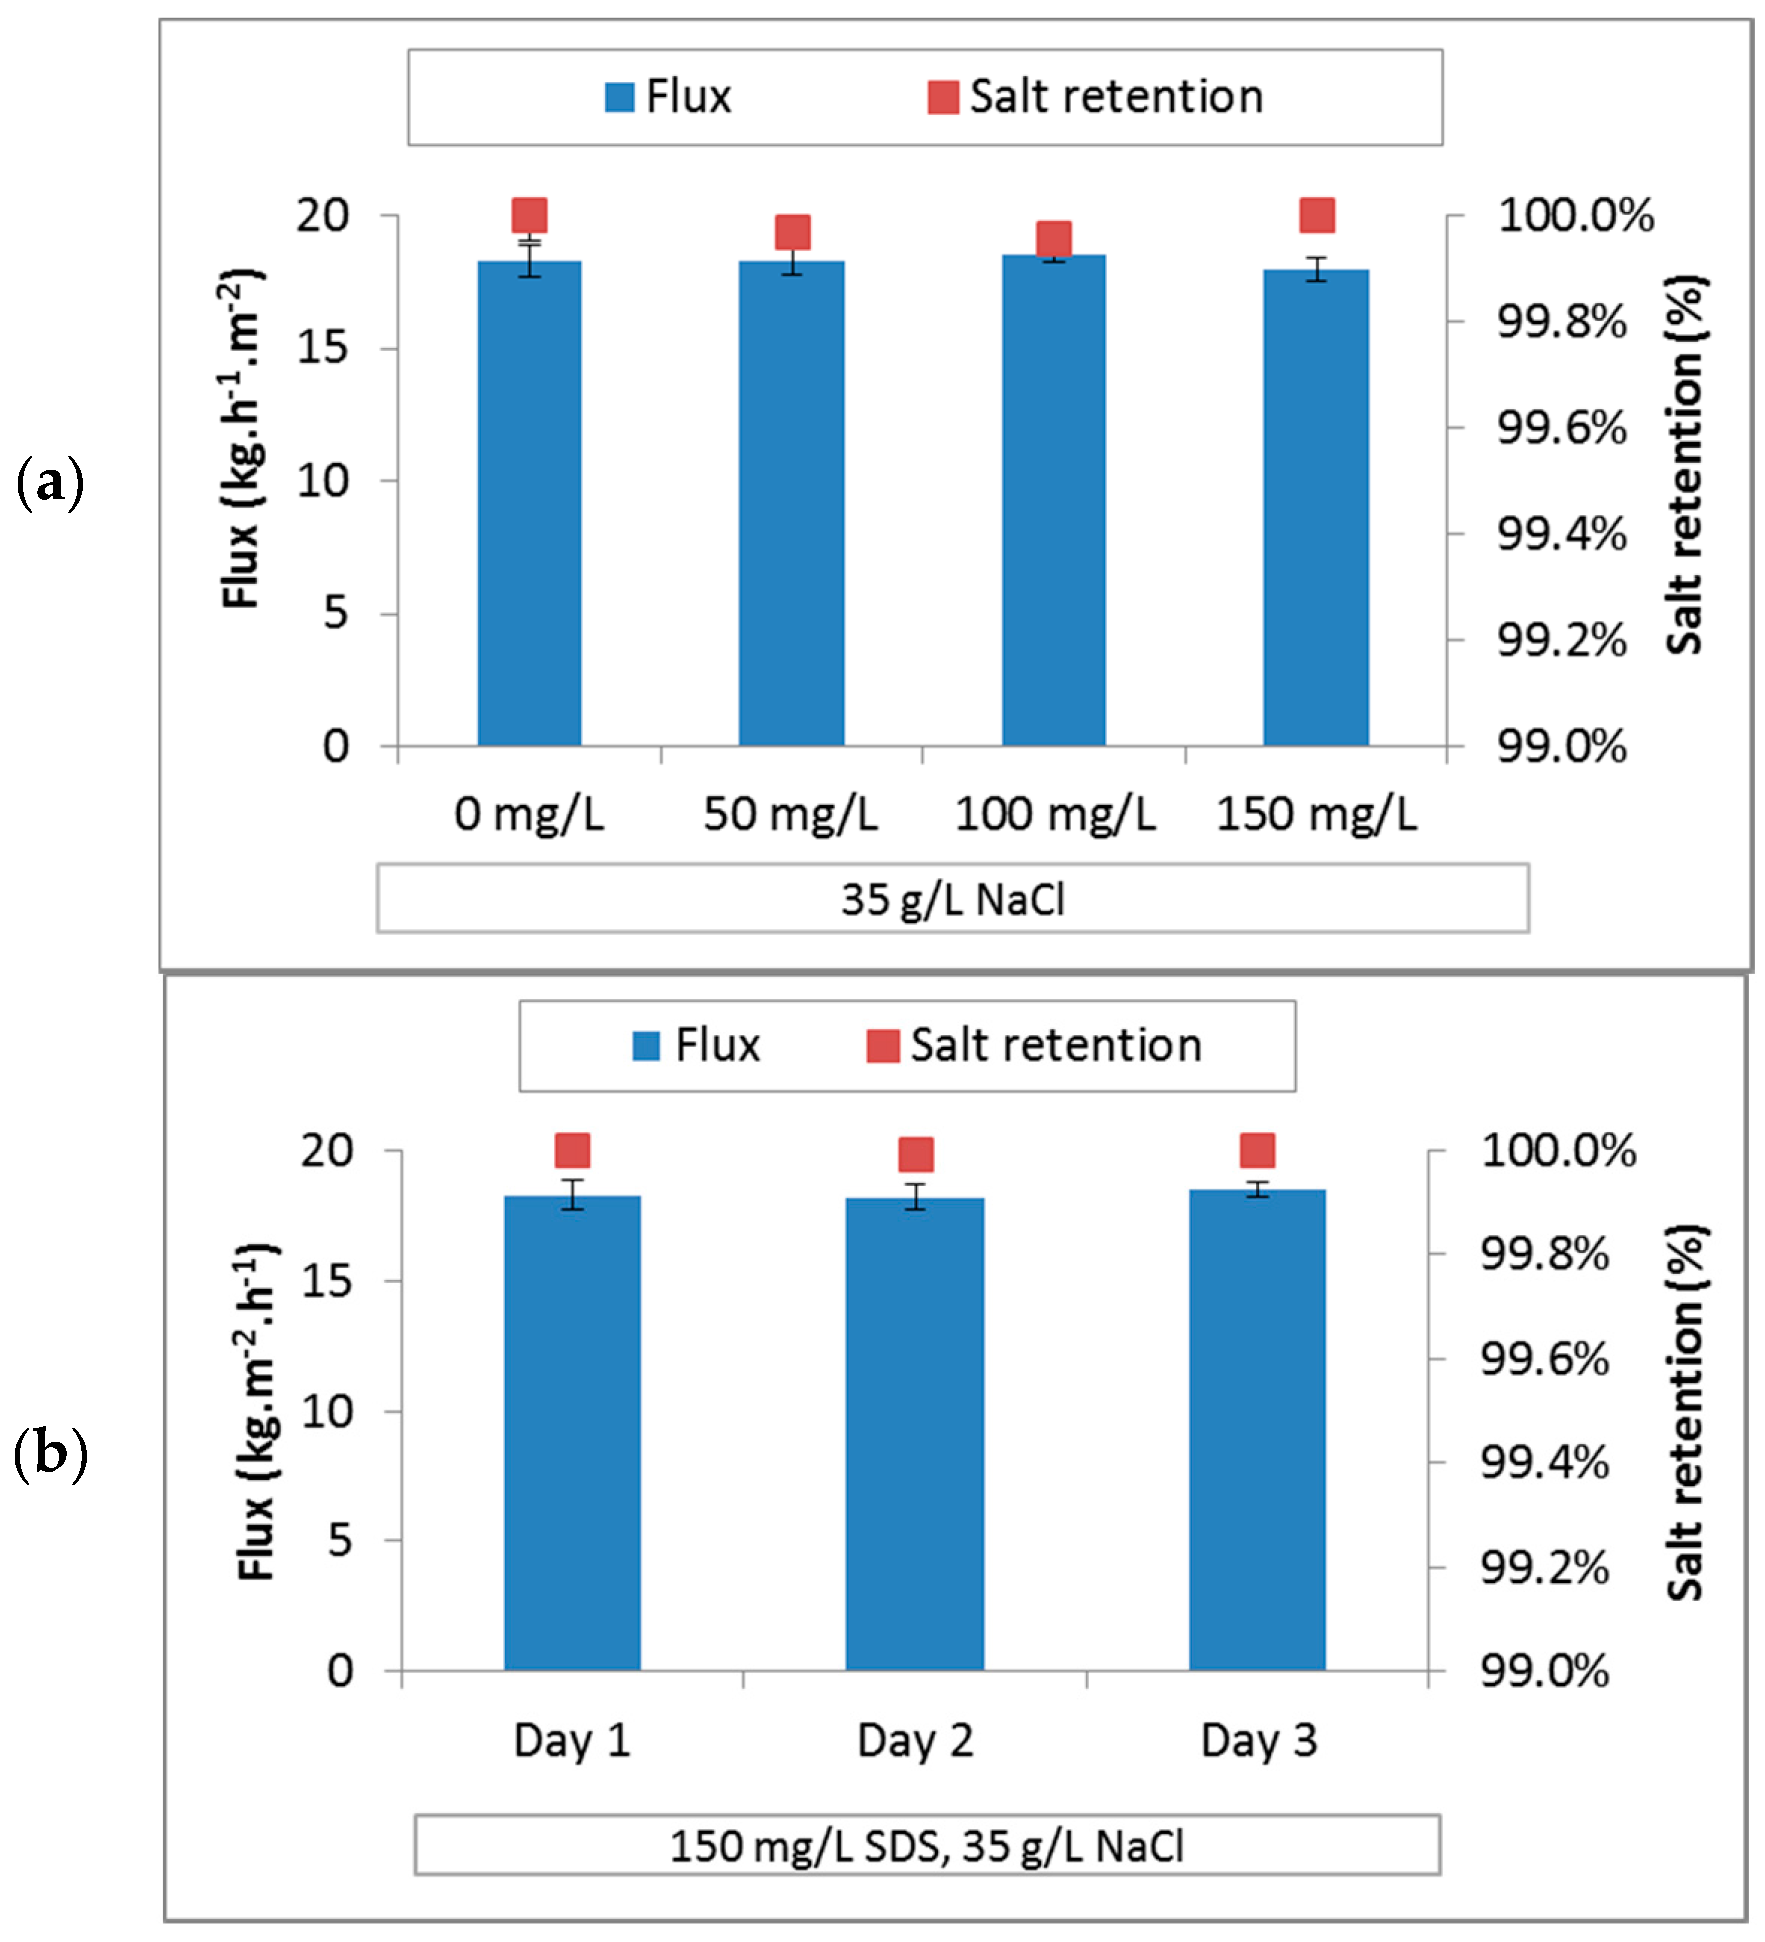
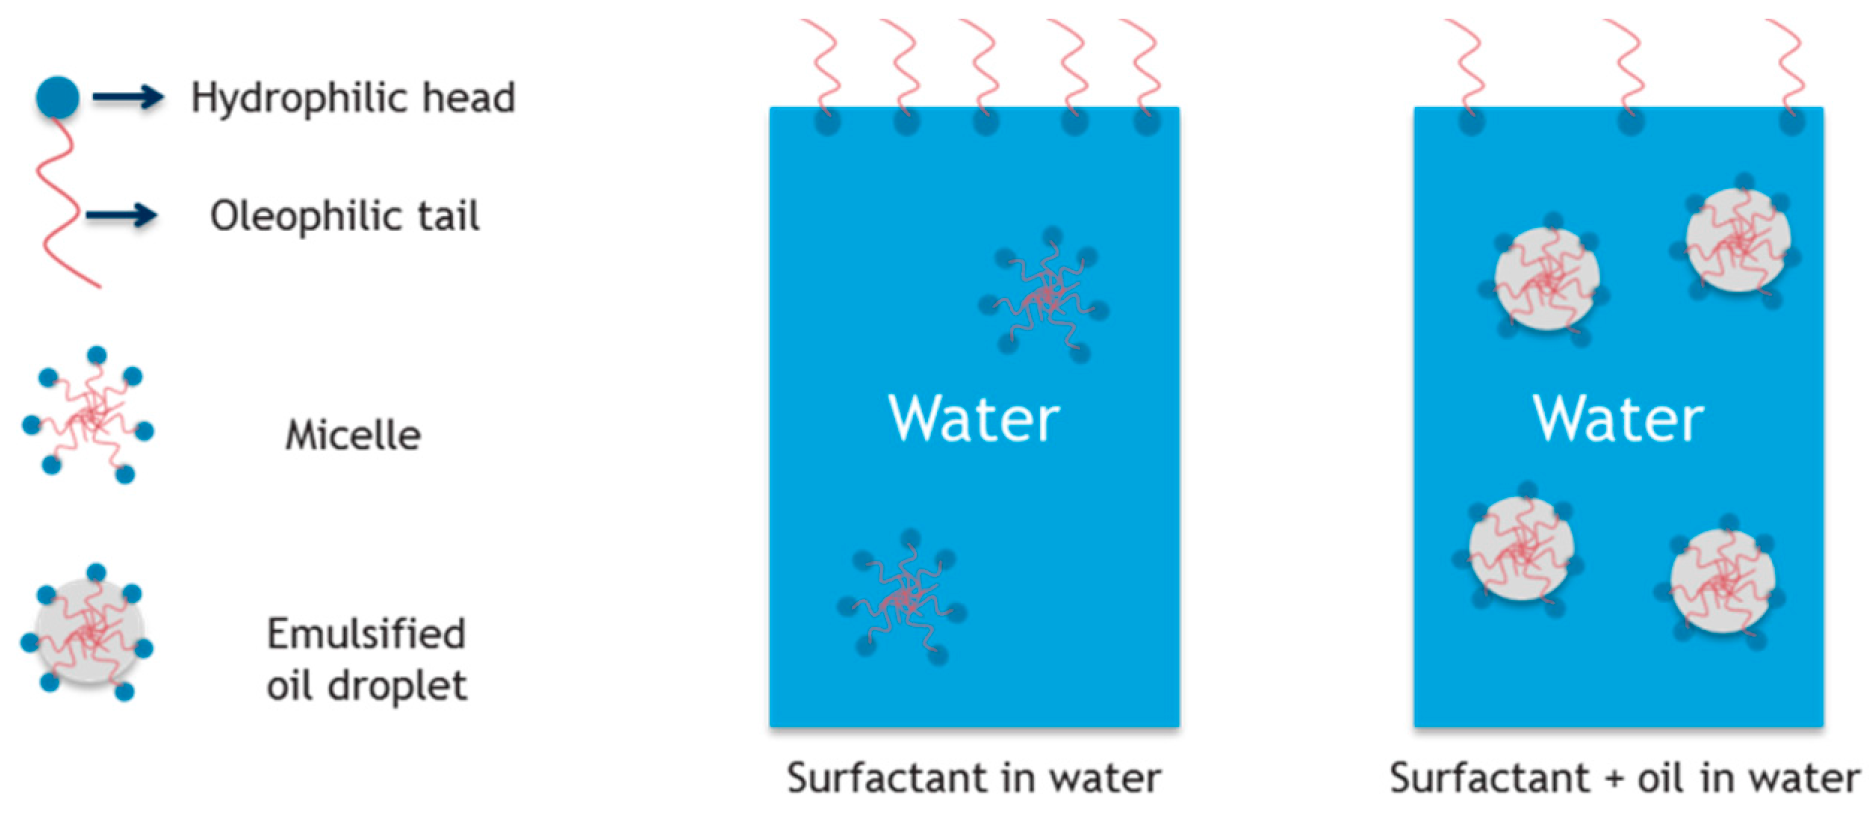
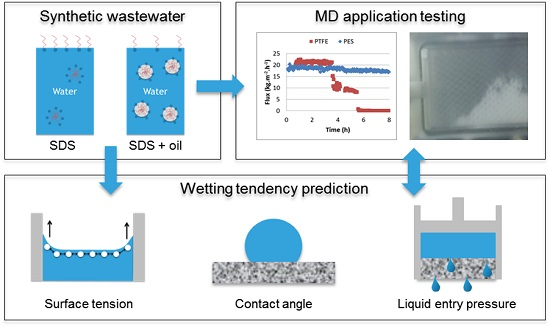
3.4. Synthetic Produced Water
3.4.1. Prediction of Membrane Wetting
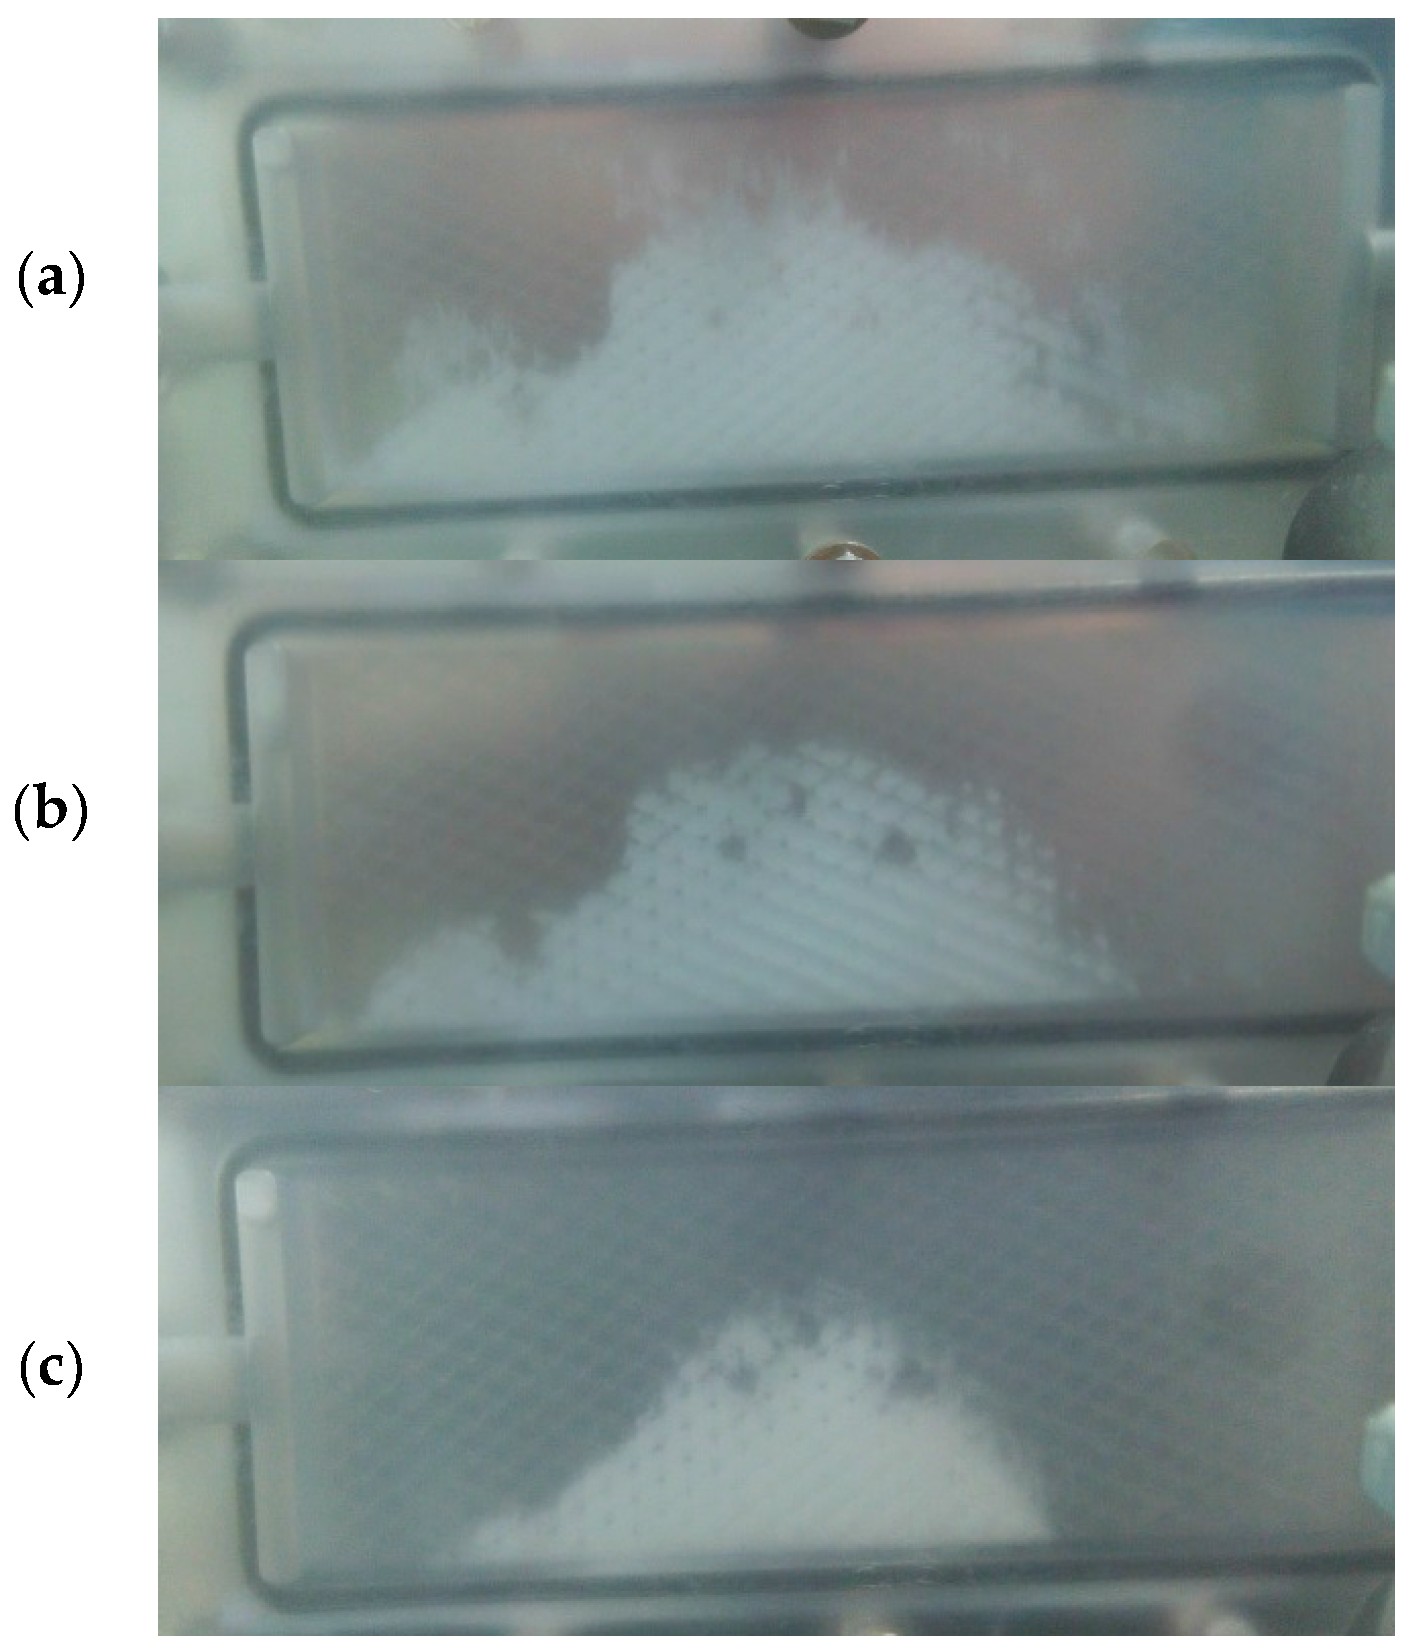
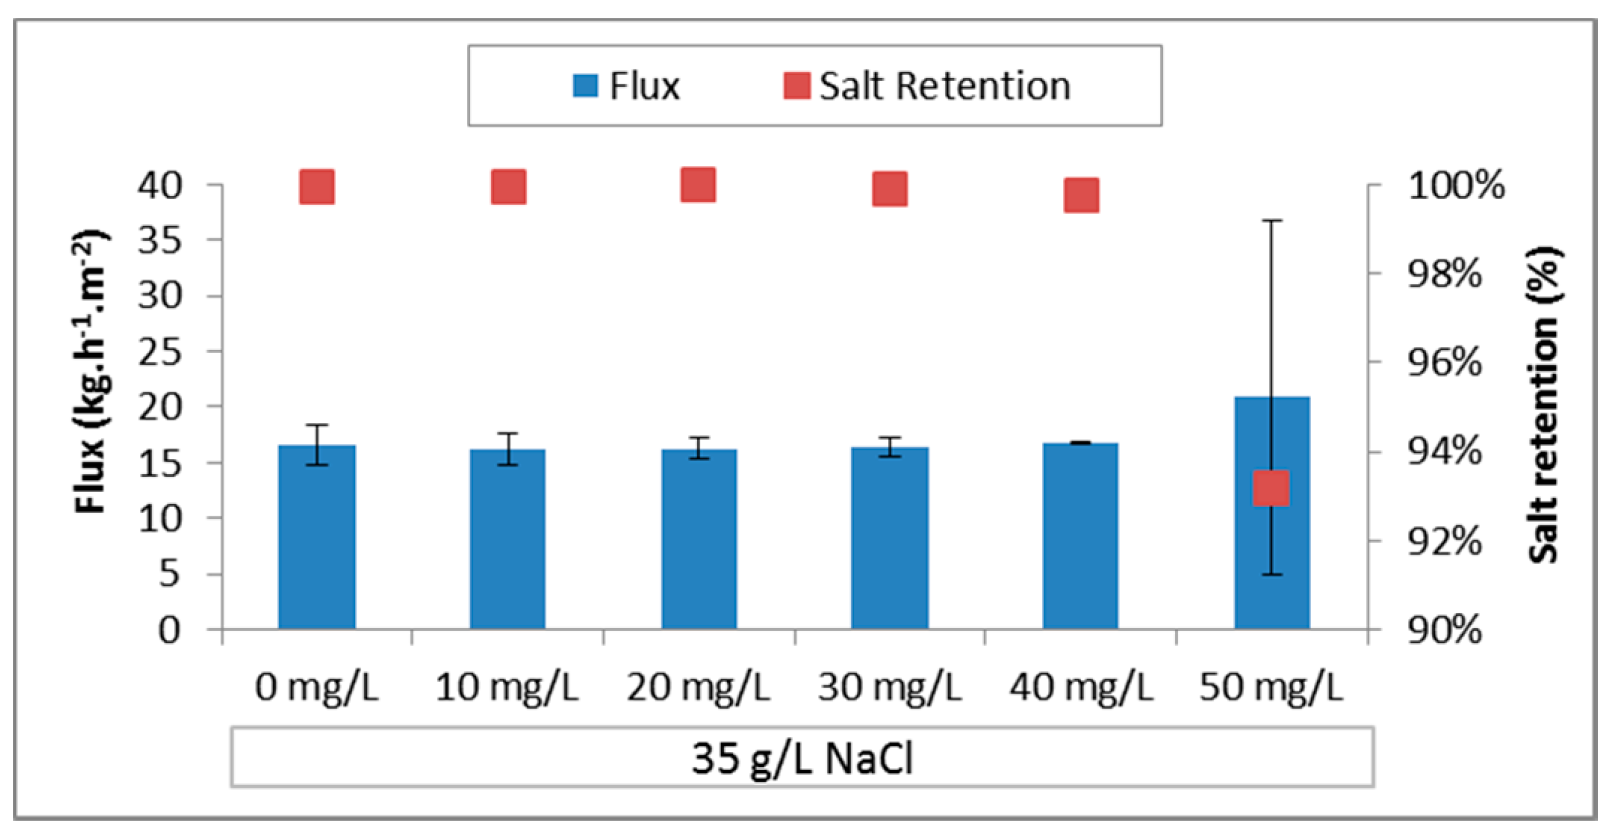
3.4.2. Membrane Distillation Testing
4. Conclusions
Acknowledgments
Author Contributions
Conflicts of Interest
References
- Lin, S.; Yip, N.Y.; Elimelech, M. Direct contact membrane distillation with heat recovery: Thermodynamic insights from module scale modeling. J. Membr. Sci. 2014, 453, 498–515. [Google Scholar] [CrossRef]
- Kesieme, U.K.; Milne, N.; Aral, H.; Cheng, C.Y.; Duke, M. Economic analysis of desalination technologies in the context of carbon pricing, and opportunities for membrane distillation. Desalination 2013, 323, 66–74. [Google Scholar] [CrossRef]
- Sha, D.L.; Chavez, L.H.A.; Ben-sasson, M.; Castrillo, S.R. Desalination and Reuse of High-Salinity Shale Gas Produced Water: Drivers, Technologies, and Future Directions. Environ. Sci. Technol. 2013, 47, 9569–9583. [Google Scholar]
- Alkhudhiri, A.; Darwish, N.; Hilal, N. Treatment of high salinity solutions: Application of air gap membrane distillation. Desalination 2012, 287, 55–60. [Google Scholar] [CrossRef]
- Duong, H.C.; Chivas, A.R.; Nelemans, B.; Duke, M.; Gray, S.; Cath, T.Y.; Nghiem, L.D. Treatment of RO brine from CSG produced water by spiral-wound air gap membrane distillation—A pilot study. Desalination 2015, 366, 121–129. [Google Scholar] [CrossRef]
- Ge, J.; Peng, Y.; Li, Z.; Chen, P.; Wang, S. Membrane fouling and wetting in a DCMD process for RO brine concentration. Desalination 2014, 344, 97–107. [Google Scholar] [CrossRef]
- Martinetti, C.R.; Childress, A.E.; Cath, T.Y. High recovery of concentrated RO brines using forward osmosis and membrane distillation. J. Membr. Sci. 2009, 331, 31–39. [Google Scholar] [CrossRef]
- Criscuoli, A.; Zhong, J.; Figoli, A.; Carnevale, M.C.; Huang, R.; Drioli, E. Treatment of dye solutions by vacuum membrane distillation. Water Res. 2008, 42, 5031–5037. [Google Scholar] [CrossRef] [PubMed]
- El-Abbassi, A.; Hafidi, A.; Khayet, M.; García-Payo, M.C. Integrated direct contact membrane distillation for olive mill wastewater treatment. Desalination 2013, 323, 31–38. [Google Scholar] [CrossRef]
- Prince, J.A.; Singh, G.; Rana, D.; Matsuura, T.; Anbharasi, V.; Shanmugasundaram, T.S. Preparation and characterization of highly hydrophobic poly(vinylidene fluoride)-Clay nanocomposite nanofiber membranes (PVDF-clay NNMs) for desalination using direct contact membrane distillation. J. Membr. Sci. 2012, 397–398, 80–86. [Google Scholar] [CrossRef]
- Thiel, G.P.; Tow, E.W.; Banchik, L.D.; Chung, H.W.; Lienhard, J.H. Energy consumption in desalinating produced water from shale oil and gas extraction. Desalination 2015, 366, 94–112. [Google Scholar] [CrossRef]
- Warsinger, D.M.; Swaminathan, J.; Guillen-Burrieza, E.; Arafat, H.A.; Lienhard, J.H. Scaling and fouling in membrane distillation for desalination applications: A review. Desalination 2015, 356, 294–313. [Google Scholar] [CrossRef]
- Hausmann, A.; Sanciolo, P.; Vasiljevic, T.; Weeks, M.; Schroën, K.; Gray, S.; Duke, M. Fouling mechanisms of dairy streams during membrane distillation. J. Membr. Sci. 2013, 441, 102–111. [Google Scholar] [CrossRef]
- Tijing, L.D.; Woo, Y.C.; Choi, J.S.; Lee, S.; Kim, S.H.; Shon, H.K. Fouling and its control in membrane distillation—A review. J. Membr. Sci. 2015, 475, 215–244. [Google Scholar] [CrossRef]
- Hausmann, A.; Sanciolo, P.; Vasiljevic, T.; Weeks, M.; Schroën, K.; Gray, S.; Duke, M. Fouling of dairy components on hydrophobic polytetrafluoroethylene (PTFE) membranes for membrane distillation. J. Membr. Sci. 2013, 442, 149–159. [Google Scholar] [CrossRef]
- Nguyen, Q.M.; Lee, S. Fouling analysis and control in a DCMD process for SWRO brine. Desalination 2015, 367, 21–27. [Google Scholar] [CrossRef]
- Guillen-Burrieza, E.; Ruiz-Aguirre, A.; Zaragoza, G.; Arafat, H.A. Membrane fouling and cleaning in long term plant-scale membrane distillation operations. J. Membr. Sci. 2014, 468, 360–372. [Google Scholar] [CrossRef]
- Curcio, E.; Ji, X.; Di Profio, G.; Sulaiman, A.O.; Fontananova, E.; Drioli, E. Membrane distillation operated at high seawater concentration factors: Role of the membrane on CaCO3 scaling in presence of humic acid. J. Membr. Sci. 2010, 346, 263–269. [Google Scholar] [CrossRef]
- Nghiem, L.D.; Cath, T. A scaling mitigation approach during direct contact membrane distillation. Sep. Purif. Technol. 2011, 80, 315–322. [Google Scholar] [CrossRef]
- Garcia-Payo, M.M.C.; Izquierdo-Gil, M.A.M.; Fernandez-Pineda, C. Wetting Study of Hydrophobic Membranes via Liquid Entry Pressure Measurements with Aqueous Alcohol Solutions. J. Colloid Interface Sci. 2000, 230, 420–431. [Google Scholar] [CrossRef] [PubMed]
- Gryta, M.; Barancewicz, M. Influence of morphology of PVDF capillary membranes on the performance of direct contact membrane distillation. J. Membr. Sci. 2010, 358, 158–167. [Google Scholar] [CrossRef]
- Gryta, M. Concentration of NaCl solution by membrane distillation integrated with crystallization. Sep. Sci. Technol. 2002, 37, 3535–3558. [Google Scholar] [CrossRef]
- Bilad, M.R.; Guillen-Burrieza, E.; Mavukkandy, M.O.; Al Marzooqi, F.A.; Arafat, H.A. Shrinkage, defect and membrane distillation performance of composite PVDF membranes. Desalination 2015, 376, 62–72. [Google Scholar] [CrossRef]
- Lalia, B.S.; Guillen-Burrieza, E.; Arafat, H.A.; Hashaikeh, R. Fabrication and characterization of polyvinylidenefluoride-co-hexafluoropropylene (PVDF-HFP) electrospun membranes for direct contact membrane distillation. J. Membr. Sci. 2013, 428, 104–115. [Google Scholar] [CrossRef]
- Franken, A.C.M.; Nolten, J.A.M.; Mulder, M.H.V.; Bargeman, D.; Smolders, C.A. Wetting criteria for the applicability of membrane distillation. J. Membr. Sci. 1987, 33, 315–328. [Google Scholar] [CrossRef]
- Lin, S.; Nejati, S.; Boo, C.; Hu, Y.; Osuji, C.O.; Elimelech, M. Omniphobic Membrane for Robust Membrane Distillation. Environ. Sci. Technol. Lett. 2014, 1, 443–447. [Google Scholar] [CrossRef]
- Wang, Z.; Hou, D.; Lin, S. Composite Membrane with Underwater-Oleophobic Surface for Anti-Oil-Fouling Membrane Distillation. Environ. Sci. Technol. 2016, 50, 3866–3874. [Google Scholar] [CrossRef] [PubMed]
- Zuo, G.; Wang, R. Novel membrane surface modification to enhance anti-oil fouling property for membrane distillation application. J. Membr. Sci. 2013, 447, 26–35. [Google Scholar] [CrossRef]
- Mustafa, G.; Wyns, K.; Buekenhoudt, A.; Meynen, V. Antifouling grafting of ceramic membranes validated in a variety of challenging wastewaters. Water Res. 2016, 104, 242–253. [Google Scholar] [CrossRef] [PubMed]
- Khayet, M.; Matsuura, T. Preparation and Characterization of Polyvinylidene Fluoride Membranes for Membrane Distillation. Ind. Eng. Chem. Res. 2001, 40, 5710–5718. [Google Scholar] [CrossRef]
- Eykens, L.; De Sitter, K.; Dotremont, C.; Pinoy, L.; Van der Bruggen, B. Characterization and performance evaluation of commercially available hydrophobic membranes for direct contact membrane distillation. Desalination 2016, 392, 63–73. [Google Scholar] [CrossRef]
- Eykens, L.; Hitsov, I.; De Sitter, K.; Dotremont, C.; Pinoy, L.; Nopens, I.; Van der Bruggen, B. Influence of membrane thickness and process conditions on direct contact membrane distillation at different salinities. J. Membr. Sci. 2016, 498, 353–364. [Google Scholar] [CrossRef]
- Hernáinz-Bermúdez de Castro, F.; Gálvez-Borrego, A.; Calero-de Hoces, M. Surface Tension of Aqueous Solutions of Sodium Dodecyl Sulfate from 20 °C to 50 °C and pH between 4 and 12. J. Chem. Eng. Data 1998, 43, 717–718. [Google Scholar] [CrossRef]
- Kloubek, J. Measurement of the dynamic surface tension by the maximum bubble pressure method. IV. Surface tension of aqueous solutions of sodium dodecyl sulfate. J. Colloid Interface Sci. 1972, 41, 17–22. [Google Scholar] [CrossRef]
- Owens, D.K.D. The dynamic surface tension of sodium dodecyl sulfate solutions. J. Colloid Interface Sci. 1969, 29, 496–501. [Google Scholar] [CrossRef]
- Hitsov, I.; Eykens, L.; De Schepper, W.; De Sitter, K.; Dotremont, C.; Nopens, I. Full-scale Direct Contact Membrane Distillation (DCMD) model including membrane compaction effects. J. Membr. Sci. 2017, 524, 245–256. [Google Scholar] [CrossRef]
- Winter, D.; Koschikowski, J.; Wieghaus, M. Desalination using membrane distillation: Experimental studies on full scale spiral wound modules. J. Membr. Sci. 2011, 375, 104–112. [Google Scholar] [CrossRef]


| Membrane | δ (µm) | ε (%) | dmean (µm) | dmax (µm) | θwater (°) | θhexadecane (°) | LEP (bar) |
|---|---|---|---|---|---|---|---|
| PE | 99 | 76% | 0.30 | 0.43 | 138 | 0 | 3.9 |
| PES | 81 | 58% | 0.51 | 0.59 | 132 | 92 | 4 |
| PTFE | 77 | 83% | 0.17 | 0.19 | 120 | 0 | 10.8 |
© 2017 by the authors. Licensee MDPI, Basel, Switzerland. This article is an open access article distributed under the terms and conditions of the Creative Commons Attribution (CC BY) license ( http://creativecommons.org/licenses/by/4.0/).
Share and Cite
Eykens, L.; De Sitter, K.; Dotremont, C.; De Schepper, W.; Pinoy, L.; Van Der Bruggen, B. Wetting Resistance of Commercial Membrane Distillation Membranes in Waste Streams Containing Surfactants and Oil. Appl. Sci. 2017, 7, 118. https://doi.org/10.3390/app7020118
Eykens L, De Sitter K, Dotremont C, De Schepper W, Pinoy L, Van Der Bruggen B. Wetting Resistance of Commercial Membrane Distillation Membranes in Waste Streams Containing Surfactants and Oil. Applied Sciences. 2017; 7(2):118. https://doi.org/10.3390/app7020118
Chicago/Turabian StyleEykens, Lies, Kristien De Sitter, Chris Dotremont, Wim De Schepper, Luc Pinoy, and Bart Van Der Bruggen. 2017. "Wetting Resistance of Commercial Membrane Distillation Membranes in Waste Streams Containing Surfactants and Oil" Applied Sciences 7, no. 2: 118. https://doi.org/10.3390/app7020118
APA StyleEykens, L., De Sitter, K., Dotremont, C., De Schepper, W., Pinoy, L., & Van Der Bruggen, B. (2017). Wetting Resistance of Commercial Membrane Distillation Membranes in Waste Streams Containing Surfactants and Oil. Applied Sciences, 7(2), 118. https://doi.org/10.3390/app7020118