1. Introduction
Fiber gratings refer to periodic structures that change according to the refractive index (RI) of the core of photosensitive optical fibers. According to the periodic length of fiber gratings, they can be categorized as short- or long-period fiber gratings. Short-period fiber gratings, also known as fiber Bragg gratings (FBGs), were first proposed by Hill et al. at the Canadian Communication Center in 1978 [
1,
2,
3]. Of all related methods currently used to produce FBGs, the interferometric and phase mask methods are the most common ones. The interferometric method involves irradiating a photosensitive optical fiber with two interleaved beams of UV light; the UV light wavelength or angle between the interleaved beams is adjusted to change the RI of the optical fiber, thereby producing the desired fiber grating. The phase mask method involves irradiating UV light onto a phase mask, which creates constructive and destructive interference in the core of the photosensitive optical fiber. Changes in energy intensity then cause the RI of the optical fiber to display a periodic distribution [
4,
5,
6].
Optical add/drop multiplexers (OADMs) are key components for creating wavelength-division multiplexers (WDMs) in fiber-optic communication networks. The main function of an OADM is to drop or add a client signal in the fiber-optic communication network. Specifically, OADMs employ wavelength division multiplexing techniques in the frequency domain to emulate the time division multiplexing capabilities of the traditional synchronous digital hierarchy standard in the time domain. In the past several decades, numerous types of OADM have been proposed, many of which are widely used in various fiber-optic communication systems [
7,
8,
9,
10,
11,
12]. Of all of the currently available OADMs, the most common one is composed of an FBG and two optical circulators. However, this particular OADM is disadvantageous because of its large size and high-cost, complex production process.
To overcome the disadvantages of current OADMs, the present study referenced optical coupling theory to develop a novel high-performance FBG-OADM model comprising two single mode fibers (SMFs), which are placed side by side so that they work in the same manner as a 2 × 2 optical fiber coupler, and two FBGs, which have identical parameters so that the they work in the same manner as a mode coupler. In contrast to traditional OADMs, the proposed FBG-OADM is advantageous because it is a miniature-sized all-optical fiber-based multiplexer that can be fabricated through a low-cost and simple manufacturing process [
12]. In researching and designing the proposed FBG-OADM, this study combined the finite element method (FEM) and eigenmode expansion method (EEM) to perform numerical simulations for calculation and analysis.
The remainder of this paper is organized as follows:
Section 2 details the geometric structure, parameters, and working principle of the proposed FBG-OADM. Optical coupling theory is used to explain how the FBG-OADM achieves outstanding bandwidth performance (−3 dB). In addition, to minimize discrepancies between simulations and actual performance results, a perfectly matched layer (PML) and perfectly reflecting boundary (PRB) were integrated into the FBG-OADM design.
Section 3 explains how the FEM technique was used to solve and analyze the FBG-OADM mode. To obtain suitable mesh-cutting resolutions, the object meshing method (OMM) and boundary meshing method (BMM)—two methods that are currently used in the FEM—were adopted to determine the optimal tradeoff between computational performance and cost. Mathematically, solutions derived from partial differential equations (PDEs) with boundary conditions must be pairwise orthogonal; in other words, their orthogonal value must be equal to zero. However, in numerical simulations, because of memory and computational time constraints, achieving pairwise orthogonality between modes is impossible. In other words, errors are inevitable. Therefore, in this study, the acceptable maximum error value was set at −40 dB as the review standard. All subsequently employed mesh-cutting resolutions must, therefore, generate modes with an orthogonal value of less than −40 dB. For mesh-cutting resolutions that failed to meet this standard, the resolution was increased; subsequently the solutions to the modes were recalculated and the orthogonal values were reevaluated [
12].
Section 4 introduces the roles and functions of EEM in the numerical simulations and expounds why the combined FEM-EEM approach is superior to traditional numerical simulation methods for designing and analyzing large optical components containing periodic structures. Mathematically, EEM embodies an operation concept similar to that of the Fourier series expansion method; that is, if too few expansion functions are used, discrepancies will occur between the expansion and expanded functions. In numerical operations, it is impossible to include all modes; consequently, errors are unavoidable. To overcome this problem, similar to the FEM approach adopted in this study, the acceptable maximum error (i.e., power loss) for modal expansions was set to −40 dB.
Section 5 shows how the FEM and EEM were combined to research and design the proposed FBG-OADM. The design process involved the following procedure: (1) solve the FBG-OADM modes, (2) plot 2D power distribution maps of the modes, (3) review the orthogonal values of the modes, (4) identify the optimal design parameters, (5) inspect the overall power loss, (6) plot the spectrum for the drop port, (7) examine heterodyne and homodyne crosstalk, and (8) calculate the −3 dB bandwidth. Finally,
Section 6 summarizes the study findings. This study developed a novel, high-performance FBG-OADM that was designed through the combined FEM-EEM approach. To minimize the number of errors, a PML and PRB were simulated through various numerical methods (i.e., the OMM and BMM) and a review standard was formulated to assess the orthogonal values and power loss. The numerical simulations showed that the proposed FBG-OADM overcomes the disadvantages of current OADMs. Moreover, the proposed FBG-OADM possesses nearly zero heterodyne and homodyne crosstalk and meets the full width at half maximum (FWHM) requirement for dense wavelength-division multiplexers (DWDMs) according to the International Telecommunication Union (ITU; FWHM < 0.4 nm).
2. Novel FBG-OADM
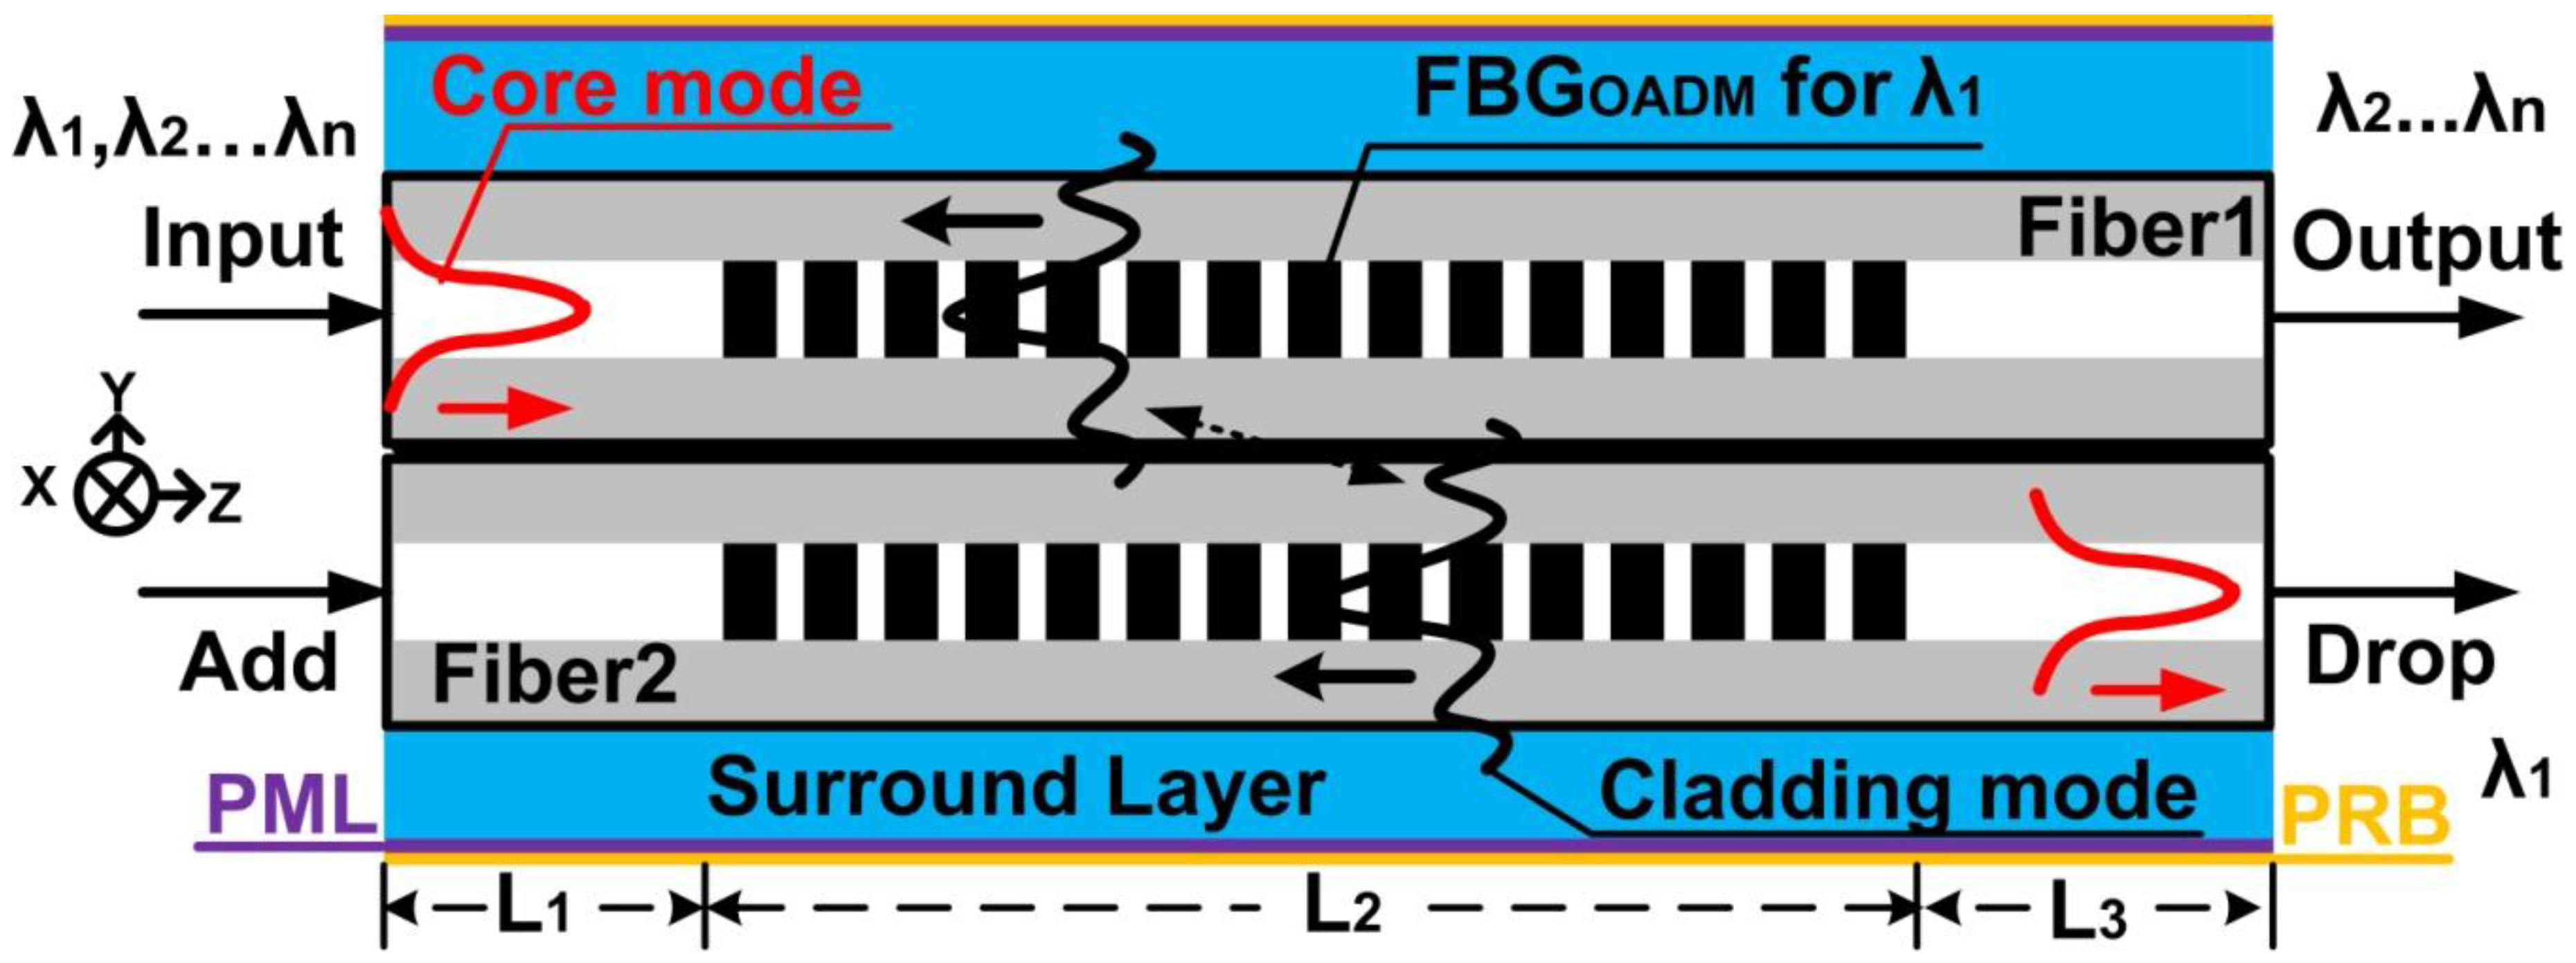
Figure 1 shows the geometric structure of the proposed FBG-OADM [
12]. The structure comprises two SMFs placed side by side (Fibers 1 and 2), a 1 μm thick PML (purple lines), a PRB (yellow lines), a noncoupling area (
and
);
mode-power coupling area (
); an HE
11 core mode (red lines); and a cladding mode (black lines).
When the drop wavelength of the FBG-OADM is set to
and
N core mode signals with different wavelengths (i.e.,
) are inputted via the input port, core mode signals of all wavelengths (except for that with a wavelength of
) are unaffected by the FBG and are outputted directly via the output port. However, the core mode signal with a wavelength of
is subjected to perturbation from the FBG and is coupled to the cladding mode propagated along the −
Z direction. Mode theory posits that the power distribution in the core mode exists in the cladding layer in the form of exponential decay (red lines). In other words, the core mode in the figure cannot detect the presence of the surround layer. Thus, the core mode cannot couple Fiber 1 to Fiber 2. Conversely, because the power in the cladding mode can be extended to the surround layer (black lines), the cladding mode can couple Fiber 1 to Fiber 2. Subsequently, the cladding mode in Fiber 2 is subjected to perturbation from the FBG, prompting the coupled core mode to be propagated along the
Z direction and outputted via the drop port, thus completing the signal drop process. Regarding the signal add process, because the proposed FBG-OADM has a symmetric structural design, signal adding works according to the same principle as signal dropping; that is, when a signal is inputted via the add port of Fiber 2, it will be outputted via the output port of Fiber 1, thus completing the signal add process [
12].
Compared with a previous long-period fiber grating (LPG) OADM proposed by the author of the present study (in which the LPG-OADM comprised two LPGs and a 2 × 2 optical fiber coupler) [
7], the present OADM uses FBGs instead of LPGs. Roughly speaking, the overall spectrum of the two OADMs is the product of the spectrums of the two LPGs (or two FBGs) and 2 × 2 optical fiber coupler, as shown in
Table 1. According to the table, the newly-proposed FBG-OADM features a narrower spectrum, indicating that it can achieve exceptional bandwidth performance (−3 dB).
In real-world environments, signals in an optical fiber structure may take the form of one of two mode types: discrete guided modes and continuous radiation modes. However, because continuous radiation modes cannot be measured in real-world environments, they are considered a type of power loss. Moreover, the limitations imposed on numerical simulations by memory and computation time constraints render it impossible to contain continuous radiation modes. To overcome this drawback and, thus, improve the accuracy of simulation results, this study employed a PRB to convert continuous radiation modes into discrete radiation modes. In addition, to enable the converted discrete radiation modes to achieve expected power loss, a PML was incorporated into the surround layer, enabling the propagation constant of the discrete radiation modes to be −(
α +
iβ), where
α is the attenuation constant and
β is the phase constant [
13,
14].
SMFs were employed as the optical fiber technology in this study. SMFs are a type of fiber in which the solution for the core and the nearly infinite number of solutions for the cladding layer can be identified once the size and constituent materials of the fibers are determined (using PDEs). From a physics perspective, all solutions are referred to as guided modes and each solution corresponds to an equivalent RI. Thus, the equivalent RI (i.e., ; < < ) of the core mode as well as nearly infinite number of equivalent RIs (i.e., ; < < ) of the cladding modes can be determined, where n1 is the RI of the core layer, n2 is the RI of the cladding layer, n3 is the RI of the surround layer, is the effective RI of the core mode, and is the effective RI of the cladding mode.
FBGs involve irradiating UV light signals on phase masks with a specific cycle to cause periodic variation in the RI of the fiber core. These variations in the core RI are called fiber gratings. A uniform fiber grating can be expressed using the following mathematical equation [
12,
15]:
where
is the peak induced-index change,
is the RI of the core, and
is the FBG period. Mathematically, before light signals are affected by fiber gratings, all guided modes in the optical fiber display pairwise orthogonality. In order words, powers between the modes do not couple to, or swap with, each other during propagation. However, as light signals become affected by fiber gratings, powers between the modes undergo perturbation, causing coupling and crosstalk between the modes.
3. Finite Element Method
The calculation principles underlying the FEM [
12,
16,
17,
18] are briefly explained here. The FEM can be applied to solve PDEs and it can be combined with numerical simulation methods for evaluating boundary conditions. The FEM is based on the variational principle, region segmentation, and interpolation functions. In the FEM, the variational principle is used to convert original problems (i.e., PDEs and boundary conditions) into functional functions to find the extrema. Next, geometric regions are divided, and hypothetically known element nodes are substituted into interpolation functions to describe the unknown functions in the elements. Then, multivariate linear equations are substituted into the functional functions, and boundary conditions are incorporated to identify the interpolation functions of all elements. When solutions to the interpolation functions are obtained, unknown nodes and the solutions of an entire region can be derived. The FEM procedure is summarized as follows: (1) convert the problems of PDEs and boundary conditions into quadratic functional functions to identify the extrema; (2) divide the geometric regions into subblocks, which are referred to as elements (e.g., triangular or quadrilateral elements); (3) assuming that the nodes in a triangular element are known, substitute the known nodes into the interpolation functions to create polynomial linear equations and describe the unknown variables in the elements; and (4) substitute the polynomial linear equations into the extrema-based functional functions while incorporating the boundary conditions to identify the solutions to the interpolation functions. By obtaining the unknown nodes using the interpolation function, calculate the solutions of the entire region.
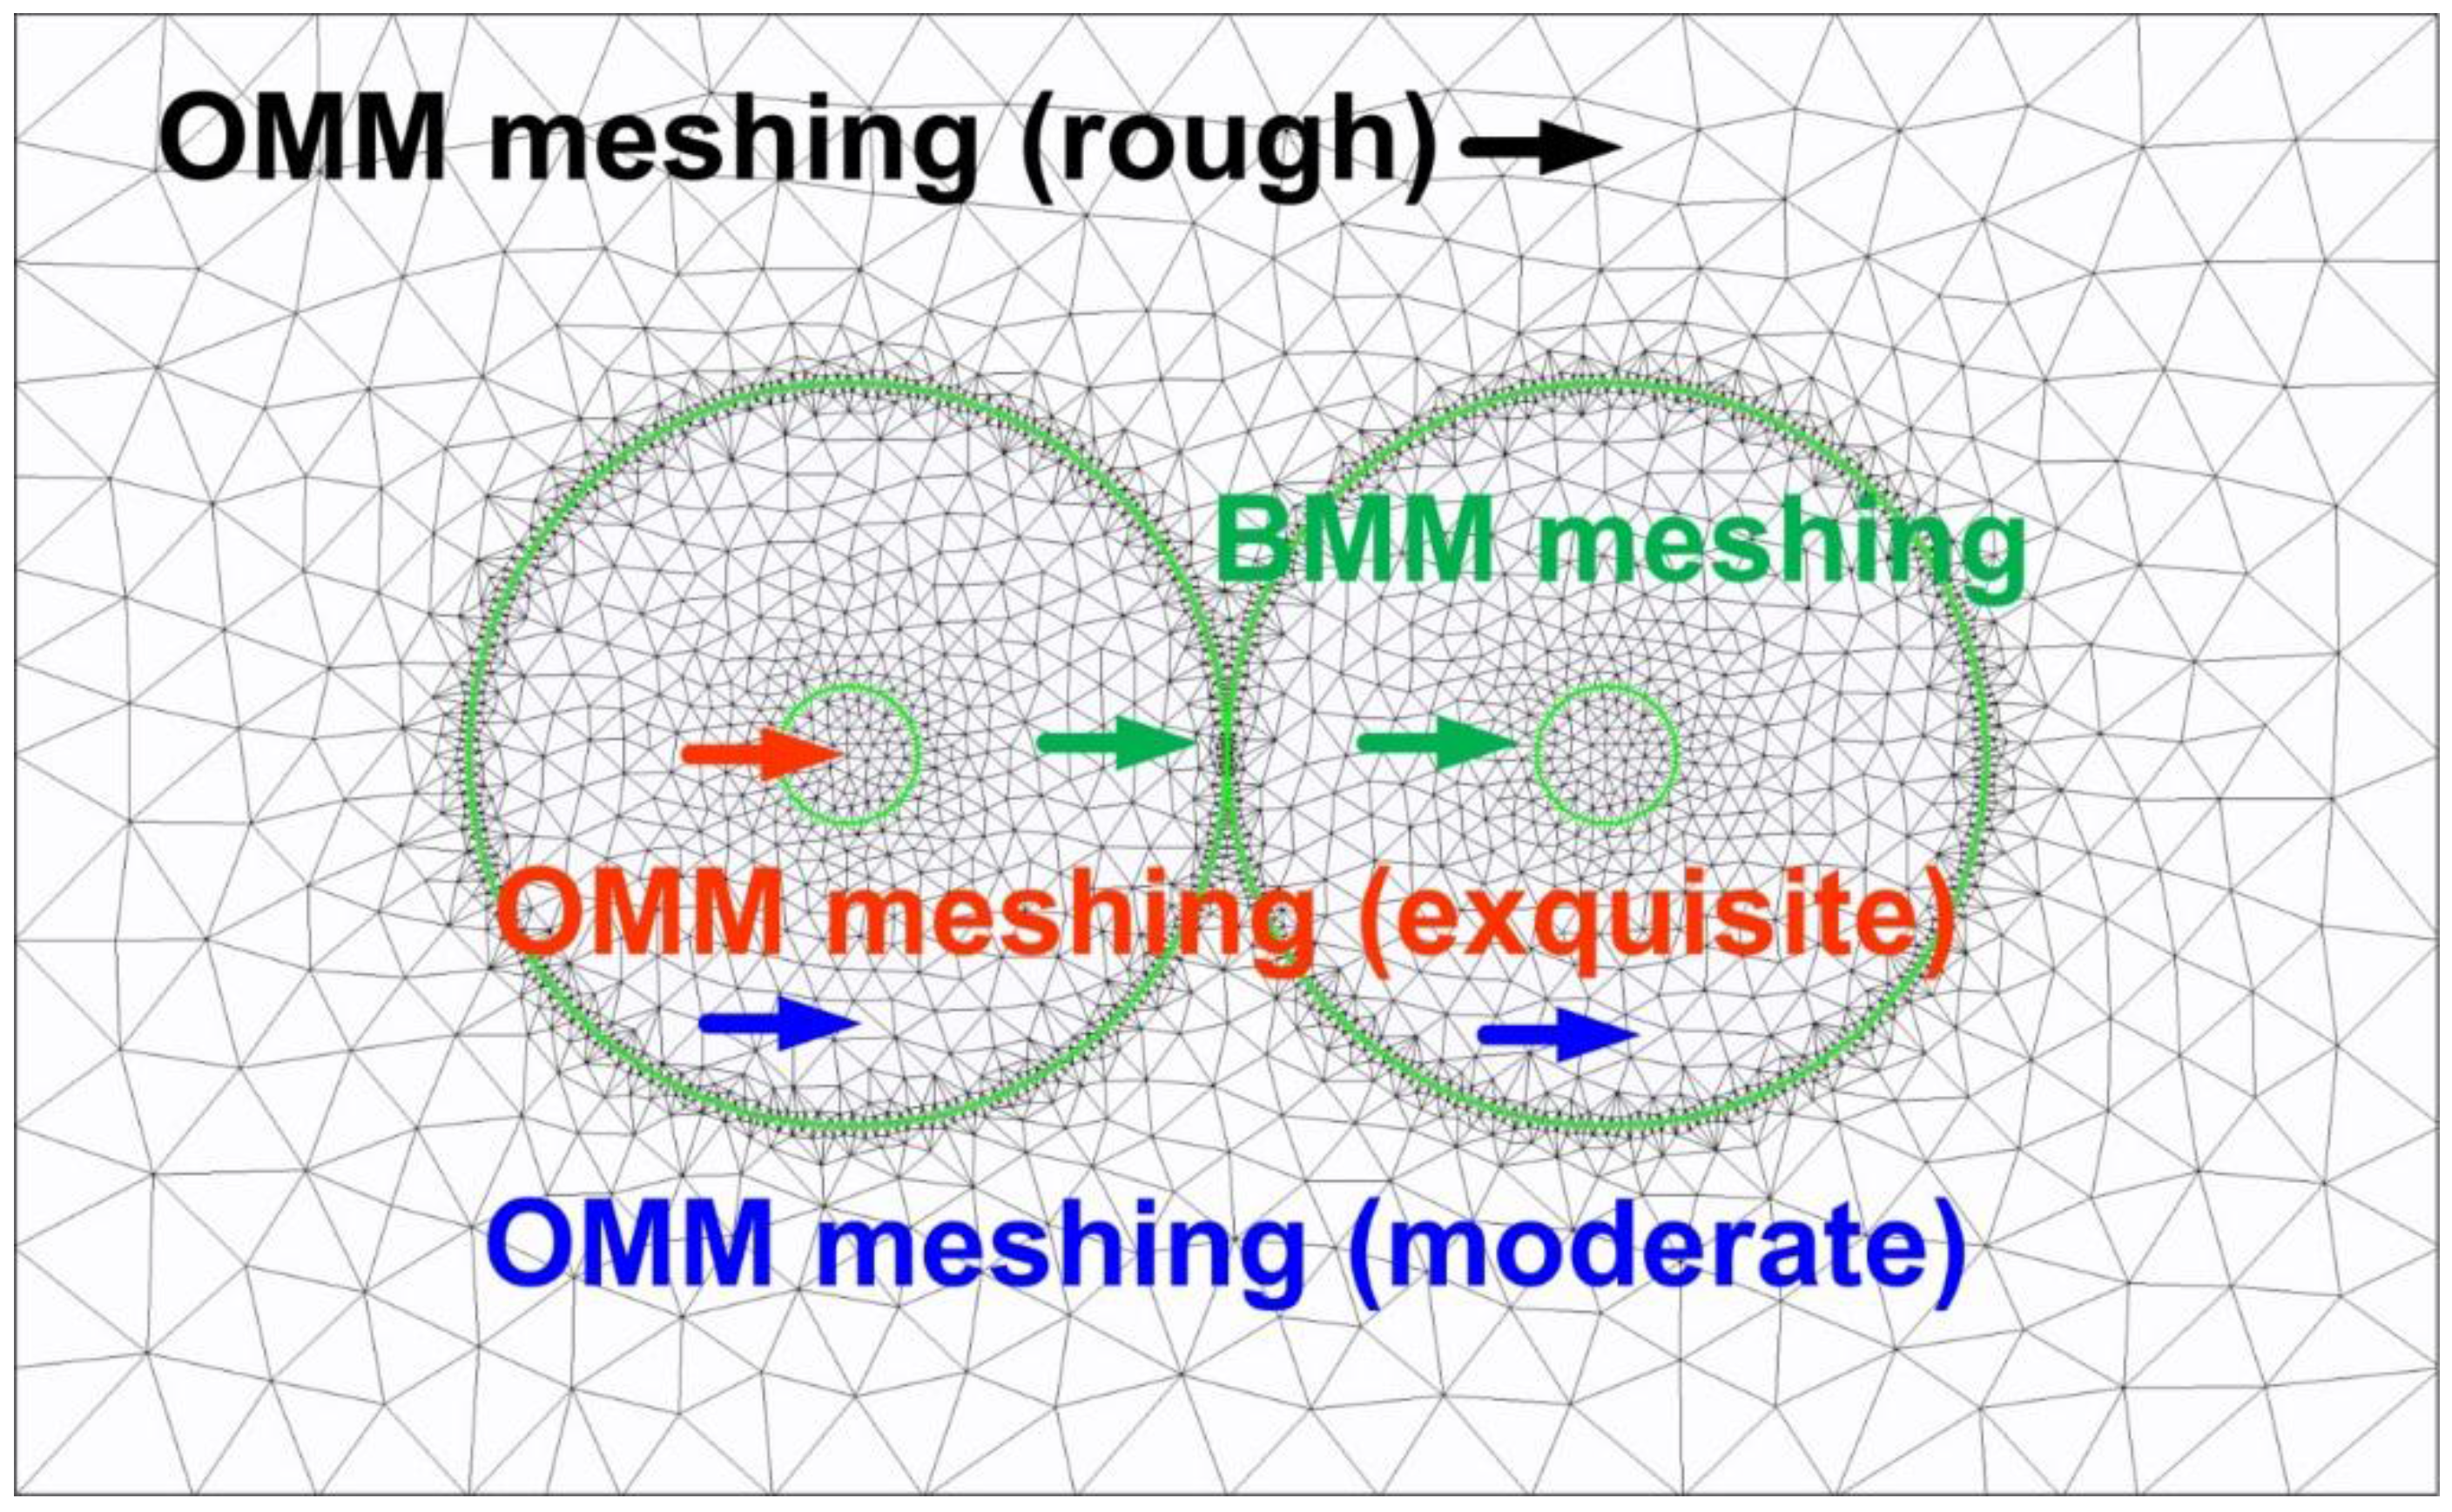
This study used FEM to solve the guided modes in an optical fiber structure. As shown in
Figure 2, the OMM was used to obtain the standard mesh size, which was based on the geometric size of the objects [
12]. Then, the BMM was used to obtain boundary meshes with a higher resolution. Since the numerical simulations were limited by memory and computation ability constraints, achieving pairwise orthogonality between modes was impossible. Thus, errors were unavoidable. Therefore, the acceptable maximum error value (i.e., the orthogonal value) was set at −40 dB as the review standard. In other words, all mesh-cutting resolutions were required to produce modes with an orthogonal value of less than −40 dB [
9,
12,
19]. Mesh sizes that satisfied the review standard were obtained through adjusting the mesh-cutting resolutions and testing the orthogonal values. The orthogonal value equation is shown as follows [
15,
19]:
The mesh size used in this study was 1:5:17:43 (i.e., the object boundary/small object/medium object/large object ratio).
4. Eigenmode Expansion Method
The primary function of the EEM was to transmit the power of simulated guided modes. The RI of FBG-OADM underwent cyclical changes and each change in RI during a cycle was called a segment. The first segment of the FBG-OADM was first dropped with each division referred to as a “block”. Each block was assumed to be a uniform waveguide. Next, the FEM was used to solve all guided modes in each block, and the EEM was then employed to transmit the power between the block boundaries. Since changes in the RIs of FBG-OADM were cyclical, the power transmission in the segments during the simulations resembled the power transmission situation of the overall FBG-OADM [
7,
13,
14].
The aforementioned information shows that, in contrast to using traditional numerical simulation techniques, this study performed FBG-OADM-based numerical simulations by using the combined FEM–EEM approach, which can complete numerical simulations within a shorter timeframe. Although the finite-difference time-domain (FDTD) method has been used in previous research [
20], it requires considerable computation time and memory capacity during simulations—especially for complex structures, such as the FBG-OADM. In summary, the combined FEM–EEM approach is more efficient than conventional numerical simulation techniques for designing devices with a cyclic structure (e.g., FBG-OADM, LPG-OADM, and resonance sensors with a long-period fiber grating).
Mathematically, EEM embodies an operation concept similar to that of the Fourier series expansion method; that is, if too few expansion functions are used, discrepancies will occur between the expansion and expanded functions. In numerical operations, because including all modes is impossible, errors are unavoidable. To overcome this problem, similar to the FEM approach adopted in this study, the acceptable maximum error (i.e., power loss) for modal expansions was set to −40 dB [
7,
13,
14]. In other words, when the power loss failed to reach the review standard, the number of modes was increased and simulations were repeated until the power loss satisfied the review standard.
5. Result and Analysis of the FBG-OADM
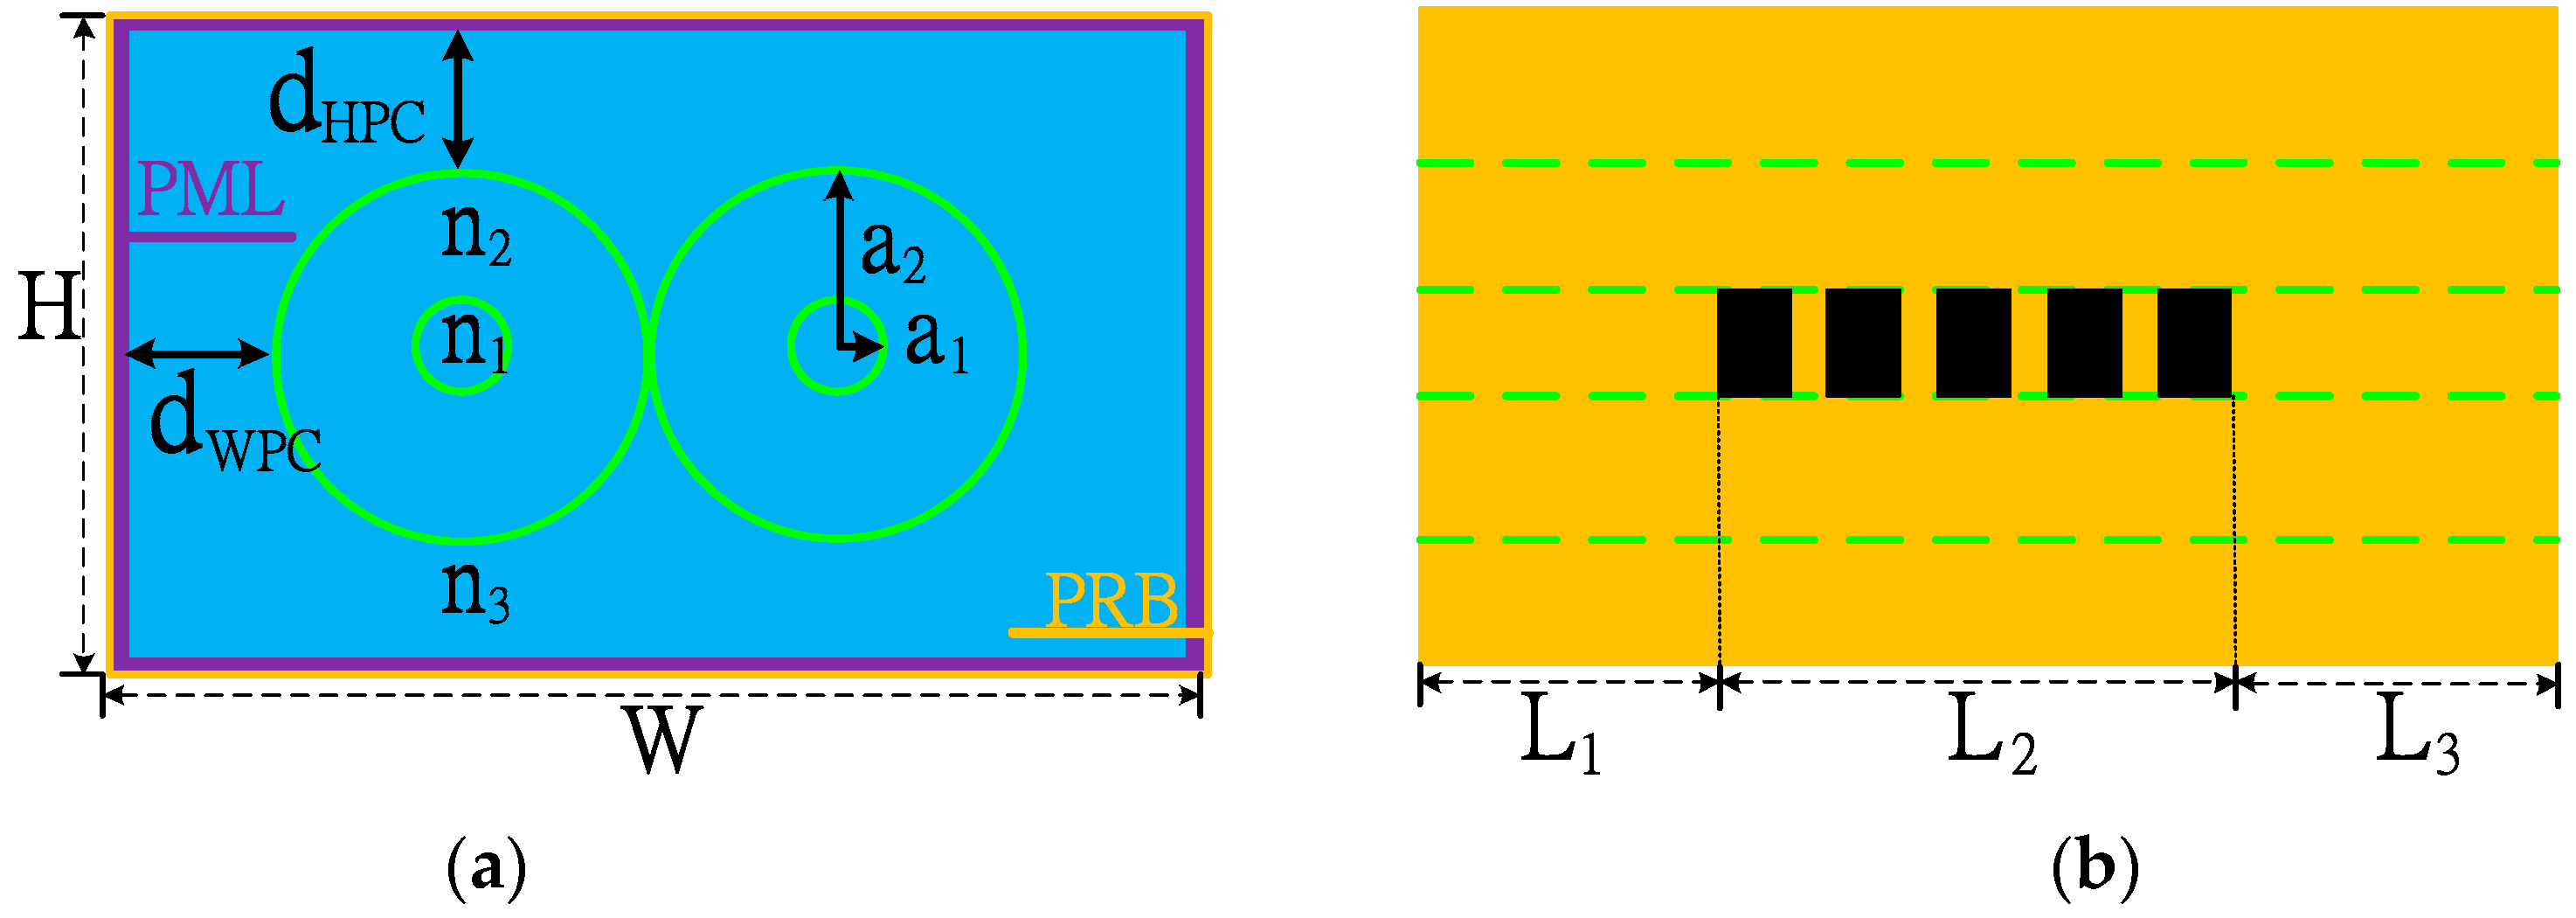
FBG-OADM simulations, designs, and research were made using the combined FEM–EEM approach. The parameters in
Figure 3 are explained as follows:
is the core radius;
is the cladding layer radius;
is the RI of the core layer;
is the RI of the cladding layer;
is the RI of the surround layer;
is the peak induced-index change by the UV light;
is the thickness of the PML;
are the noncoupling areas of the FBG-OADM;
is the mode–power coupling area;
and
are the width and height between the cladding layer and the PML, respectively; W and H are the width and height of the overall structure, respectively. The parameters were set as follows:
= 2.25
= 12.25
,
= 1.454,
= 1.43,
= 1.415,
,
,
= 1
= 1
,
=
,
13.7
,
W = 78.4
, and
H = 49
, where
Np is the number of period in the FBG-OADM. Moreover, the distance between the two optical fibers was set to zero and the operating wavelength
.
Figure 4 shows the side view (i.e.,
X-Z plane) of the FBG-OADM during the numerical simulations.
After repeatedly adjusting the number of modes, recalculating the solutions, and reexamining the power loss, this study found that the number of guided modes that met the power loss review standard was 80.
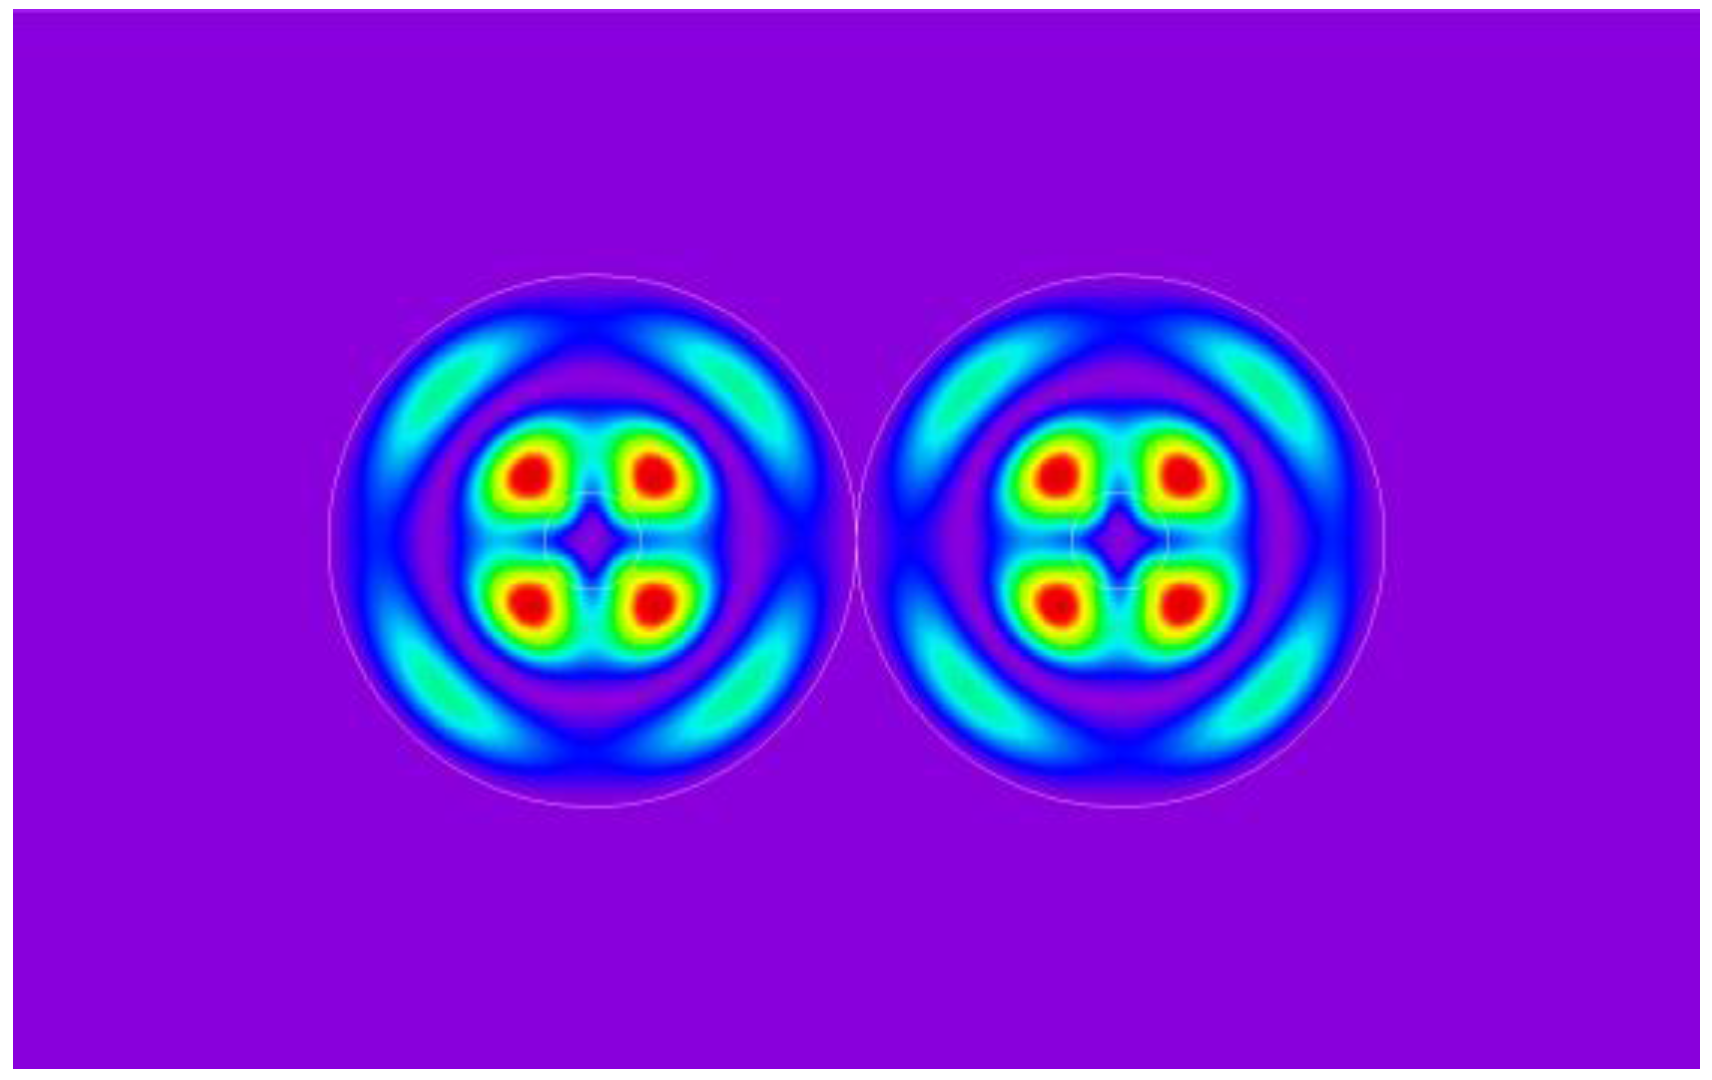
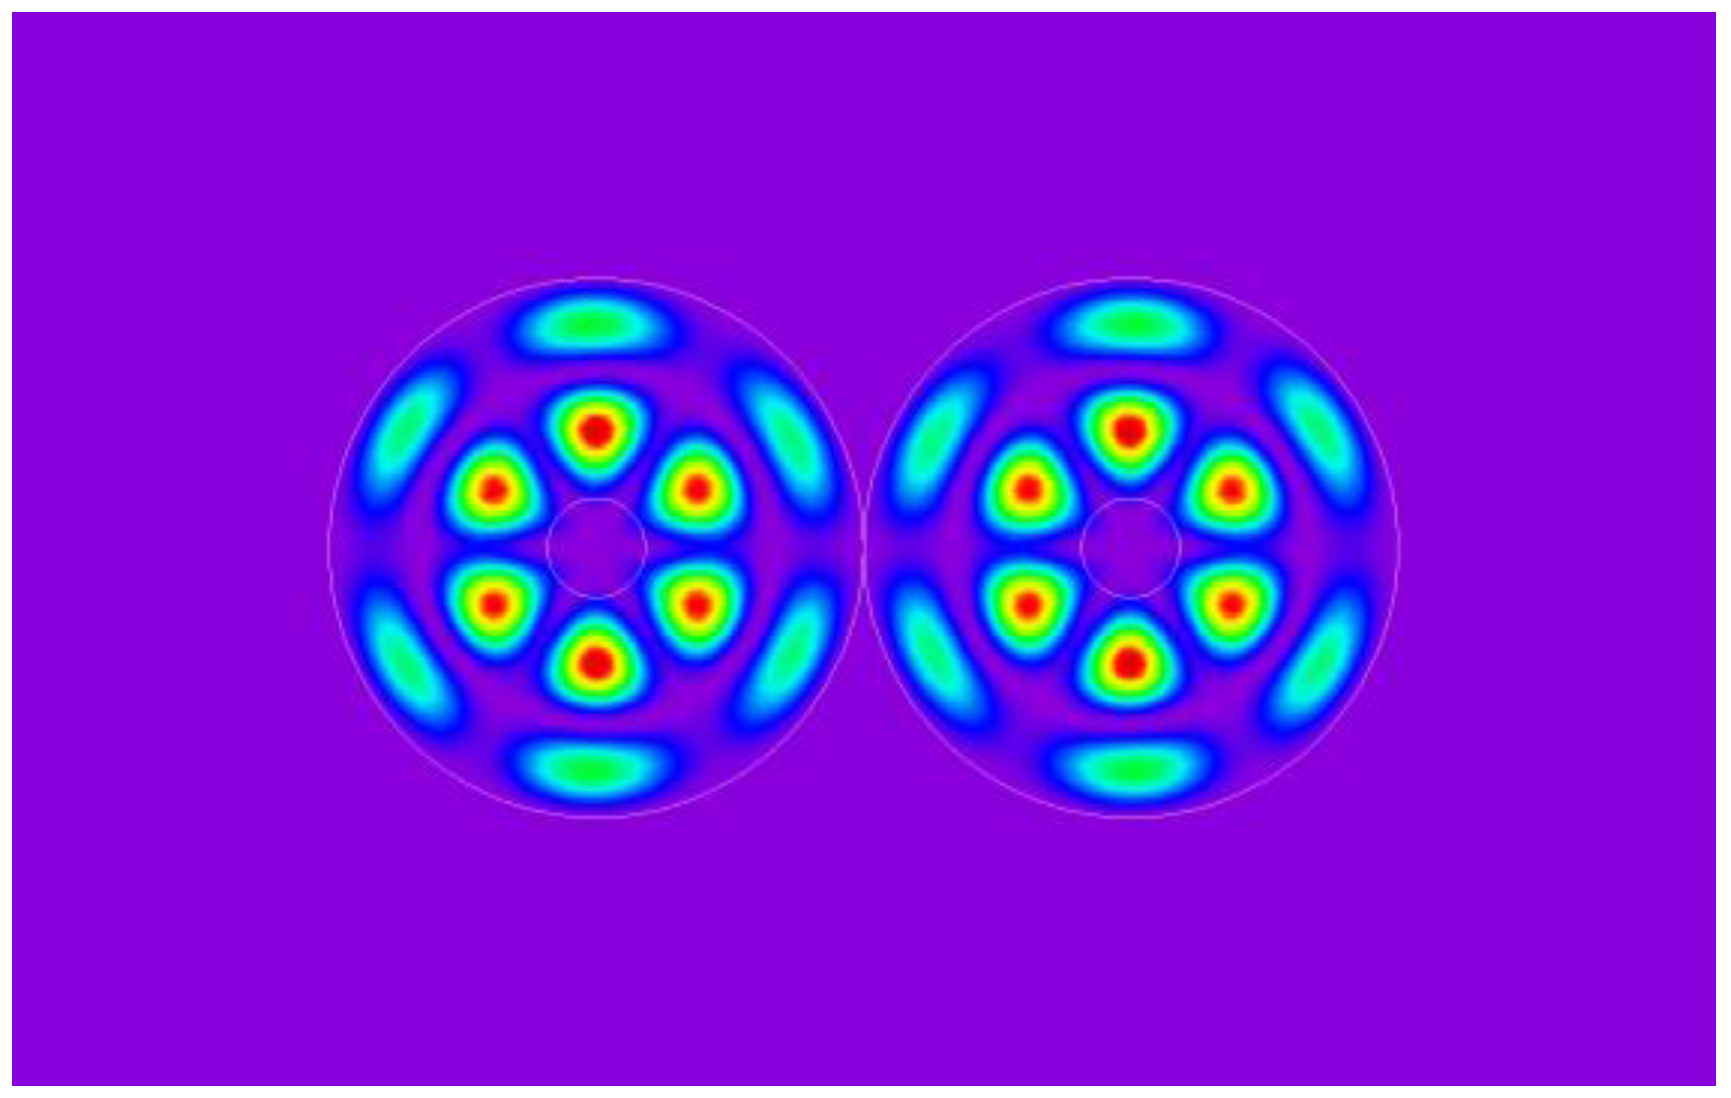
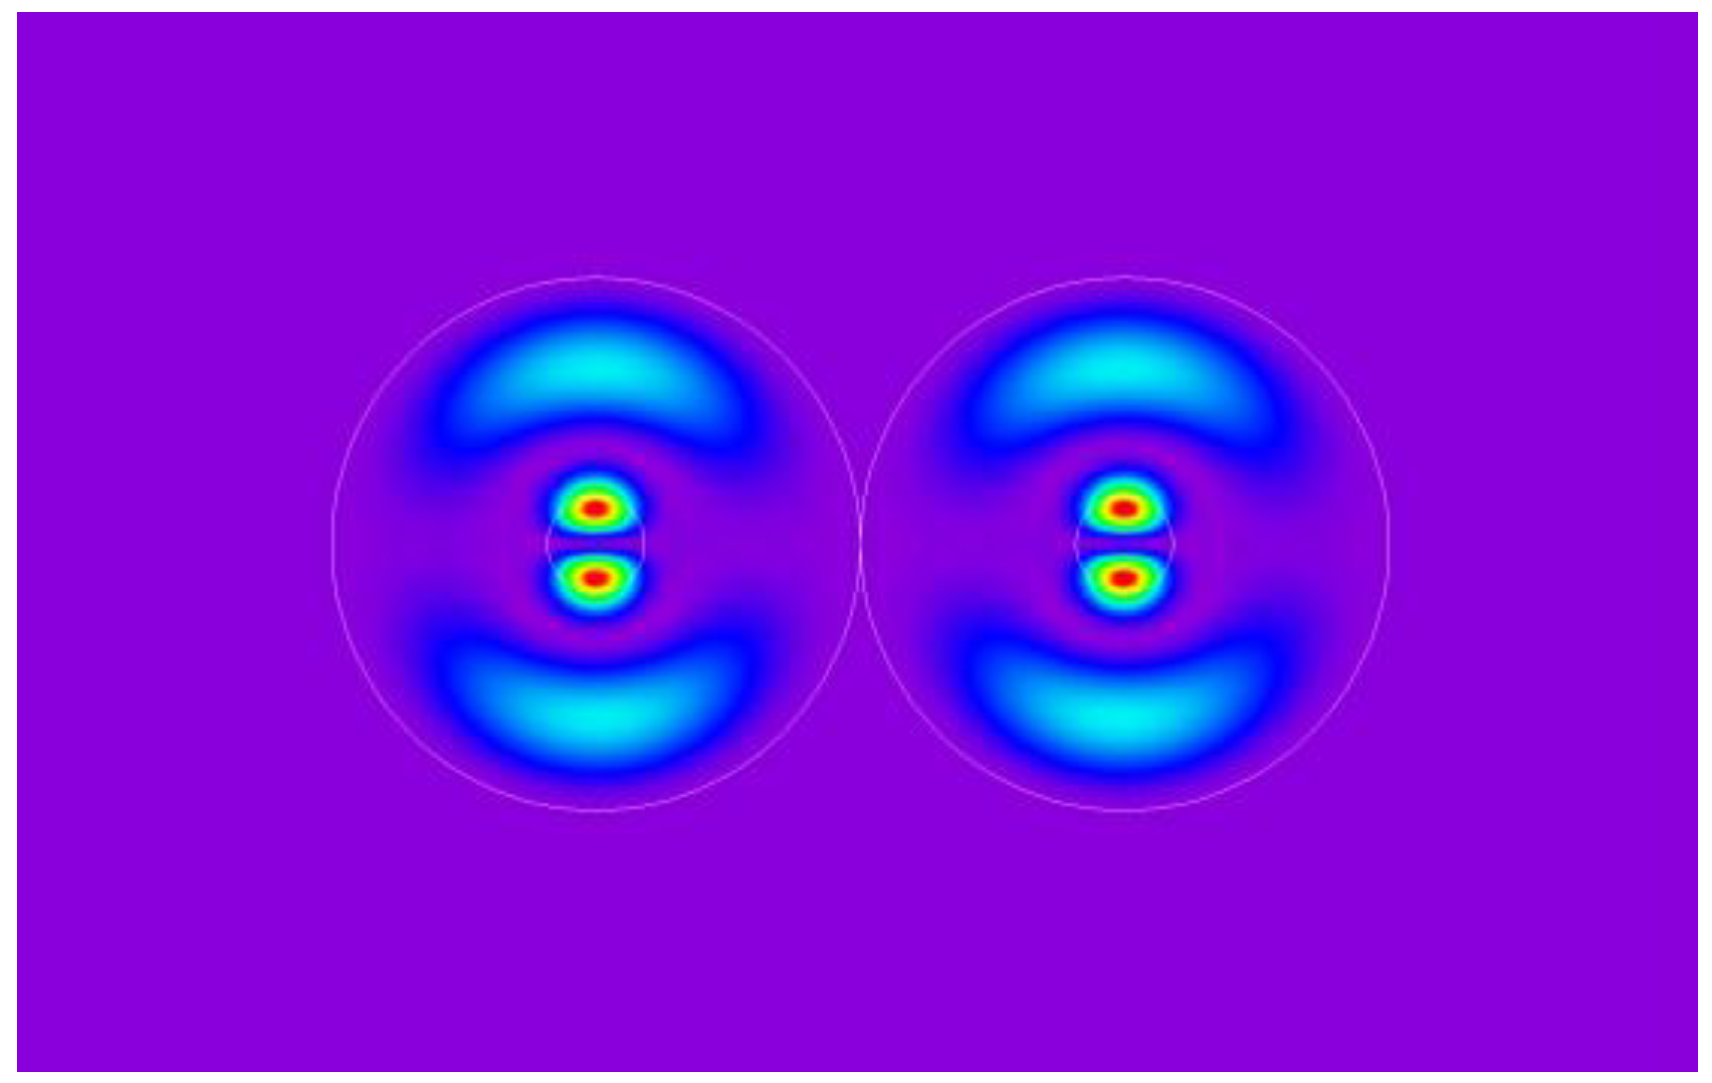
Figure 5,
Figure 6,
Figure 7 and
Figure 8 show the power distribution maps of modes when
v = 9, 22, 56, and 79, respectively; the corresponding equivalent RIs were
= 1.429881,
= 1.427474,
= 1.422949, and
= 1.420274, respectively.
According to optical coupling theory, the only guided modes that are subjected to the influence of the 2 × 2 optical fiber coupler and could subsequently transmit and couple power from Fiber 1 to Fiber 2 are the cladding modes. In addition, because of the perturbation effect of the FBG, core modes couple only to cladding modes with a powered core. In other words, of the four guided modes shown in
Figure 5,
Figure 6,
Figure 7 and
Figure 8, only the one in
Figure 5 (
v = 9) achieved acceptable FBG-OADM drop and add functionality.
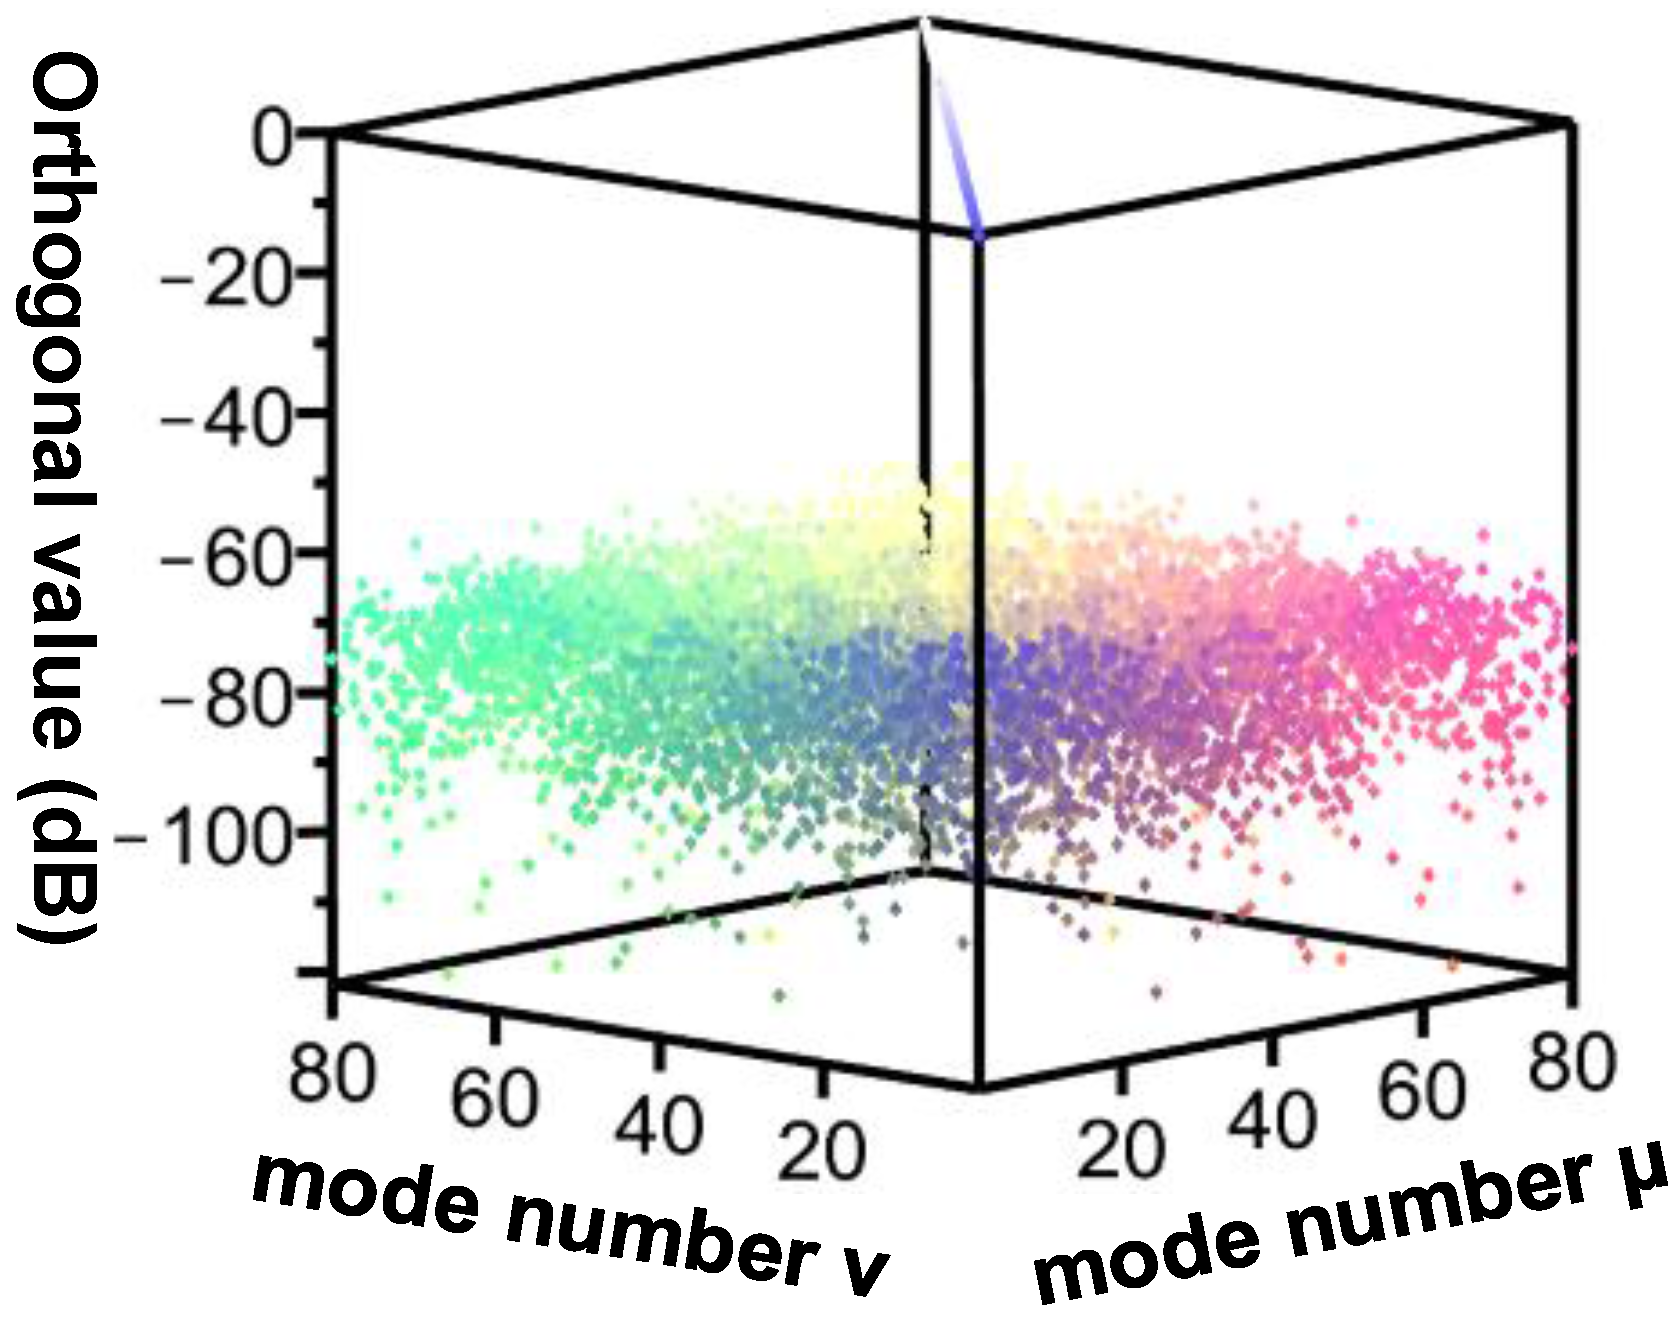
Mathematically, all guided modes must display pairwise orthogonality. However, in numerical simulations, because of memory and computation time constraints, it is impossible to achieve pairwise orthogonality between modes. Therefore, in this study, the OMM and BMM were combined to determine the appropriate segmentation size and formulate a review standard for the orthogonal value.
Figure 9 shows the orthogonal values between the 80 modes, which confirms that the results satisfied the review standard.
The FBG-OADM was designed after determining the optimal mesh resolution and number of modes. The ratio of the drop power to input power for the FBG-OADM must equal 1. In other words, its drop power should be 0 dB. Thus,
and
values that satisfied this condition had to be identified to design an FBG-OADM that achieved zero insertion loss and minimal heterodyne and homodyne crosstalk.
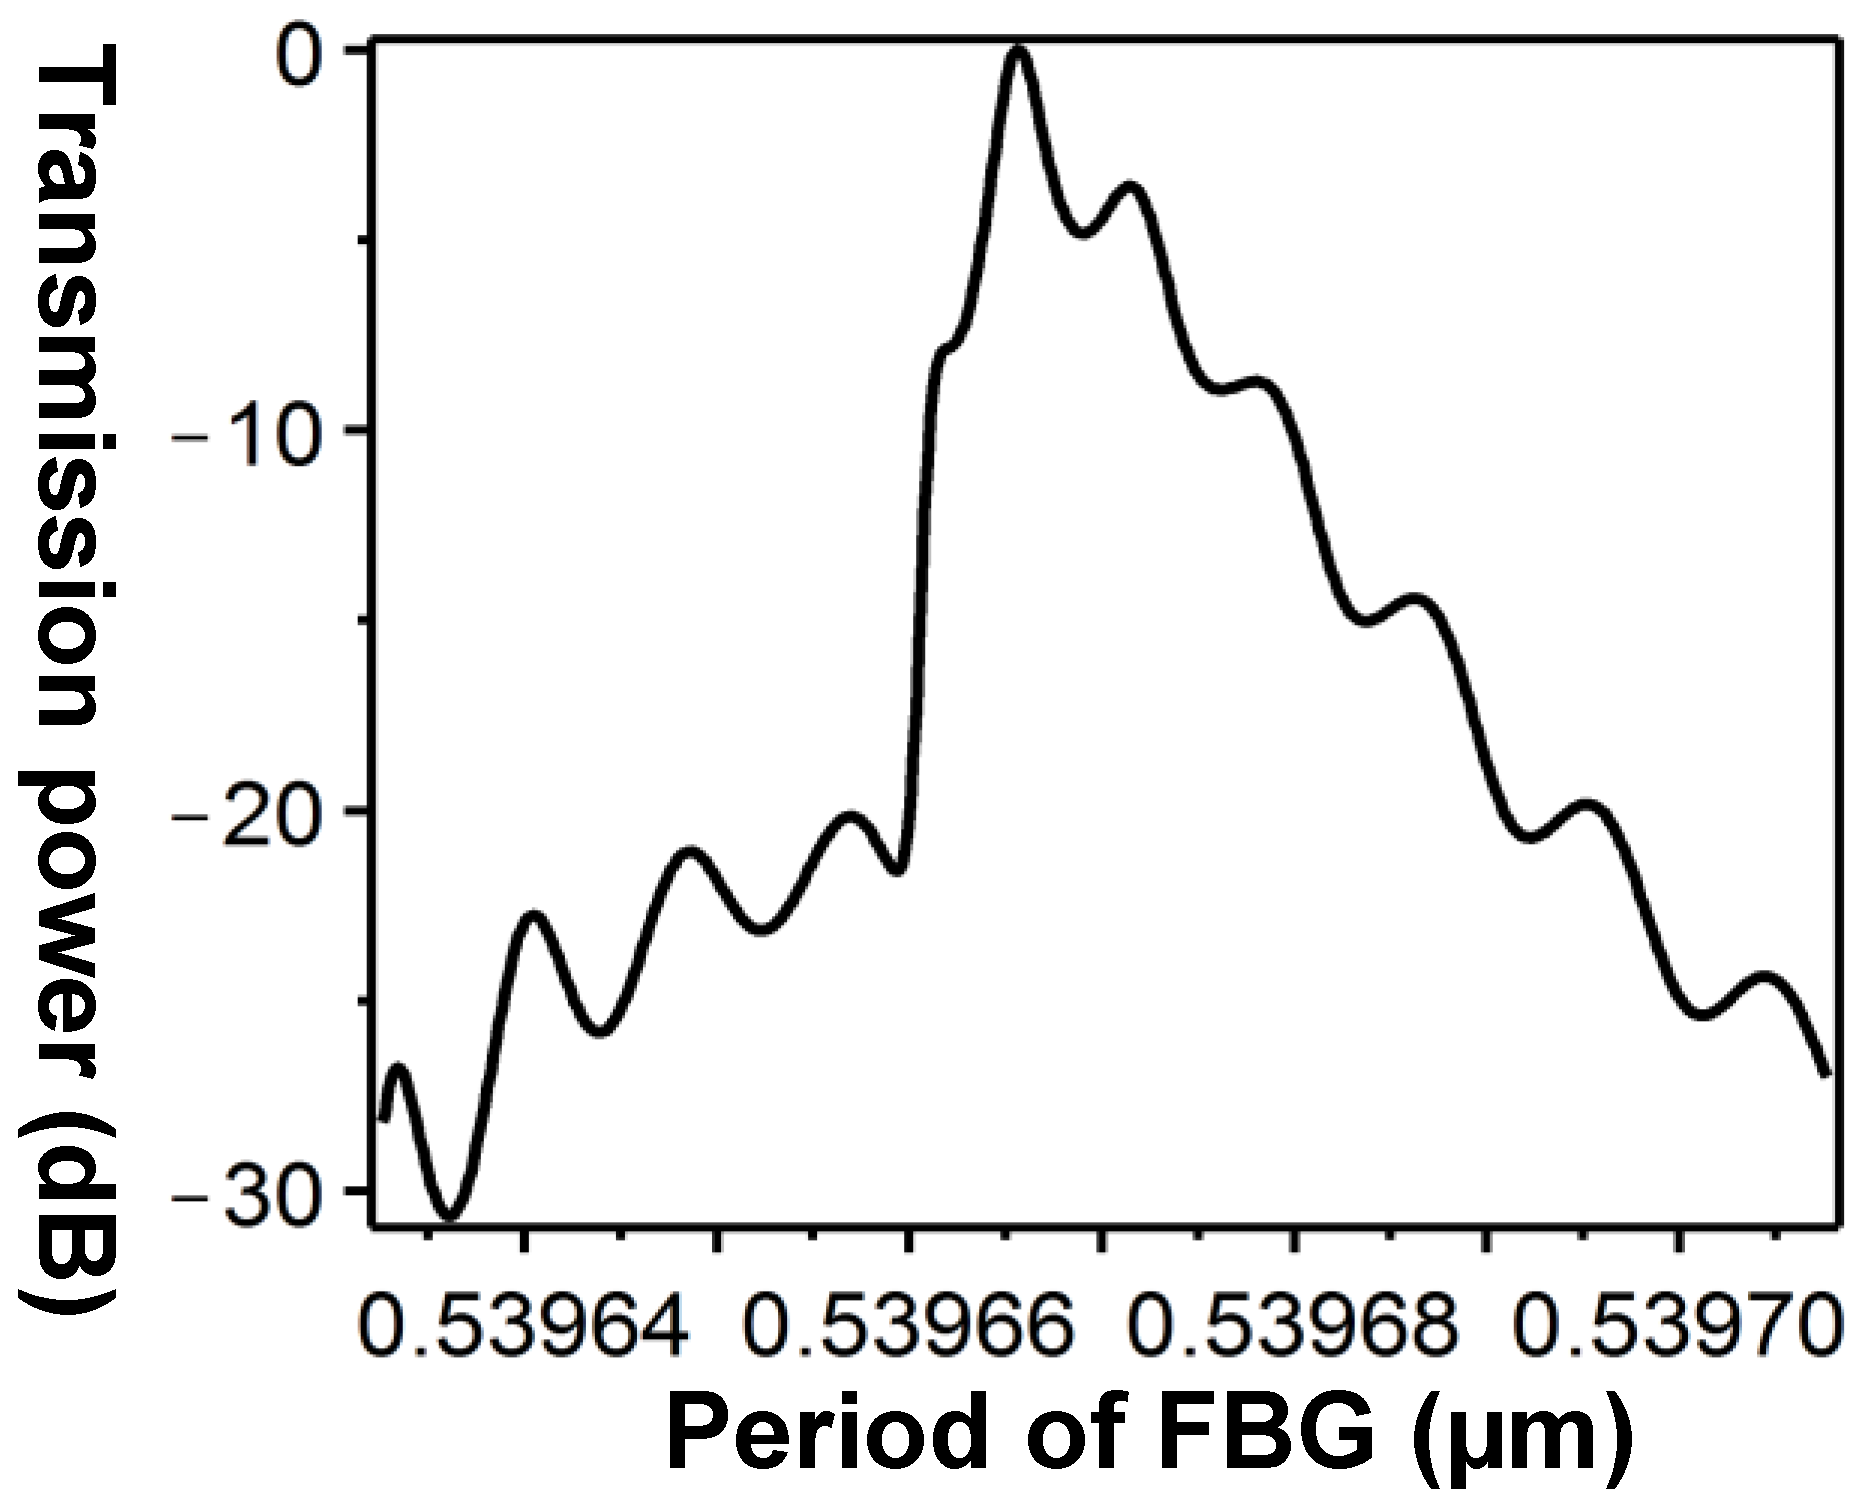
Figure 10 shows the scanning diagram of the optimal
. According to the power transmission curve in
Figure 10, the power transmission approached 0 dB when
ΛFBG = 0.5396 μm.
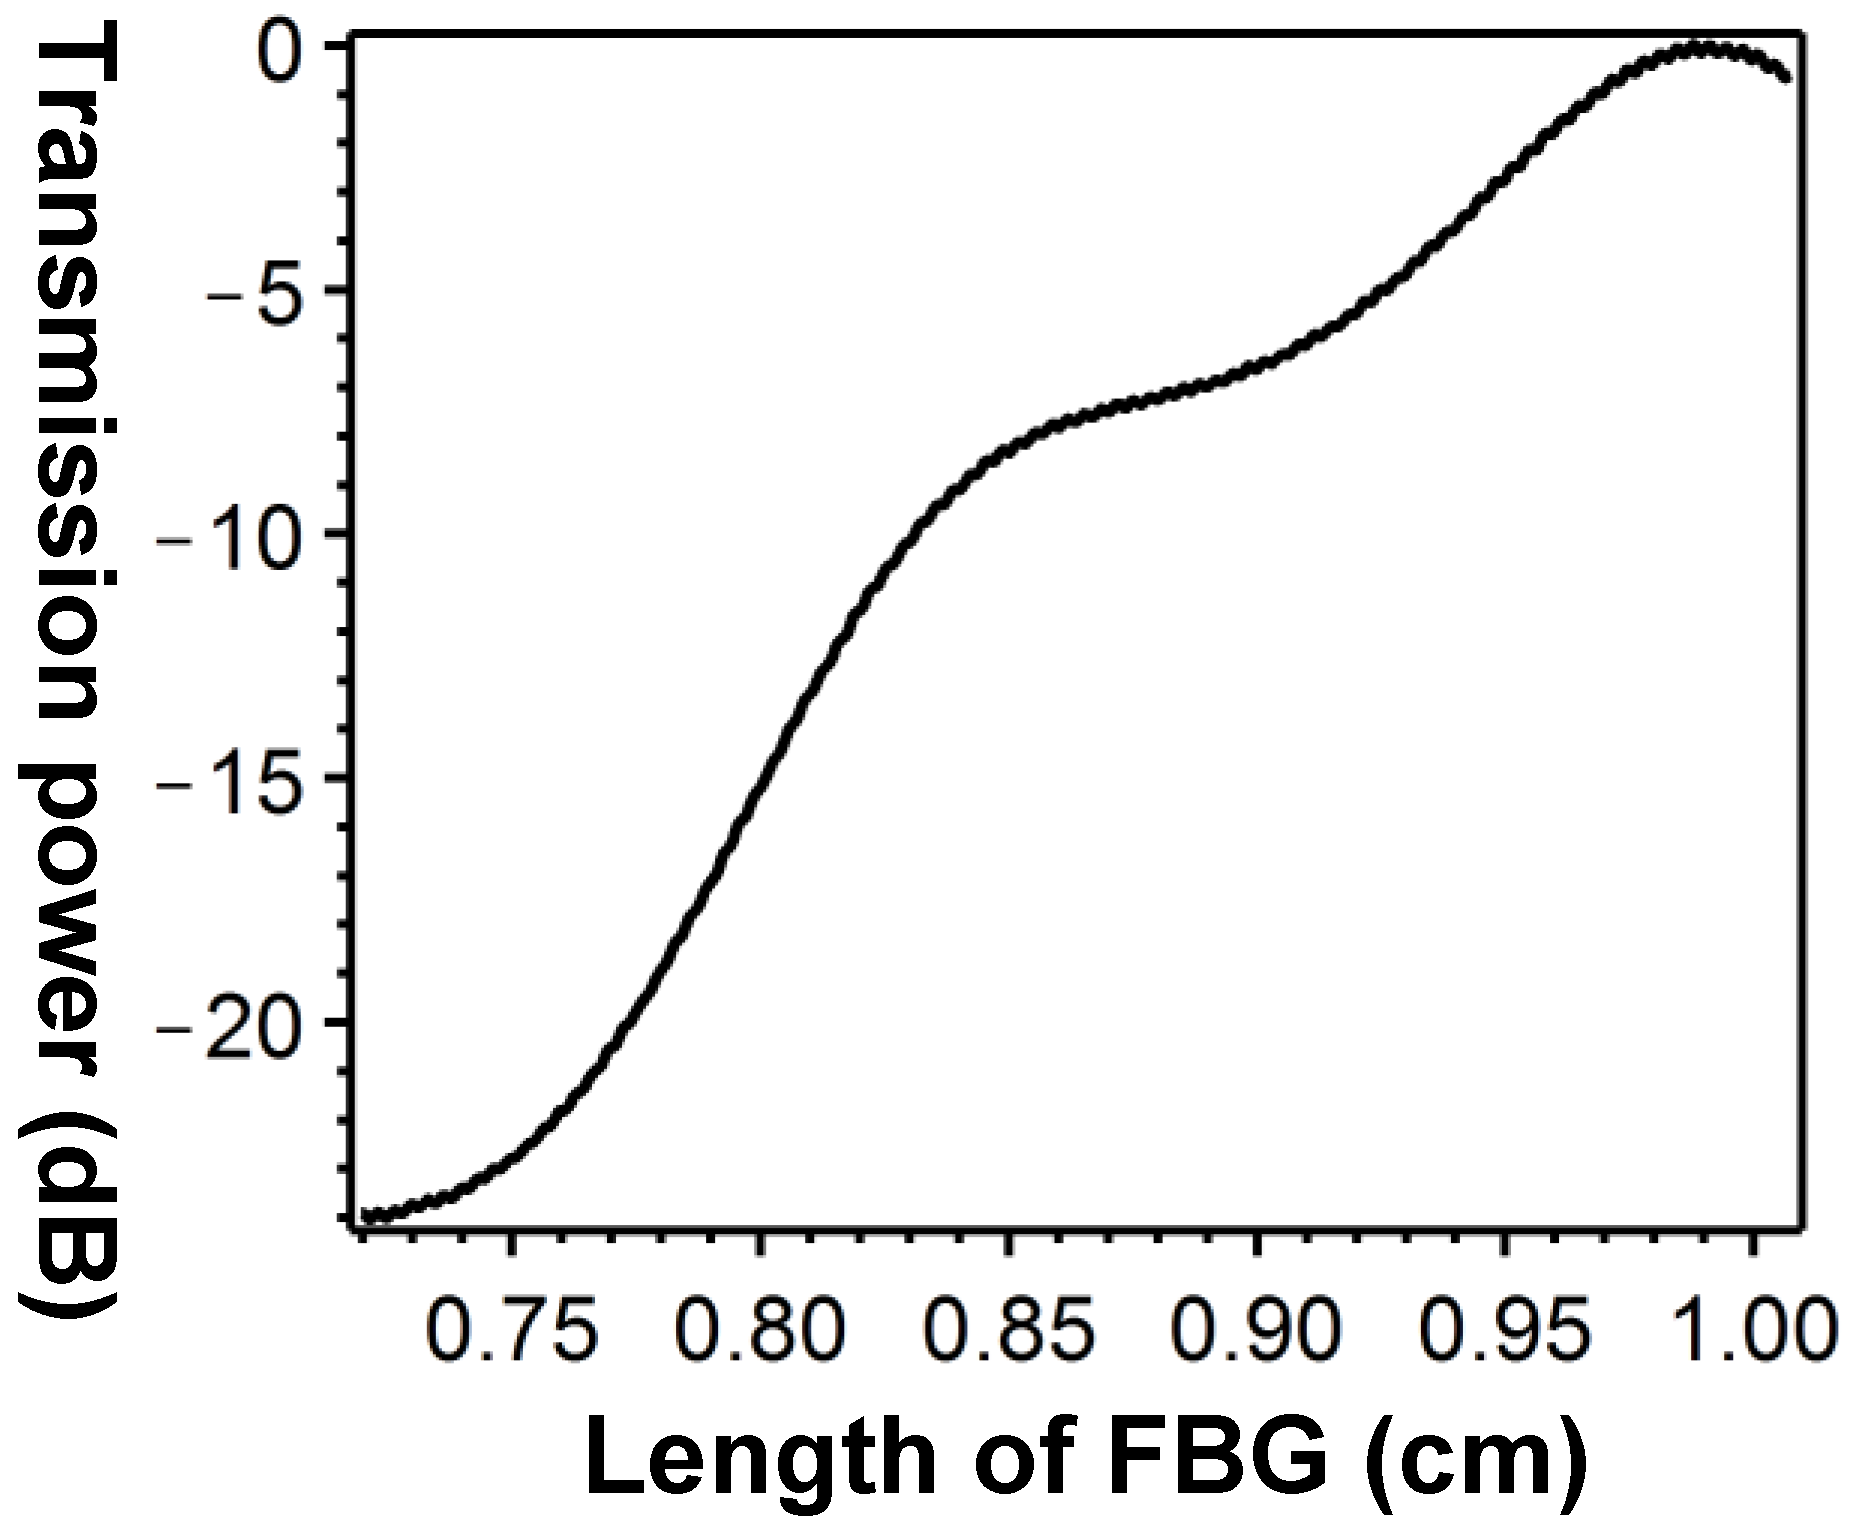
Figure 11 illustrates the scanning diagram of the optimal FBG-OADM length, showing that the power transmission approached 0 dB when
= 0.9908
. Next, from Equation (3),
(i.e., the number of period in the FBG-OADM) was calculated and found to be 18,361.
According to the EEM descriptions in
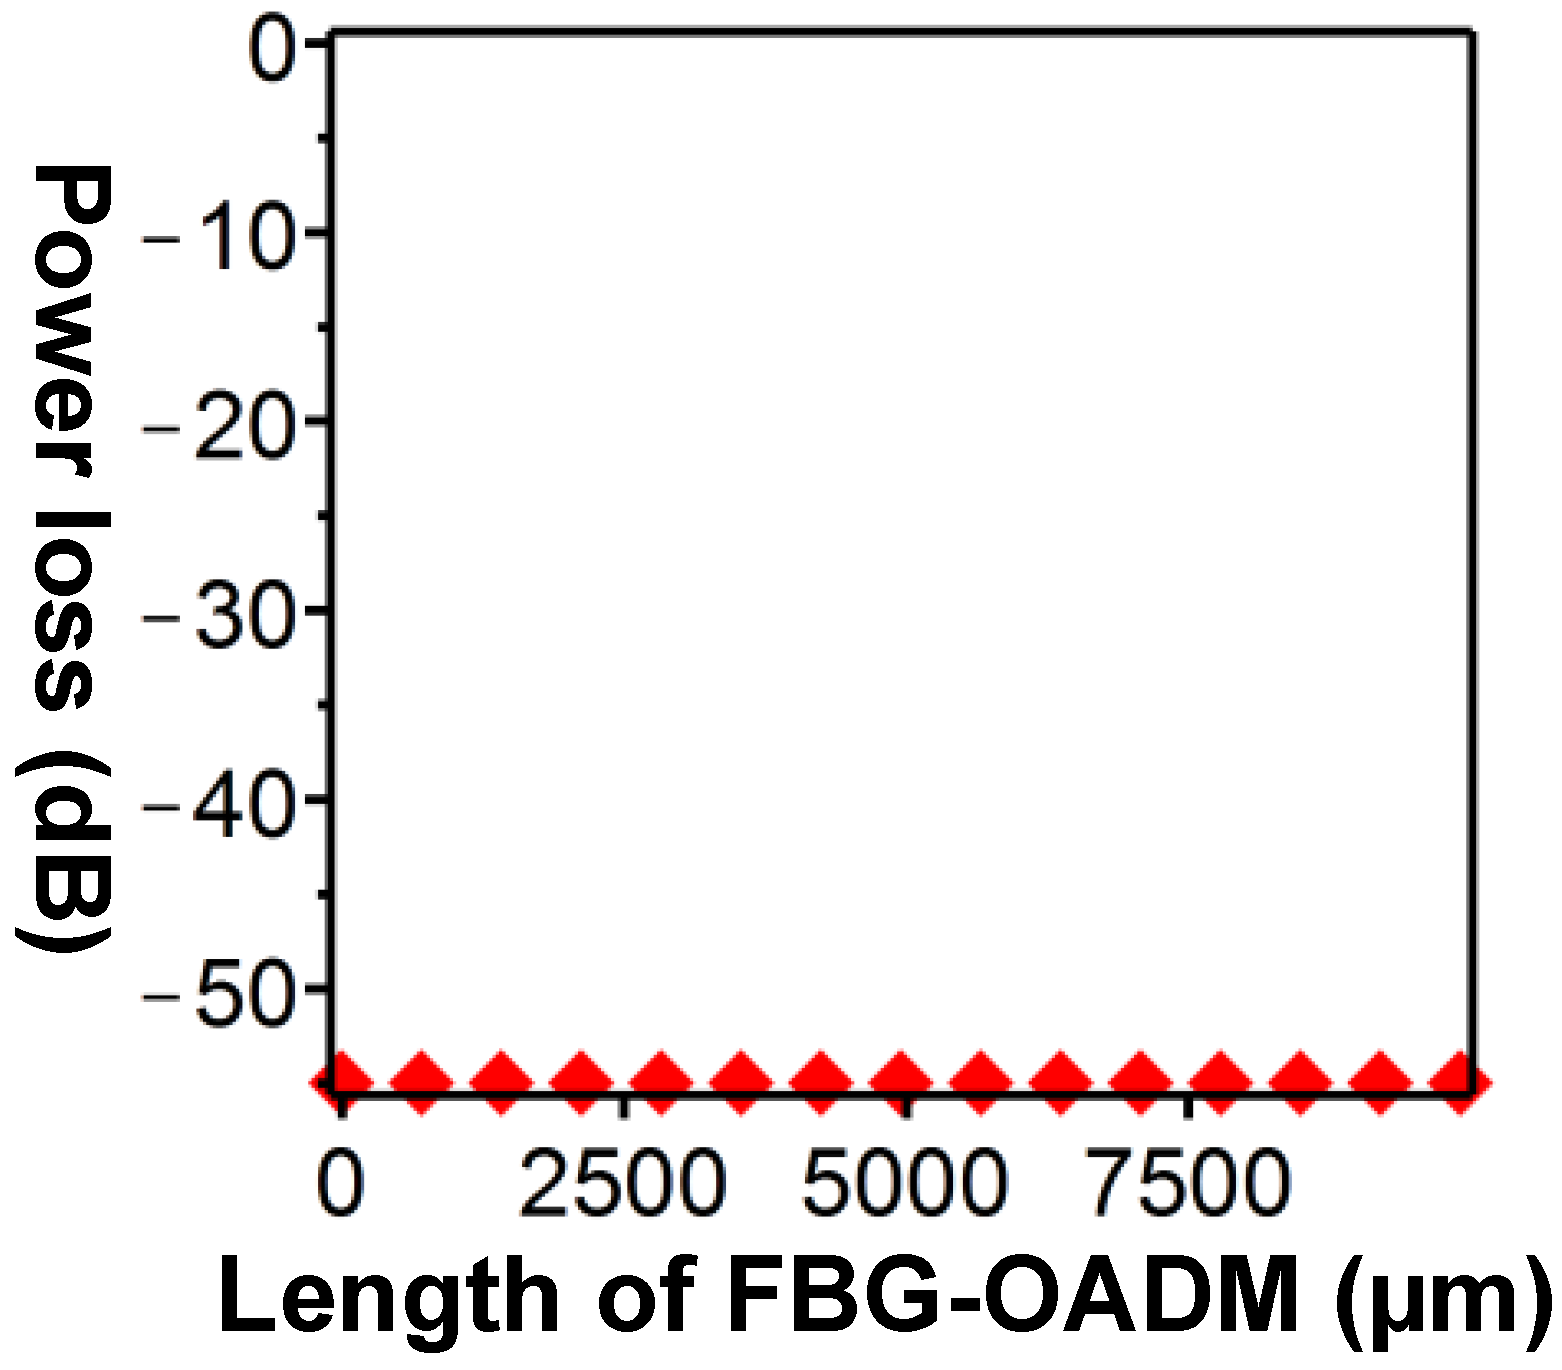
Section 4, a small amount of power loss can be observed in all modes during transmissions; to address this, the power loss review standard was established.
Figure 12 details the correlations between the power loss and length of the FBG-OADM, showing that the power loss in the power transmission over the entire FBG-OADM met the review standard for all segment cycles (
).
To verify that the optimal parameter values were
ΛFBG = 0.5396 μm and
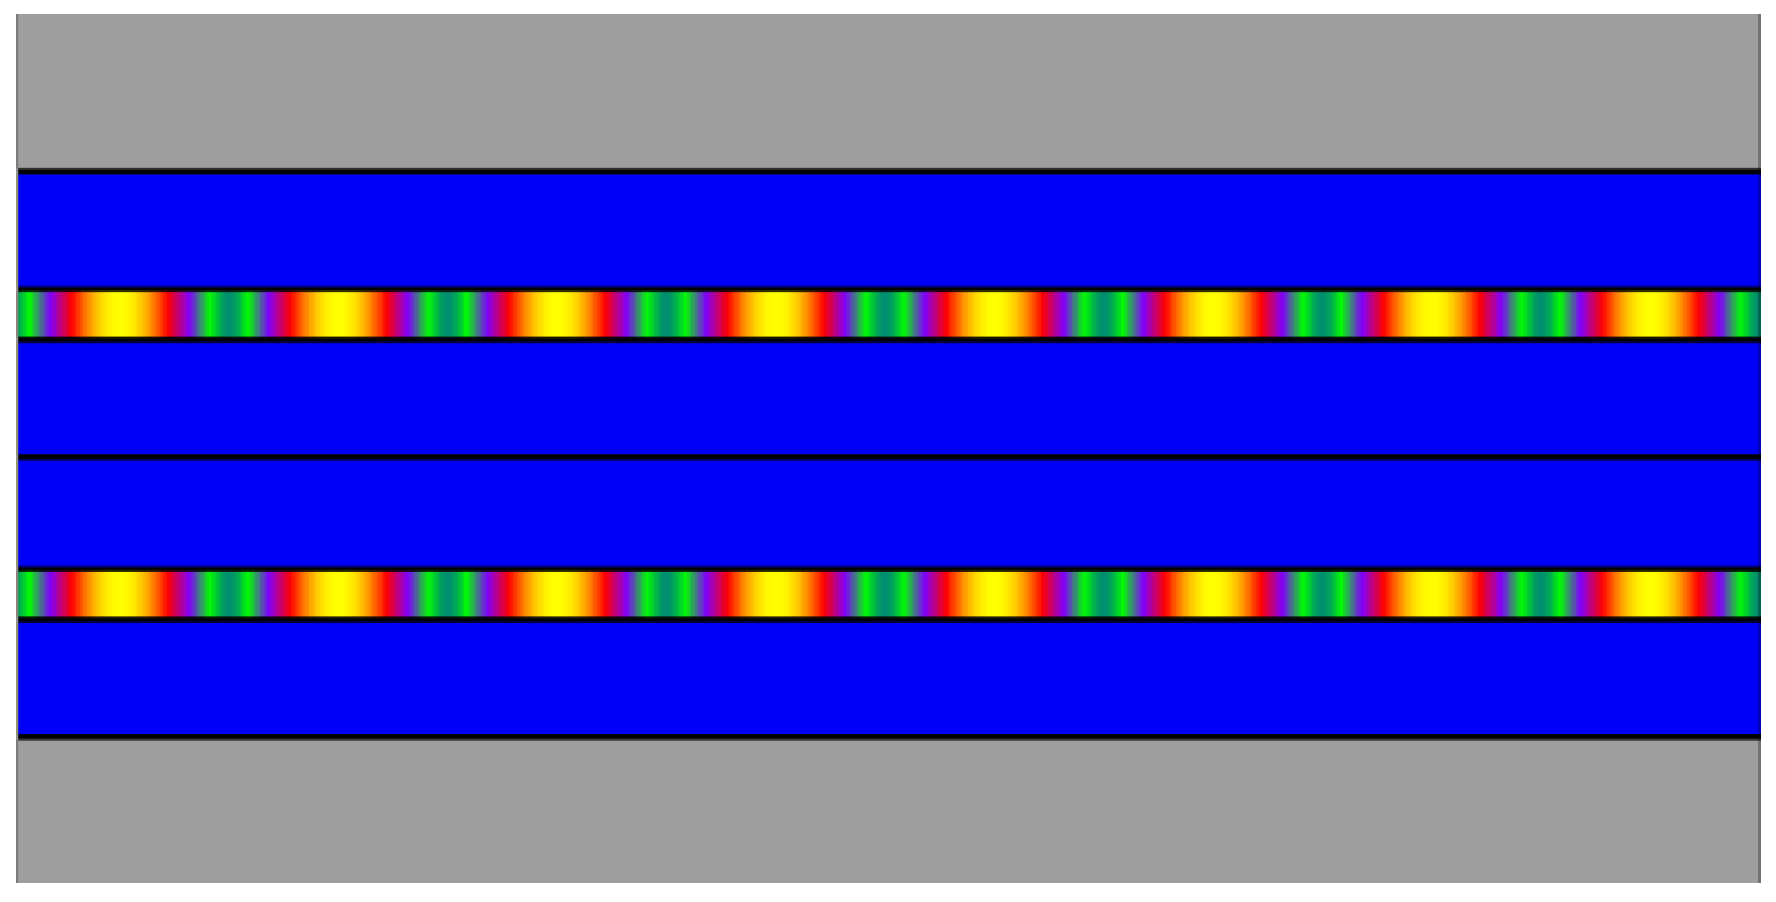
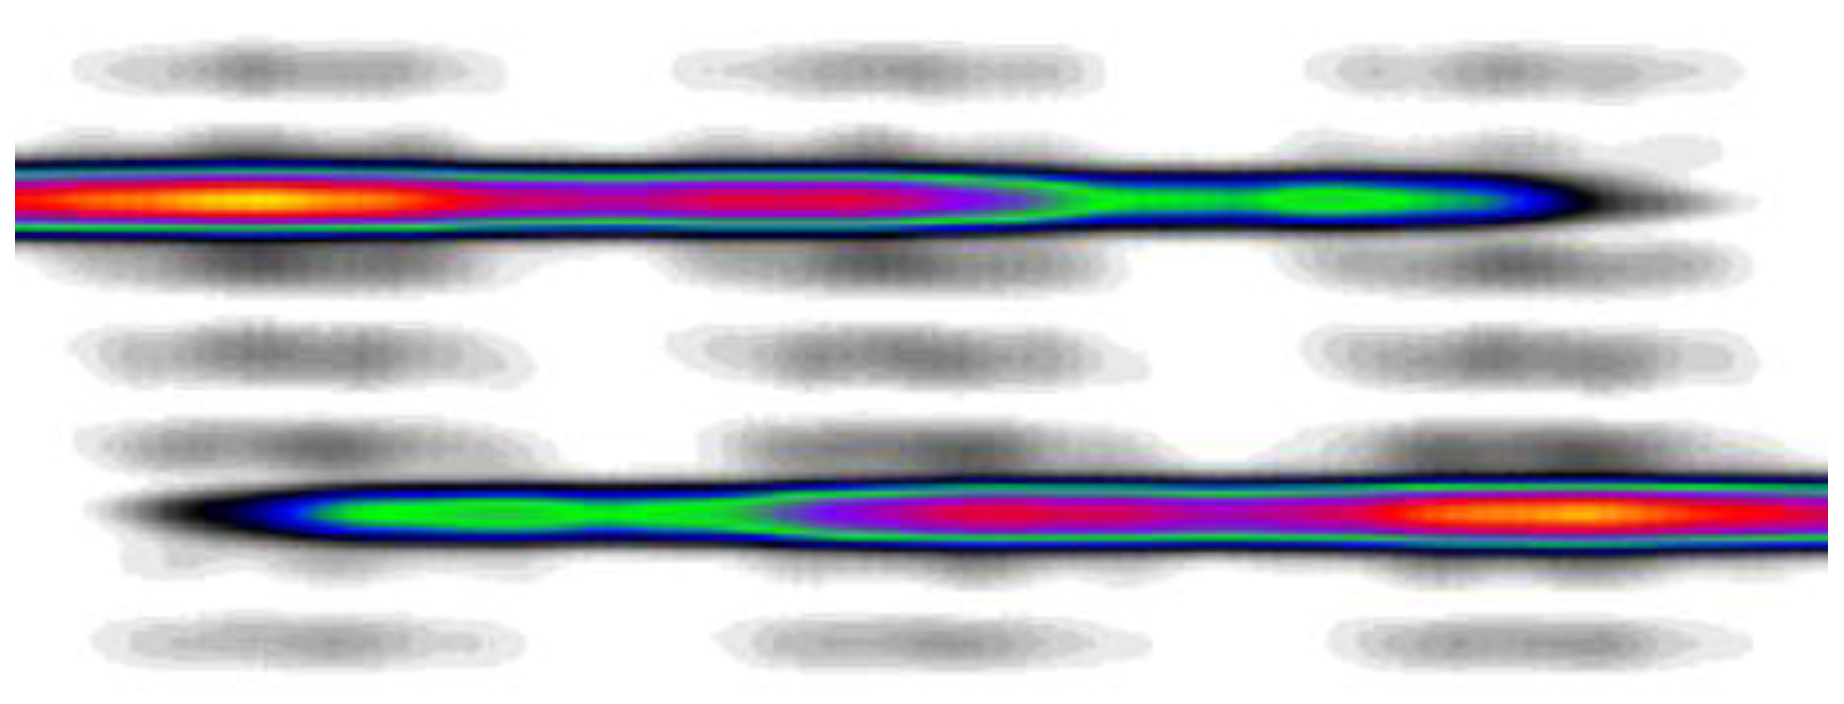
= 18,361, the power transmission along the
X-Z plane was examined with light inputted via the input port of the FBG-OADM, as shown in
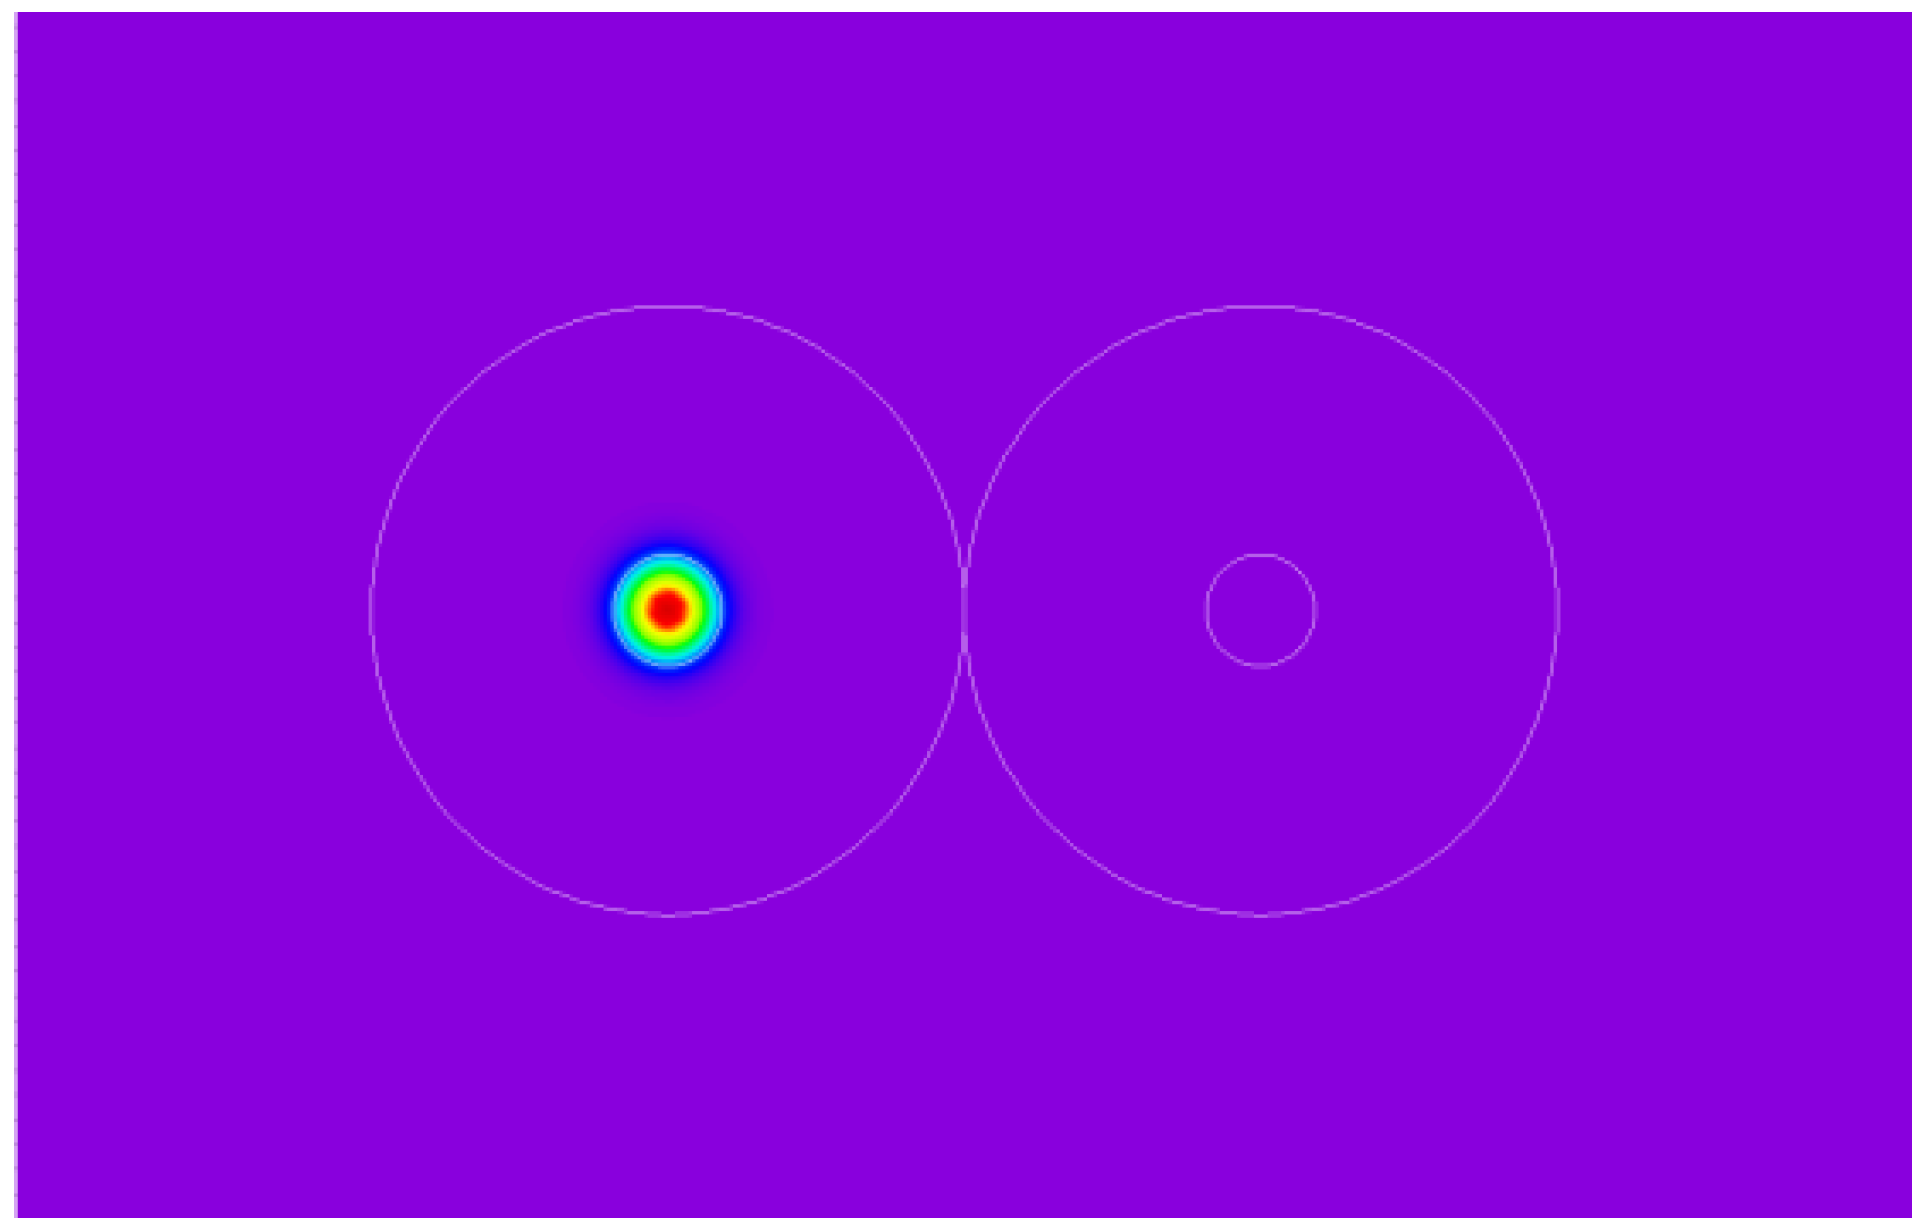
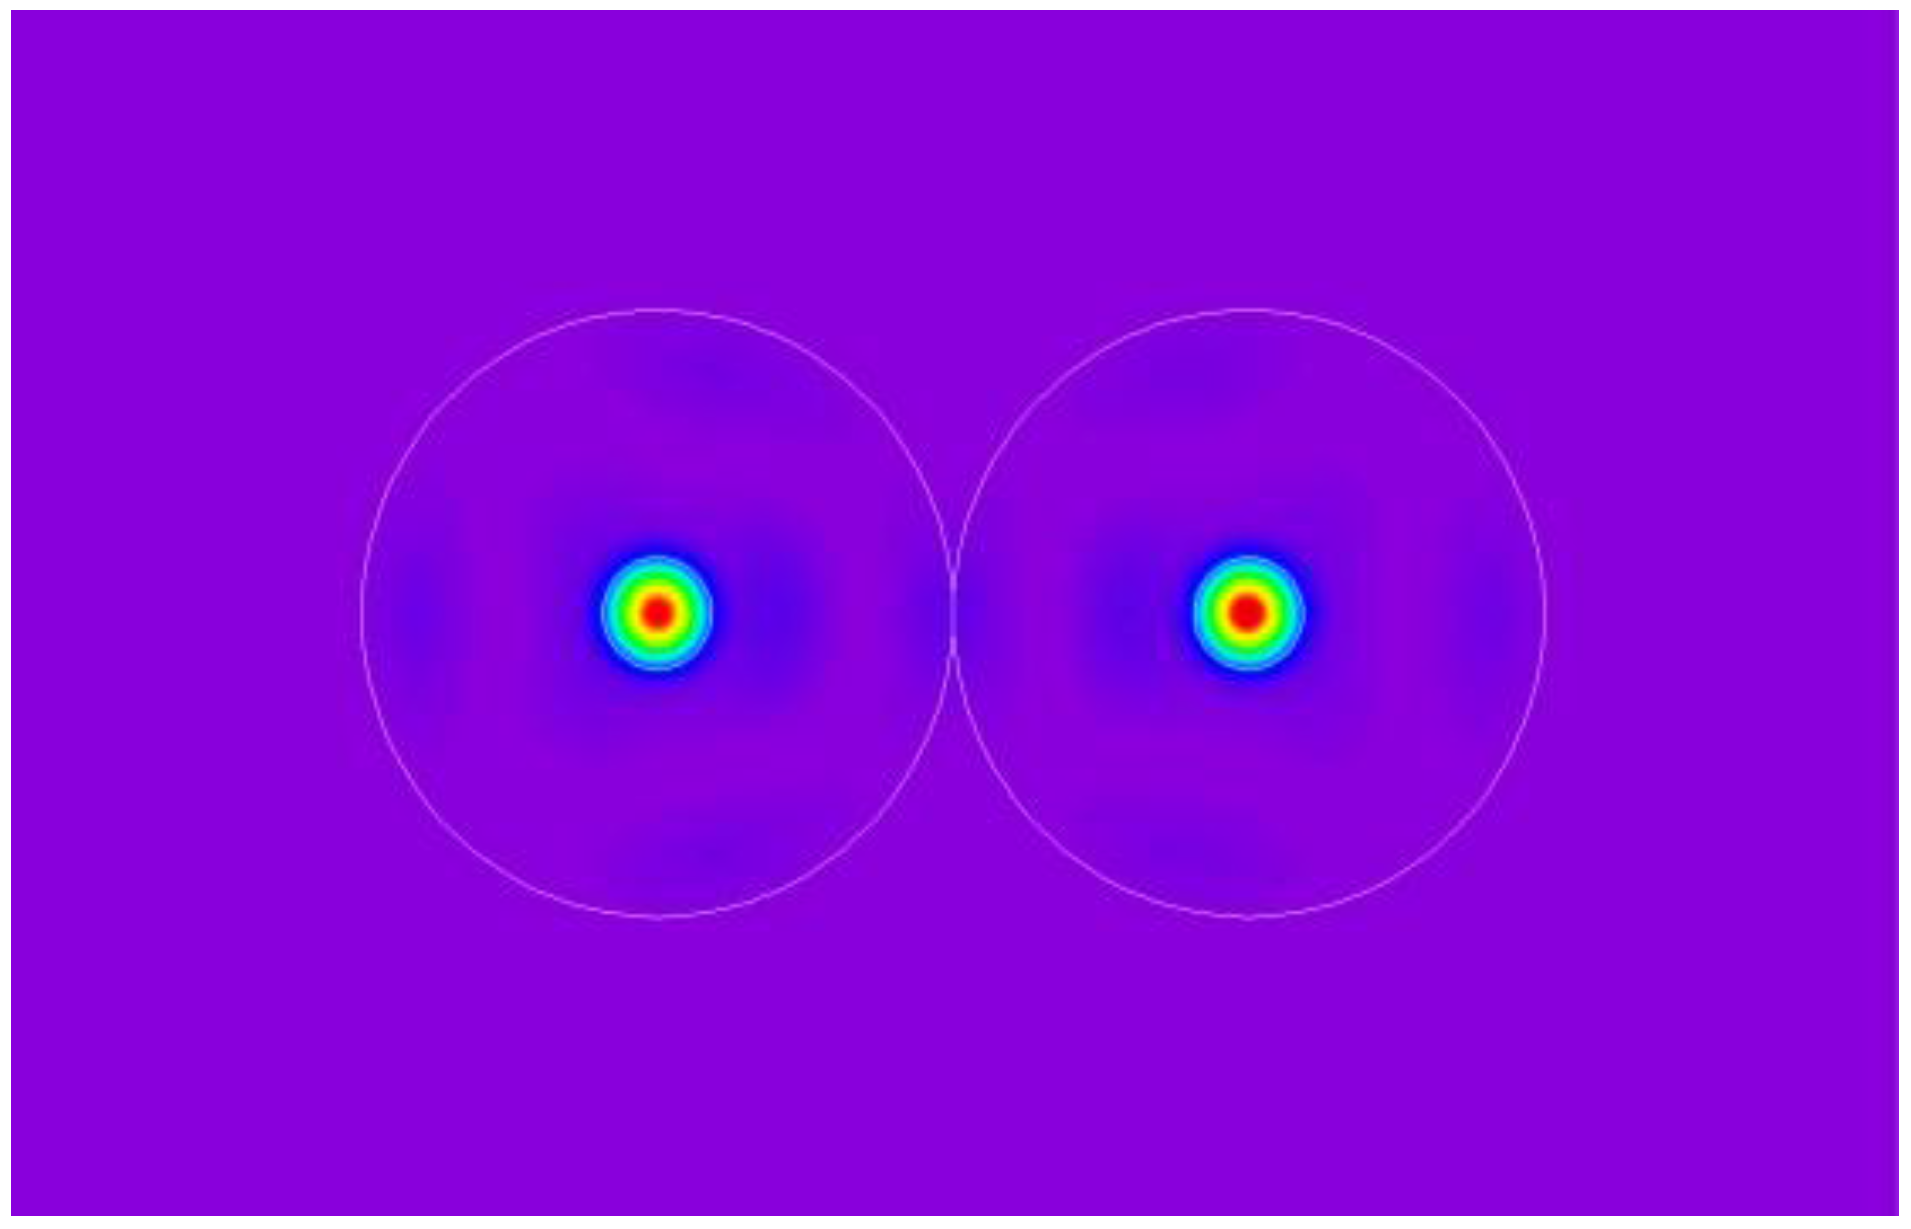
Figure 13. The figure shows that the input power was successfully coupled to the drop port of Fiber 2. To further investigate the coupling performance, a 2D power distribution map of the input port,
z = 4955.3991 μm, and drop port were collected, as shown in
Figure 14,
Figure 15 and
Figure 16.
Figure 14 shows the power distribution map of the input port.
Figure 15 displays the 2D power distribution during coupling, showing the perturbation effect of the FBG inducing the core mode to couple to the cladding mode, as well as the cladding mode under the effect of the 2 × 2 optical fiber coupler, which facilitated cross-coupling between the two optical fibers.
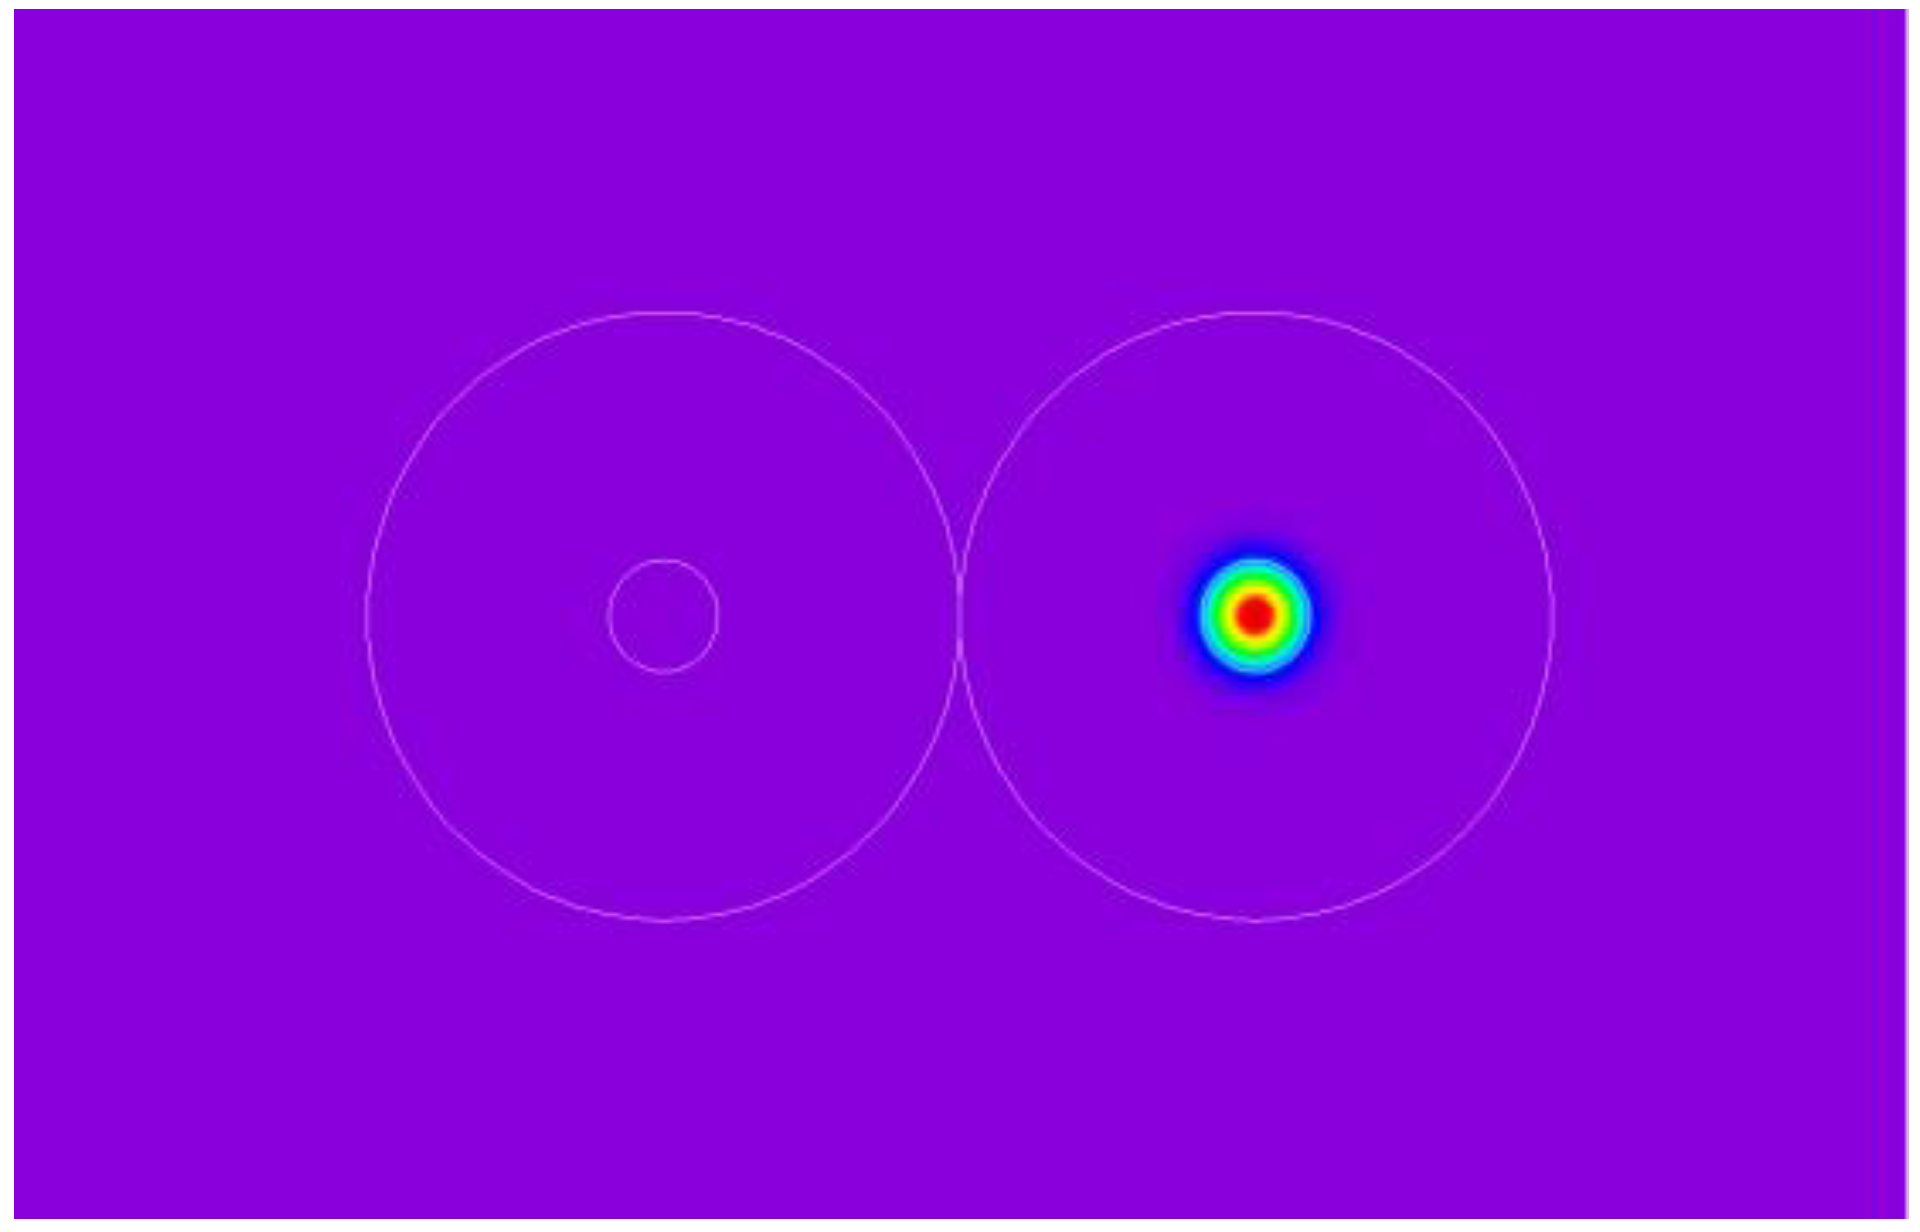
Figure 16 is the power distribution map of the drop port, showing that the cladding mode was subjected to the perturbation effect of the FBG, causing cladding mode to couple to the core mode. Thus, the numerical simulation results in
Figure 13,
Figure 14,
Figure 15 and
Figure 16 confirm the accuracy of the proposed FBG-OADM.
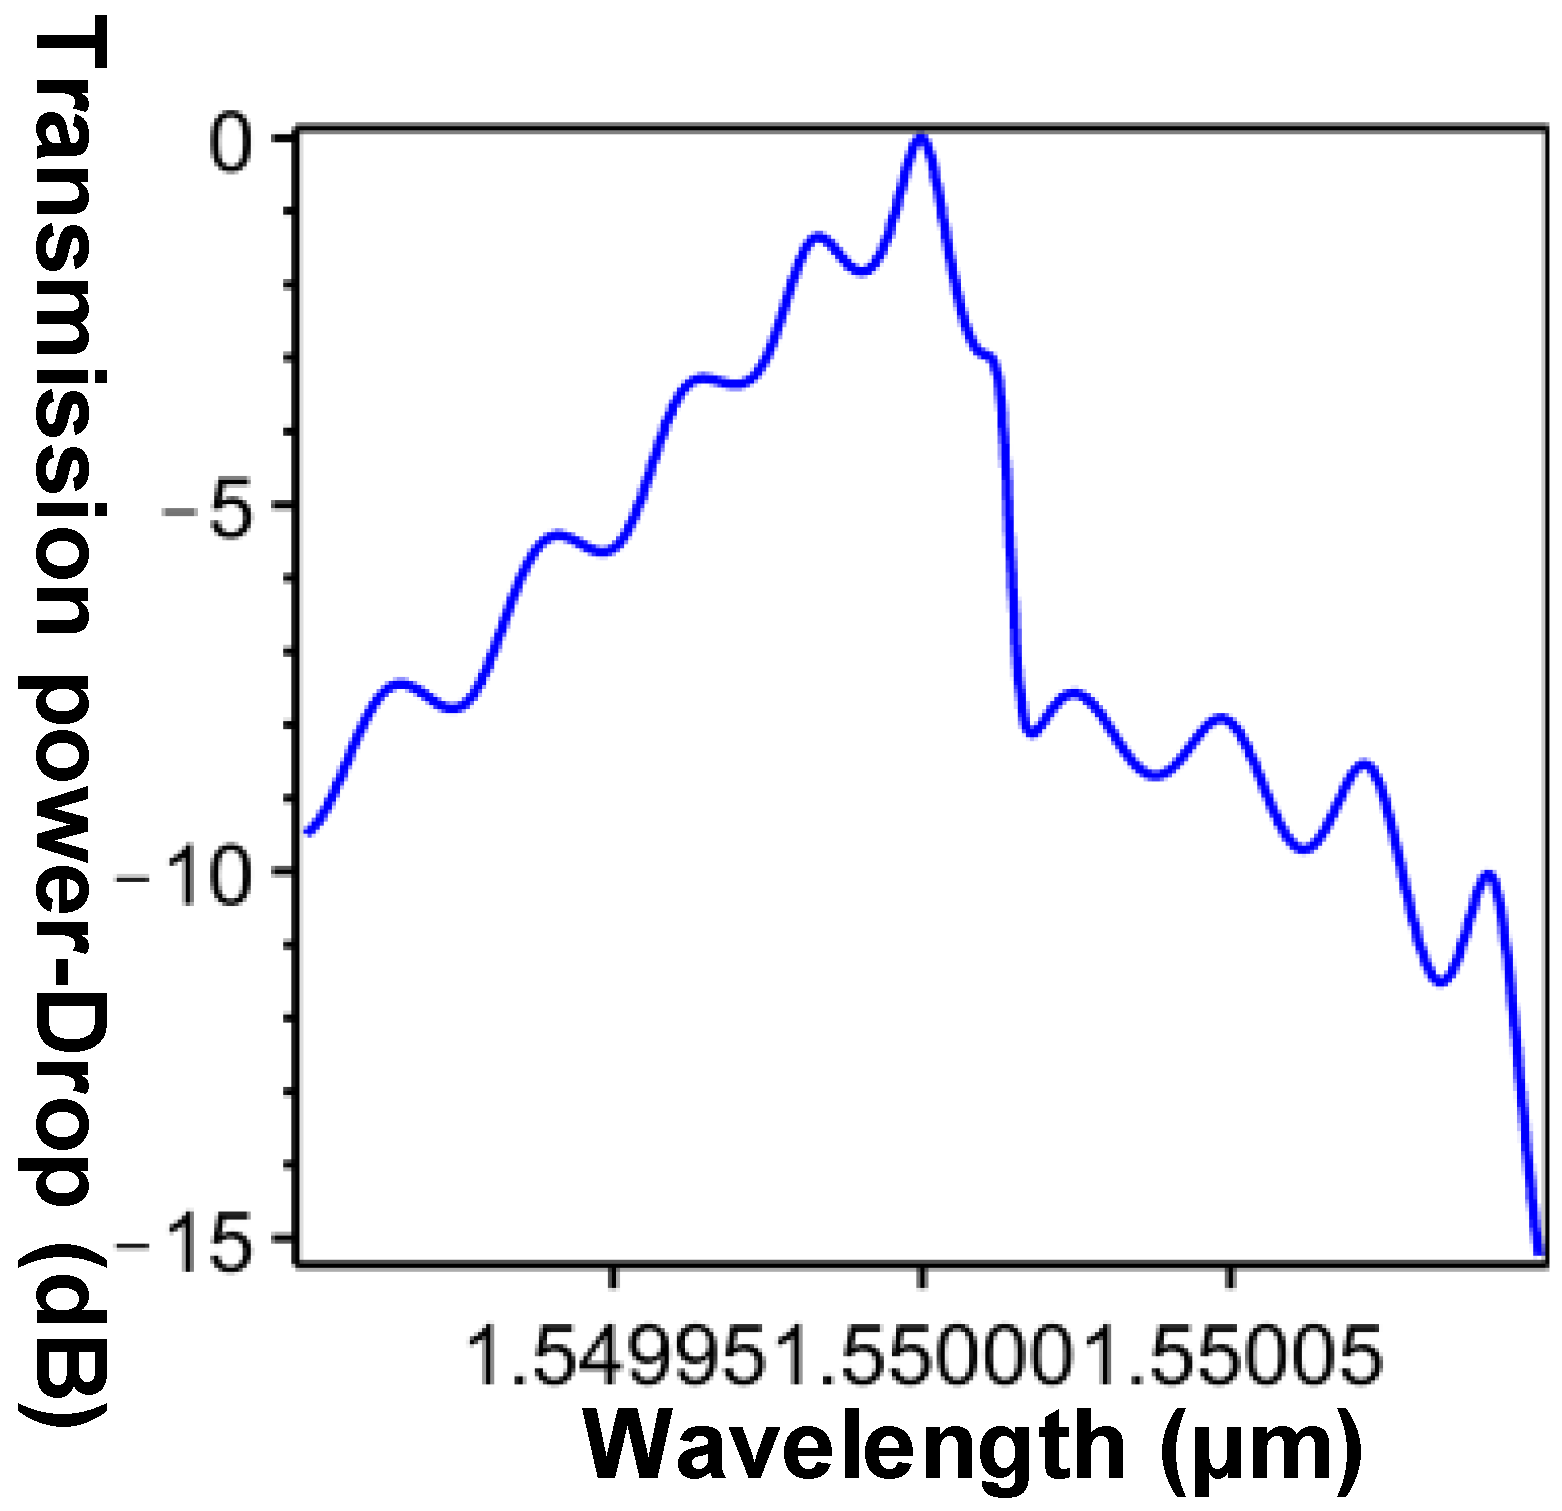
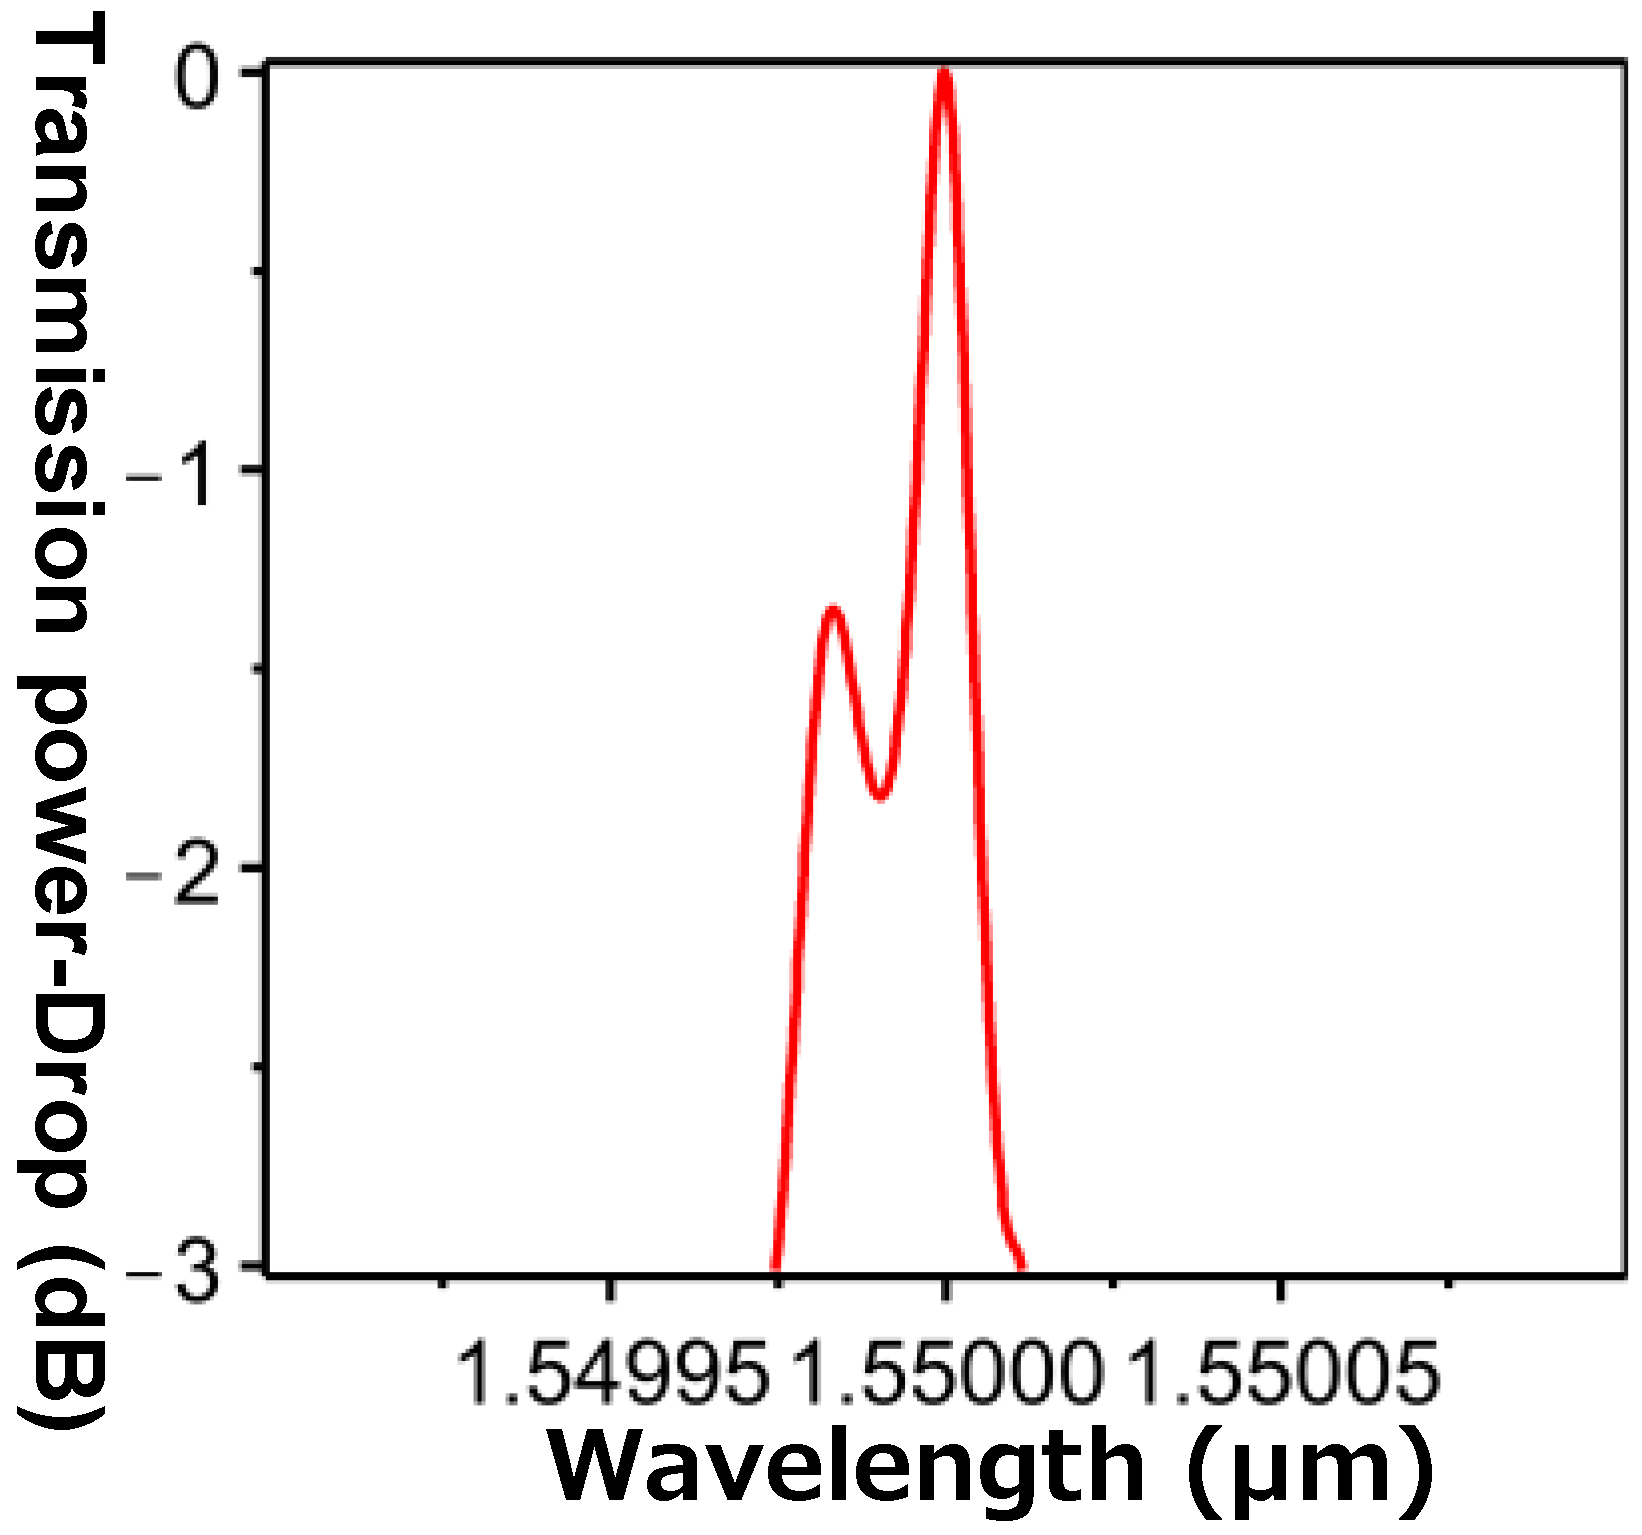
To investigate whether the −3 dB bandwidth of the proposed FBG-OADM satisfied the ITU guidelines, the spectrum of the drop port was plotted, as shown in
Figure 17. The figure shows that the FBG-OADM exhibited transmission power of 0 dB in the drop port. In other words, power inputted via the input port was outputted via the drop port with zero power loss, showing that heterodyne and homodyne crosstalk were unlikely to occur in the FBG-OADM. When an OADM drops a signal, power that is not outputted via the drop port of Fiber 2 is restored in the output port in the form of residual power, which creates heterodyne crosstalk with other wavelengths. Similarly, when an OADM adds a signal, power remaining in the output port creates homodyne crosstalk.
Figure 18 shows the −3 dB spectrum of the drop port, indicating that the FBG-OADM demonstrated considerably high bandwidth efficiency. In addition, the FBG-OADM exhibited an FWHM of ≤0.0375 nm (i.e., ≤0.0000375
), which is markedly lower than the ITU requirement for DWDMs (FWHM < 0.4 nm). In this simulation, four Intel Xeon CPUs (E7530@1.87 GHz) and 128 GB memory were used and the computation time was approximately 118 h.
6. Conclusions
The emergence of optical fiber technology in recent years has considerably improved network stability and bandwidth development. OADMs are crucial components for connecting computers in fiber-optic networks. In the past several decades, many types of OADMs have been introduced and used in network systems. Of all the OADMs currently available, the most common one is composed of an FBG and two optical circulators. However, this particular OADM is disadvantageous because of its large size and high-cost, complex production process. The proposed high-performance FBG-OADM model, which was developed on the basis of optical coupling theory, overcomes these shortcomings. The model comprises two SMFs, which are placed side by side so that they work in the same manner as a 2 × 2 optical fiber coupler, and two FBGs, which have identical parameters so that they work in the same manner as a mode coupler. To analyze the performance of the FBG-OADM, simulations were performed to predict the performance of the device in a real-world environment. The simulated system comprised an internal part (for simulating the FBG-OADM) and an external part (for simulating the radiation mode absorption). The combination of the FEM and the EEM provided a rigorous yet simple process for designing OADMs and for testing models in an environment that is comparable to the real world. Next, the results were produced in the form of graphs. Concerning the design structure, the FEM was used to obtain solutions for the guided modes in the FBG-OADM and to analyze the modes. Next, the EEM was employed to simulate the guided modes for power transmission simulations. In cyclic components such as the FBG-OADM, because guided modes are identical during a cycle, using the FEM to obtain solutions for the guided modes and using the EEM to simulate power transmission inference during each cycle yielded results representing the simulation results of the overall FBG-OADM. This considerably reduced the memory and computation time requirements for the simulations. When optical signals are inputted into an internal simulation structure, they create both discrete guided modes and continuous radiation modes. However, because continuous radiation modes are considered power loss in real-world environments, they cannot be measured. Therefore, this study designed an external simulation, in which two numerical methods were used to simulate the PRB and PML in order to reduce discrepancies between the simulations and actual performance results. The PRB was used to convert continuous radiation modes into discrete radiation modes, and the PML was used to absorb the power of the discrete radiation modes.
The numerical simulations revealed the optimal FBG-OADM cycle (i.e., ΛFBG = 0.5396 μm) as well as the optimal number of period (i.e., = 18,361). These two parameters were used to develop the high-performance FBG-OADM. The findings are summarized as follows: (1) the orthogonal values between all guided modes satisfied the preset orthogonal value review standard; (2) power loss during transmission in the FEM simulations met the preset power loss review standard; (3) the 2D power distribution maps of the input and drop ports showed that the FBG-OADM accurately transmitted and dropped signals; (4) the frequency distribution of the drop port showed that at an operating wavelength () of 1550 nm, the power approximated 0 dB, indicating that homodyne and heterodyne crosstalk did not occur; and (5) the FBG-OADM exhibited an FWHM of 0.0375 nm, which is lower than the ITU requirement for DWDMs. These simulation results confirm the feasibility and accuracy of the proposed FBG-OADM, the advantages of which are that it is a miniature-sized all-optical fiber-based multiplexer with a low FWHM and that it can be fabricated through a low-cost and simple manufacturing process.


