
Numerical Simulation of Multi-Crystalline Silicon Crystal Growth Using a Macro–Micro Coupled Method during the Directional Solidification Process


Abstract
:1. Introduction
2. Mathematical Model
2.1. Model of Temperature Distribution
2.1.1. Macrocosmic Temperature Field
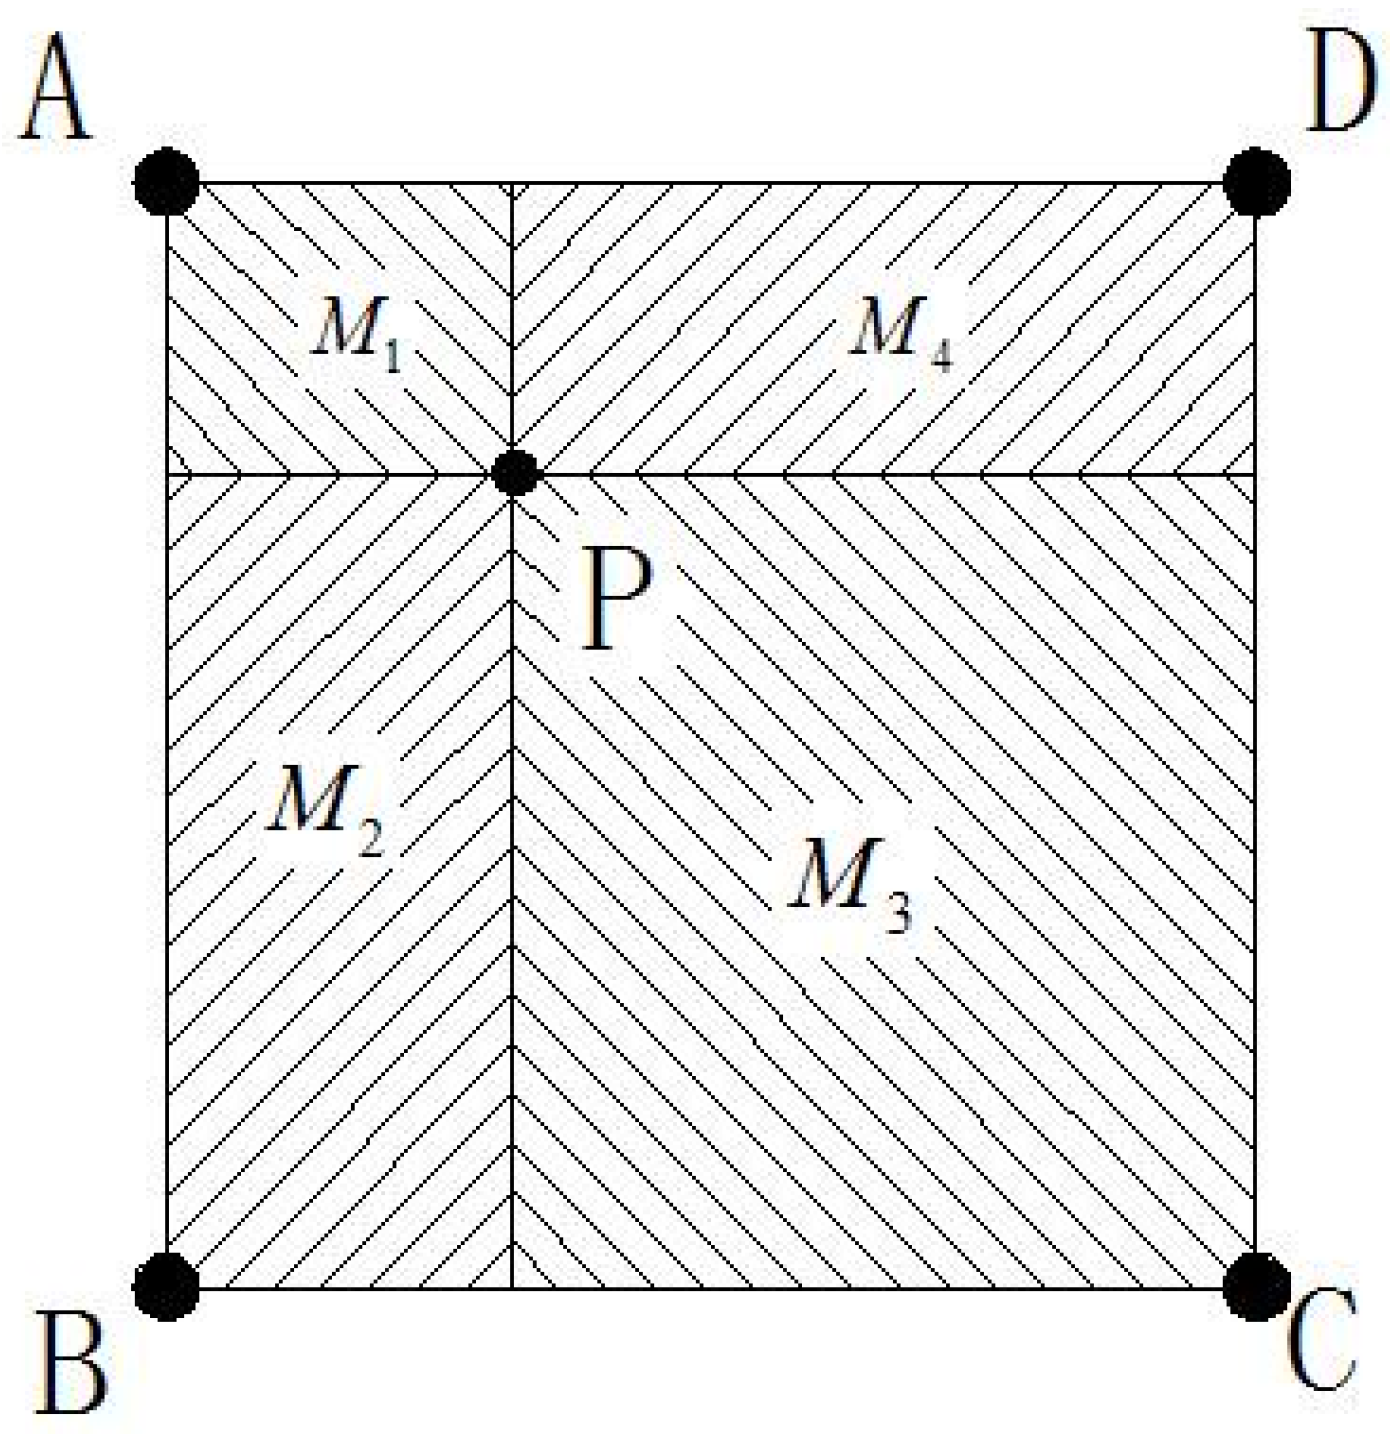
2.1.2. Microcosmic Temperature Field
2.2. Model of Nucleation
2.3. Model of mc-Si Ingot Growth
3. Results and Discussion
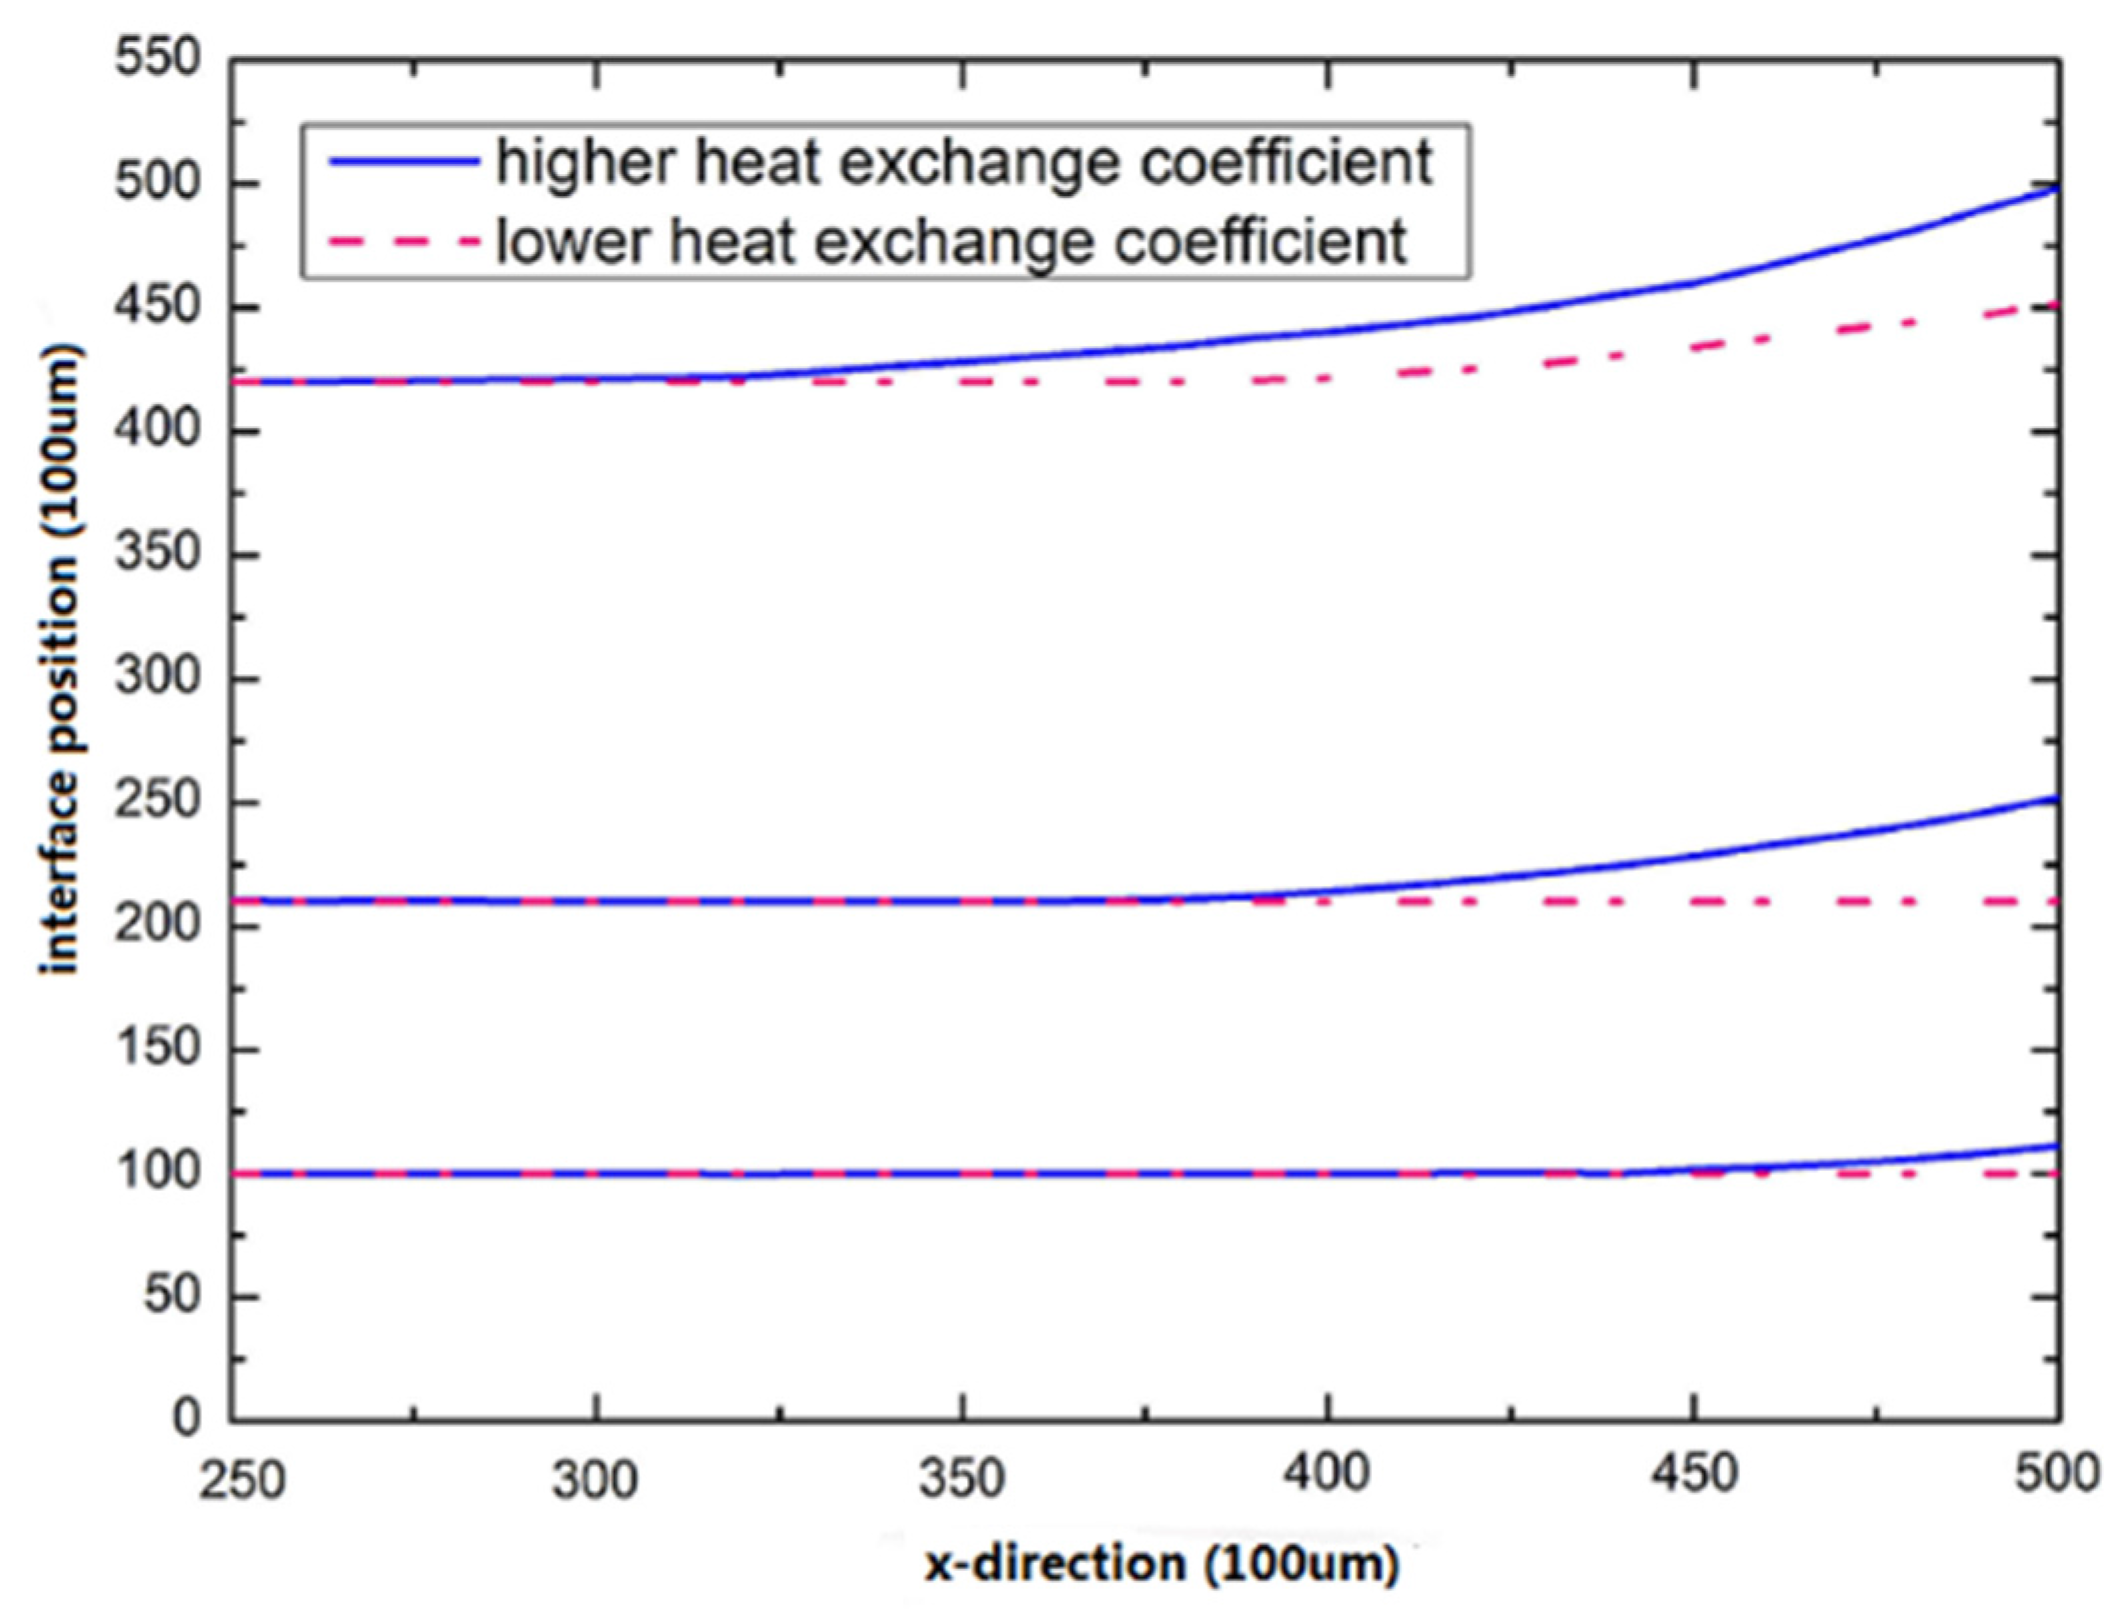
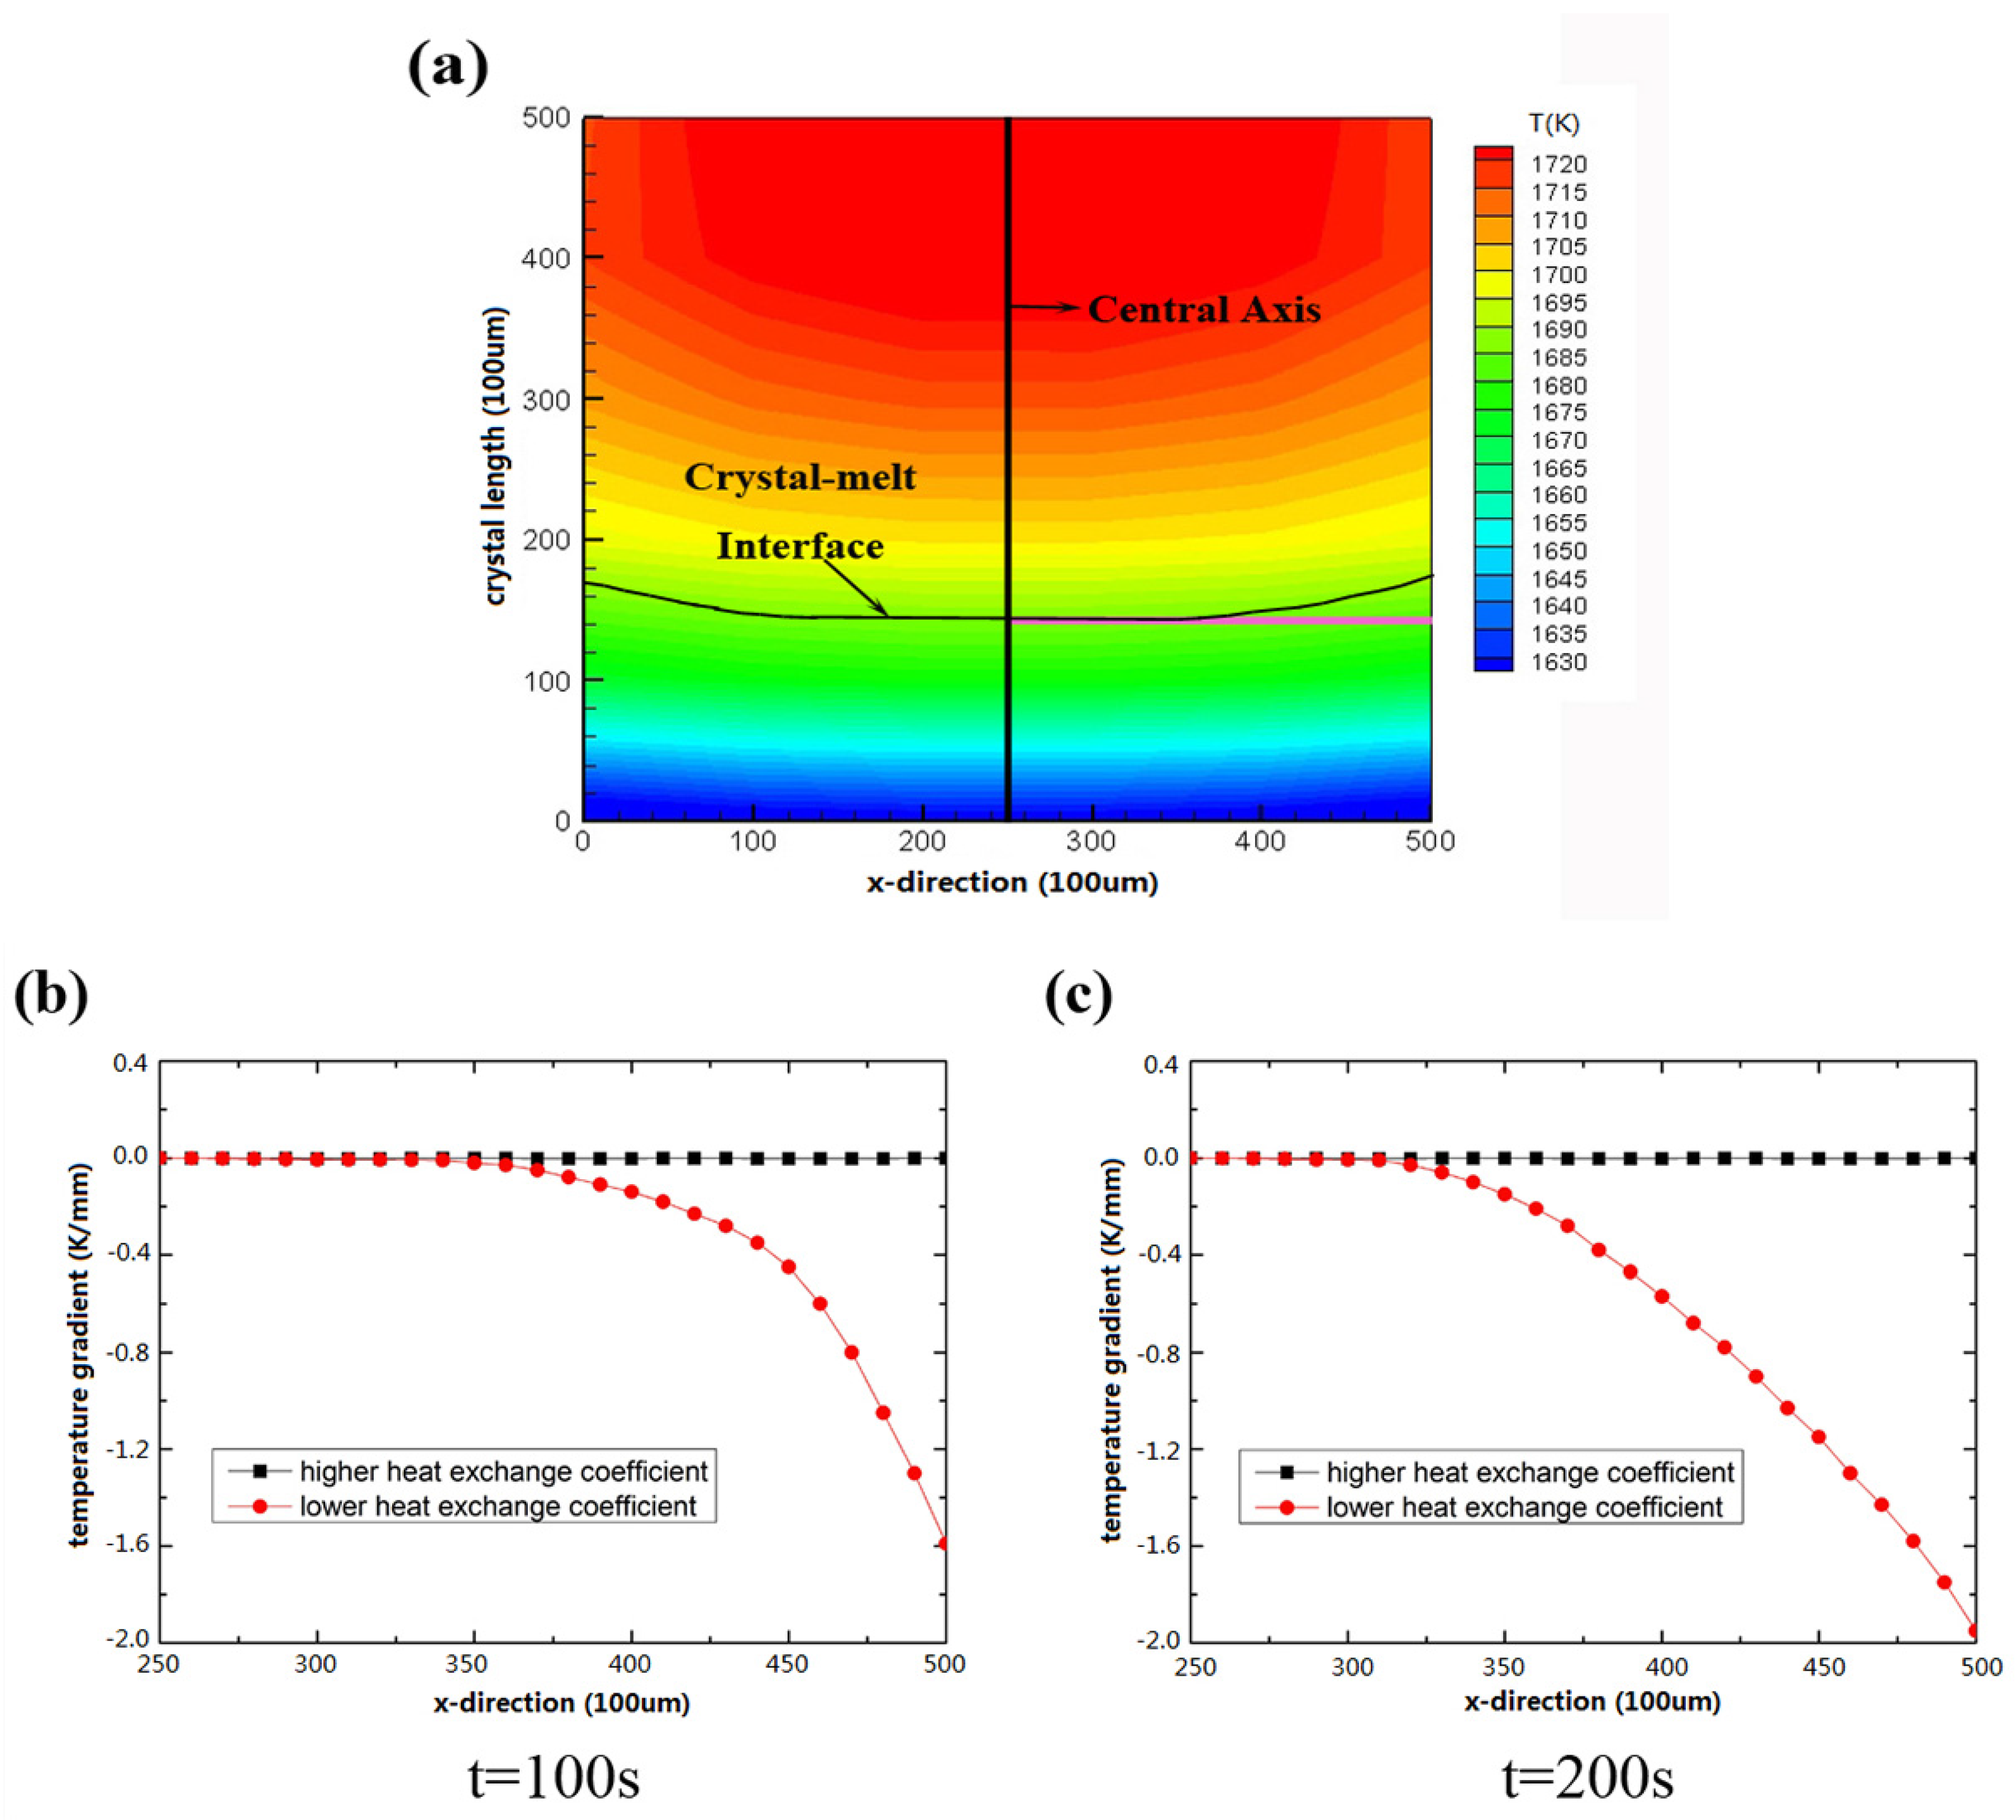
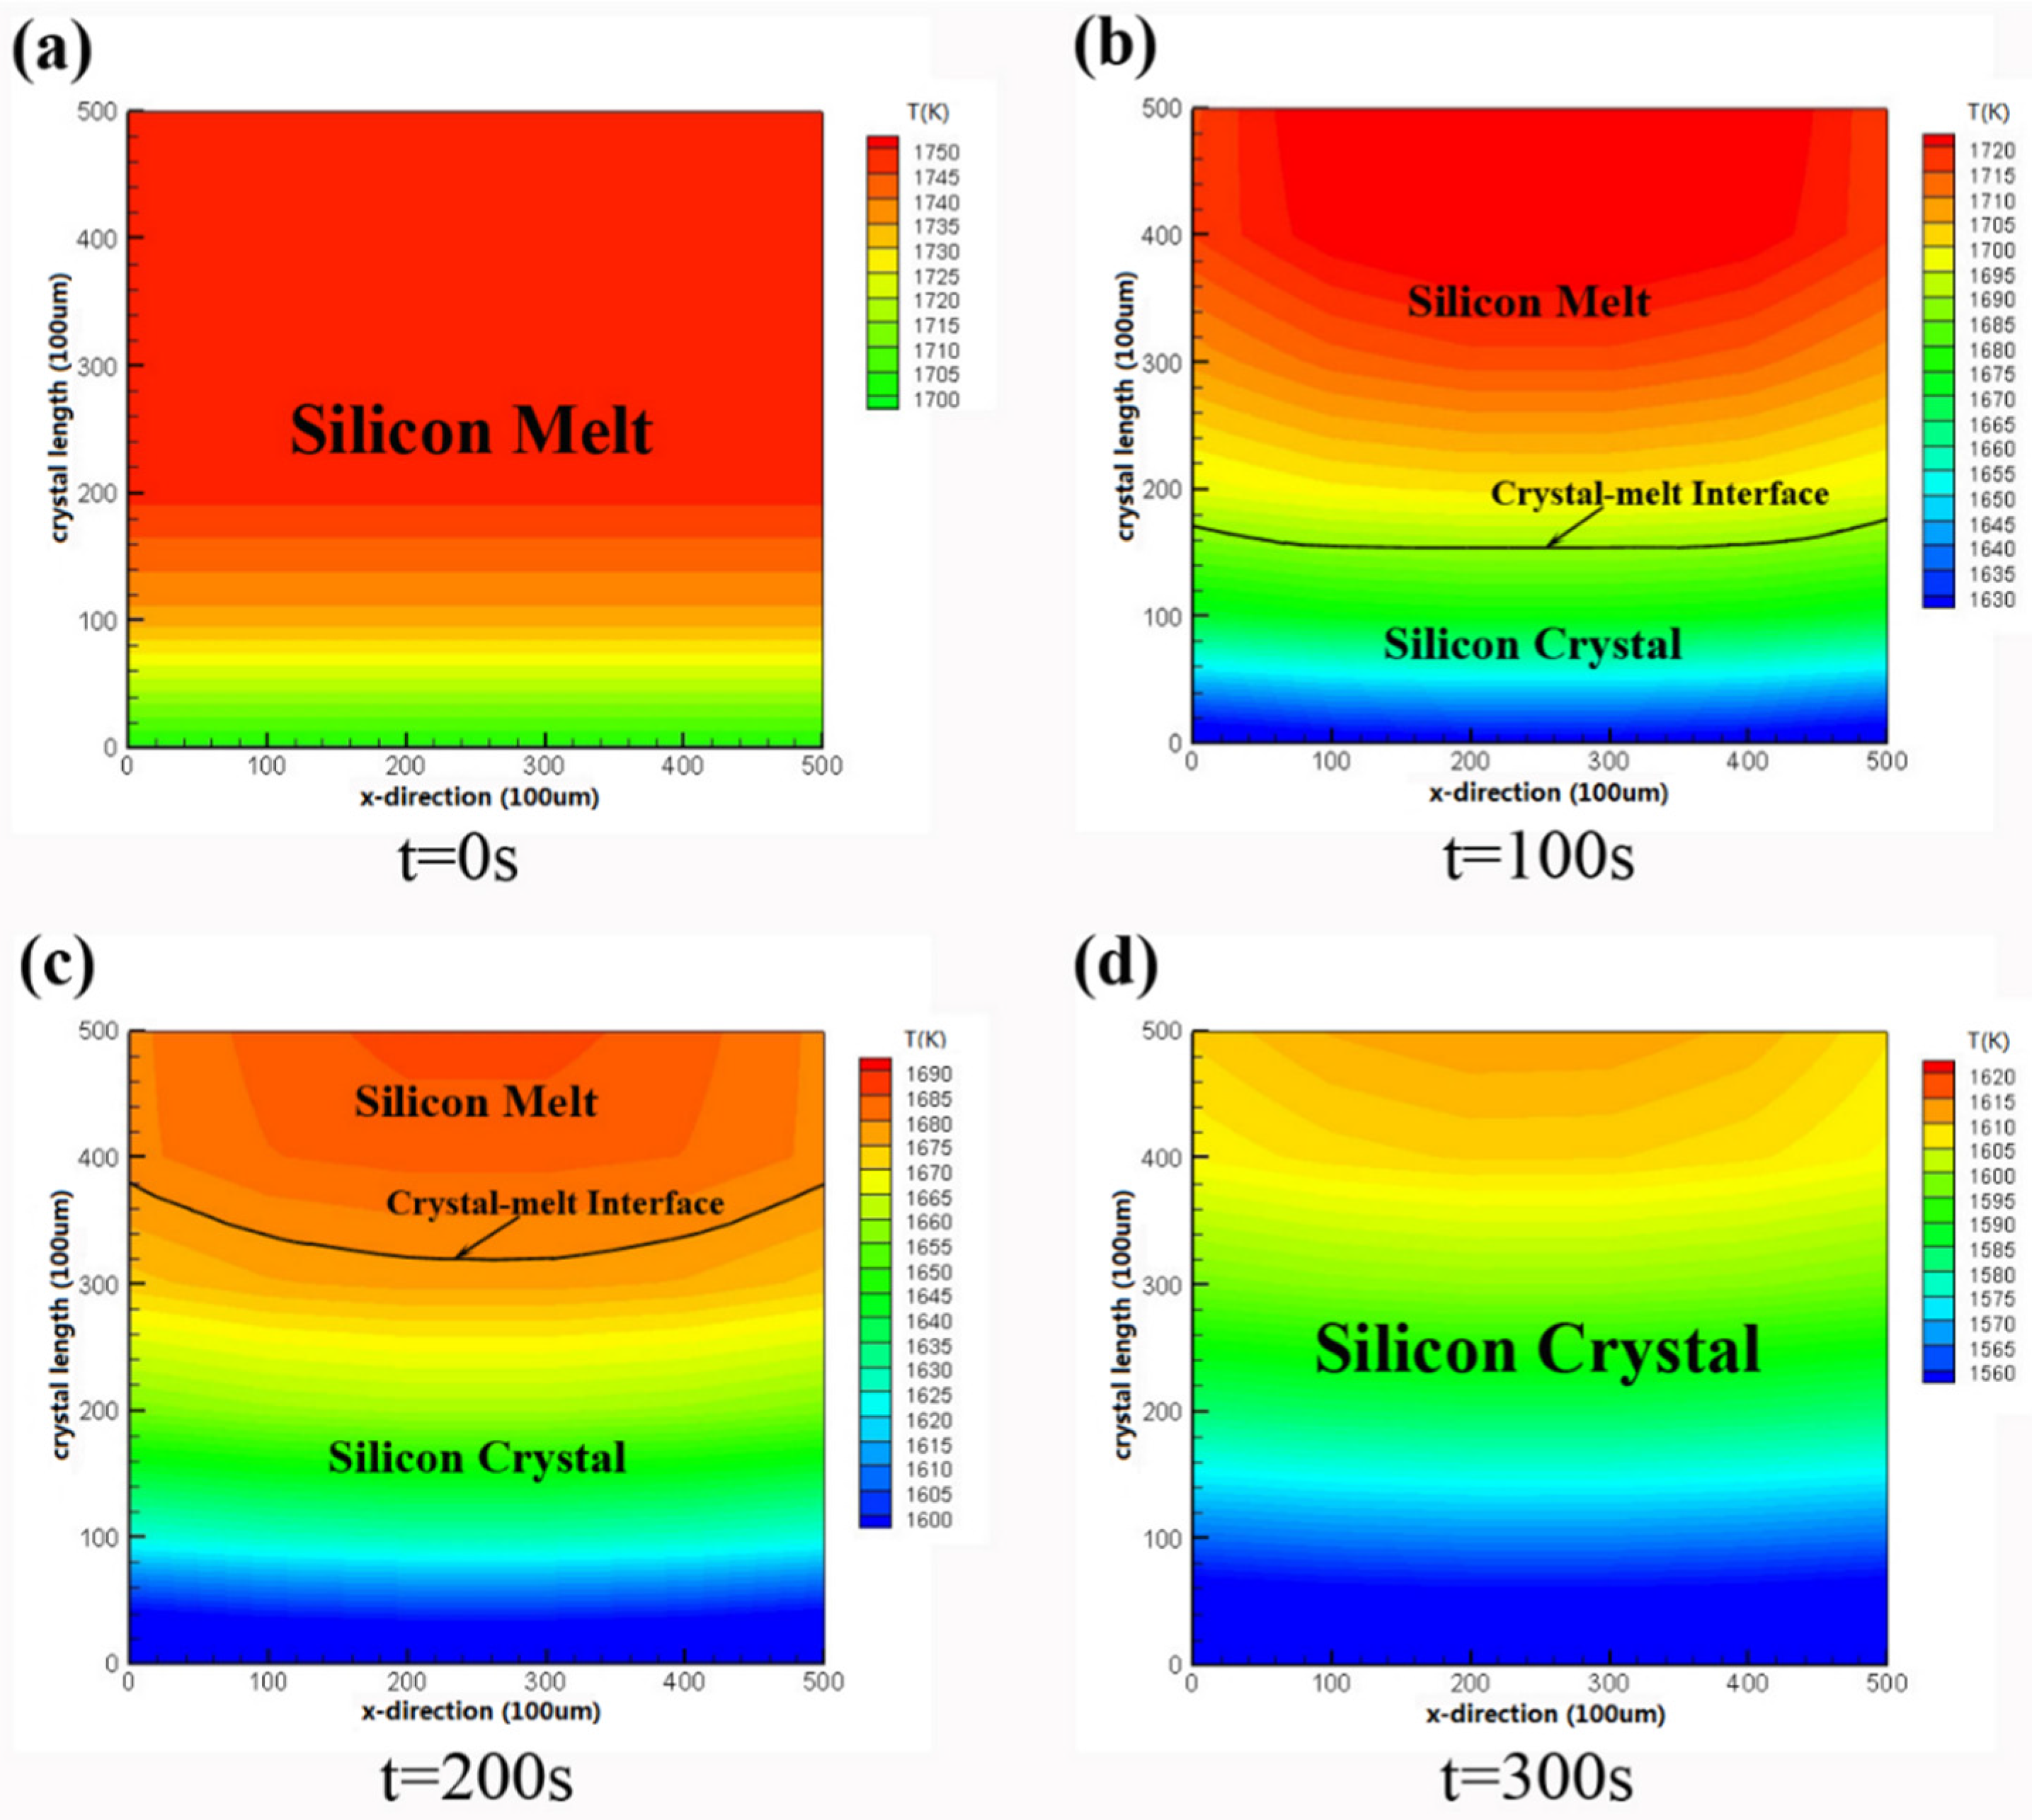
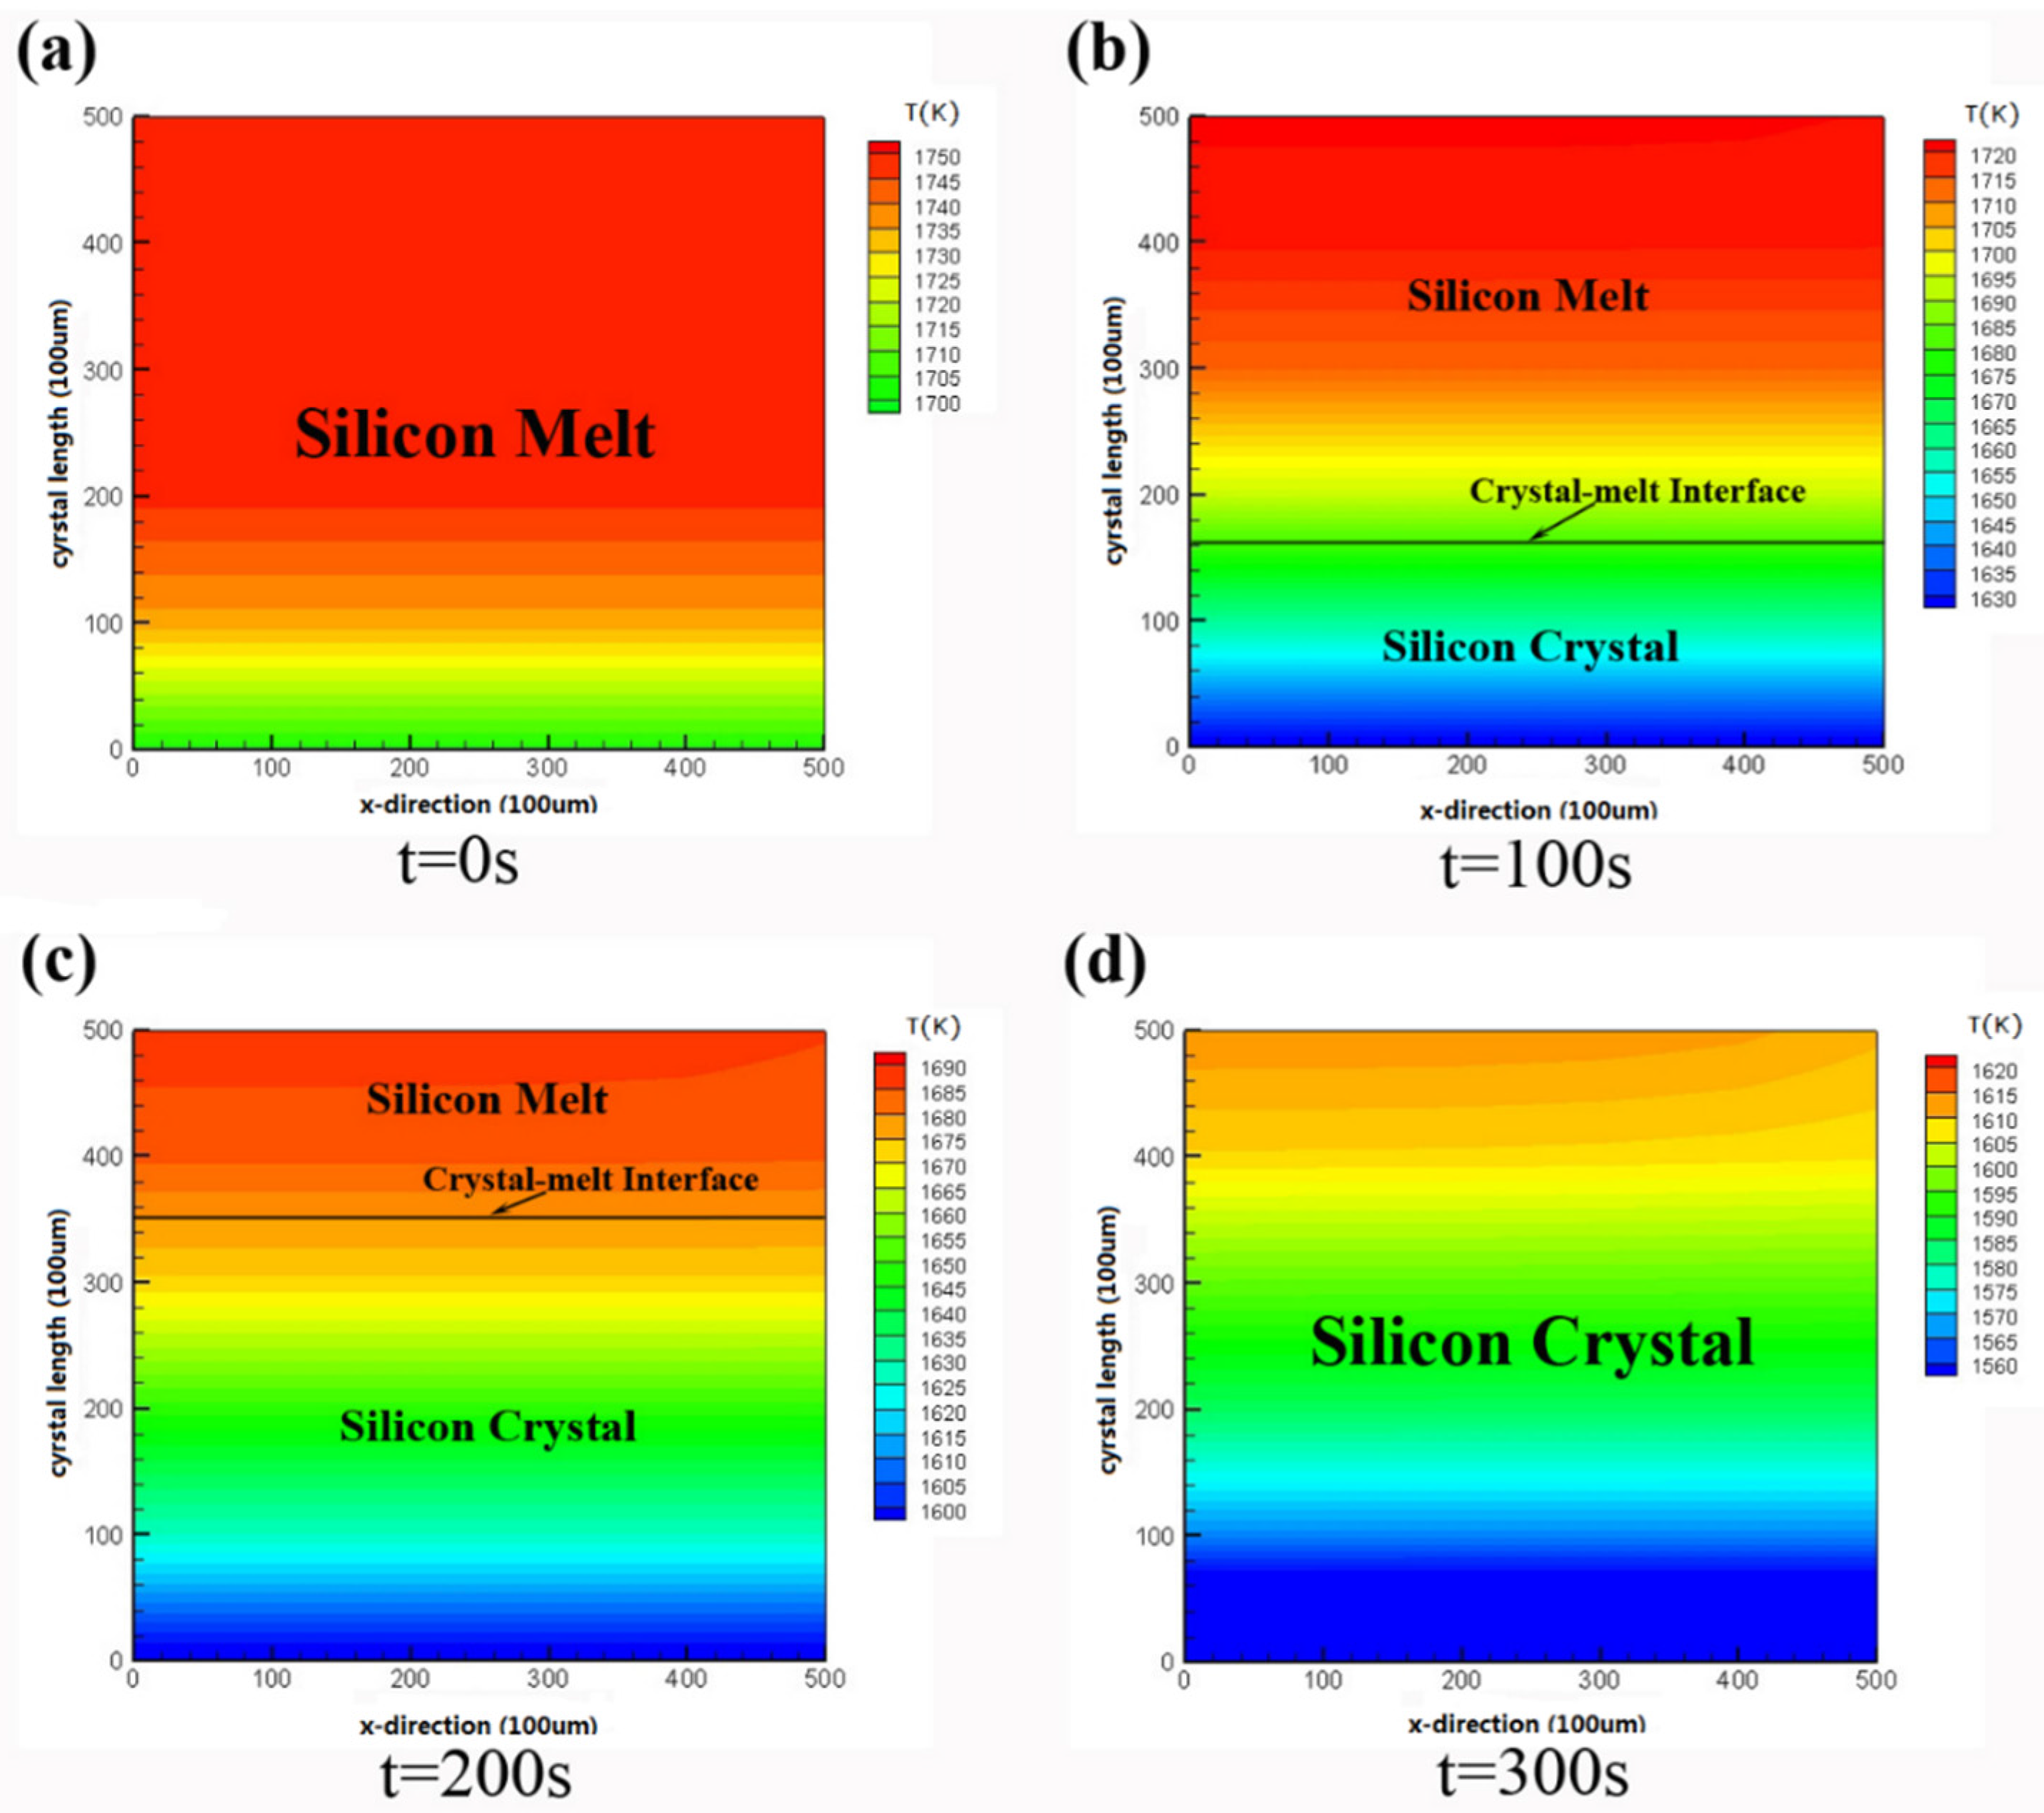
3.1. Temperature Distribution
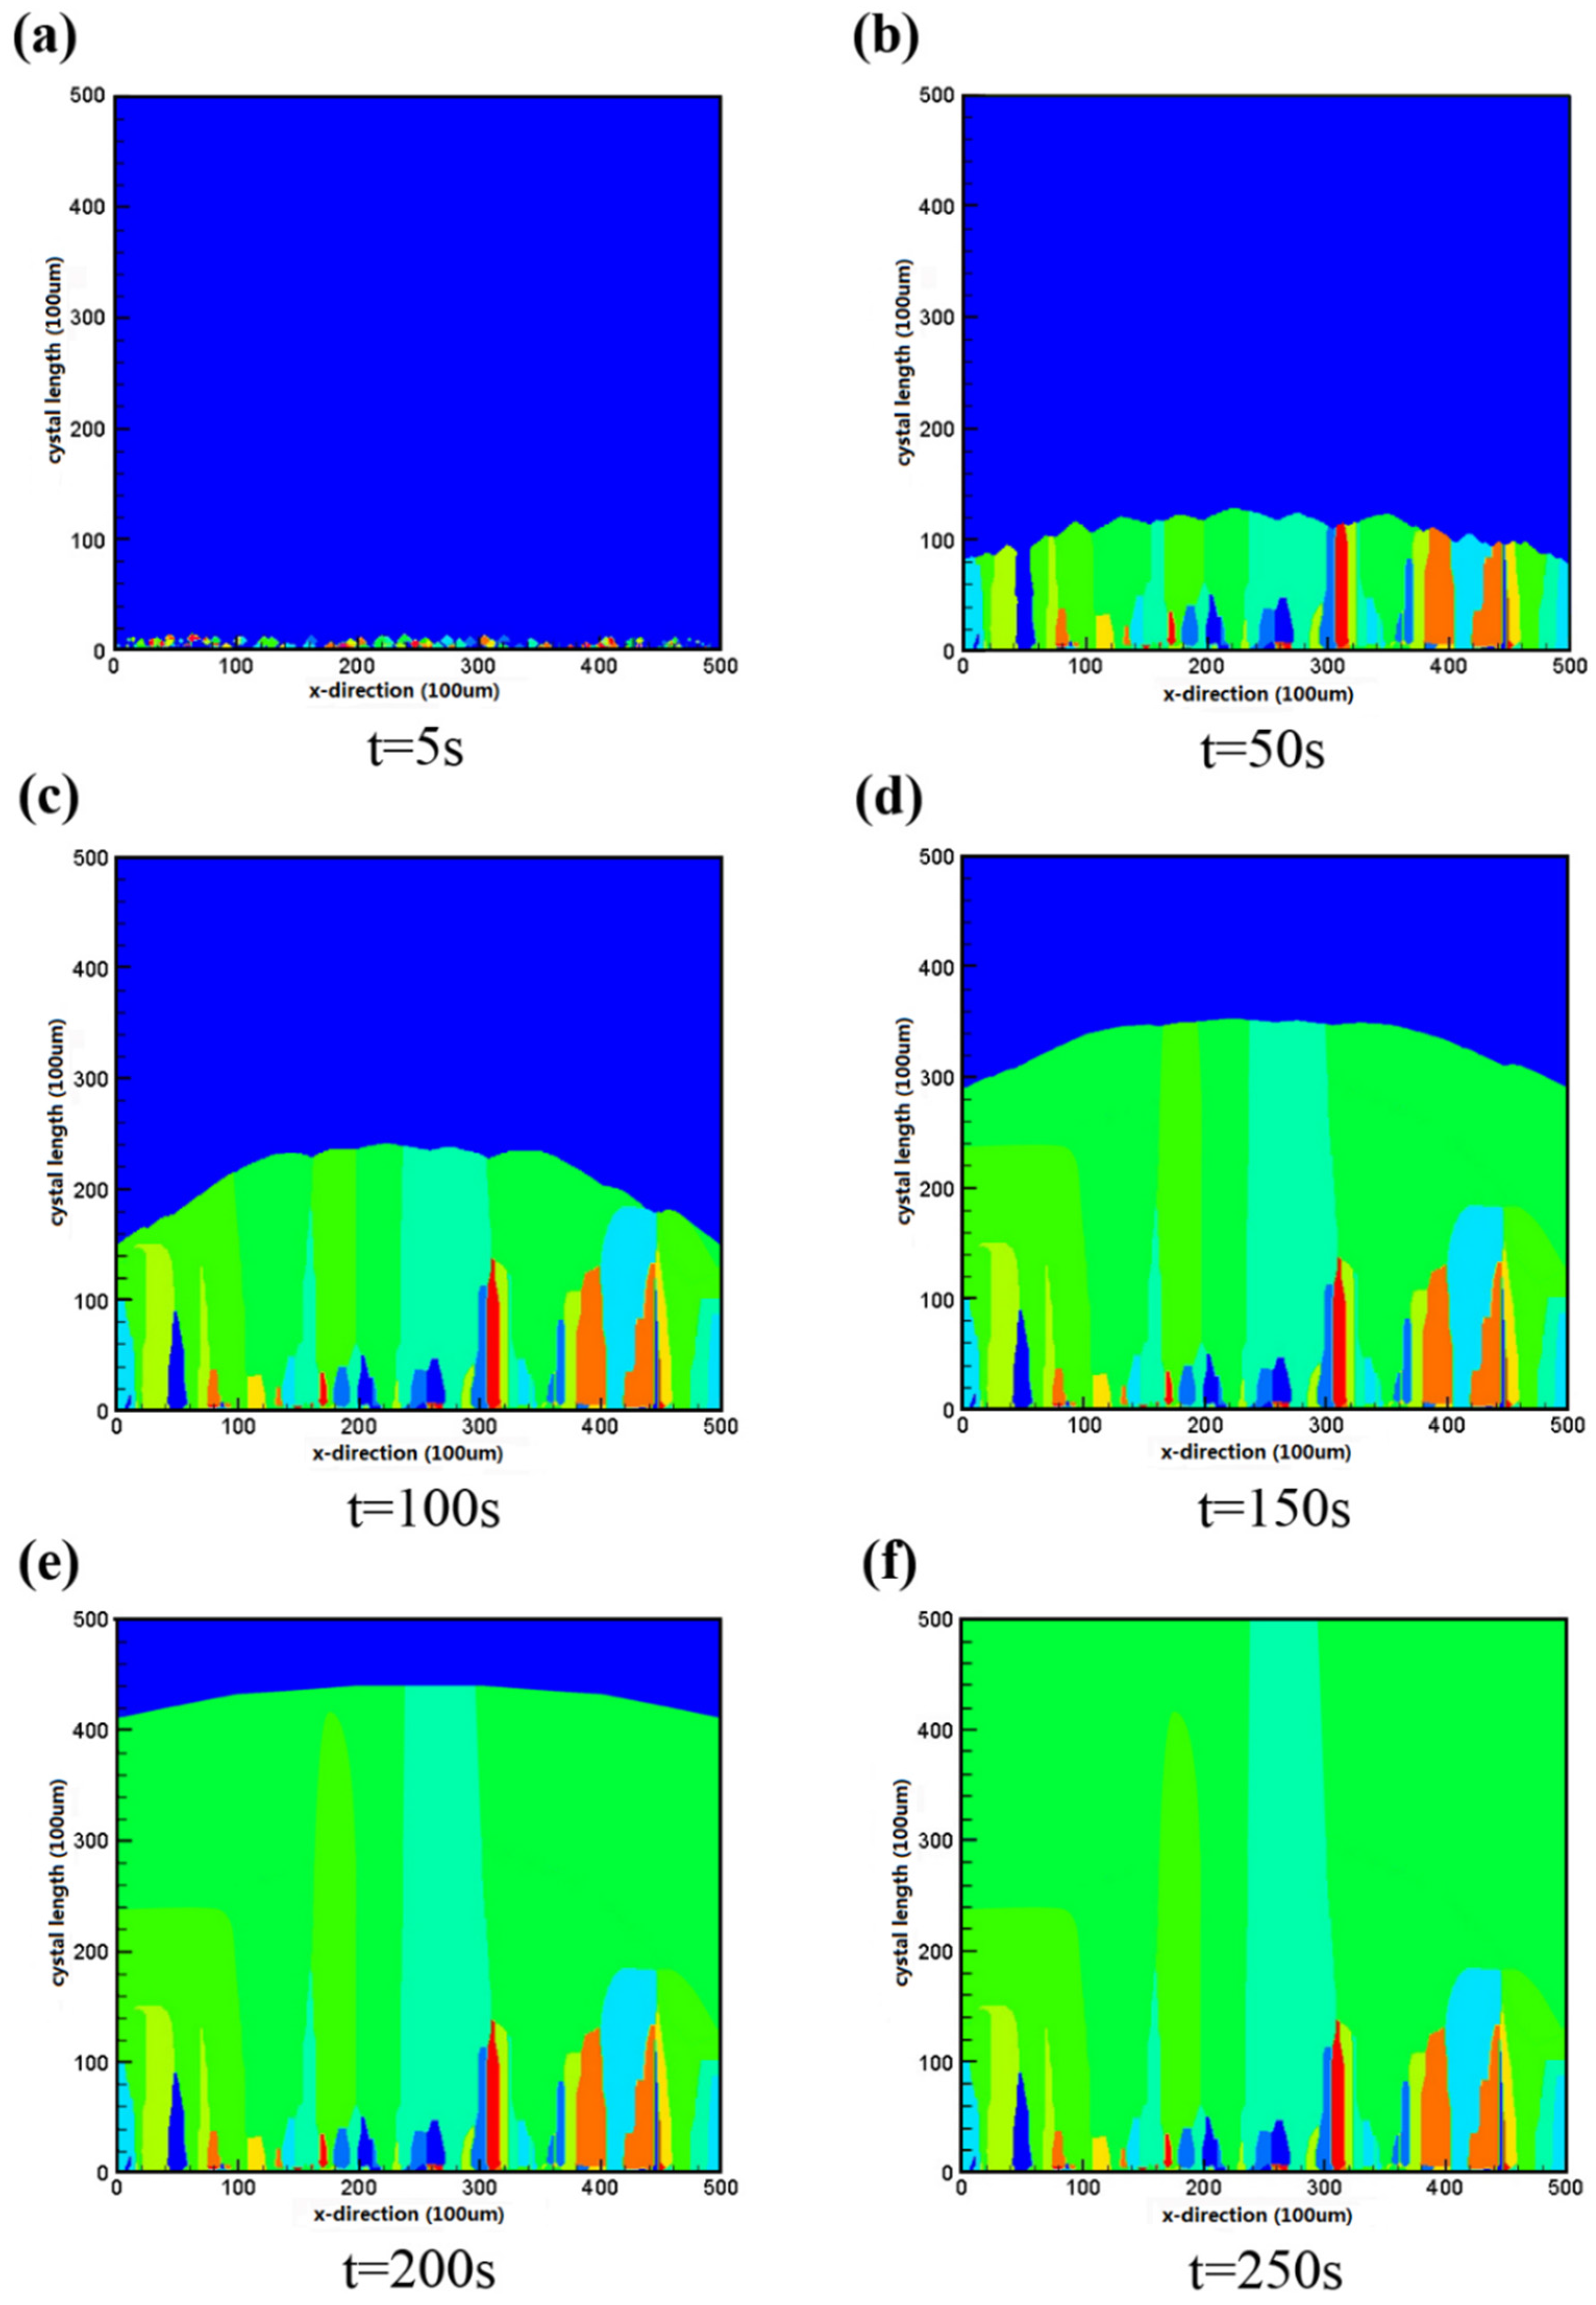
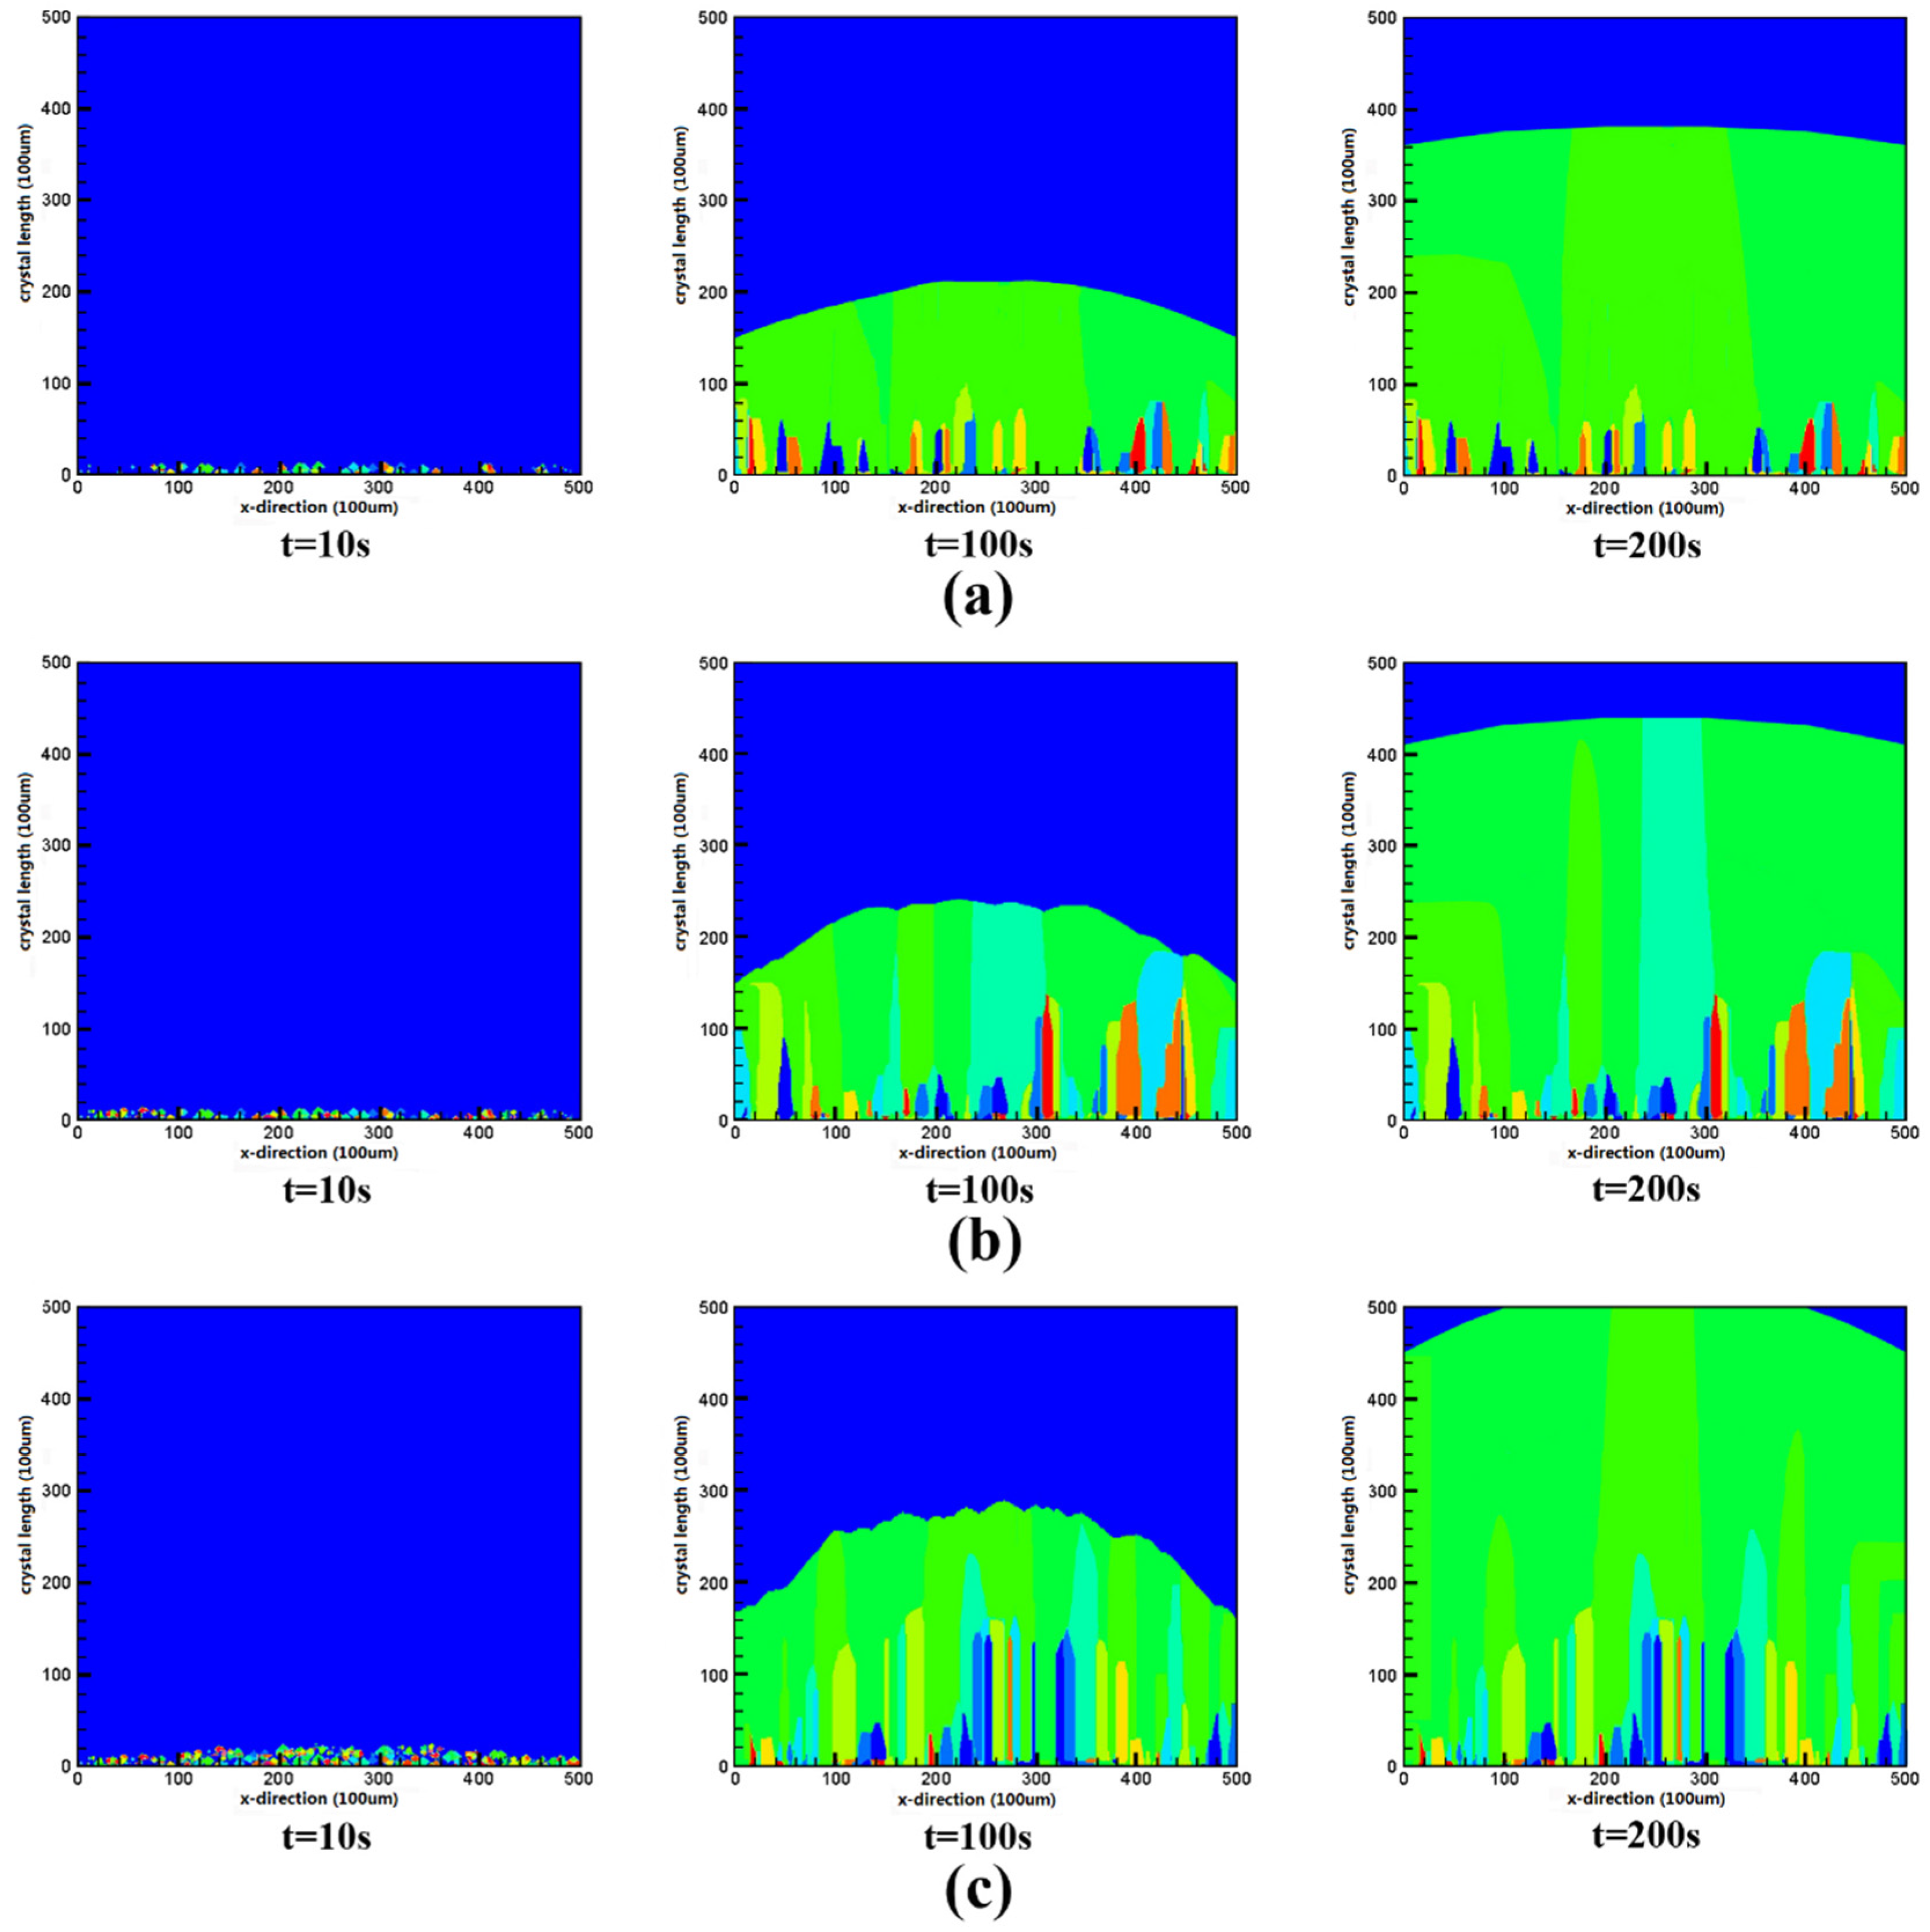
3.2. Characteristics of Silicon Crystal Growth
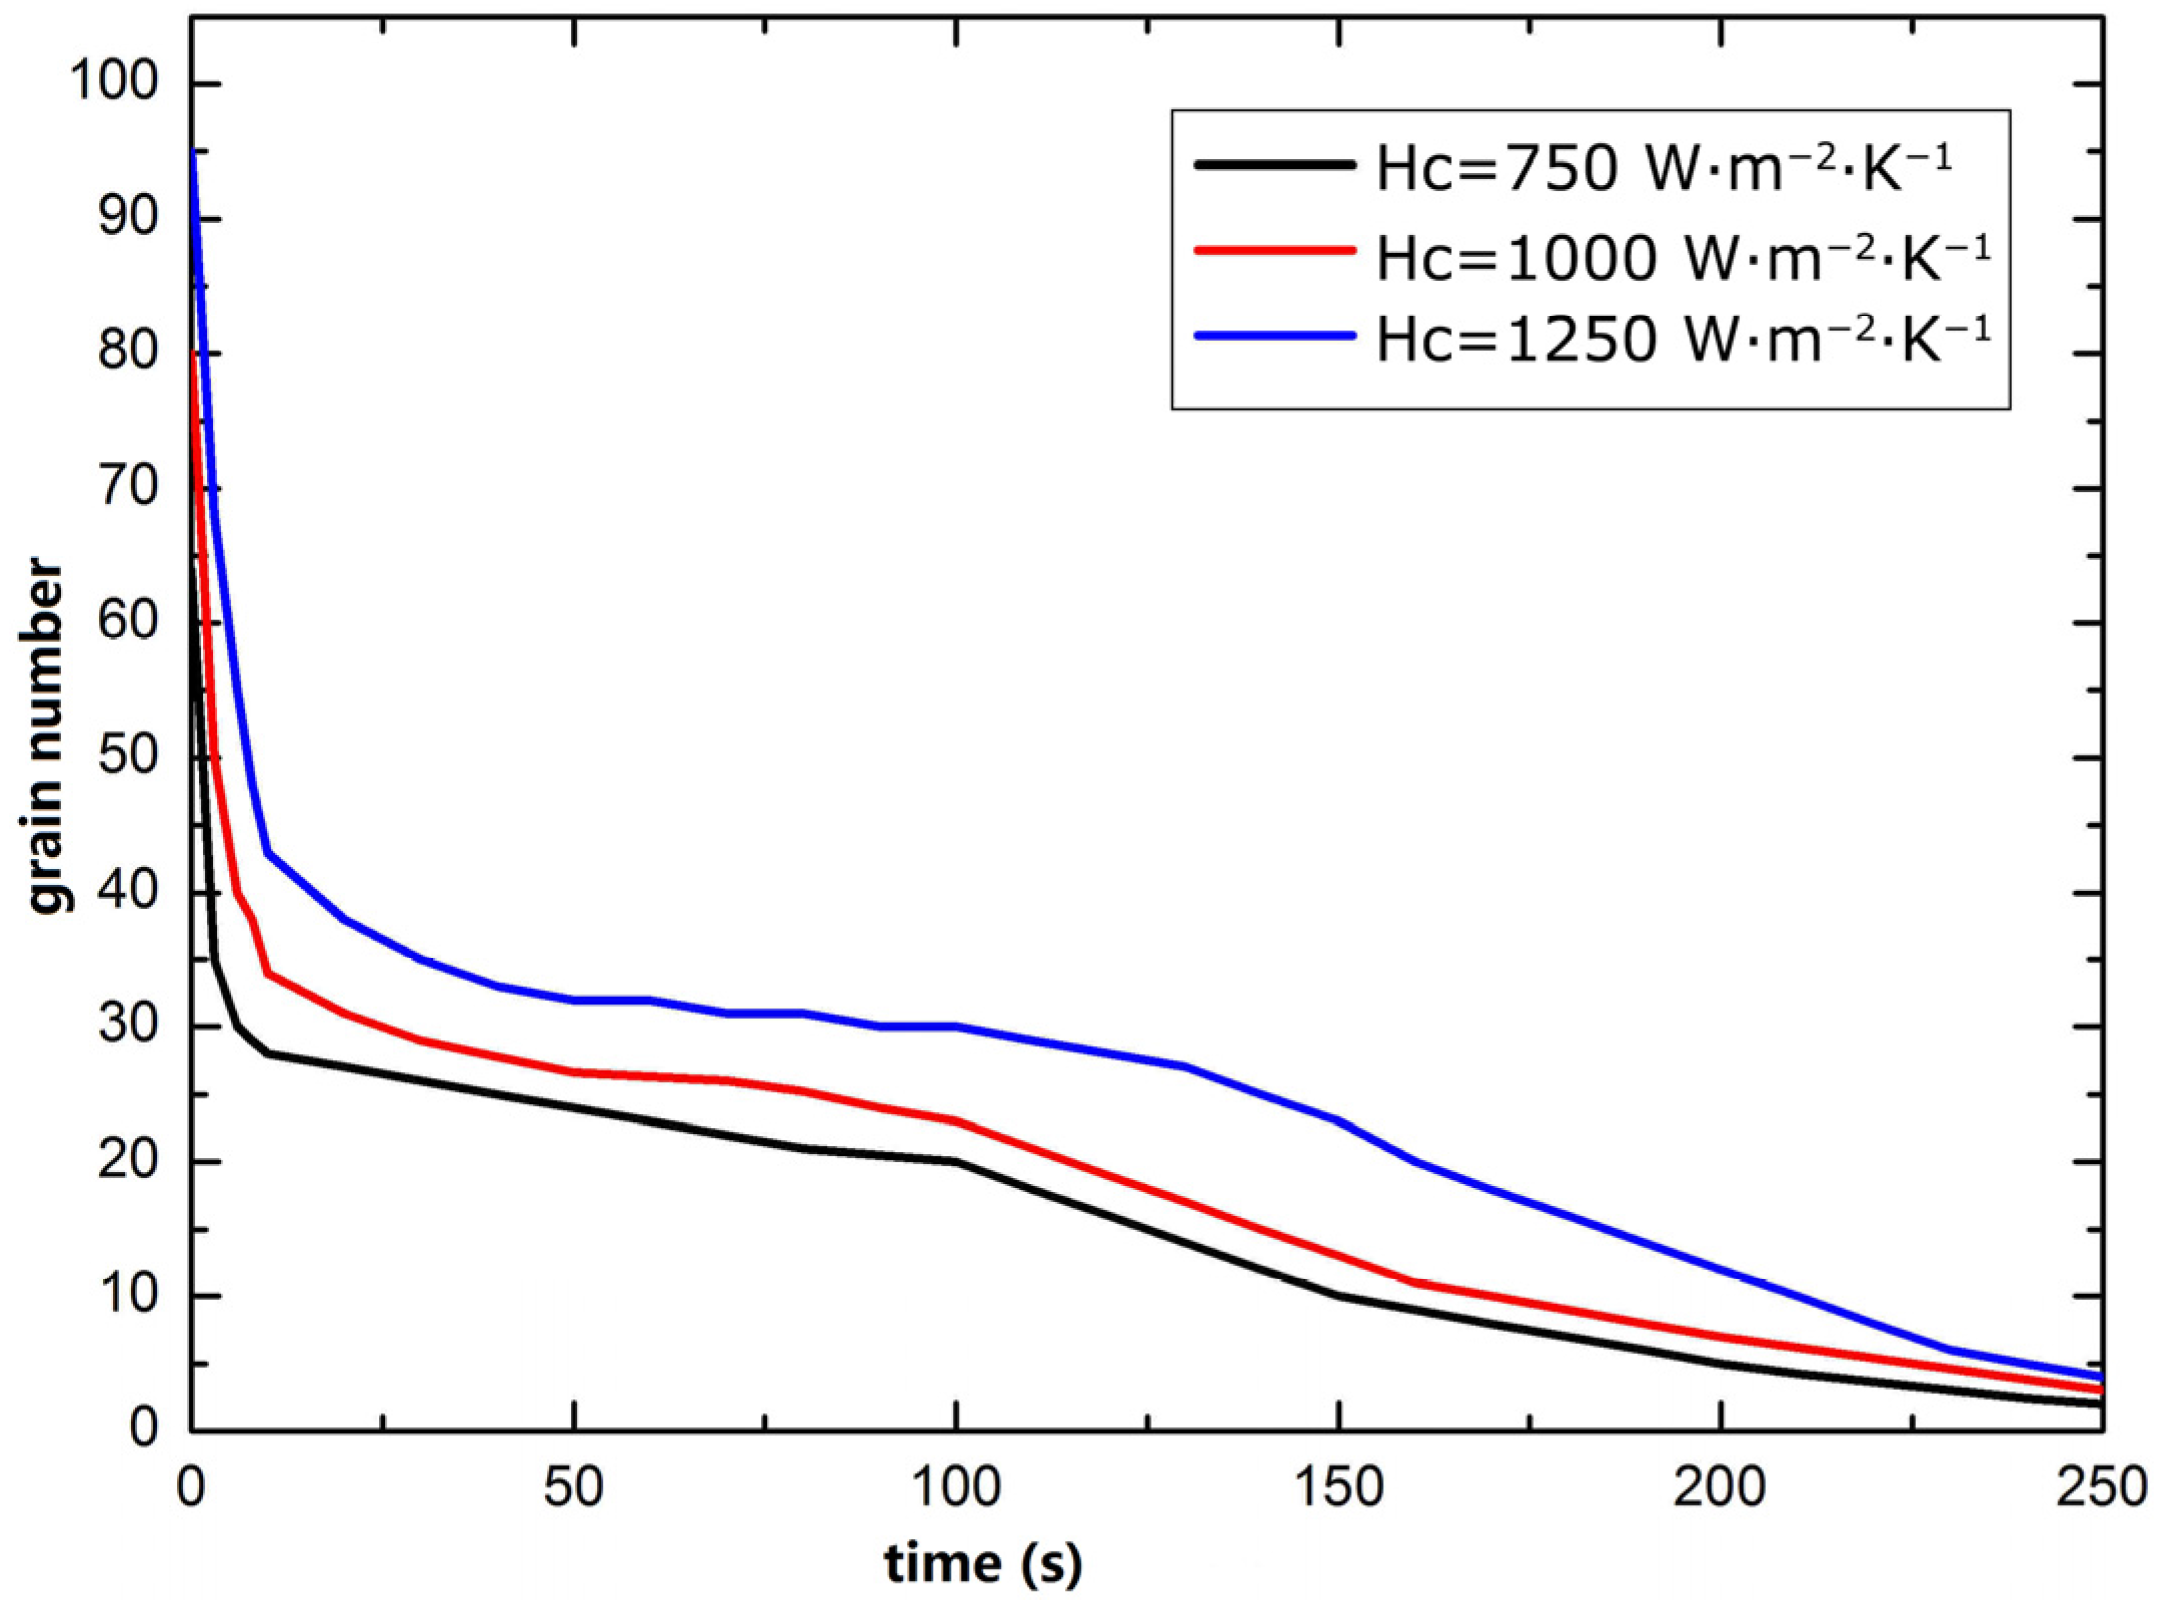
3.3. Improvement of Silicon Crystal Growth
4. Conclusions
Acknowledgments
Author Contributions
Conflicts of Interest
References
- Sarti, D.; Einhaus, R. Silicon feedstock for the multi-crystalline photovoltaic industry. Sol. Energy Mater. Sol. Cells 2002, 72, 27–40. [Google Scholar] [CrossRef]
- Müller, A.; Ghosh, M.; Sonnenschein, R.; Woditsch, P. Silicon for photovoltaic applications. Mater. Sci. Eng. B 2006, 134, 257–262. [Google Scholar] [CrossRef]
- Zhang, X.; Gong, L.; Wu, B.; Zhou, M.; Dai, B. Characteristics and value enhancement of cast silicon ingots. Sol. Energy Mater. Sol. Cells 2015, 139, 27–33. [Google Scholar] [CrossRef]
- Yang, K.; Schwuttke, G.H.; Ciszek, T.F. Structural and electrical charaterization of crystallographic defects in silicon ribbons. J. Cryst. Growth 1980, 50, 301–310. [Google Scholar] [CrossRef]
- Schindler, F.; Schubert, M.C.; Kimmerle, A.; Broisch, J.; Rein, S.; Kwapil, W.; Warta, W. Modeling majority carrier mobility in compensated crystalline silicon for solar cells. Sol. Energy Mater. Sol. Cells 2012, 106, 31–36. [Google Scholar] [CrossRef]
- Ma, W.; Zhong, G.; Sun, L.; Yu, Q.; Huang, X.; Liu, L. Influence of an insulation partition on a seeded directional solidification process for quasi-single crystalline silicon ingot for high-efficiency solar cells. Sol. Energy Mater. Sol. Cells 2012, 100, 231–238. [Google Scholar] [CrossRef]
- Liu, L.; Yu, Q.; Qi, X.; Zhao, W.; Zhong, G. Controlling solidification front shape and thermal stress in growing quasi-single-crystal silicon ingots: Process design for seeded directional solidification. J. Appl. Therm. Eng. 2015, 91, 225–233. [Google Scholar] [CrossRef]
- Liu, J. ACRT forced convection and its effects on solute segregation and heat and mass transfer during single crystal growth. Cryst. Res. Technol. 2008, 43, 396–408. [Google Scholar]
- Nadri, A.; Duterrail-Couvat, Y.; Duffar, T. Two-dimensional numerical modeling of grain structure in multi-crystalline silicon ingot. J. Cryst. Growth 2014, 385, 16–22. [Google Scholar] [CrossRef]
- Lin, H.K.; Lan, C.W. Three-dimensional phase field modeling of silicon thin-film growth during directional solidification: Facet formation and grain competition. J. Cryst. Growth 2014, 401, 740–747. [Google Scholar] [CrossRef]
- Rappaz, M.; Gandin, C.A. Probabilistic modelling of microstructure formation in solidification processes. Acta Metall. Mater. 1993, 41, 345–360. [Google Scholar] [CrossRef]
- Zhu, M.F.; Hong, C.P. A Modified Cellular Automaton Model for the Simulation of Dendritic Growth in Solidification of Alloys. ISIJ Int. 2001, 41, 436–445. [Google Scholar] [CrossRef]
- Janssens, K.G.F. An introductory review of cellular automata modeling of moving grain boundaries in polycrystalline materials. Math. Comput. Simul. 2010, 80, 1361–1381. [Google Scholar] [CrossRef]
- Natsume, Y.; Ohsasa, K. Three-dimensional Cellular Automaton Model for the Prediction of Microsegregation in Solidification Grain Structures. ISIJ Int. 2014, 54, 415–421. [Google Scholar] [CrossRef]
- Wu, B.; Clark, R. Influence of inclusion on nucleation of silicon casting for photovoltaic (PV) application. J. Cryst. Growth 2011, 318, 200–207. [Google Scholar] [CrossRef]
- Plapp, M. Three-dimensional phase-field simulations of directional solidification. J. Cryst. Growth 2007, 303, 49–57. [Google Scholar] [CrossRef]
- Cantu, G.; Popescu, A.; Miller, W. Grain growth of silicon. Acta Mater. 2012, 60, 6755–6761. [Google Scholar] [CrossRef]
- Zhu, M.F.; Kim, J.M.; Hong, C.P. Modeling of Globular and Dendritic Structure Evolution in Solidification of an Al–7mass% Si Alloy. ISIJ Int. 2001, 41, 992–998. [Google Scholar] [CrossRef]
- Wei, L.; Lin, X.; Wang, M.; Huang, W. A cellular automaton model for the solidification of a pure substance. Appl. Phys. A 2011, 103, 123–133. [Google Scholar] [CrossRef]
- Qiu, S.; Wen, S.; Fang, M.; Zhang, L.; Gan, C.; Jiang, D.; Tan, Y.; Li, J.; Luo, X. Process parameters influence on the growth rate during silicon purification by vacuum directional solidification. Vacuum 2016, 125, 40–47. [Google Scholar] [CrossRef]
- Wen, S.; Tan, Y.; Shi, S.; Dong, W.; Jiang, D.; Liao, J.; Zhu, Z. Thermal contact resistance between the surfaces of silicon and copper crucible during electron beam melting. Int. J. Therm. Sci. 2013, 74, 37–43. [Google Scholar] [CrossRef]
- Desai, P.D. Thermodynamic properties of iron and silicon. J. Phys. Chem. Ref. Data 1986, 15, 967–983. [Google Scholar] [CrossRef]
- Assael, M.J.; Armyra, I.J.; Brillo, J.; Stankus, S.V.; Wu, J.; Wakeham, W.A. Reference data for the density and viscosity of liquid cadmium, cobalt, gallium, indium, mercury, silicon, thallium, and zinc. J. Phys. Chem. Ref. Data 2012, 41, 033101. [Google Scholar] [CrossRef]
- Fujiwara, K. Crystal growth behaviors of silicon during melt growth processes. Int. J. Photoenergy 2012, 2012, 169829. [Google Scholar] [CrossRef]
- Fujiwara, K.; Tsumura, S.; Tokairin, M.; Kutsukake, K.; Usami, N.; Uda, S.; Nakajima, K. Growth behavior of faceted Si crystals at grain boundary formation. J. Cryst. Growth 2009, 312, 19–23. [Google Scholar] [CrossRef]
- Wu, B.; Stoddard, N.; Ma, R.; Clark, R. Bulk multicrystalline silicon growth for photovoltaic (PV) application. J. Cryst. Growth 2008, 310, 2178–2184. [Google Scholar] [CrossRef]


| Property | Value |
|---|---|
| Melting temperature, Tmel (K) | 1687 |
| Initial temperature, Tini (K) | 1750 |
| Density of silicon solid, s (kg·m−3) | 2330 |
| Density of silicon melt, m (kg·m−3) | −0.206 × T + 2930.94 |
| Thermal conductivity of silicon solid, s (W·m−1·K−1) | 22 |
| Thermal conductivity of silicon melt, m (W·m−1·K−1) | 66.5 |
| Heat capacity of silicon solid, Cs (J·kg−1·K−1) | −1.354 × 10⁻⁴ × T2 + 0.4845 × T + 584.3 |
| Heat capacity of silicon melt, Cm (J·kg−1·K−1) | 950 |
| Latent heat, Q (J·kg−1) | 1.587 × 10⁶ |
| Microcosmic cell size, Δxmic (m) | 1 × 10⁻⁴ |
| Macrocosmic cell size, Δxmac (m) | 1 × 10⁻² |
| Standard deviation, ΔTσ (K) | 0.1 |
| Mean undercooling, ΔTmea (K) | 1.0 |
| Maximum nucleation density, nmax (m2) | 1 × 10⁴ |
© 2016 by the authors; licensee MDPI, Basel, Switzerland. This article is an open access article distributed under the terms and conditions of the Creative Commons Attribution (CC-BY) license (http://creativecommons.org/licenses/by/4.0/).
Share and Cite
Lian, Q.; Liu, W.; Li, R.; Yan, W.; Liu, C.; Zhang, Y.; Wang, L.; Chen, H. Numerical Simulation of Multi-Crystalline Silicon Crystal Growth Using a Macro–Micro Coupled Method during the Directional Solidification Process. Appl. Sci. 2017, 7, 21. https://doi.org/10.3390/app7010021
Lian Q, Liu W, Li R, Yan W, Liu C, Zhang Y, Wang L, Chen H. Numerical Simulation of Multi-Crystalline Silicon Crystal Growth Using a Macro–Micro Coupled Method during the Directional Solidification Process. Applied Sciences. 2017; 7(1):21. https://doi.org/10.3390/app7010021
Chicago/Turabian StyleLian, Qingqing, Weina Liu, Ri Li, Wenbo Yan, Caichi Liu, Yingxin Zhang, Longxuan Wang, and Hongjian Chen. 2017. "Numerical Simulation of Multi-Crystalline Silicon Crystal Growth Using a Macro–Micro Coupled Method during the Directional Solidification Process" Applied Sciences 7, no. 1: 21. https://doi.org/10.3390/app7010021
APA StyleLian, Q., Liu, W., Li, R., Yan, W., Liu, C., Zhang, Y., Wang, L., & Chen, H. (2017). Numerical Simulation of Multi-Crystalline Silicon Crystal Growth Using a Macro–Micro Coupled Method during the Directional Solidification Process. Applied Sciences, 7(1), 21. https://doi.org/10.3390/app7010021