
Simulation of a Narrowband Power Line Communications System over Medium Voltage

Abstract
:1. Introduction
2. PLC Transmission via Overhead MV Power Lines
Two-Conductor Transmission Lines
Multi-Conductor Transmission Lines
3. Noise in PLC Transmission
3.1. Noise Considerations in PLC Channels
3.2. Noise Characteristics Verified from in situ Measurements
- Every substation gives rise to a unique noise distribution.
- The transformers that electrically separate the MV grid from the HV and LV ones prevent the transition either of noise or of harmonic distortion products.
- The noise PSD in MV power lines is found to be higher than in LV ones by 20–30 dB.
- The maximum and minimum noise PSD levels may differ by up to 25 dB, indicating that corona noise from HV power lines is induced into the MV grid through the air.
- The noise PSD is affected by load fluctuations, especially in the NB-PLC frequency range.
- The noise levels observed in phase-to-phase (WTW) coupling does not usually exceed the ones observed in the relevant two single-phase-to-ground (WTG) couplings.
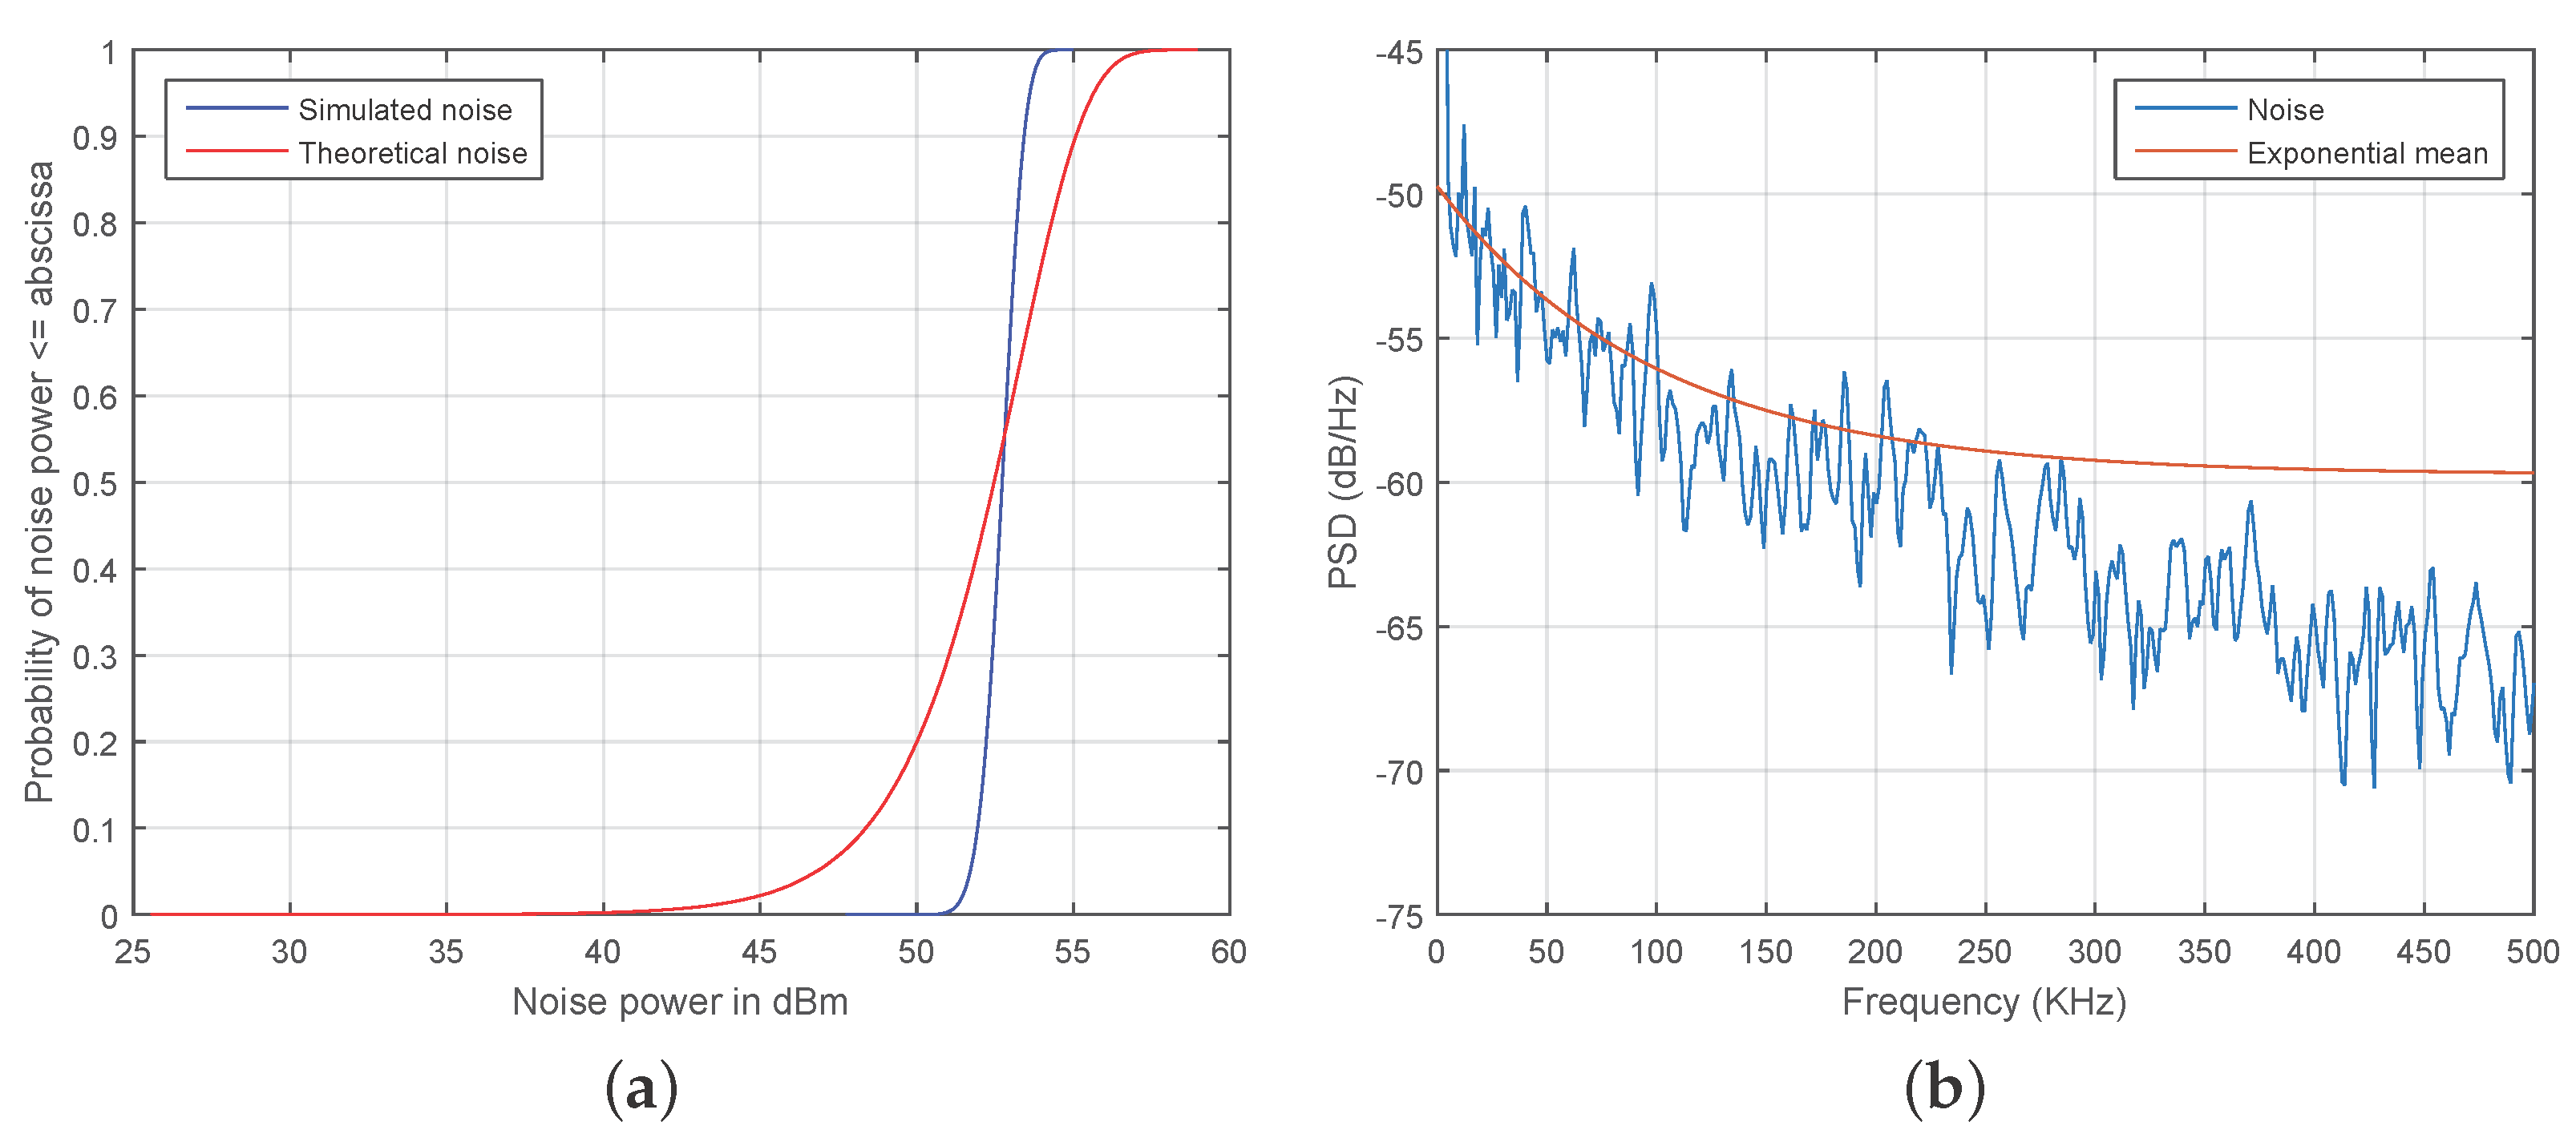
- The noise cumulative density function (CDF) can be better approximated by the Nakagami distribution and not by the Gaussian distribution as commonly assumed in the standard analysis and design of communication systems.
4. OFDM in PLC Transmission
4.1. Filtered-OFDM
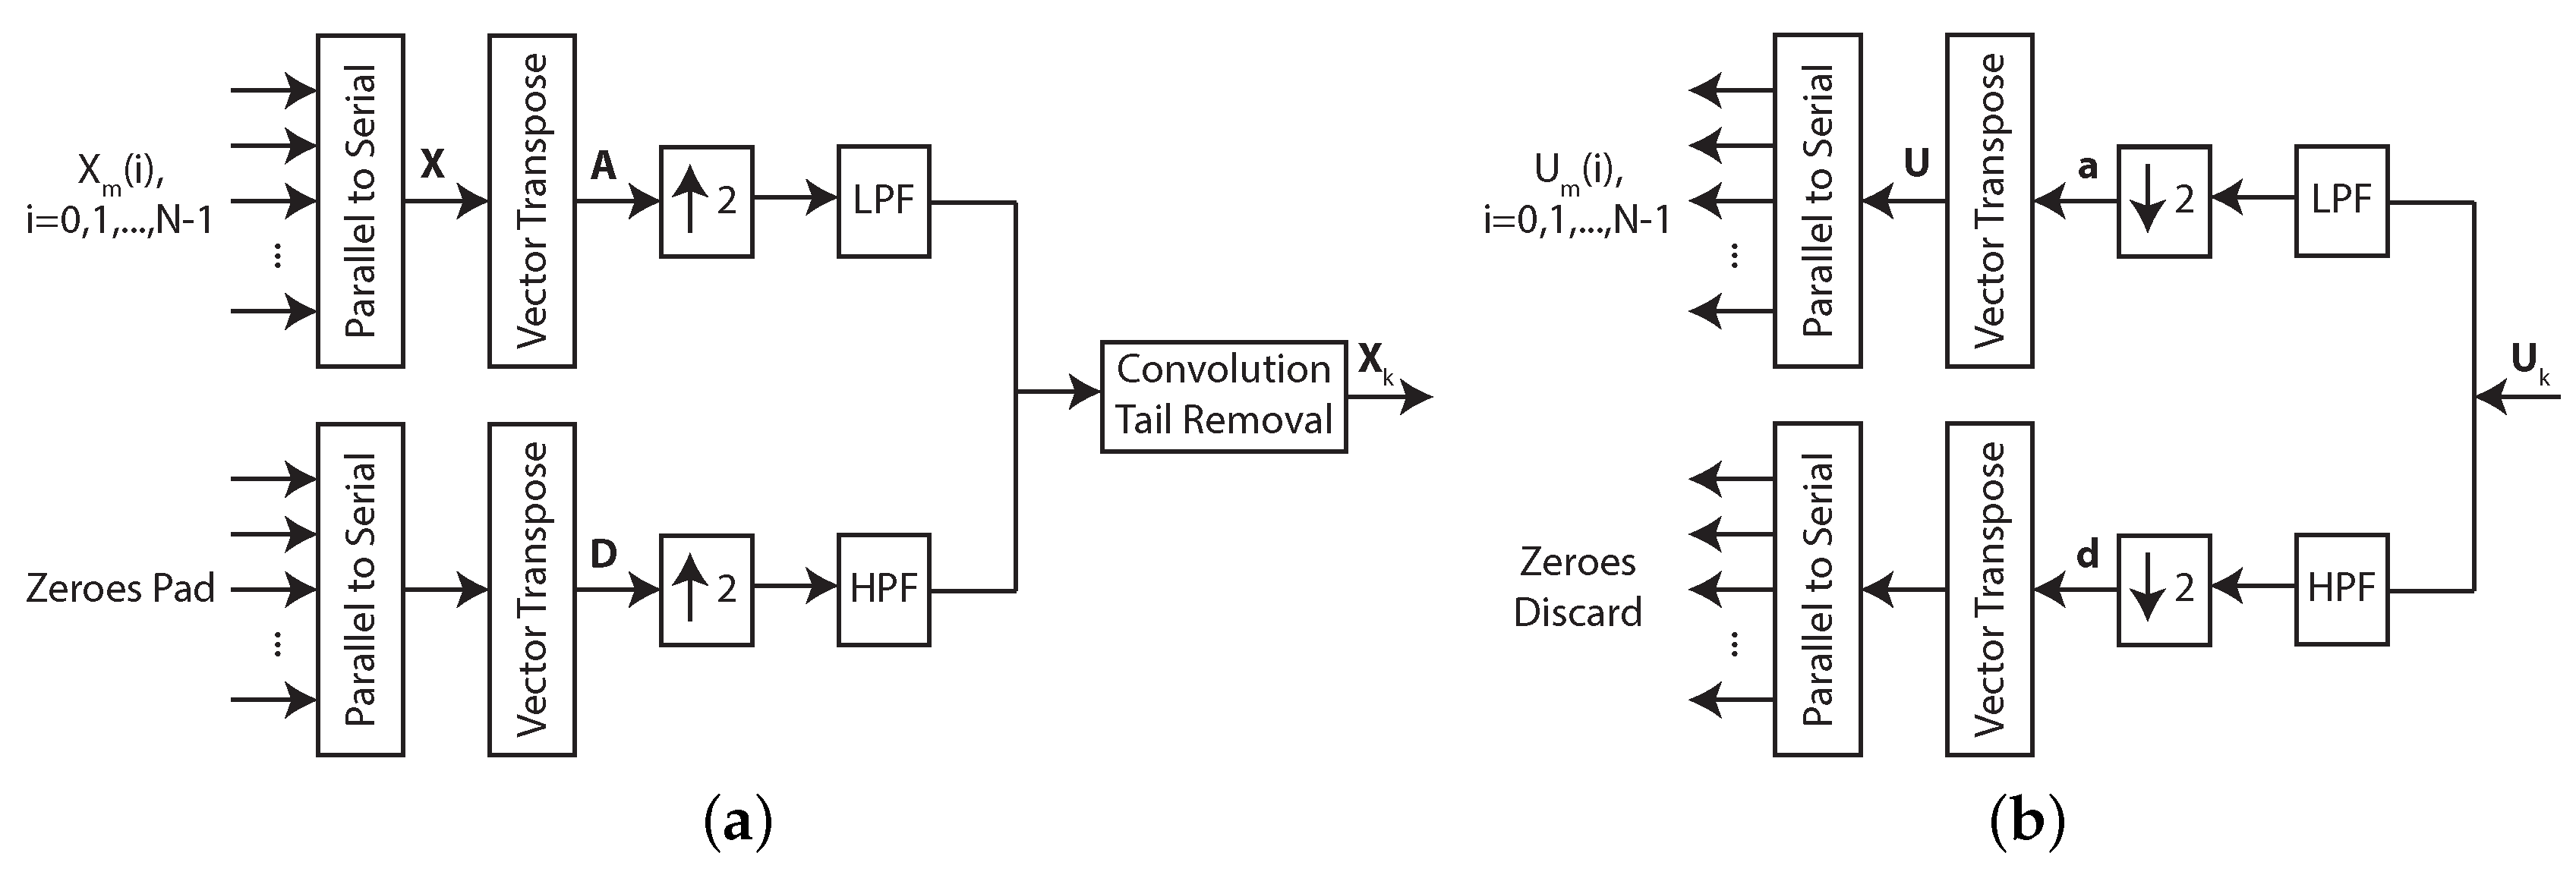
4.2. Wavelet-OFDM
5. Simulation Results and Discussion
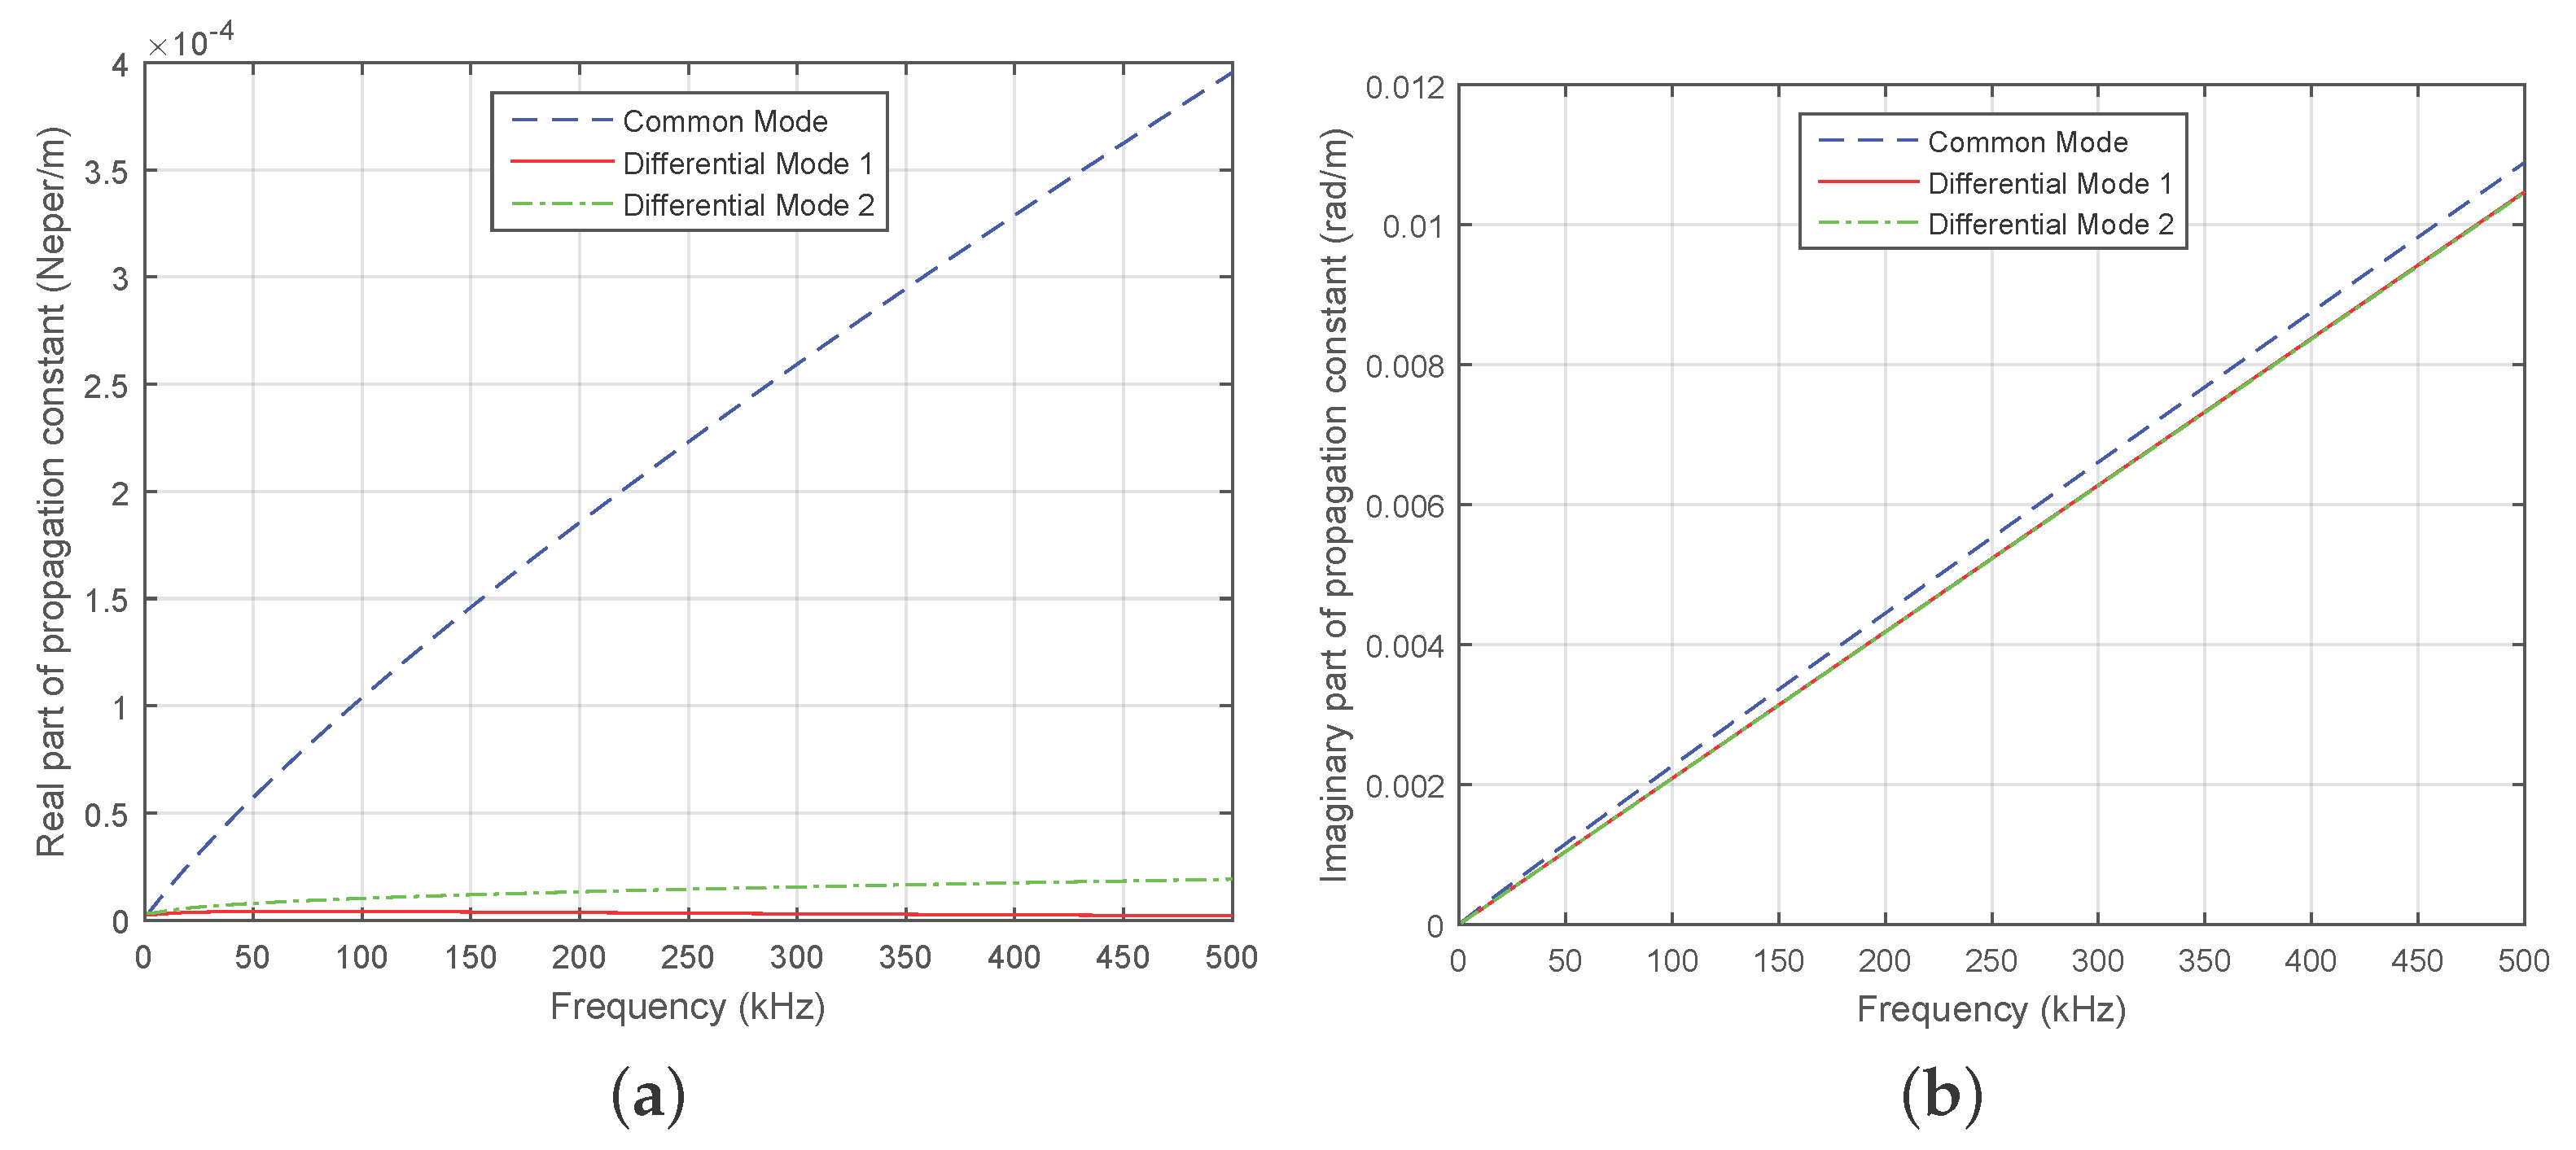
5.1. Evaluation of and
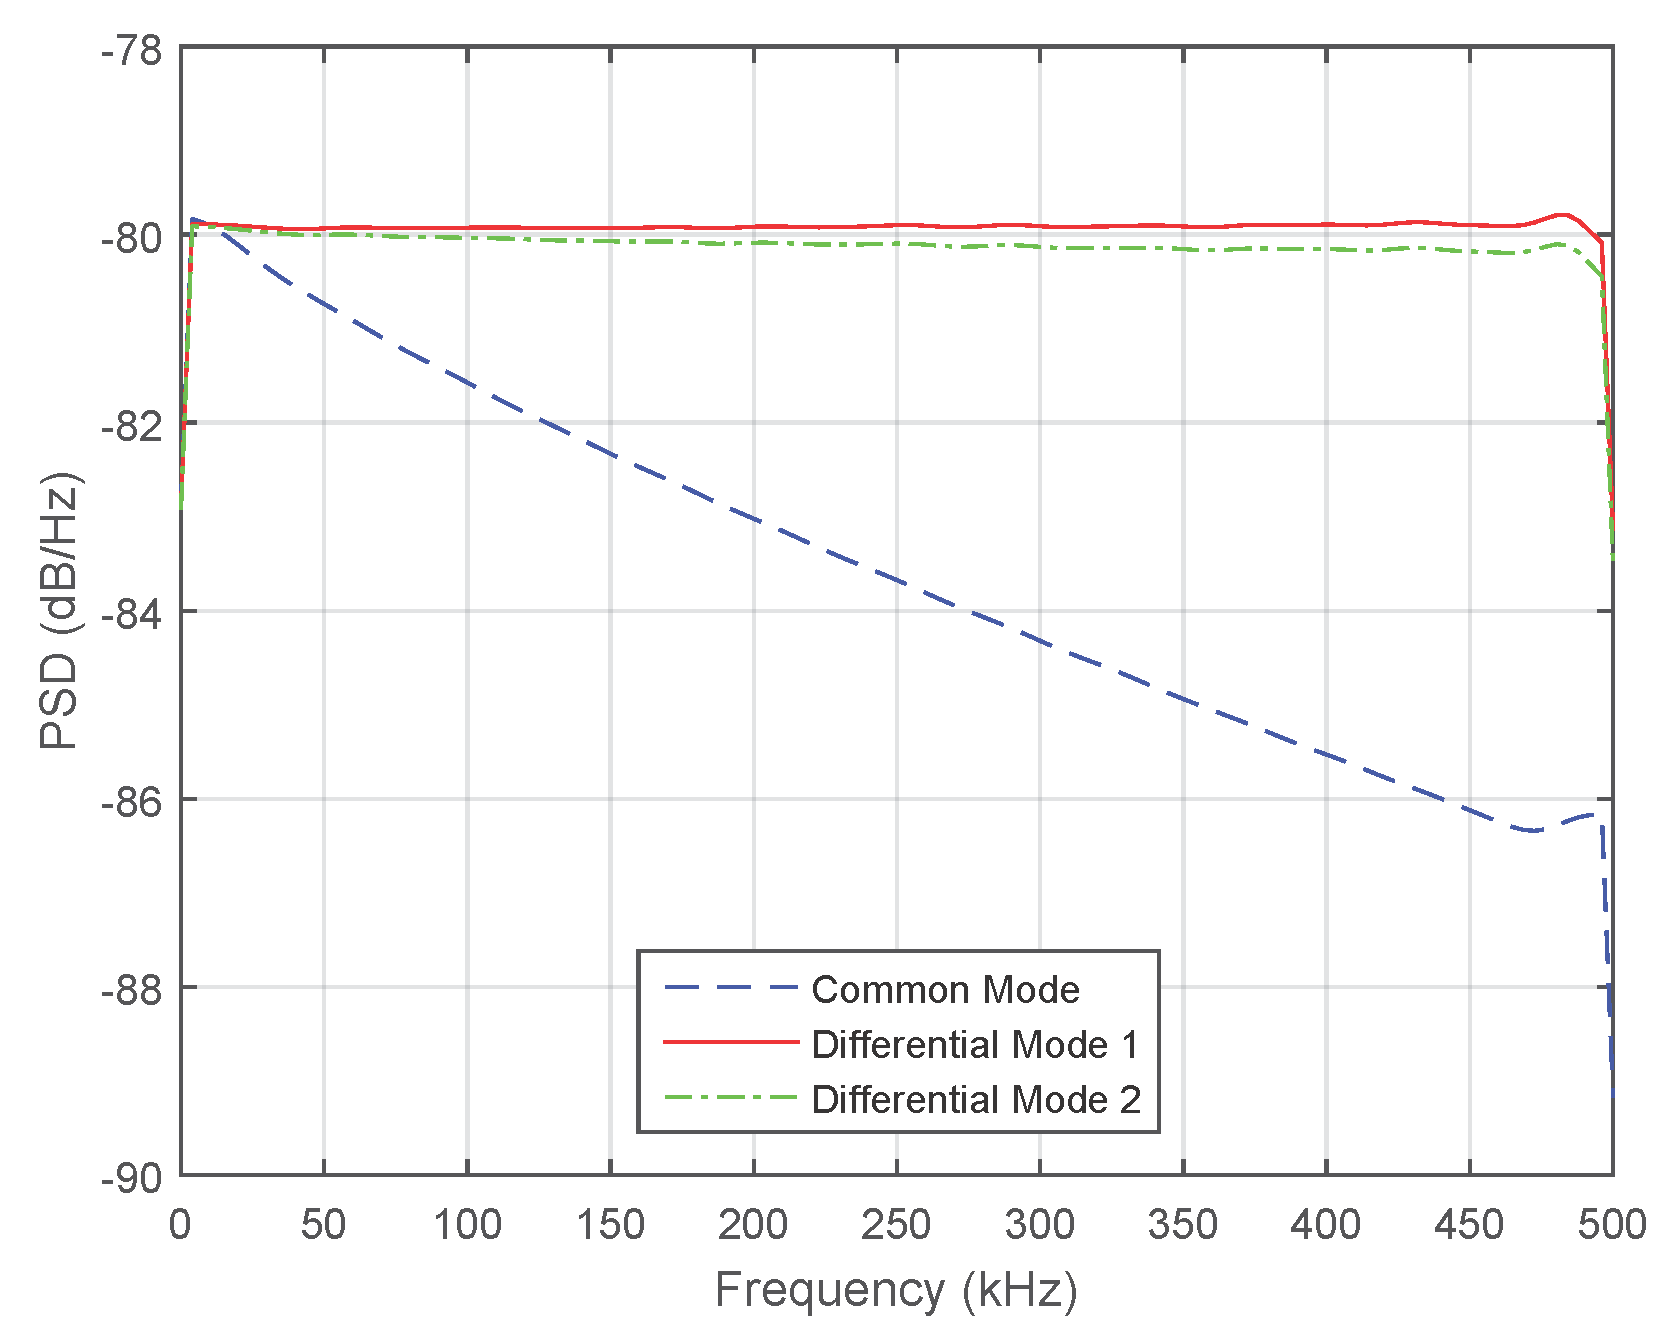
5.2. The Additive Noise Model
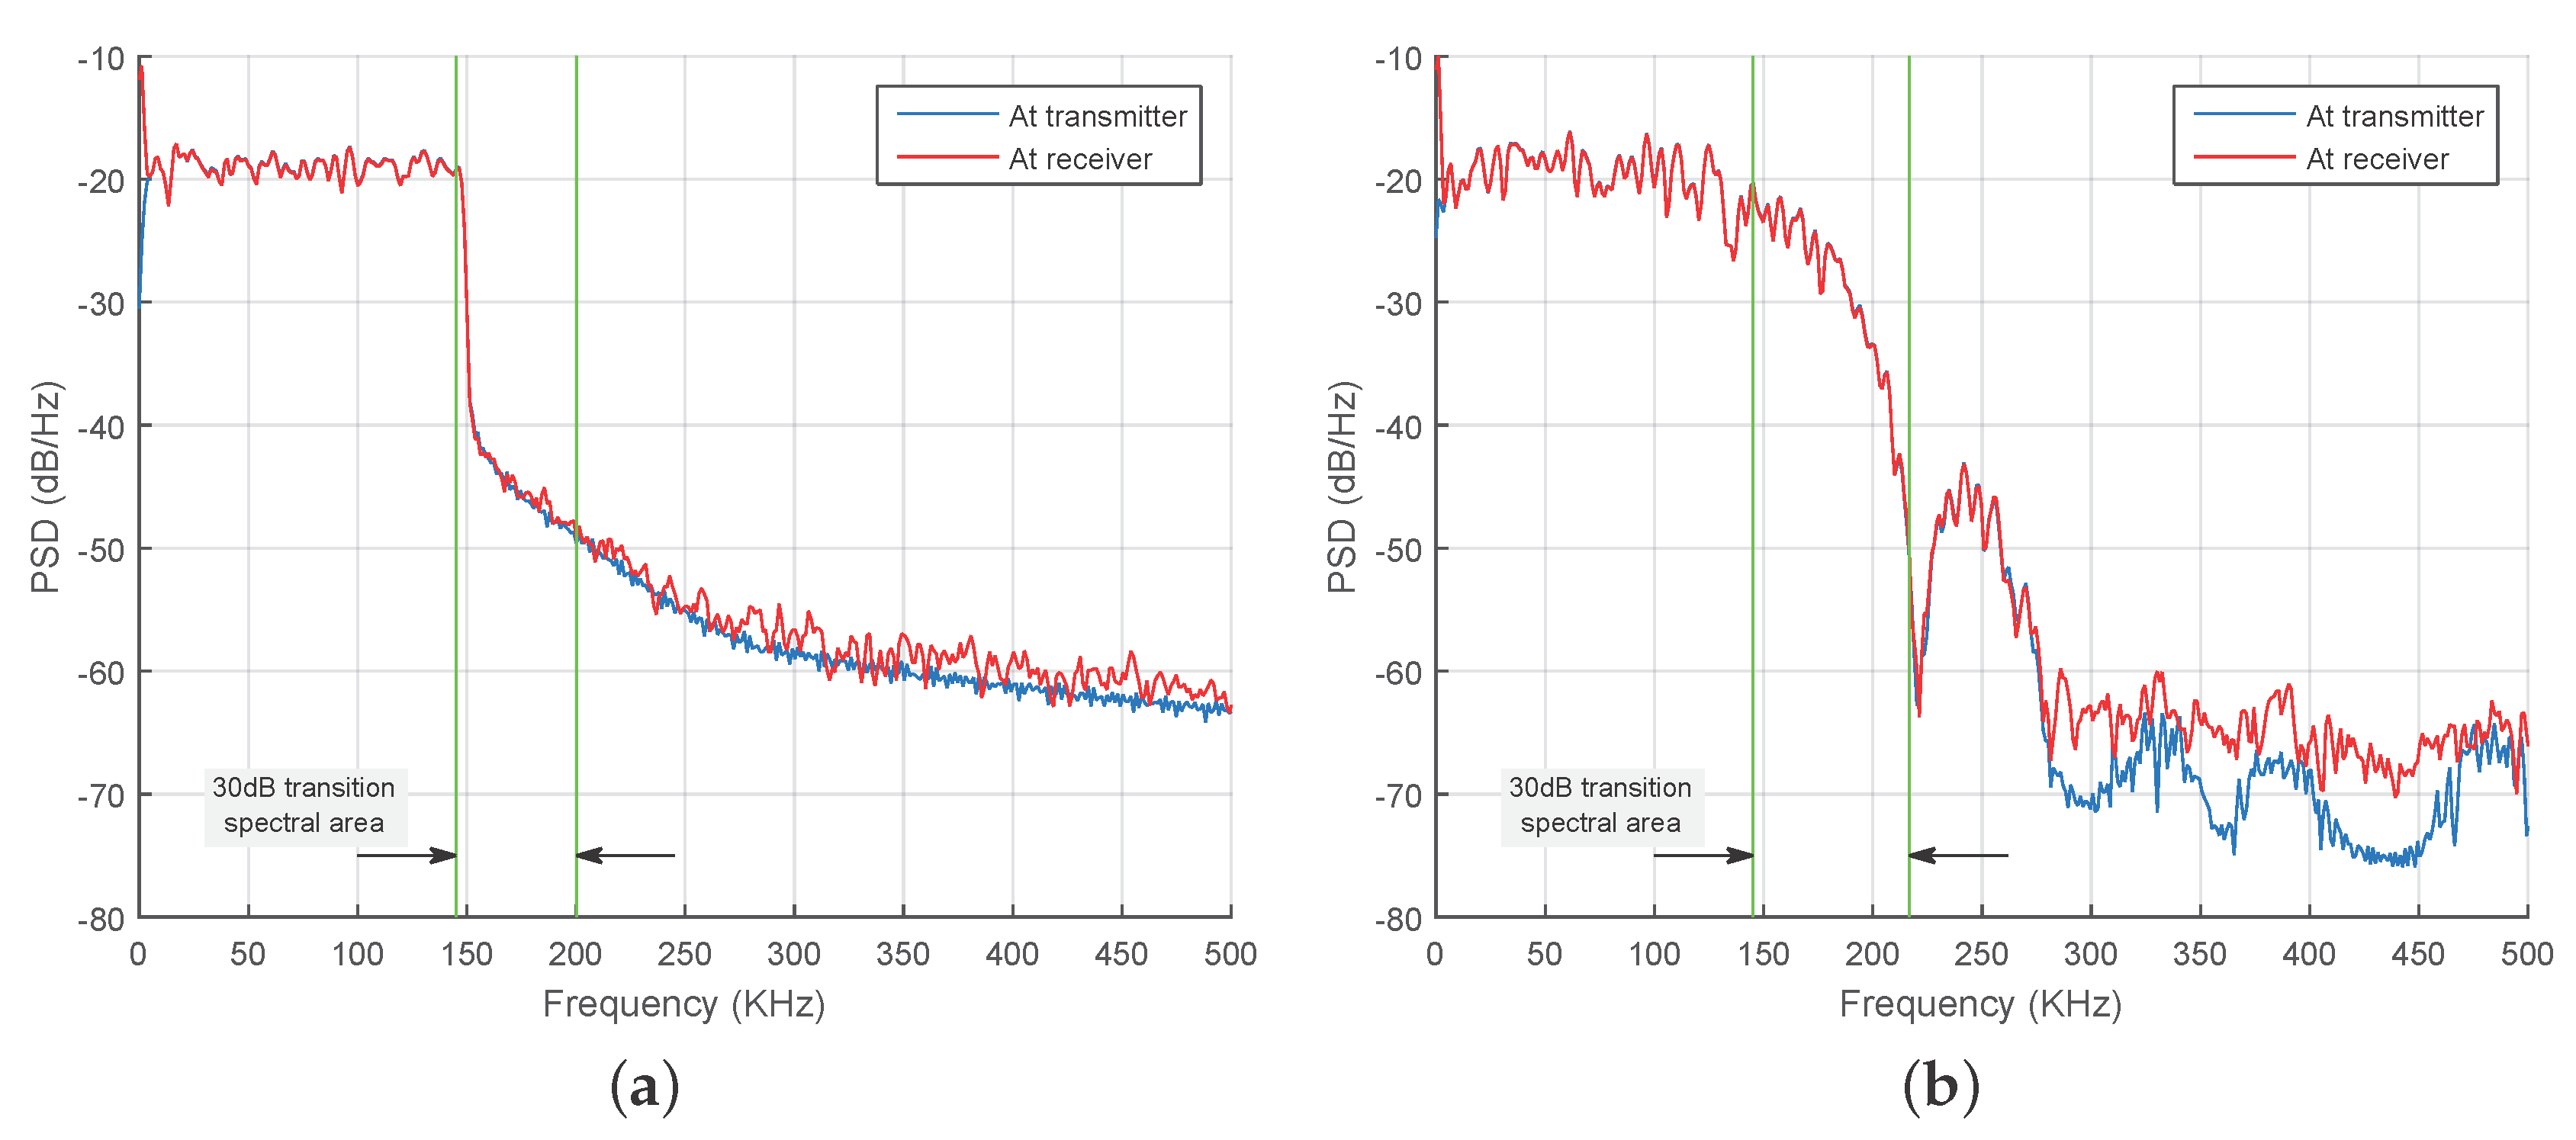
5.3. F-OFDM and W-OFDM Signals
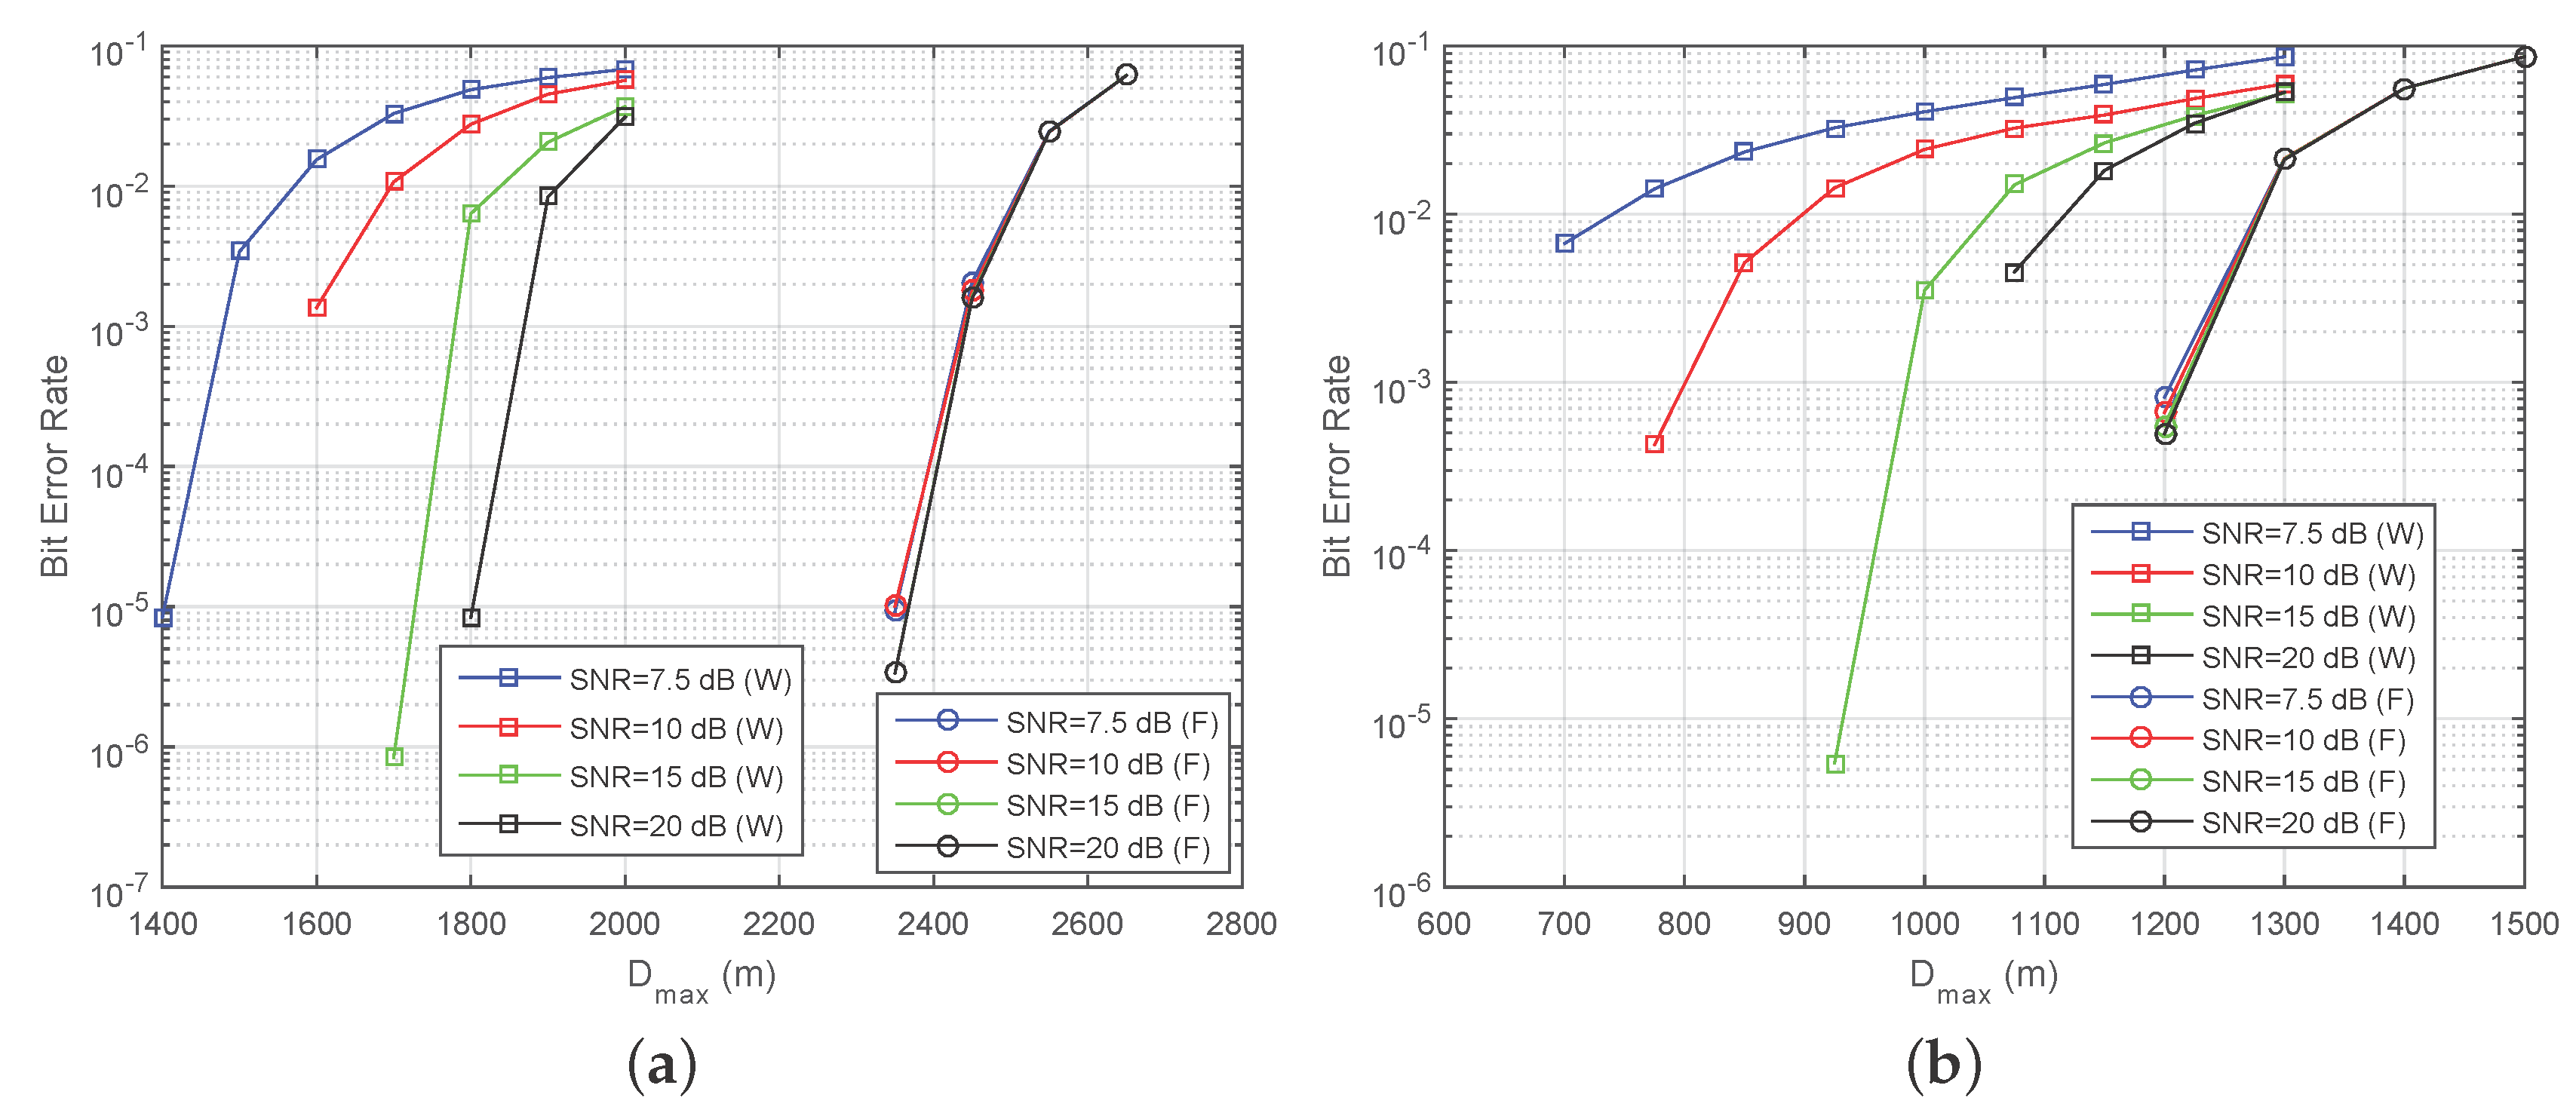
5.4. Maximum Reach of NB-PLC Signals via the MV Grid
6. Conclusions
Acknowledgments
Author Contributions
Conflicts of Interest
References
- Fang, X.; Misra, S.; Xue, G.; Yang, D. Smart grid—The new and improved power grid: A survey. IEEE Commun. Surv. Tutor. 2012, 14, 944–980. [Google Scholar] [CrossRef]
- Livieratos, S.; Vogiatzaki, V.E.; Cottis, P.G. A generic framework for the evaluation of the benefits expected from the smart grid. Energies 2013, 6, 988–1008. [Google Scholar] [CrossRef]
- Berger, L.T.; Schwager, A.; Escudero-Garzás, J.J. Power line communications for smart grid applications. J. Electr. Comput. Eng. 2013, 2013. [Google Scholar] [CrossRef]
- Lazaropoulos, A.G.; Cottis, P.G. Capacity of overhead medium voltage power line communication channels. IEEE Trans. Power Deliv. 2010, 25, 723–733. [Google Scholar] [CrossRef]
- IEEE Standards Association. 1901–2010—IEEE Standard for Broadband over Power Line Networks: Medium Access Control and Physical Layer Specifications; IEEE: New York, NY, USA, 2010; pp. 1–1586. [Google Scholar]
- Sarafi, A.M.; Tsiropoulos, G.I.; Cottis, P.G. Hybrid wireless-broadband over power lines: A promising broadband solution in rural areas. IEEE Commun. Mag. 2009, 47, 140–147. [Google Scholar] [CrossRef]
- Ferreira, H.C.; Grové, H.M.; Hooijen, O.; Vinck, A.J. Power Line Communication: An Overview; Wiley Online Library: Hoboken, NJ, USA, 2001. [Google Scholar]
- Lazaropoulos, A.G.; Cottis, P.G. Transmission characteristics of overhead medium-voltage power-line communication channels. IEEE Trans. Power Deliv. 2009, 24, 1164–1173. [Google Scholar] [CrossRef]
- Amore, M.; Sarto, M. A new formulation of lossy ground return parameters for transient analysis of multiconductor dissipative lines. IEEE Trans. Power Deliv. 1997, 12, 303–314. [Google Scholar] [CrossRef]
- Amirshahi, P.; Kavehrad, M. High-frequency characteristics of overhead multiconductor power lines for broadband communications. IEEE J. Sel. Areas Commun. 2006, 24, 1292–1303. [Google Scholar] [CrossRef]
- Lee, J.J.; Choi, S.J.; Oh, H.M.; Lee, W.T.; Kim, K.H.; Lee, D.Y. Measurements of the communications environment in medium voltage power distribution lines for wide-band power line communications. In Proceedings of the International Symposium on Power-Line Communications and Its Applications, Zaragoza, Spain, 31 March–2 April 2004; pp. 69–74.
- Tao, Z.; Xiaoxian, Y.; Baohui, Z.; Jian, C.; Zhi, Y.; Zhihong, T. Research of noise characteristics for 10-kV medium-voltage power lines. IEEE Trans. Power Deliv. 2007, 22, 142–150. [Google Scholar] [CrossRef]
- Suljanović, N.; Mujčić, A.; Zajc, M.; Tasič, J.F. Corona noise characteristics in high voltage PLC channel. In Proceedings of the 2003 IEEE International Conference on Industrial Technology, Maribor, Slovenia, 10–12 December 2003; Volume 2, pp. 1036–1039.
- Tao, Z.; Xiaoxian, Y.; Baohui, Z.; Xu, N.H.; Xiaoqun, F.; Changxin, L. Statistical analysis and modeling of noise on 10-kV medium-voltage power lines. IEEE Trans. Power Deliv. 2007, 22, 1433–1439. [Google Scholar] [CrossRef]
- Farhang, A.; Kakhki, M.M.; Farhang-Boroujeny, B. Wavelet-OFDM versus filtered-OFDM in power line communication systems. In Proceedings of the 2010 5th International Symposium on Telecommunications (IST), Tehran, Iran, 4–6 December 2010; pp. 691–694.
- Farhang-Boroujeny, B. OFDM versus filter bank multicarrier. IEEE Signal Process. Mag. 2011, 28, 92–112. [Google Scholar] [CrossRef]
- Sharma, S.; Kumar, S. BER performance evaluation of FFT-OFDM and DWT-OFDM. Int. J. Netw. Mob. Technol. 2011, 2, 110–116. [Google Scholar]
- Koga, H.; Kodama, N.; Konishi, T.; Gondo, T. High-speed power line communication system based on wavelet OFDM. In Proceedings of the IEEJ Transactions Electronics, Information and Systems Society National Conference, Kyoto, Japan, 26–28 March 2003; pp. 226–231.
- Abdullah, K.; Hussain, Z.M. Studies on DWT-OFDM and FFT-OFDM systems. In Proceedings of the IEEE International Conference on Communication, Computer and Power, Muscat, Oman, 15–18 February 2009; pp. 15–18.
- Artale, G.; Cataliotti, A.; Cosentino, V.; Di Cara, D.; Fiorelli, R.; Russotto, P.; Tine, G. Medium voltage smart grid: Experimental analysis of secondary substation narrow band power line communication. IEEE Trans. Instrum. Meas. 2013, 62, 2391–2398. [Google Scholar] [CrossRef]
- Cataliotti, A.; Cara, D.D.; Fiorelli, R.; Tinè, G. Power-line communication in medium-voltage system: Simulation model and onfield experimental tests. IEEE Trans. Power Deliv. 2012, 27, 62–69. [Google Scholar] [CrossRef]


| Number of Channels | 119 | Conductor Permeability | |
| Symbol duration | 8.192 ms | Conductor permittivity | 2.3 × 10 |
| Modulation order | 2 or 4 | Conductor conductivity | 3.8 × 10 S/m |
| Number of symbols | 10,000 | Ground conductivity | 5 × 10 S/m |
| Digital up-sampling factor | 16 | Ground permittivity | 13 |
| SNR | 7.5 to 20 dB | Ground permeability | |
| Carrier frequency | 75.75 kHz | Height of wires | 10 m |
| Nyquist filter roll-off | 0.25 | Radius of wires | 2 mm |
| Wavelet type | Haar | Distance between wires | 0.7 m |
| W-OFDM overlap factor | 8 | Number of wires | 3 |
© 2016 by the authors; licensee MDPI, Basel, Switzerland. This article is an open access article distributed under the terms and conditions of the Creative Commons by Attribution (CC-BY) license (http://creativecommons.org/licenses/by/4.0/).
Share and Cite
Chiotellis, N.; Cottis, P.G. Simulation of a Narrowband Power Line Communications System over Medium Voltage. Appl. Sci. 2016, 6, 90. https://doi.org/10.3390/app6040090
Chiotellis N, Cottis PG. Simulation of a Narrowband Power Line Communications System over Medium Voltage. Applied Sciences. 2016; 6(4):90. https://doi.org/10.3390/app6040090
Chicago/Turabian StyleChiotellis, Nikolaos, and Panayotis G. Cottis. 2016. "Simulation of a Narrowband Power Line Communications System over Medium Voltage" Applied Sciences 6, no. 4: 90. https://doi.org/10.3390/app6040090
APA StyleChiotellis, N., & Cottis, P. G. (2016). Simulation of a Narrowband Power Line Communications System over Medium Voltage. Applied Sciences, 6(4), 90. https://doi.org/10.3390/app6040090