Abstract
The performance simulation of an axial turbine is achieved in a simple way from the calculation of velocity diagrams. For this purpose, a reliable loss model is needed for the flow through each stationary or rotating axial blade cascade. A loss coefficient assessment is conducted through the establishment of a correlation between the maximum profile velocity ratio and a circulation parameter, dedicated specifically to turbine cascades. A detailed examination of published wind tunnel cascade tests available in the literature provides enough experimental data to support the proposed correlation. Afterwards, the surface diffusion is quantified and the total pressure loss estimation is obtained from the boundary layer momentum thickness and conservation equations for the downstream flow. Further validation of the proposed loss model is presented from published experimental results in turbine cascades and stages. The simulation methodology is also demonstrated in two single-stage steam turbine units applied to the oil refining industry, in comparison with performance factory tests results.
1. Introduction
Although modern turbomachinery design practice counts on CFD techniques to develop three-dimensional blade sections, simple methods with an empirical basis are still needed for the mean-line design. This preliminary design phase is the starting point and should provide a solid foundation for the final design, or else adding more complex flow analysis techniques would not contribute to a good result [1]. Furthermore, the empiric loss relations are used before the full 3D check, in the so-called axisymmetric through-flow calculation, usually run in the inverse mode in order to generate blade profiles from a prescribed pressure distribution [2,3].
The axial turbine performance simulation at a preliminary design phase is traditionally achieved from the determination of flow velocity diagrams. This task involves the use of aero-thermal relations as well the assessment of a flow loss model. At this phase the performance estimation shall not be dependent on detailed knowledge of blade profile, but only on the upstream and downstream velocity vectors and on some few geometrical parameters, such as the cascade solidity, the mean-line curvature length to chord ratio, the aspect ratio and the blade flare angle. The velocity vectors are then calculated at stations located upstream and downstream of each blade row, where the flow is supposed to be circumferentially uniform. For a known upstream velocity, the downstream velocity is determined taking into consideration the amount of thermal energy converted into kinetic energy, the mass conservation through a variable section annulus and the enthalpy or kinetic energy loss coefficient for that specific blade row [4]. On the other hand, the inlet to exit cascade density ratio will depend on the velocities, as given by the aero-thermal relations, making the velocity diagram problem an intricately coupled system of equations that need to be solved by an iterative procedure.
The velocity diagrams are usually evaluated at a characteristic radius, which depicts the mean conditions found along the blade span. The mean radius is often used, but an alternative choice is that which divides the annulus section into two equal-area halves. If the blade span is high enough, it may be necessary to extend this analysis to a number of different positions, at least the hub, mean and tip radius. In fact, the circumferential flow needs an inward pressure force to be sustained, so that a radial pressure gradient is built. In this case, a radial equilibrium equation shall be included and a swirl distribution exponent is used to represent a free or forced vortex design [5]. In this situation the velocity components at different radial positions will be related each other, further increasing the problem complexity.
The flow loss through the axial blade cascade is investigated in this work, from the wind tunnel cascade tests available in the literature. An accurate performance prediction is obtained from the presented method, taking into account the fluid dynamic grounding and the experimental data substantiation. A further motivation is to have an analytical method prone to computational implementation, in opposition to the traditional methods from purely empirical nature and graphical presentation. The traditional methods used as references are those attributed to Soderberg [6], Ainley & Mathieson [7] and their later modifications [8,9], Craig & Cox [10] and Baljé [11].
2. Flow Loss Model
The growth of boundary layer thickness along the blade surfaces is mainly ruled by the adverse pressure gradient which results from the profile velocity distribution. The deceleration on profile velocity is someway quantified by a diffusion parameter. Based on this concept a flow loss model was first proposed for axial compressor blades [12,13]. A correlation specifically established for axial turbine blades was later presented by Stewart et al. [14] as given by Equation (1):
This correlation between a non-dimensional momentum thickness and a diffusion parameter was based on low speed turbine cascade tests [15], as well on design data of transonic turbine rotor blades [16]. The proposed parameter is called total diffusion factor, which takes into account the amount of deceleration in both pressure and suction surfaces, according to Equation (2):
The momentum thickness is seen to slightly increase for low values of diffusion factor, but above about 0.4 the increase becomes sharp, indicating the imminence of separation. The momentum thickness given by Equation (1) is supposed to be valid for a Reynolds number of 400,000, with the blade mean-line curvature length l and the downstream velocity taken as the characteristic parameters. The final momentum thickness determined as the above description must be corrected with the local Reynolds number to the −1/5 power, characteristic of the viscous losses under turbulent flow [17].
The boundary layers developed along the end walls (at tip and hub surfaces) also have to be considered for a total loss assessment. In this case, furthermore, there is a transverse pressure gradient between pressure and suction surfaces [18], which meaningfully complicates the problem. A simple procedure is applied to bypass this issue: the end wall momentum thickness is estimated from the profile momentum thickness multiplied by the ratio of respective frictional areas. A tridimensional momentum thickness parameter [19] is then considered to add the contribution of the end wall boundary layers.
From the momentum thickness determined as per the above, a total pressure loss coefficient can be obtained according to the procedure given by Stewart [20]. This step requires solving mass and momentum conservation equations for the flow from a station just between the trailing edges to a station downstream from the blade row. This way, the friction losses, the mixing of boundary layers with the free stream and the trailing edge blockage effect are all included. From the total pressure loss previously determined, the kinetic energy loss coefficient is readily obtained to allow the calculation of the velocity diagrams.
3. Cascade Experiments
The linear cascade experiments provide a very good raw material to support the investigation of axial turbomachinery loss phenomena, although they are made of annular cascades, operating under three-dimensional flow. The linear cascade flow is essentially two-dimensional, making the measurement work much easier. Despite the absence of radial gradient, the linear cascade retains the dominant loss mechanism represented by the boundary layer growth along the blade surfaces. Furthermore, the linear cascade can properly represent the flow in a certain radial position of an annular cascade.
In fact, a few research institutions in the world have developed technological capabilities to conduct such experiments [21,22]. The hardware complexity, the precision of cascade angular setting and blade staggering, the manufacturing of static pressure taps along blade profile, the total pressure traverses and the high Mach number measurements are challenging aspects of building such test device. Special care must be taken in the cascade tunnel experiments to provide a two dimensional flow running into the specimen to be tested. For this purpose the tunnel boundary layers must be removed. Also, the blade chord dimension must be designed to keep the Reynolds number in a suited range, notably to avoid laminar separation during the tests.
In these experiments the total pressure is measured pitch wise downstream the cascade, through an inserted rake, such way the wake pattern can be closely captured. Downstream flow angle, surface velocity distribution and a wake loss coefficient are also assessed from the cascade test measurements.
The flow across an axial blade cascade is realized to be a superposition of a circulatory flow around the airfoil over the through-flow. Based on this argument, an interrelation between the maximum surface profile velocity and a circulation parameter is expected to be found. This parameter is suggested by the application of the Kelvin circulation theorem in the inter-blade channel. It follows that the product of the difference of downstream to upstream tangential velocities ∆Vu by the blade spacing t can represent the circulation integral around one blade. By adopting the upstream velocity and the blade mean-line curvature length as the characteristic parameters for the turbine cascade flow problem, the non-dimensional circulation parameter ∆Vu/(σV1l/C) and the maximum surface velocity ratio Vs,max/V1 are obtained. A linearized correlation was first proposed by Lieblein [12] for axial flow compressor cascades. Later, Baljé [11] proposed its generalized utilization for all kinds of axial cascades, although modifying the circulation parameter by an axial projection. When applying this method to turbine cascades, however, the loss estimation seems to be somewhat conservative. Taking advantage of this idea, the mentioned expression is revised in the next sections by analyzing the turbine blade cascade tests presented in [15].
3.1. Analysis of Experimental Data
Dunavant and Erwin [15] tested five different profiles in a low speed wind tunnel, under variable angle of attack and solidity, attaining about 120 different cascade flow conditions. The blade metal turning angle ranged from 65° to 120°, with a respective maximum thickness from 10% to 25% of chord length. Momentum thickness, acceleration rate, maximum surface velocity ratio and circulation parameter are calculated from the published measured data, under incompressible flow conditions. The tests cover a broad range of operation from high acceleration to sub-impulse conditions, at which the Zweifel coefficient is observed to range from 0.36 to 1.68. The most frequent velocity distribution pattern verified on test data presents a quick acceleration section followed by one single monotonic deceleration section at the suction surface, while there is no deceleration downstream from the stagnation point at pressure surface. Some few tests cases, however, exhibit a more complex pattern, with diffusion at the pressure surface or two separated diffusion sections at suction surface. Selecting only test data showing the most frequent velocity distribution behavior mentioned, the measured maximum surface velocity ratio versus the calculated circulation parameter is plotted in Figure 1. In these censored data the maximum surface velocity ratio Vs,max/V1 combined with the cascade acceleration ratio V2/V1 fully represent the diffusion phenomenon which takes place at the blade surface. A satisfactory linear correlation of low-speed test data is observed in Figure 1. The slope is 1.4 and the correlation coefficient is 0.87.
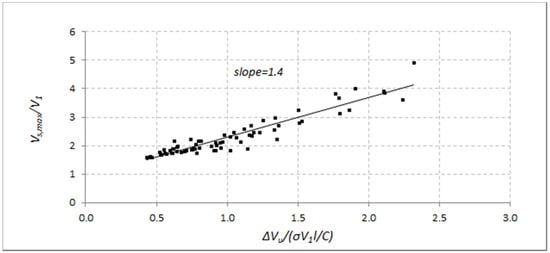
Figure 1.
Linear correlation of maximum surface velocity ratio with circulation parameter for cascade test data [15].
Dunavant and Erwin [15] have also investigated some of the cascades in a high speed tunnel, but all the tests were limited to not exceed critical flow at any point of the profile surface. These tests explored a more limited range of the circulation parameter, meaning they could not make a significant contribution to the correlation slope. Nevertheless, the loss data was considered and will be discussed in the following subsection.
3.2. Cascade Correlation
From minutely examining the test results presented in [15], it was found that the turbine cascades operate under a much broader range of circulation parameters than that under which the compressor cascade correlation was obtained [11]. The reason is mainly due to the much higher flow turning angle observed in turbine cascades. This fact suggests that the extrapolation of compressor cascade correlation may not be relied for turbine cascades. Otherwise the correlation near the null value of circulation parameter has to be trusted on compressor cascade data, as it is not possible to be evaluated from turbine cascade data. A new slope coefficient relating the maximum surface velocity ratio with respect to the circulation parameter ∆Vu/(σV1l/C) is then obtained from test data [15], as demonstrated in Figure 1. The modification proposed in this work is to change both the slope coefficient and the circulation parameter from the original Baljé formulation [11], while retaining the variation with blade thickness to chord ratio dmax/C, according to Equation (3):
After calculating an equivalent diffusion factor from the proposed correlation, the near design incidence set of Dunavant and Erwin experiments are shown to be satisfactorily matched to Stewart momentum thickness correlation (Figure 2). The contribution of the cascade correlation stated in Equation (3) is to bridge the gap between the boundary layer loss model and the velocity diagrams. This way the proposed methodology supports the loss estimation of axial turbine blade cascades to be achieved simply from the specified upstream and downstream velocity vectors and from some blade geometric parameters, which must be estimated for the specified axial solidity, notably the stagger angle, the mean-line curvature length to chord ratio and the maximum blade thickness-to-chord ratio.
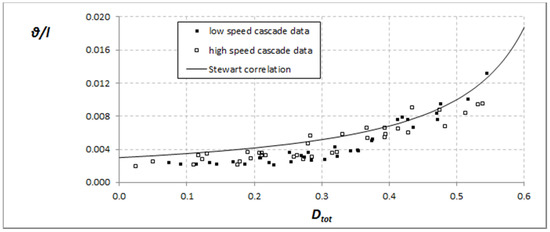
Figure 2.
Matching of cascade experiments [15] to momentum thickness correlation [14] by means of an equivalent diffusion factor based on Equation (3).
3.3. Transonic Cascade
Looking for some further validation for the profile loss on the higher subsonic range, some transonic cascade tests [23,24,25] carried out at Carleton University were examined. In this case the compressibility effects have to be taken into account on the circulation parameter calculation. Reynolds and Mach number effects on the cascade losses had to be evaluated as well. The tested cascade design data are given in Table 1. Cascades named HS2, HS1A, HS1C and HS1D are rotor cascades, while E1S50 and E2S50 are nozzle cascades. Cascades HS1A, HS1C and HS1D are all designed for the same velocity diagram, and they are built with the same axial solidity but with different blade profiles. The resulting surface velocity distribution shows that HS1A is mid-loaded, HS1C is aft-loaded and HS1D is front-loaded.

Table 1.
Design data of six transonic cascades tested at Carleton University [23,24,25].
The comparison between the published measurement results [23,24,25] and the simulated results is given in terms of total pressure profile loss coefficient Yp versus downstream flow Mach number M2 in Figure 3, Figure 4 and Figure 5. For all the presented cases a fair agreement were found between simulated and experimental results in the subsonic exit Mach number range.
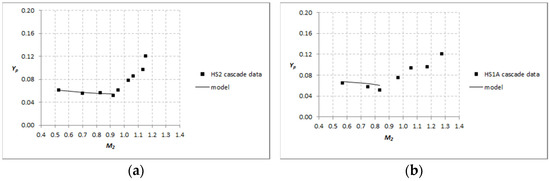
Figure 3.
Comparison of simulated and experimental total pressure profile loss coefficient for (a) HS2 cascade [23]; (b) HS1A cascade [24].
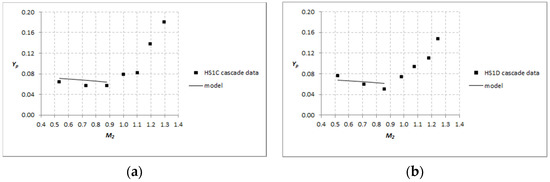
Figure 4.
Comparison of simulated and experimental total pressure profile loss coefficient for (a) HS1C cascade [24]; (b) HS1D cascade [24].
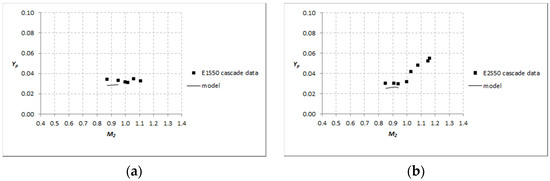
Figure 5.
Comparison of simulated and experimental total pressure profile loss coefficient for (a) E1S50 cascade [25]; (b) E2S50 cascade [25].
The simulation was limited to subsonic exit Mach number because a particular cascade loss in the transonic regime cannot be reliably predicted by the conventional correlations [26]. In fact these losses are related to a trailing edge shock pattern and its interaction with boundary layers, which strongly depends on the detailed blade geometry [27,28,29].
4. Further Validation
The turbine stage performance simulation needs a total loss coefficient to be assessed, comprising the losses coming from both profile and end-wall surfaces, through the concept of tridimensional momentum thickness. This methodology is evaluated in comparison with the available methods of turbine estimation and with available works on turbine stage tests. It is important to mention that a cascade operating in a turbine stage may receive an unsteady incoming flow due to an upstream cascade, whose effect could impact its performance. This impact is reported to be intimately related to the adopted blade profile [30]. It is also reported that there is a beneficial effect from ingested wakes in avoiding laminar separation, and thus reducing profile losses in low-pressure turbines [31]. In fact, the unsteady inflow and the rotor-stator interaction are phenomena much too complex to be predicted on a still immature preliminary design basis.
4.1. Comparison with Traditional Estimation Methods
A comparison of the proposed method with some traditional methods, similar to that done in [32], is presented in Figure 6 and Figure 7, in terms of the total enthalpy loss coefficient ξtot as function of blade aspect ratio h/C for typical nozzle and rotor cascades, respectively. The flow angles λ1 and λ2 are related to the tangential direction. The cascade solidity is considered to be the same for all methods, as given by the Zweifel criterion. Uncompressible flow conditions are assumed, chord Reynolds number is supposed to be 400,000 and trailing edge blockage is 10% in all cases. The following methods are used as references: Soderberg [6], Anley & Mathieson modified by Dunham and Came [8], Craig & Cox [10] and Baljé [11]. Computational implementation for reference and proposed loss calculation methods were implemented by the author in Matlab 2011b. Traditional estimation models implementation were checked against published results [33,34].
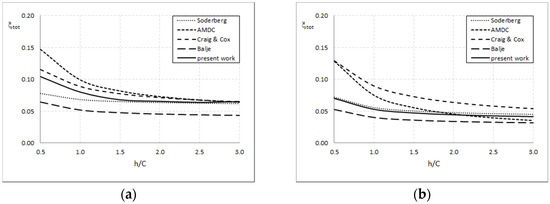
Figure 6.
Loss coefficients obtained from the present work compared with traditional estimation methods for (a) nozzle blade λ1 = 90° and λ2 = 15°; (b) nozzle blade λ1 = 90° and λ2 = 30°.
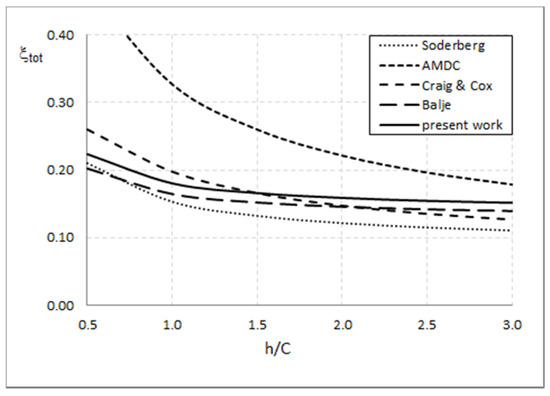
Figure 7.
Loss coefficients obtained from the present work compared with traditional estimation methods for an impulse blade λ1 = 150° and λ2 = 30°.
It can be observed that the present work seems to have improved the results of the Baljé [11] method towards the trusted methods of Ainley and Mattieson modified by Dunham and Came [8] for the nozzle blades, and Craig and Cox [10] for rotor blades. The loss sensitivity to cascade solidity is also improved as it is shown to be matched to the level reported in [35], about 10% increase in loss under ±30% deviation from optimum solidity. The proposed loss model is further validated from experimental results in turbine stages. Complete information on the loss model is presented in [36].
4.2. Comparison with Stage Performance Results
Ohlsson [37] published results of efficiency of extremely low aspect ratio impulse stages tested on air. All the four turbines have the same blade profiles, but different spans. The technique developed by the author [38] resorts to measuring the torque under an alternative axial outlet rotor, from which the exit nozzle flow tangential momentum is assessed. Although this is a very creative idea, the same degree of reaction was foreseen both for the normal and alternative rotors, which may not be a strictly correct assumption. The impact of this fact may be even more relevant on the stator performance, reason why it was not addressed in this section. The respective aspect ratio h/C and total enthalpy loss coefficients ξtot of the four rotors are shown in Table 2.
Table 2.
Ohlsson [37] rotors simulated and measured loss coefficients.
Good agreement between simulated and experimental results are observed only for rotors a and b. Rotors c and d simulation were not successful, due to the extremely low values of aspect ratio. In these cases the end-wall area is much larger than the profile surface area, so the secondary loss estimation based on profile loss is not suited anymore, limiting the method’s application.
4.3. Design Point Performance Simulation
Some available test results are used in this section to demonstrate the methodology applied to simulate the steady-state design point performance for a turbine stage. A further validation for the proposed loss model is provided from the stage efficiency measurements.
The two tested units are single stage non-condensing steam turbines, partial admission design, applied to oil refinery service. The purpose of this project was to selectively apply this equipment concept to special purpose service, according to the API 612 standard [39], for which the multi-valve multi-stage design is traditionally specified. The mono-valve single stage units may present a satisfactory performance under favorable conditions of available steam enthalpy drop, speed and output power, with the benefit of a much lower acquisition cost.
The performance tests were carried out at factory test bench, according to ASME PTC6 standard [40], as a contractual acceptance procedure. The turbine is tested coupled to a hydraulic brake through a reduction gearbox and a torque meter instrumented coupling. The output power and isentropic efficiency are calculated from the orifice plate flow meter and a set of pressure and temperature probes located at the turbine inlet, downstream of the governor valve and exit. The torque measurement is used to check and to validate the thermodynamic analysis results.
Steady-state design point performance simulation of a steam turbine stage is assessed from certain geometric data and service conditions, and also involves real gas behavior. Stage geometry data needed for both stationary and rotating cascades are as follows: number of blades, solidity, aspect ratio, trailing edge blockage, blade flare angle and blade exit angle. Axial and radial clearances are also needed to evaluate leakage losses. Service data are given by the rotational speed, the inlet total pressure and temperature, and the exit static pressure. From the described input data the non-dimensionals specific speed and specific diameter are obtained. A size parameter [41] must be added in order to give the actual length scale to the non-dimensional geometric parameters.
The problem of simulating a turbine stage performance consists in determining the degree of reaction which provides the better matching of both rotor blade exit angle and arc admission fraction to actual values. Service conditions and geometry data are shown in Table 3 for the two tested units.
Table 3.
Service conditions and non-dimensional geometric data for the two single-stage partial admission steam turbines tested at a factory bench.
The performance simulation results are shown in Table 4 for the two tested units. Some relevant aero-thermal parameters are listed, as well the loss coefficients. Simulated total to static efficiencies are shown to be in agreement with factory test bench measurement results. Estimation of overexpansion losses at supersonic nozzle blade exit flow were done according to Aungier [42]. Estimation of partial admission losses (filling and emptying loss, scavenge loss and leakage from the active flow to the inactive region) were done according to Baljé [43].
Table 4.
Performance simulation and measured results for the two single stage-partial admission steam turbines tested at a factory bench.
The simulated loss breakdown is shown in Table 5. In fact, commercial steam turbine design is not fully optimized to the specified service due to the utilization of standard-dimension components, like wheels and blades. Despite its advanced rotor blade profile, the detailed analysis clarifies that turbine #2 performance is mainly impaired by leakage losses due to the high nozzle-to-rotor blades axial clearance, suggesting that the wheel was designed for full admission.
Table 5.
Simulated loss breakdown for the two single-stage partial admission steam turbines tested at a factory bench.
5. Conclusions
A loss model for the mean-line flow through an axial turbine stage is proposed in this work, based on the works of Baljé [11] and Stewart et al. [14]. The method is based on the boundary layer theory, the concept of a diffusion factor, wind tunnel cascade tests available in literature and the conservation equations for compressible flow. A substantial background is established from the fluid dynamic criteria inherited from former works and from the improvements made based on the analysis of experimental data available. Computational implementation drives the use of analytical methods, in opposition to the traditional methods, based on a more empirical approach and turning to manual calculation through graphic information.
The presented method is suited to design point simulation and may also be applied to near design incidence with accurate results. It is still possible to extend the application to off-design simulation through the addition of an incidence loss model, which could not be achieved from the examined experimental data.
Acknowledgments
The present work was supported by Petrobras-Petróleo Brasileiro S.A.
Conflicts of Interest
The author declares no conflict of interest.
Abbreviations
The following abbreviations are used in the manuscript:
| C | Blade chord length |
| c0 | Spouting velocity, from converting the ideal enthalpy drop into kinetic energy |
| d | Blade thickness |
| D | Diffusion factor |
| h | Blade span |
| l | Blade meanline curvature length |
| M | Mach number |
| t | Blade pitch |
| u | Blade peripheral speed |
| V | Velocity |
| Y | Total pressure loss coefficient |
| λ | Flow angle |
| ξ | Enthalpy or kinetic energy loss coefficient, based on isentropic kinetic energy |
| θ | Boundary layer momentum thickness |
| σ | Cascade solidity, chord to pitch ratio. |
Subscipts: | |
| 1 | Upstream |
| 2 | Downstream |
| min | Minimum |
| max | Maximum |
| p | Pressure surface |
| s | Suction surface |
| u | Tangential direction |
| x | Axial direction |
| tot | Total |
References
- Horlock, J.H.; Denton, J.D. A Review of Some Early Design Practice Using Computational Fluid Dynamics and a Current Perspective. J. Turbomach. 2005, 127, 5–13. [Google Scholar] [CrossRef]
- Denton, J.D. Throughflow Calculations for Transonic Axial Flow Turbines. ASME J. Eng. Power 1978, 100, 212–218. [Google Scholar] [CrossRef]
- Denton, J.D. An Improved Time-Marching Method for Turbomachinery Flow Calculation. ASME J. Eng. Power 1983, 105, 514–521. [Google Scholar] [CrossRef]
- Baljé, O.E. A Study on Design Criteria and Matching of Turbomachines: Part A–Similarity Relations and Design Criteria of Turbines. ASME J. Eng. Power 1962, 84, 83–102. [Google Scholar] [CrossRef]
- Glassman, A.J. Turbine Design and Application; NASA SP-290; NASA: Washington, DC, USA, 1972; p. 390. [Google Scholar]
- Dixon, S.L. Fluid Mechanics and Thermodynamics of Turbomachinery, 4th ed.; Butterworth-Heinemann: Woburn, MA, USA, 1998. [Google Scholar]
- Ainley, D.G.; Mathieson, G.C.R. A Method of Performance Estimation for Axial-Flow Turbines; N.G.T.E. Report R. 111; Aeronautic Research Council: London, UK, 1952. [Google Scholar]
- Dunham, J.; Came, P.G. Improvements to the Ainley-Mathieson Method of Turbine Performance Prediction. J. Eng. Power 1970, 92, 252–256. [Google Scholar] [CrossRef]
- Kacker, S.C.; Okapuu, U. A Mean Line Prediction Method for Axial Flow Turbine Efficiency. J. Eng. Power 1981, 104, 111–119. [Google Scholar] [CrossRef]
- Craig, H.R.M.; Cox, H.J.A. Performance Estimation of Axial Flow Turbines. Proc. Inst. Mech. Eng. 1970, 185, 407–424. [Google Scholar] [CrossRef]
- Baljé, O.E. Axial Cascade Technology and Application to Flow Path Designs. ASME J. Eng. Power 1968, 90, 309–328. [Google Scholar] [CrossRef]
- Lieblein, S.; Schwenk, F.C.; Broderick, R.L. Diffusion factor for Estimating Losses and Limiting Blade Loadings in Axial Flow Compressor Blade Elements; NACA RM E53D01; National Advisory Committee for Aeoronautics: Washington, DC, USA, 1953.
- Lieblein, S. Loss and Stall Analysis of Compressor Cascades. ASME J. Basic Eng. 1959, 81, 387–400. [Google Scholar]
- Stewart, W.L.; Whitney, W.J.; Wong, R.Y. A Study of Boundary Layer Characteristics of Turbomachine Blade Rows and their Relation to Over-all Blade Losses. ASME J. Eng. Power 1960, 82, 588–592. [Google Scholar]
- Dunavant, J.C.; Erwin, J.R. Investigation of a Related Series of Turbine-Blade Profiles in Cascade; NACA TN 3802; National Advisory Committee for Aeoronautics: Washington, DC, USA, 1956.
- Stewart, L.; Whitney, W.; Miser, J. Use of Momentum Thickness in Describing Turbine Rotor-Blade Losses; NACA RM E56B29; National Advisory Committee for Aeoronautics: Washington, DC, USA, 1956.
- Baljé, O.E. A Study on Reynolds Number Effects in Turbomachines. ASME J. Eng. Power 1964, 86, 227–235. [Google Scholar] [CrossRef]
- Langston, L.S. Crossflows in a Turbine Cascade Passage. J. Eng. Power 1980, 102, 866–874. [Google Scholar] [CrossRef]
- Stewart, W.L.; Whitney, W.J.; Wong, R.Y. Use of Mean Section Boundary Layer Parameters in Predicting Three Dimensional Turbine Stator Losses; NACA RM E55L12A; National Advisory Committee for Aeoronautics: Washington, DC, USA, 1956.
- Stewart, W.L. Analysis of Two-Dimensional Compressible Flow Loss Characteristics Downstream of a Turbomachine Blade Rows in Terms of Basic Boundary Layer Characteristics; NACA TN 3515; National Advisory Committee for Aeoronautics: Washington, DC, USA, 1955.
- Monaco, L.; Vogt, D.; Fransson, T. A New Linear cascade Test Facility for Use in Engineering Education. In Proceedings of the XXI Biennial Symposium on Measuring Techniques in Turbomachinery, Valencia, Spain, 22–23 March 2012.
- Kiock, R.; Lehthaus, F.; Baines, N.C.; Sieverding, C.H. The Transonic Flow through a Plane Turbine Cascade as Measured in Four European Wind Tunnels. ASME J. Eng. Gas Turbines Power 1986, 108, 277–284. [Google Scholar] [CrossRef]
- Jeffries, M.S. Initial Investigations of the Transonic Turbine Aerodynamics Using the Carleton University High-Speed Wind Tunnel. Ph.D. Thesis, Carleton University, Ottawa, ON, Canada, October 2000. [Google Scholar]
- Corriveau, D. Influence of Loading Distribution on the Performance of High Pressure Turbine Blades. Ph.D. Thesis, Carleton University, Ottawa, ON, Canada, July 2005. [Google Scholar]
- Sooriyakumaran, C. Experimental Study of Profile Losses in Three Transonic Turbine Cascades. Ph.D. Thesis, Carleton University, Ottawa, ON, Canada, 2014. [Google Scholar]
- Sieverding, C.H. Axial Turbine Performance Prediction Methods. In Thermodynamics and Fluid Mechanics of Turbomachinery; Üçer, A.Ş., Stow, P., Hirsch, C.H., Eds.; Martinus Nijhoff Publishers: Dordrecht, The Netherlands, 1985; Volume II, pp. 737–784. [Google Scholar]
- Mee, D.J.; Baines, N.C.; Oldfield, M.L.G.; Dickens, T.E. An Examination of the Contributions to Loss on a Transonic Turbine Blade in Cascade. J. Turbomach. 1992, 114, 155–162. [Google Scholar] [CrossRef]
- Martelli, F.; Boretti, A. A Simple Procedure to Compute Losses in Transonic Turbine Cascades. In Proceedings of the Gas Turbine Conference and Exhibit, Houston, TX, USA, 18–21 March 1985.
- Graham, C.G.; Kost, F.H. Shock Boundary layer Interaction on High Turning Transonic Turbine Cascades. In Proceedings of the ASME 1979 International Gas Turbine Conference and Exhibit and Solar Energy Conference, San Diego, CA, USA, 12–15 March 1979.
- Berrino, M.; Simoni, D.; Ubaldi, M.; Zunino, P.; Bertini, F. Aerodynamic Loading distribution Effects on Off-Design Performance of a Highly Loaded LP Turbine Cascades Under Steady and Unsteady Incoming Flows. In Proceedings of the ASME Turbo Expo 2016: Turbomachinery Technical Conference and Exposition, Seoul, Korea, 13–17 June 2016.
- Howell, R.J.; Ramesh, O.N.; Hodson, H.P.; Harvey, N.W.; Schulte, V. High Lift and Aft Loaded Profiles for Low Pressure Turbines. J. Turbomach. 2000, 123, 181–188. [Google Scholar] [CrossRef]
- Lozza, G. A Comparison between the Craig & Cox and the Kacker-Okapuu Methods of Turbine Performance Prediction. Meccanica 1982, 17, 211–221. [Google Scholar]
- Wei, N. Significance of Loss Models in Aerothermodynamic Simulation for Axial Turbines. Ph.D. Thesis, Kungliga Tekniska högskolan, Stockholm, Sweden, 2000. [Google Scholar]
- Benini, E.; Boscolo, G.; Garavello, A. Assessment of Loss Correlations for Performance Prediction of Low Reaction Gas Turbine Stages. In Proceedings of the ASME 2008 International Mechanical Engineering Congress and Exposition, Boston, MA, USA, 31 October–6 November 2008.
- Miser, J.W.; Stewart, W.L.; Whitney, W. Analysis of Turbomachine Viscous Losses Affected by Changes in Blade Geometry; NACA RM E56F21; National Advisory Committee for Aeoronautics: Washington, DC, USA, 1956.
- Martins, G.L. Performance of Single Stage Partial Admission Axial Expander Applied to a Waste Heat Recovery Rankine Organic Cycle. Ph.D. Thesis, PUC-RIO, Rio de Janeiro, Brazil, May 2015. [Google Scholar]
- Ohlsson, G.O. Low Aspect Ratio Turbines. ASME J. Eng. Power 1964, 86, 13–16. [Google Scholar] [CrossRef]
- Ohlsson, G.O. Admission, Low Aspect Ratios and Supersonic Speeds in Small Turbines. Ph.D. Thesis, Massachusetts Institute of Technology, Cambridge, MA, USA, January 1956. [Google Scholar]
- American Petroleum Institute. Petroleum, Petrochemical and Natural Gas Industries—Steam Turbines—Special Purpose Applications, 7th ed.; API Standard 612; American Petroleum Institute: Washington, DC, USA, 2014. [Google Scholar]
- The American Sociaty of Mechanical Engineers. ASME Performance Test Code 6 on Steam Turbines; ASME PTC 6-2004; ASME: New York, NY, USA, 2004. [Google Scholar]
- Macchi, E.; Perdichizzi, A. Efficiency Prediction for Axial-Flow Turbines Operating with Nonconventional Fluids. J. Eng. Power 1981, 103/719, 718–724. [Google Scholar] [CrossRef]
- Aungier, R.H. Turbine Aerodynamics: Axial-Flow and Radial-Flow Turbines Design and Analysis; ASME: New York, NY, USA, 2006. [Google Scholar]
- Baljé, O.E. Turbo Machines, A Guide to Design, Selection and Theory; John Wiley & Sons: New York, NY, USA, 1981. [Google Scholar]
© 2016 by the author; licensee MDPI, Basel, Switzerland. This article is an open access article distributed under the terms and conditions of the Creative Commons Attribution (CC-BY) license (http://creativecommons.org/licenses/by/4.0/).