1. Introduction
There is an increasing interest in the use of pitch shifting algorithms in music production [
1], with a creative aim or to correct singer mistakes during a recording process, and also in voice synthesis systems for entertainment purposes [
2,
3]. The most commonly-used pitch shifting algorithms are focused on the spectral envelope preservation in order to achieve a natural transformation, modifying as slightly as possible the original timbre [
4]. Although many different algorithms have been proposed, most of them are based on overlap-add techniques, like synchronized overlap-and-add (SOLA) [
5], time domain-pitch synchronous overlap and add (TD-PSOLA) [
6], frequency-domain PSOLA (FD-PSOLA) [
7], waveform similarity based SOLA (WSOLA) [
8], etc. These techniques consist of excising frames from the voice, processing them and recombining the resulting frames with an overlap-add (OLA) algorithm. Due to its quality and simplicity, one of the most used methods to perform pitch shifting is TD-PSOLA [
9]. This technique preserves the spectral envelope and performs the pitch shifting by using a synthesis step increment different than the analysis step increment. In addition to low computational cost, the main advantage of this algorithm relies on the usage of the explicit knowledge of the pitch, which is helpful to synchronize the time segments and to avoid pitch discontinuities.
Nevertheless, some studies suggest that the spectral envelope changes as pitch [
10] or intensity [
11] varies. Depending on the pitch of the note, trained singers position their voices differently when singing, producing various vocal resonances in the same vocal range, like the chest voice or the falsetto voice. This is why spectral envelope preservation might not be, in our opinion, the best choice to perform wide variations in pitch.
The majority of singing processing and synthesis studies are focused on achieving a natural result through formant preservation [
12], control of
fluctuations [
13], etc. However, it is still unclear how the spectral envelope changes with pitch; thus, we decided to study this particular effect with the goal of obtaining more realistic results.
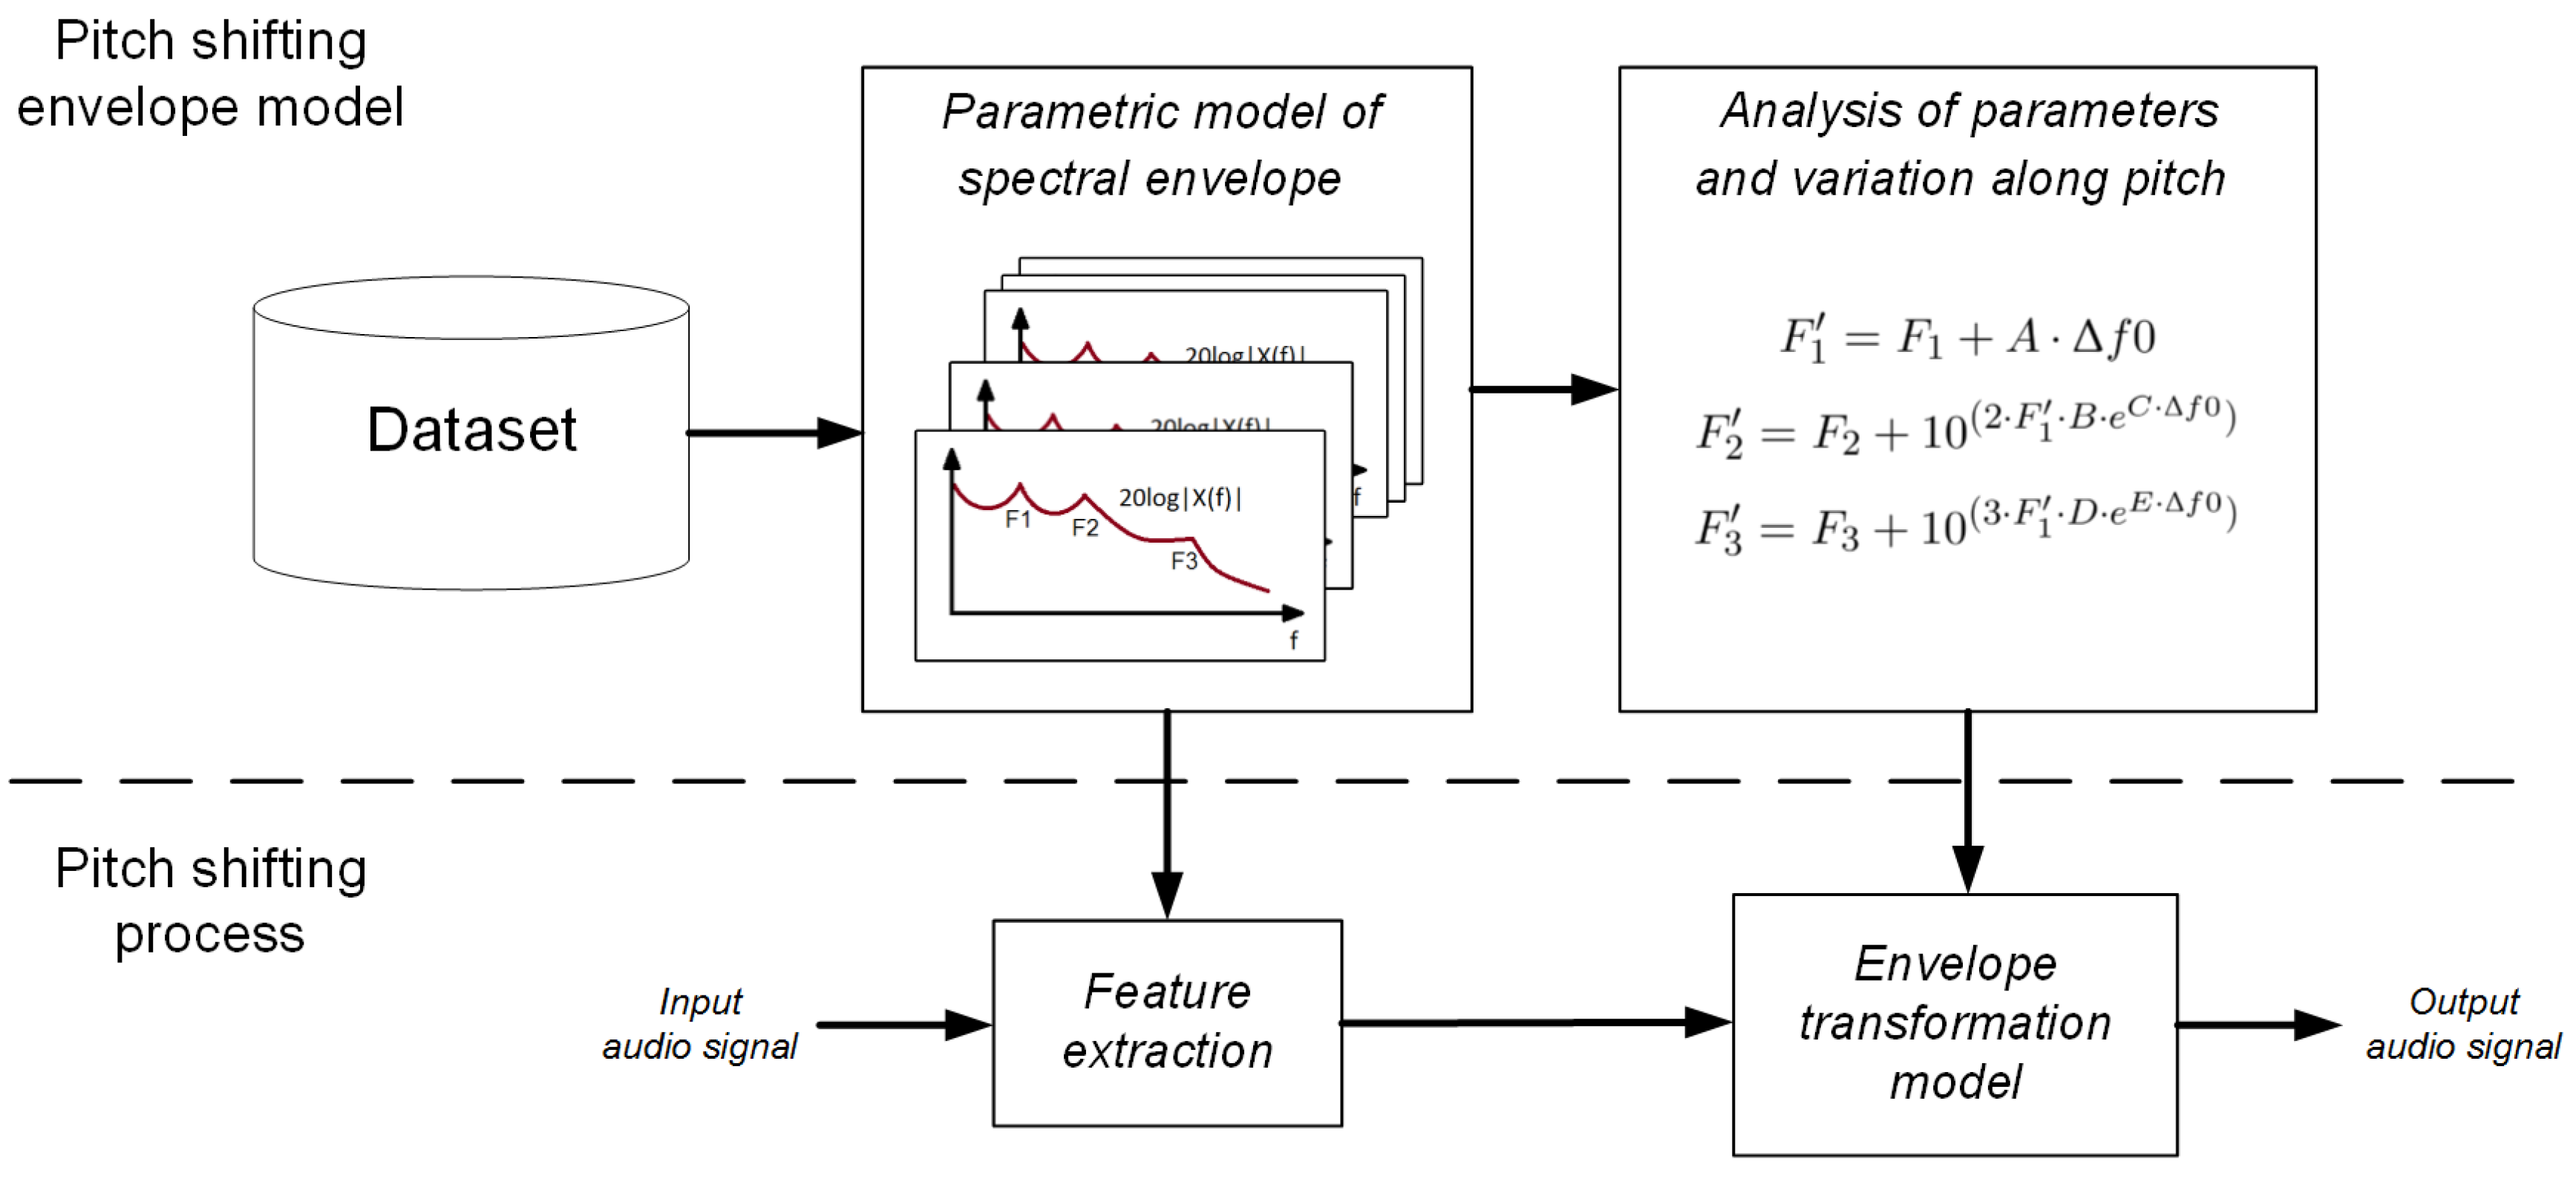
In this paper, two main tasks have been carried out. First, an analysis of the natural variations of the spectral envelope as the pitch of the singing voice varies is conducted. Then, a pitch shifting scheme that makes use of the proposed model is implemented.
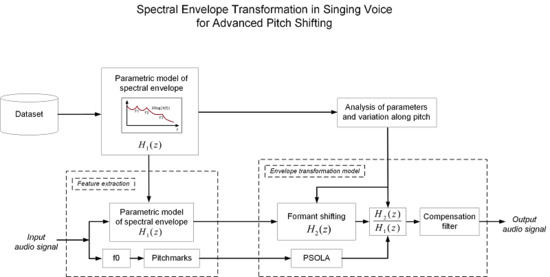
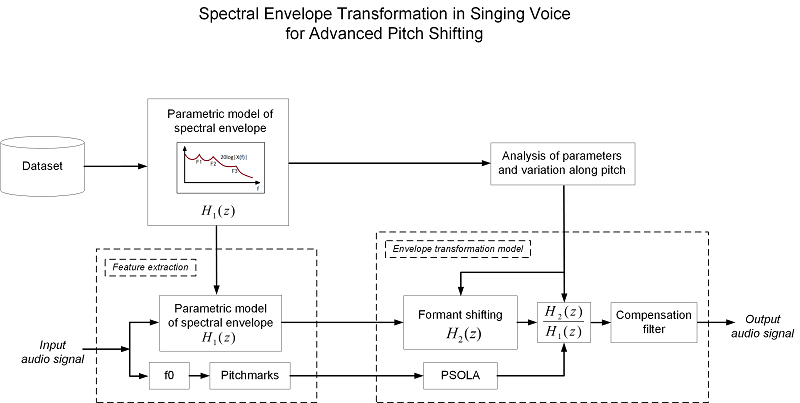
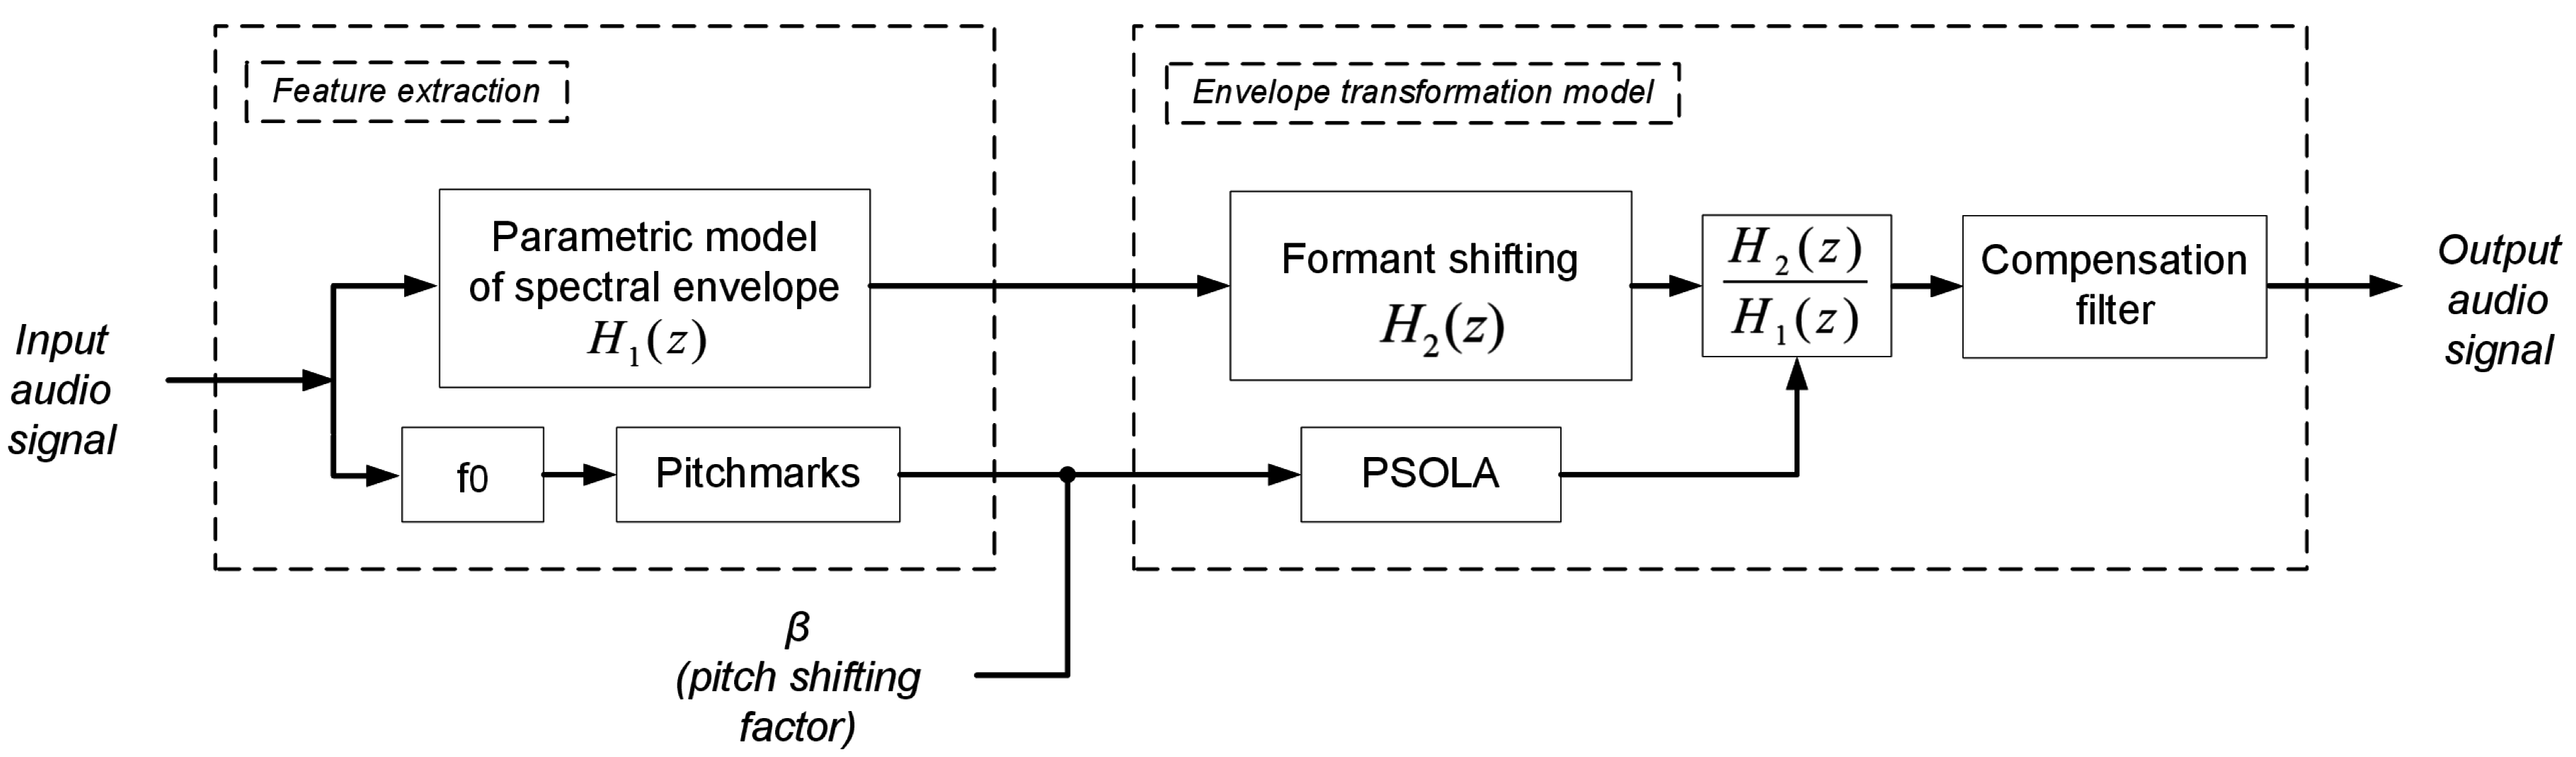
Figure 1 shows a diagram of the main stages performed for both the analysis of the behavior of the spectral envelope and the the pitch shifting process devised to take advantage of our findings.
The manuscript is organized as follows:
Section 2 describes the first stage, in which a parametric model [
14] is used to fit accurately the spectral envelope of a number of recorded vowel sounds. In
Section 3, the usage of this tool is explained and used for the analysis of a dataset consisting in 76 sung vowels, in order to obtain a set of functions describing the variations of parameters along pitch.
Section 4 presents the pitch shifting algorithm developed, which is based on PSOLA with envelope transformation. The evaluation methodology is explained in
Section 5, and the results are shown and discussed in
Section 6. Finally, some conclusions are drawn in
Section 7.
2. Parametric Model of the Spectral Envelope
This section describes the specific model implemented in the system to parameterize the spectral envelope. First, the model is defined by a set of resonators and a source filter. Then, a process to automatically adjust the model to the true envelope is devised.
2.1. Description of the Spectral Envelope Model
The term spectral envelope refers to a real function that passes through the prominent spectral peaks of the spectrum. For harmonic signals, these prominent peaks are normally the harmonics, but the main problem estimating the spectral envelope is revealed when some of the harmonics are missing or weak, suggesting that the spectral envelope should not go through these.
Many existing approaches to parameterize the spectral envelope of speech or singing voice are based on linear prediction coding (LPC) [
15], whereby the vocal track acoustic response is modeled by an N-order all-pole filter [
16]. However, the LPC model has systematic errors in high-pitched signals due to the strong dependency between the optimal order of the filter and the fundamental frequency [
4]. Furthermore, manipulating the coefficients to achieve specific timbre transformations is not simple, so this technique was discarded to achieve our goal, as well as other further approaches, like line spectral frequencies (LSF) [
17] or cepstrum-based methods [
4].
An indispensable requirement for using a reliable model is to ease the control of parameters; therefore, we opted for a formant-based model developed in a previous work [
14]. The spectral envelope of this model is inspired by some speech/singing synthesis systems, like [
18,
19], and it is based on several resonator filters in parallel determining the acoustic formants, plus a certain slope serving as the glottal source.
With a source filter and a set of five parallel resonators, we modeled the spectrum of a sung vowel in the frequency band of [0,5000] Hz. The resonators correspond to the glottal resonator
and the first four formants of the vocal tract (
to
). Thus, the envelope is defined as:
where the source and the resonances are expressed as:
where
is the frequency response of resonator
i. Our approach is modeled with four-pole resonators each consisting of two identical second-order filters in cascade with two complex pole pairs
and
, defined by:
with:
In these expressions,
is the central frequency of resonator
i,
is the 6-dB bandwidth and
is the sampling rate, all of them expressed in Hz.
Table 1 shows the ranges of values for the different parameters in our model.
,
and
will be considered to define the formants
,
and
, respectively.
Automatically estimating the formant frequencies and bandwidths is an important task for our scheme. The existing algorithms observed [
20,
21] suffer from substantial errors or mis-adjustments, requiring human intervention to achieve a reliable annotation of sounds [
22]. However, we decided to develop a completely automatic system, which allows a precise estimation of formants by a recursive approximation of the parameters to the spectral magnitude of the signal in a steady state. This optimization scheme is detailed in the next subsection.
Furthermore, the harmonic and residual components were separated using [
23]. Then, each component was optimized independently, obtaining an envelope of the harmonic component and another one of the residual component.
2.2. Estimation of Spectral Envelope Parameters
As has been mentioned before, a good estimation of the real envelope is important. The envelope estimation process can be done manually by visually modifying the parameters of the model to fit the envelope defined by the model to the spectral data [
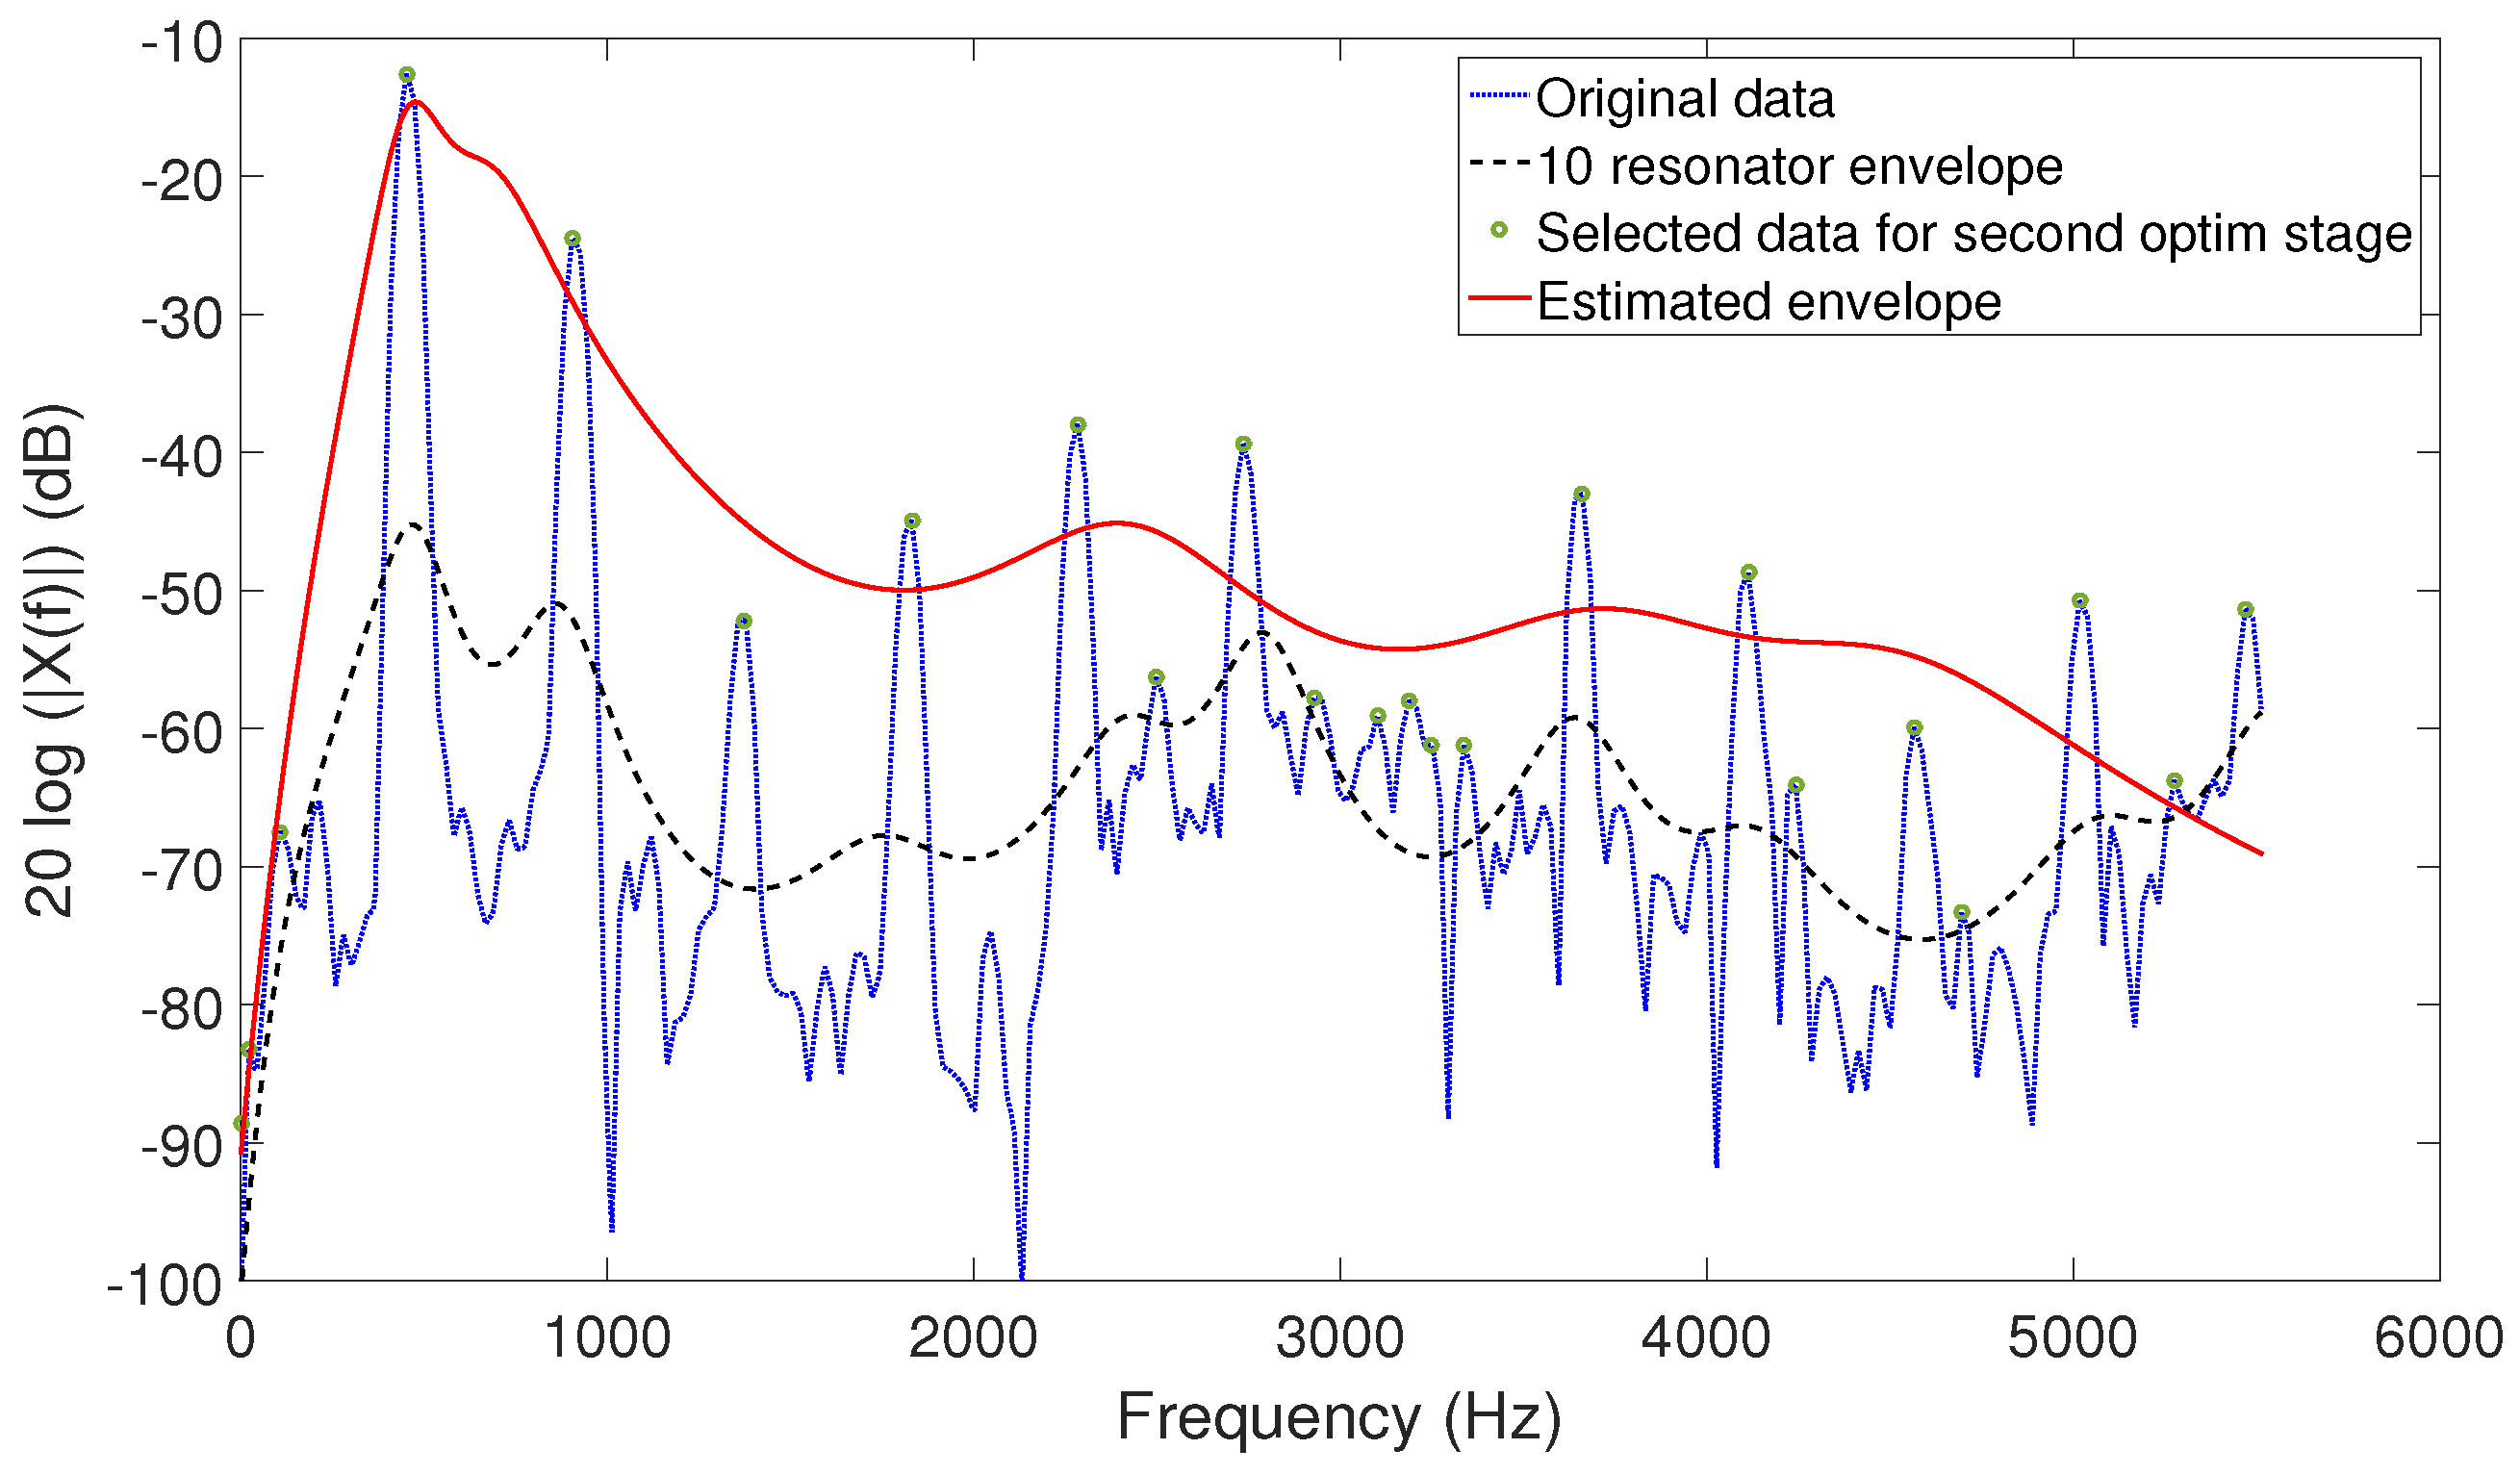
14]; however, this is a tedious and slow process that in the end relies on the judgment of the operator. Therefore, in order to perform the spectral estimation task, we have developed an algorithm to automatically find the parameters of the model by means of an iterative non-linear constrained optimization process. Very briefly, the process will adjust the parameters to selected spectral peaks used as the reference. This whole process is carried out in two steps.
In the first step, a spectral envelope model with 10 resonators in parallel is considered. Each resonator implements a four-pole transfer function as described in
Section 2.1. In this model, the parameters of five of the resonators are constrained as indicated in
Table 1, whereas the location of the other five resonators is not restricted, and their allowed bandwidth range is very large, between 10 and 1500 Hz. With this model, an iterative optimization process is carried out to minimize the logarithm of the absolute difference between the spectrum and our 10 resonator model (see
Figure 2) by tuning the parameters
of this model:
with
the spectral envelope (
1) modeled with 10 resonators,
stands for the Fourier transform of the audio excerpt and
M is the number of samples of
.
represents the complete set of parameters of our 10-resonator model:
.
After the first stage described is complete, the second stage starts. In this stage, all of the local maxima over the 10 resonator spectral envelope defined by
are selected, and a new iterative optimization process is carried out with these data. Now, the five-parallel resonator model described in
Section 2.1, with the constrains in
Table 1, is used to fit the selected data using the same logarithmic error measure as in the previous stage, to obtain the envelope parameters:
with
the subset of local maxima among the samples of
over
, as defined by the output of the previous optimization stage.
represents the complete set of parameters of our resonator model:
, as described in
Section 2.1.
The parameters
that draw the envelope obtained after this stage (
Figure 2) are used to define the location and bandwidth of the formants of the excerpt analyzed and will be used for the spectral envelope transformation process devised (
Section 3 and
Section 4.2) and for the objective evaluation that will be described later (
Section 5.1).
As in other processes in the work, this step is carried out for both the harmonic and the residual component separately.
3. Analysis of Parameters and Their Variation along Pitch
This section details different processes carried out to model the set of functions describing our pitch shifting model. First, the dataset of sung notes used in our analysis is described in
Section 3.1. Then, the variation of the formants with pitch is described in
Section 3.2. Finally, the proposed pitch shifting model with spectral envelope transformation based on the information retrieved in previous steps is presented in
Section 3.3.
3.1. Dataset
Our dataset consists of 76 sustained notes sung by two male and two female amateur singers with ages between 20 and 40 years old. None of them had academic vocal training, but they had some experience as singers in different pop bands.
The singers were all given the same instructions in the recording session: they sung different scales through the specific tessitura of each singer, covering their whole vocal range with intended constant intensity.
The notes were recorded for different vowels (/a/,/e/,/i/,/o/ and /u/, corresponding to the sound of the vowels in the Spanish language), in a comfortable register. The recording environment was a semi-anechoic chamber with a Neumann TLM103 microphone with an anti-pop shield and Onyx Blackbird interface. The excerpts were recorded in mono with a sampling rate of 44,100 Hz.
3.2. Formant Analysis
Among the parameters involved in our proposed spectral envelope model, we found significant evidence of their variation with the pitch only in the central frequency of the three first formants. We did not find evidence of any noticeable modification in the case of other parameters, like gain or slope depth. Moreover, we found no meaningful relationship between the bandwidth of the different resonators in our model and the pitch, although previous works could make us hypothesize the opposite [
14]; therefore, the variation of the bandwidth of the resonators has not been considered in our model.
The analysis has been carried out for the harmonic and the residual component of each audio sample separately. This has been accomplished by making use of the algorithms described in [
23,
24]. Each component has been analyzed independently; however, the process and even the results obtained are very similar for both cases, so we will focus our explanation on the harmonic part. Whenever it is necessary to distinguish between the two cases, specific descriptions will be provided.
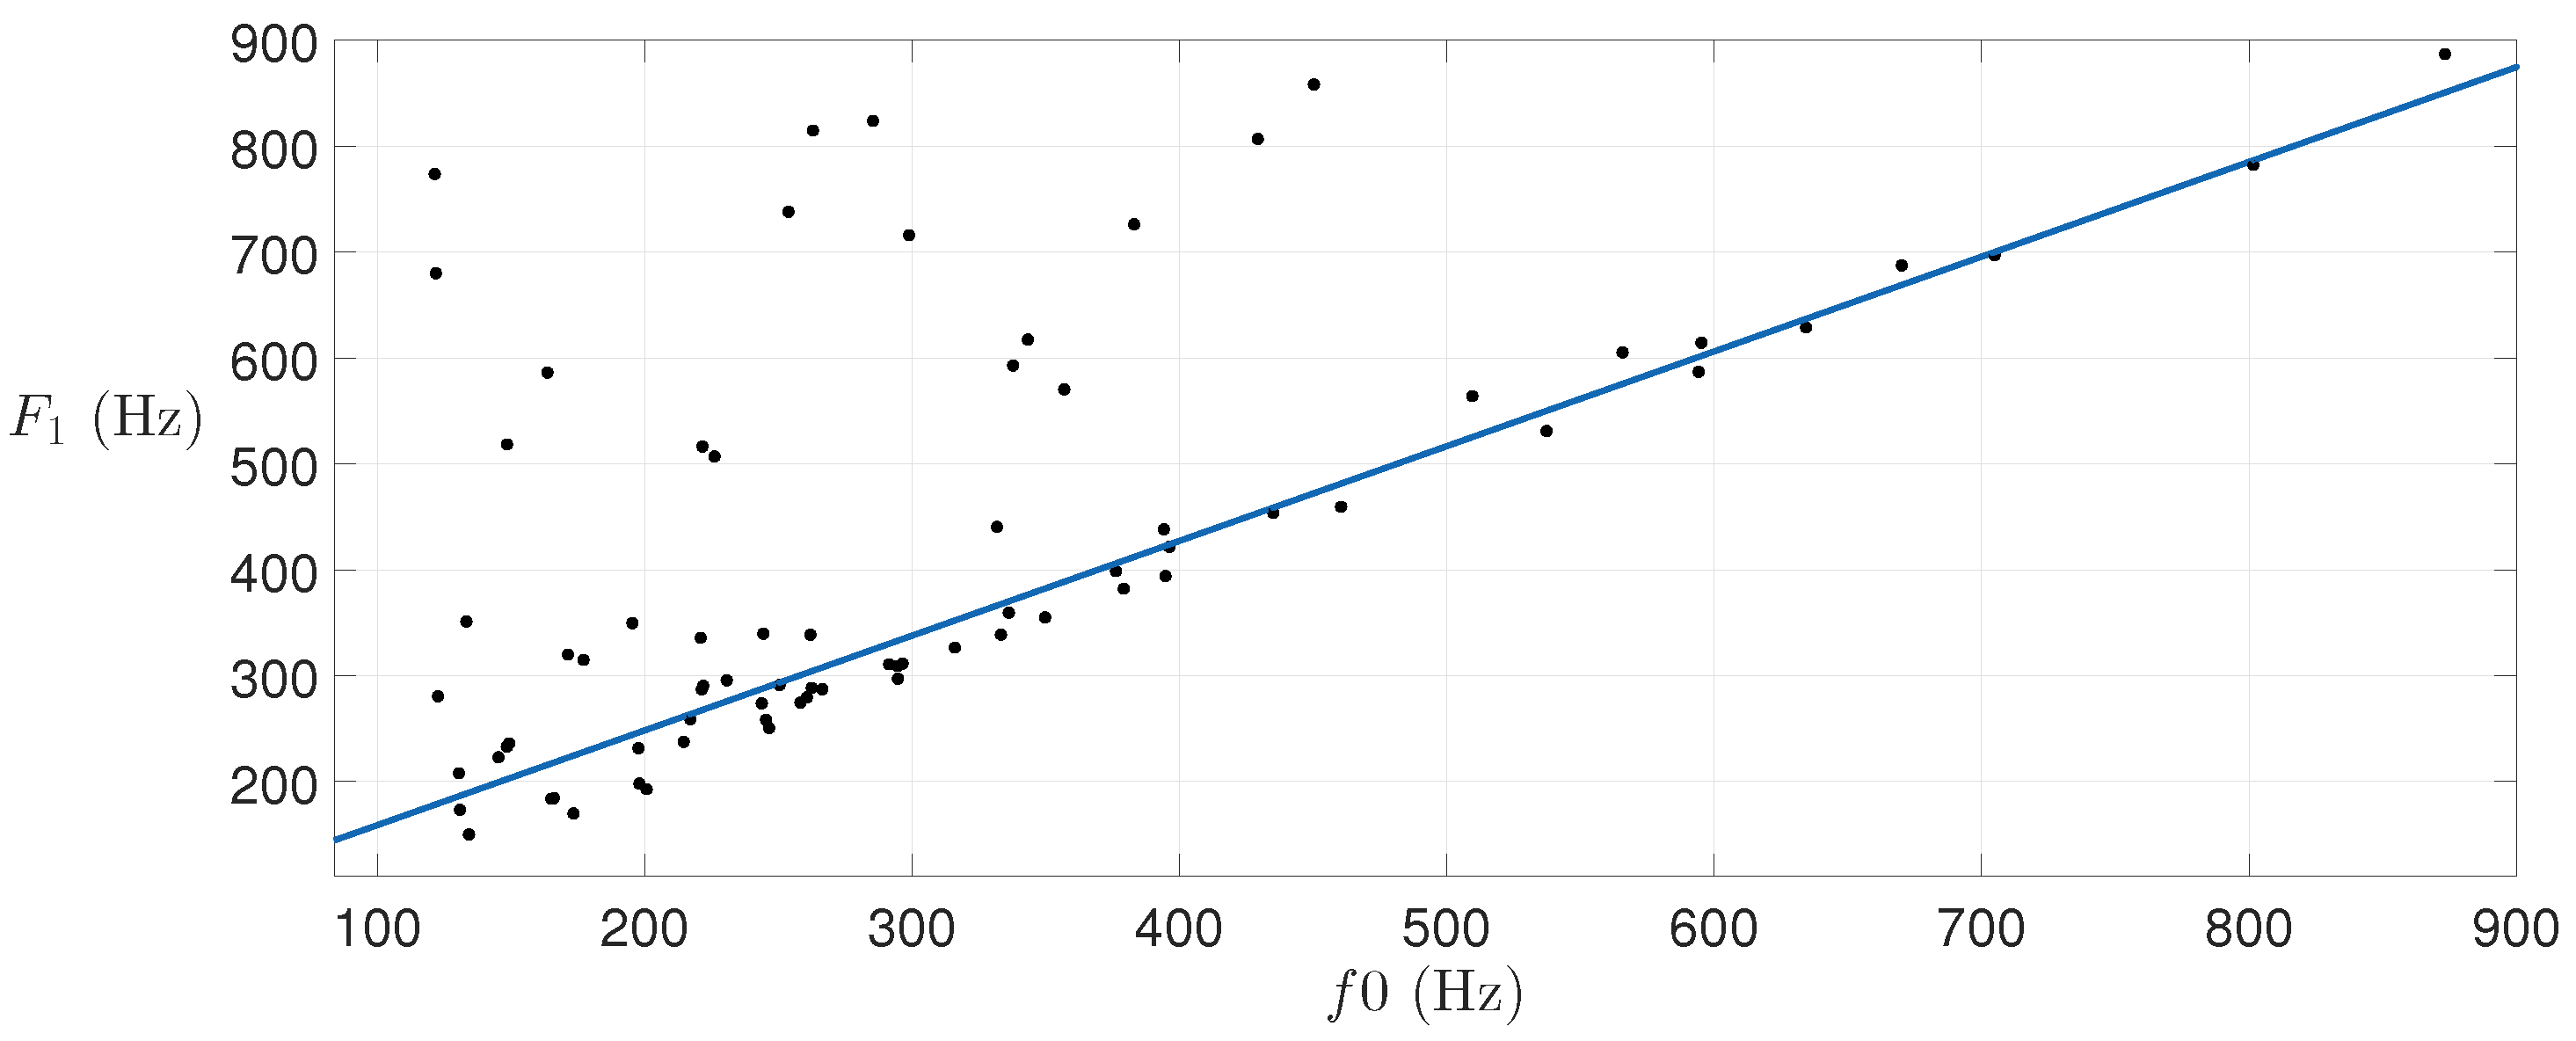
3.2.1. Formant 1
It is known that formants are dependent to varying degrees on the vowel sung, as well as on the sex and age of talkers or singers [
25]. With the goal of finding a global tendency of the specific parameters along pitch, all of these variables are mixed in the analysis.
Figure 3 shows the obtained results regarding the central frequency of the first formant (
) in all of the analyzed samples.
is the most strongly affected parameter in our model as pitch varies with an upward trend with increasing pitch (
).
Taking this tendency into account, a linear approximation has been carried out by using robust regression [
26]. Note that the chosen approach is more accurate than ordinary least squares regression in this particular case, achieving a more reliable slope by rejecting some outliers from the data samples. This algorithm uses an iteratively re-weighted least squares scheme with the following bi-square weighting function:
where
r is the residual or the error to minimize, which is defined as the difference between the actual value of the dependent variable (
in this case) and the value predicted by the model.
k is the tuning constant:
with
the median absolute deviation of the residuals from their median.
As already mentioned, in contrast to the approximately linear relationship between
and pitch, a meaningful relationship between the bandwidth (
) of the first formant and pitch was not found. Conversely, by changing
, some unintended variations of intensity were attained, which is ultimately coherent with the non-linear energy damping model of vocal resonators proposed in [
27], in which the Q of each resonator depends on the input signal. Because of this, we decided not to modify the bandwidth
in order to keep the intensity of the result of the transformation as close as possible to the original intensity.
As is well known, different vowels with the same involve different parameters of . Because of this and before trying to find a global tendency, some analyses of separated vowels and singers were carried out. It was found that had the tendency to increase with for all of the vowels and the singers, which encouraged us to find a commonly valid relationship.
If the pitch shifting is performed without changing the first formant, the vowel seems to loose thickness and becomes breathy, especially in higher notes, according to our observations. Thus, shifting appears to be necessary in order to keep the original thickness of the sound.
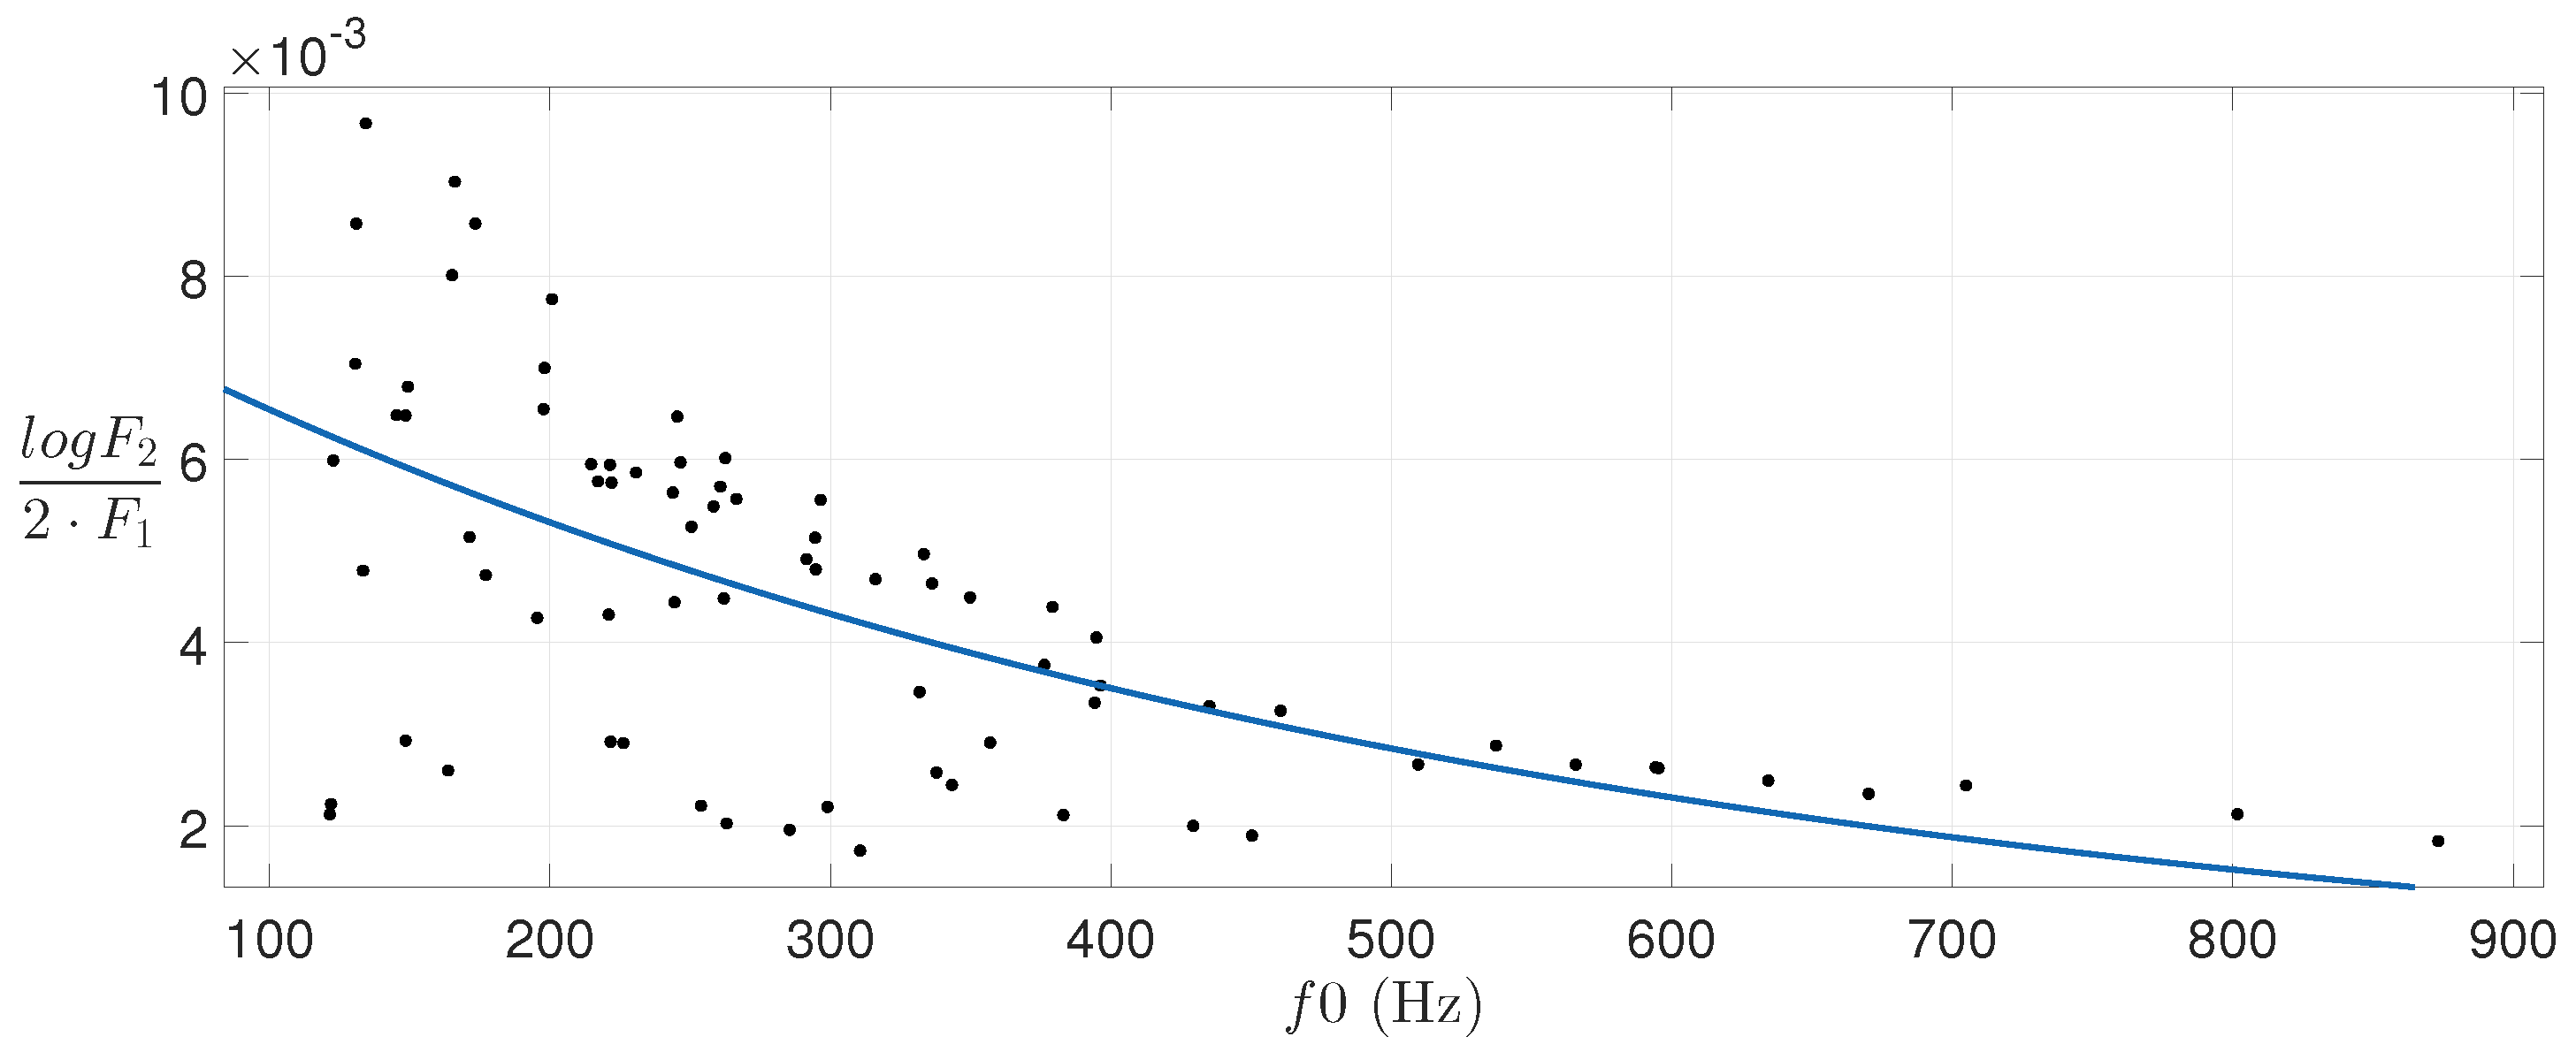
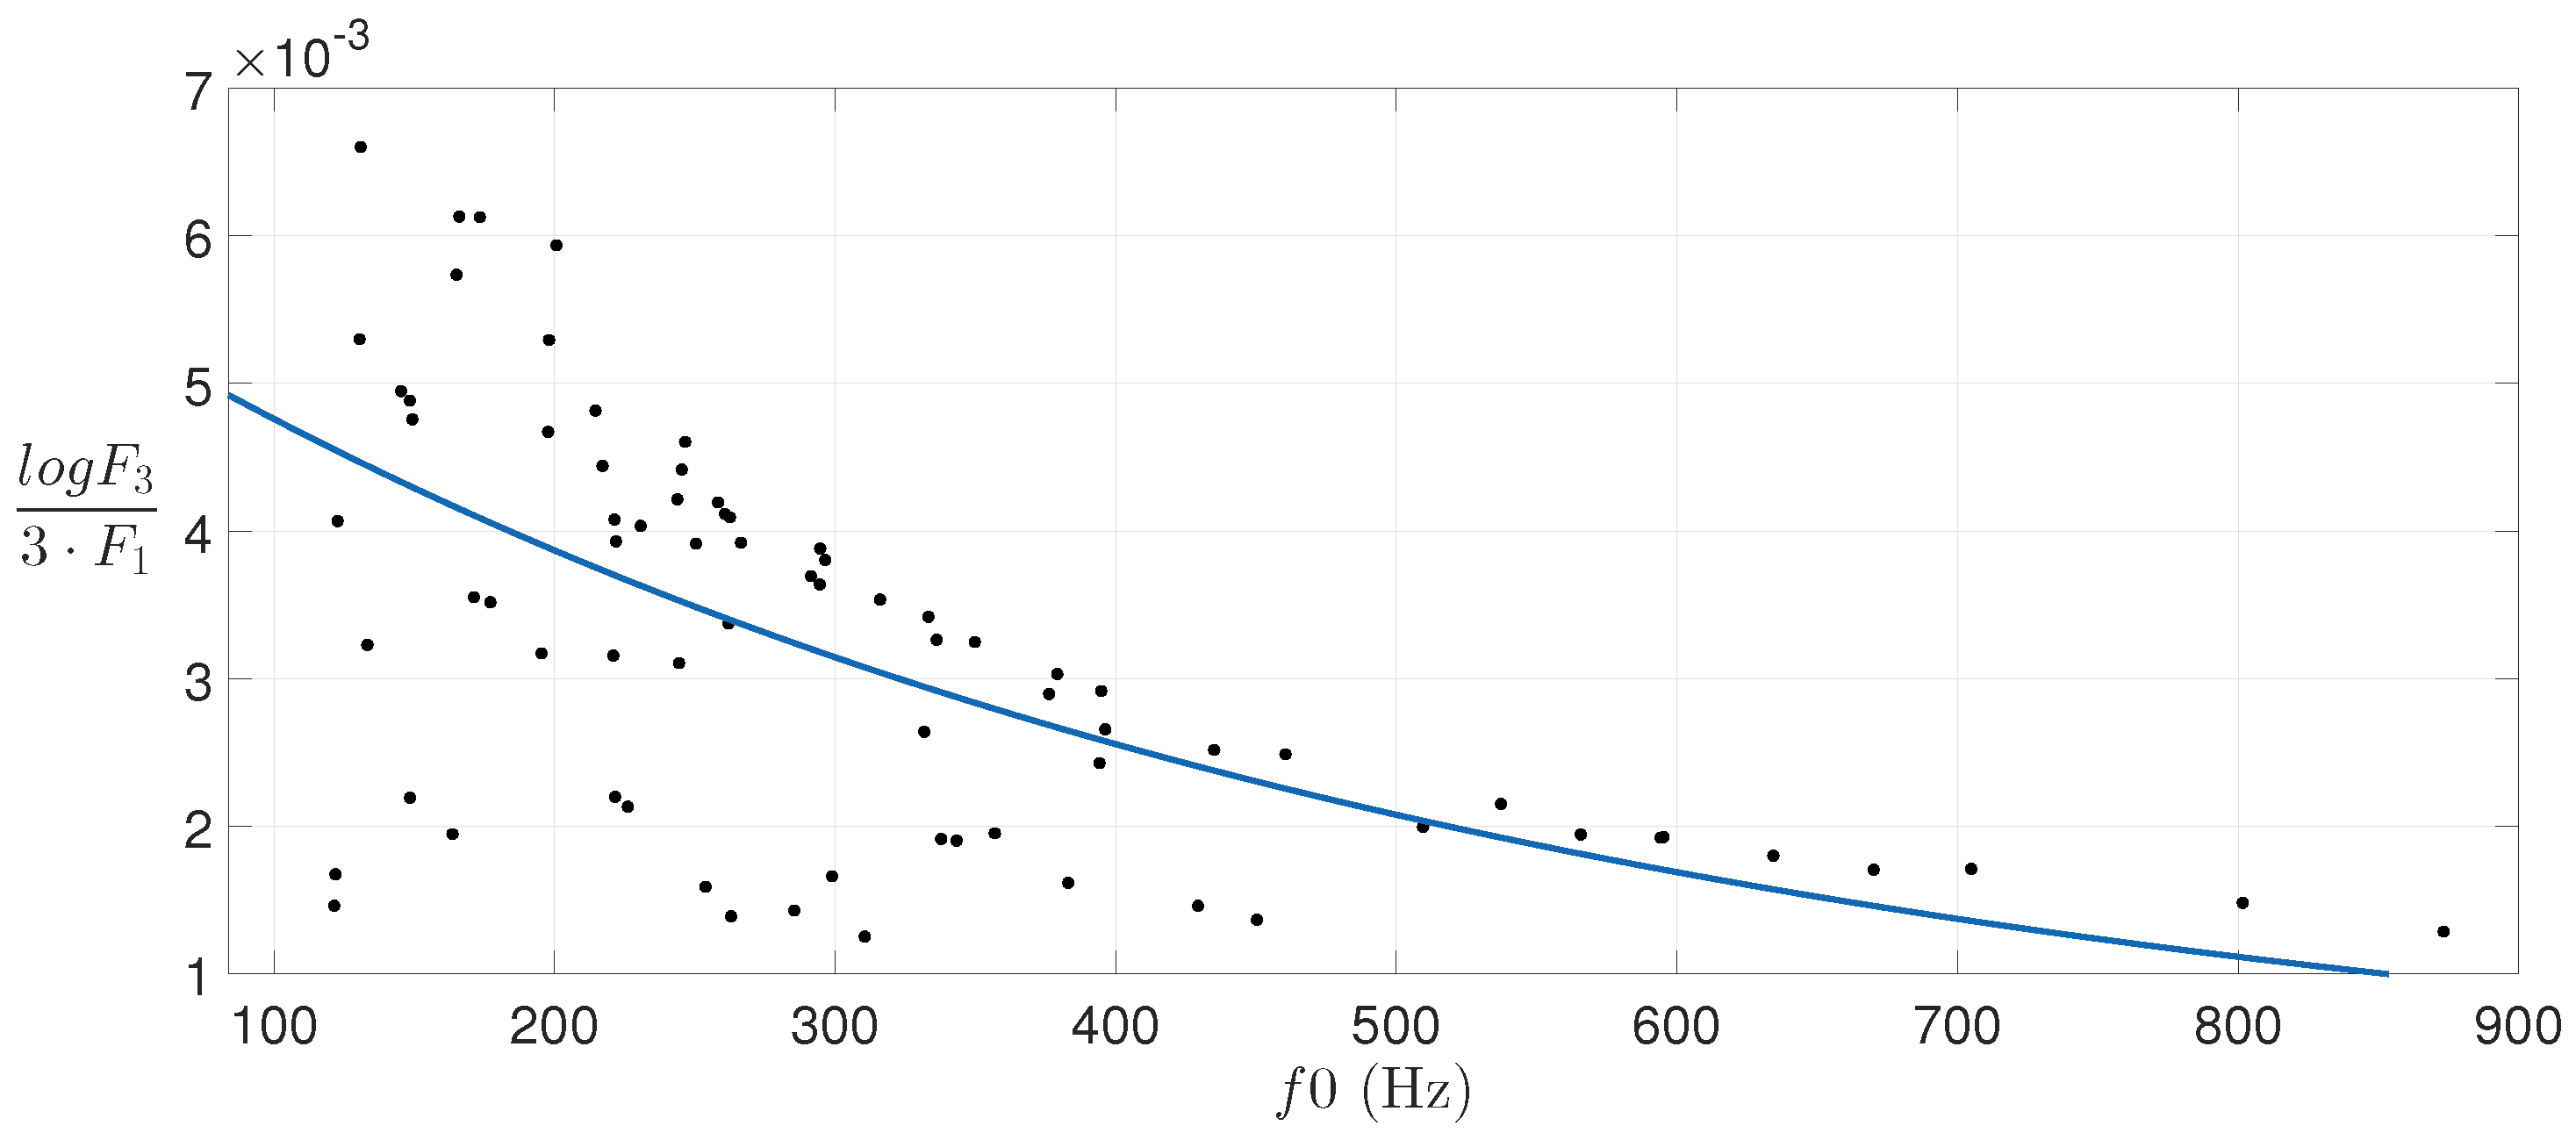
3.2.2. Formants 2 and 3
Unlike the first formant, the shifting of formants
and
do not seem to follow an approximate linear variation with pitch.
Figure 4 and
Figure 5 show that the central frequency of these formants seems to be related to the pitch in a logarithmic way.
Thus, linear least square regression [
28] is used to obtain the parameters corresponding to a first-order exponential relation between these formants and the pitch.
Figure 4 and
Figure 5 also show the estimated curves for the data samples depicted.
As has been extensively demonstrated in the literature [
29], it is very important to maintain the relative distance between
and
in order to keep vowel intelligibility. Therefore, at the sight of the results obtained in
Section 3.2.1, it seems reasonable to find a proportional variation of
along pitch.
In the case of , a smaller variation with pitch is found. However, as in the case of , this shift is relative to , and it is important to maintain this type of relationship in order to preserve some qualitative aspects of the sound.
Again, no meaningful relation between the bandwidths of these formants ( and ) and the pitch was found. As in the case of , modifying and causes timbre variations related to the intensity of the sound, but not related to pitch.
3.3. Formant-Based Model for Spectral Envelope Transformation
At the sight of the relationships unveiled, we propose a model of spectral envelope transformation for pitch shifting based on the displacement of the location of the formants
,
and
, with the pitch. The objective is to attain a pitch shifting of any frequency gap. Since we are considering singing voice, the frequency shift is conveniently expressed in semitones. In an equally-tempered scale, the frequency
of the target pitch can be defined by the following expression:
where
is the original pitch before the shifting and
N is the number of semitones corresponding to the desired frequency shift. The ± symbol refers to increasing or decreasing the pitch. With all this, the frequency displacement
is defined as:
Then, after the analysis described before, the following generic expression is used to modify the parameters
:
where
is the objective value of central frequency of formant
i,
stands for the original value and
is a function dependent on the format number
i.
By means of linear regression, we obtained the following expressions for the model transformation functions:
where the constants
and
E are defined in
Table 2. Note the similar, but different values found for the harmonic and the residual component of the signal, as described in
Section 3.2.
Observe that the values in
Table 2 imply that medium-large frequency displacements are required in order to perceive the effect of the envelope transformation. Generally, our observations indicated that increasing or decreasing the pitch by a fifth is enough to perceive the changes. Smaller shifts do not produce significant changes in the spectral envelope, which made the difference between our model and a conventional pitch shifting algorithm unnoticeable/hardly noticeable.
Finally, note that a change of
produces the same effect for lower and higher pitches since the relationship between formants is already defined by linear or logarithmic expressions (
13)–(
15). However, it must be kept in mind that there is a huge difference in the perceptual influence of this transformations in lower or higher frequencies due to the relationship between
and the perceived note. Higher frequencies need larger changes of
for changing a note (see Equation (
10)).
4. Complete Pitch Shifting Scheme
The first step to perform pitch shifting is the determination of the pitch of the input signal and reference time instants, called pitch marks [
7]. These pitch marks are located at the instant of maximum amplitude of glottal pulses at a pitch-synchronous rate. The correct determination of pitch marks is essential to achieve high quality sound modification since they become the centers of the segmentation windows in PSOLA [
7].
The precise localization of pitch marks is not a trivial problem, and it has been addressed from different perspectives, like [
30,
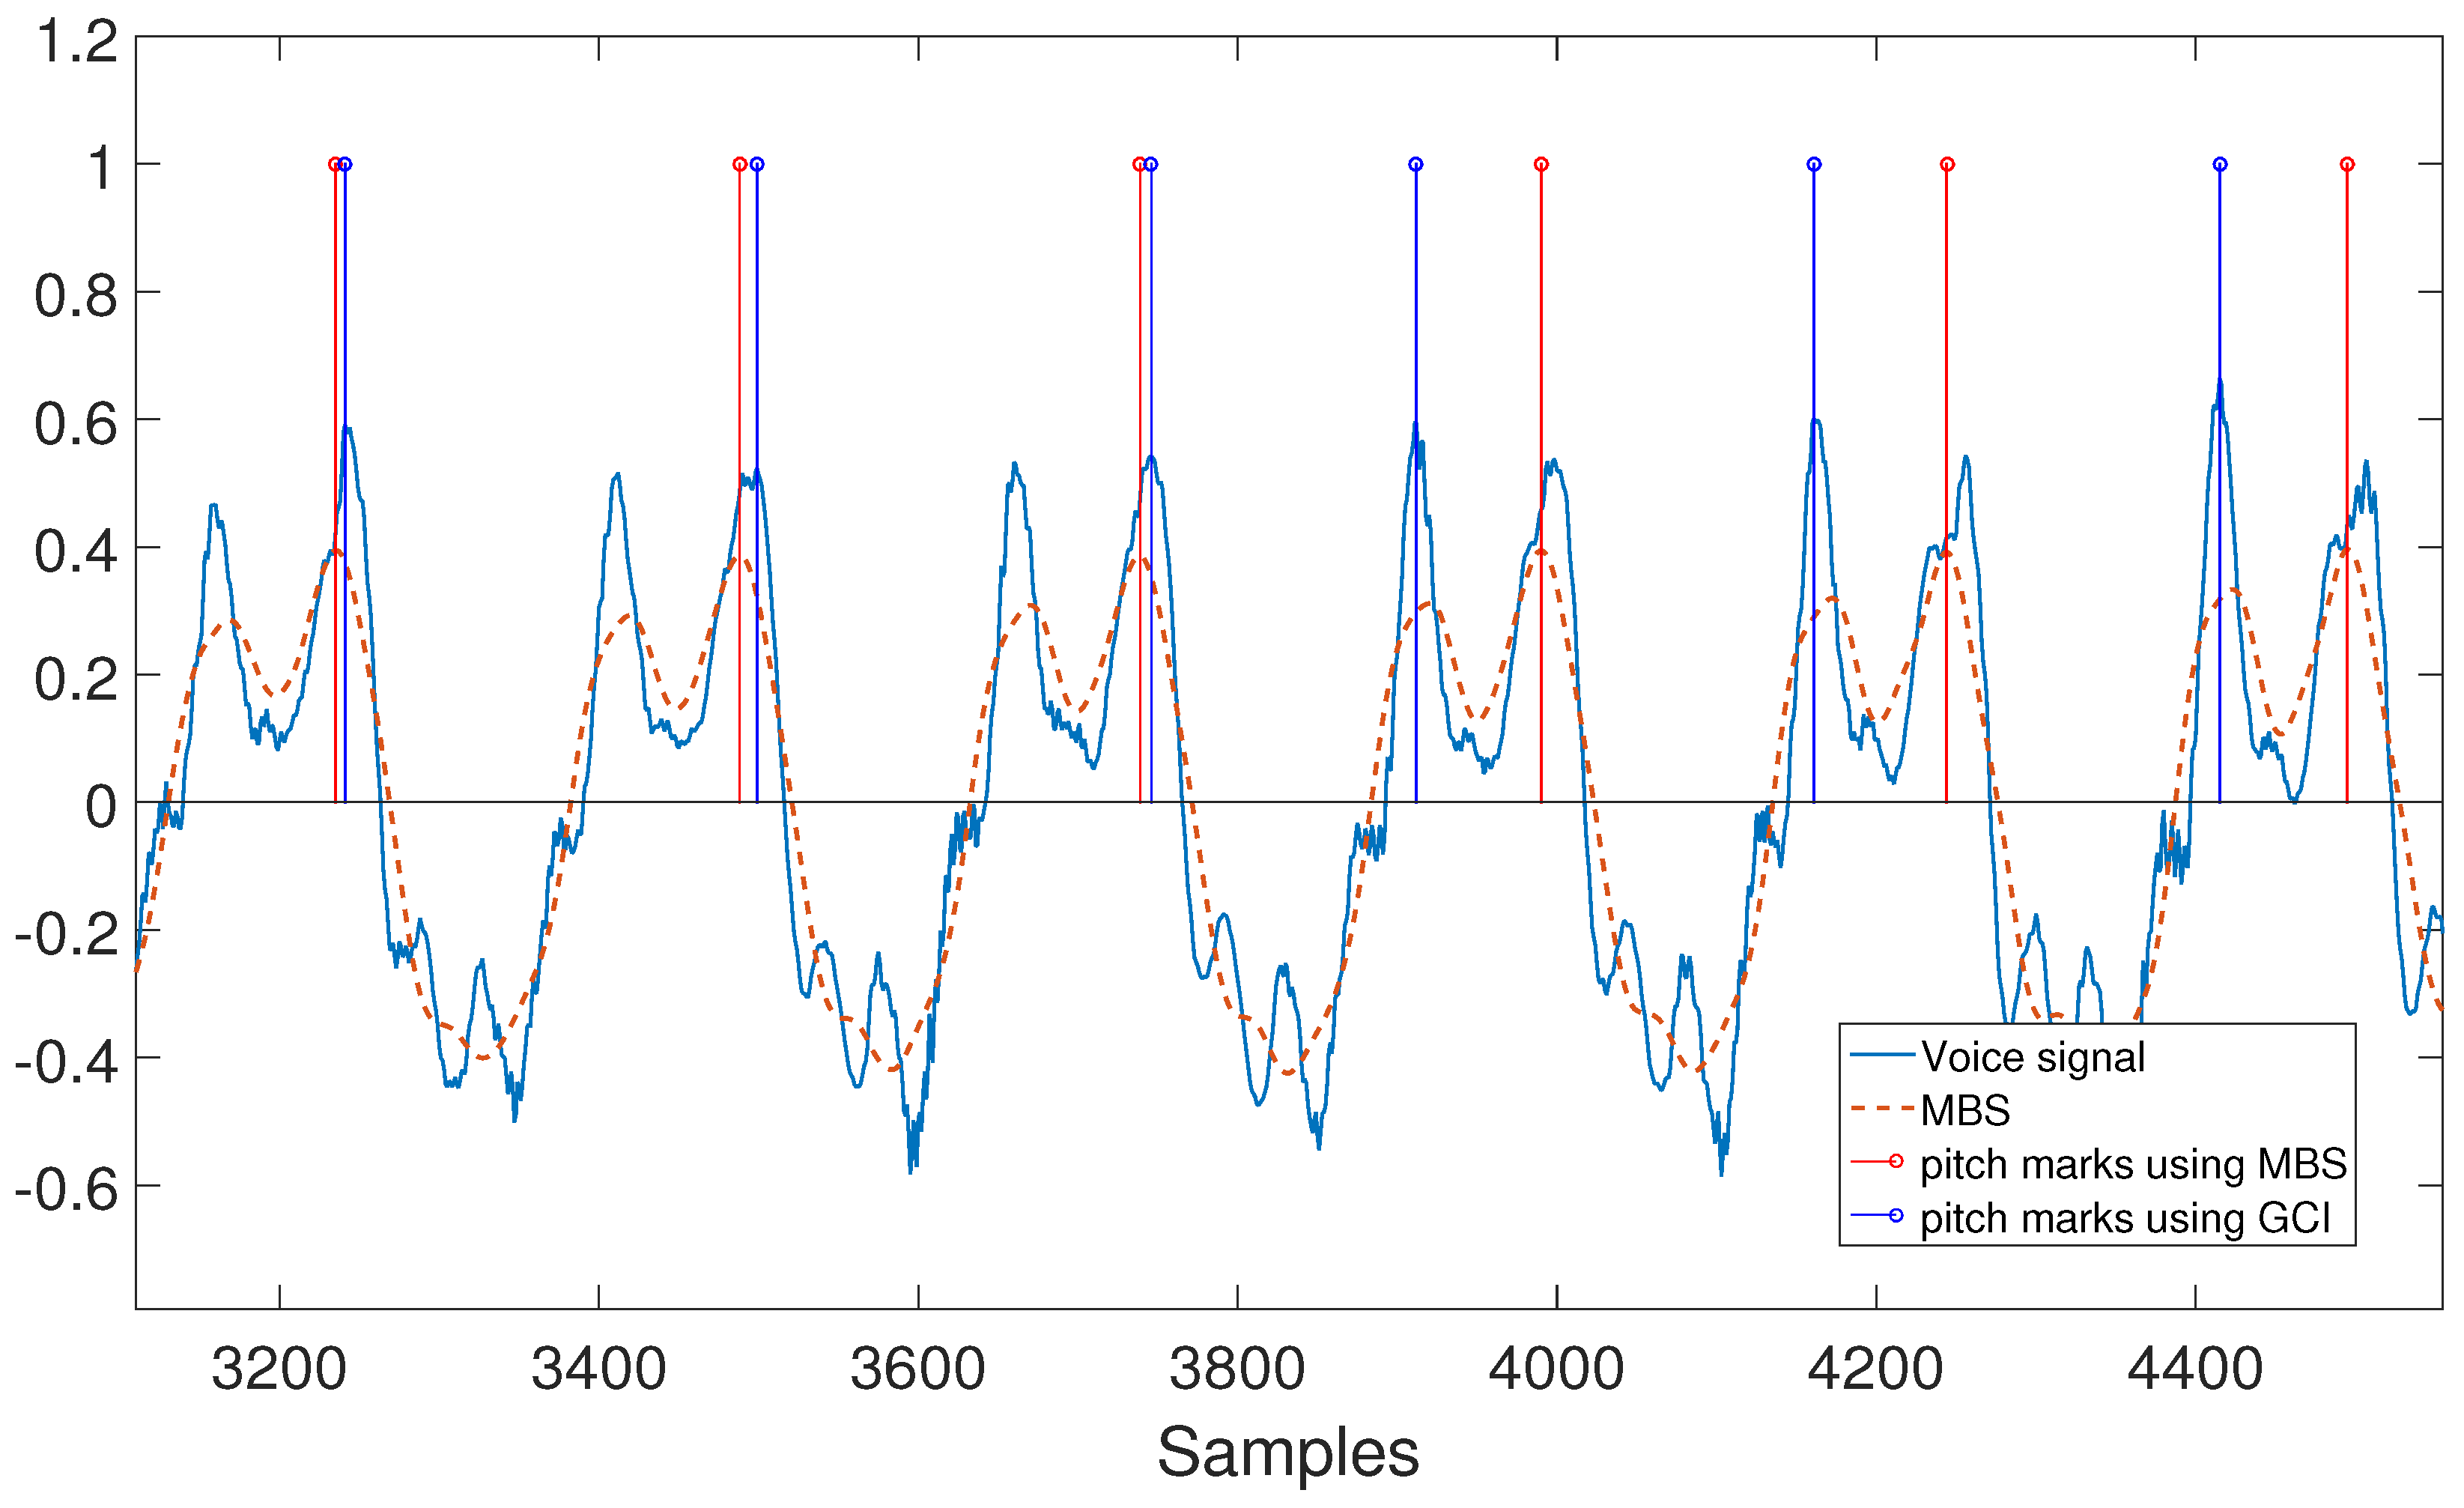
31]. The main difficulties appear with signals with rich harmonic content in which the largest peak may oscillate in consecutive periods leading to incorrect positioning of the pitch marks. As a consequence, the signal will be re-synthesized with some audible artifacts. Moreover, an extended delay between the pitch mark locations and the true pitch period will cause low frequency modulation of the signal amplitude due to the displacement of the segmentation window. These observations make us pay special attention to the localization of pitch marks in our pitch shifting scheme.
Our complete pitch shifting scheme can be divided into two steps: a feature extraction stage and the actual pitch shifting stage. The complete scheme is illustrated in
Figure 6, and the details are given next. The entire method has been named formant-driven pitch shifting (FDPS).
4.1. Feature Extraction Stage
The first step is the extraction of the and the spectral envelope, according to the model previously described. The is used not only to determine the frequency displacement, but also to guide the process of the localization of pitch marks.
The well-known YIN algorithm [
32] is used as the pitch estimator, to extract
at the frame level. This algorithm has proven to be efficient for pitch extraction in different transcription systems [
33,
34].
With the
extracted, it is possible to determine the position of the pitch marks. However, some problems arise related to mis-displacements of the pitch mark locations identified, which lower the quality of the transformation. This issue is addressed by using the mean-based signal (MBS) method, which has proven to be an efficient approach for PSOLA [
35] in terms of removing discontinuities. The MBS is defined by the following expression:
where
is the voice signal,
is a Blackman windowing function of length
samples and
N is a value between 1.5- and two-times the average pitch period
. Then, the maxima in MBS in each window are used to locate the pitch marks.
On the other hand, glottal closure instants (GCIs) are related to instants of high energy in the voice signal, and they are also a good approach to locate the pitch marks in continuous speech; as a matter of fact, some authors [
36] carried out several objective measures to support the usage of CGI in PSOLA transformations. However, in our context, it is reasonable to think that the main focus in this evaluation should be the psychoacoustic perception, which is a subjective feature.
Figure 7 shows the result of the utilization of both MBS and GCI approaches to locate pitch marks. GCI is a more precise method locating the higher energy instants, but causes abrupt shifts between consecutive marks (third and fourth blue marks in the figure). This problem is diminished by detecting the global peaks of the MBS in every interval. In this way, the difference between pitch marks is smoothed, preventing errors in the later re-synthesis using PSOLA. Recall that our final objective is to perform pitch shifting of sustained sung notes. Then, avoiding abrupt shifts between consecutive pitch marks is of main importance. This is a main reason why we use MBS instead of GCI to locate the pitch marks.
Moreover, an additional post-processing stage aimed at correcting pitch mark location errors is included. The objective is to eliminate false alarms by using a thresholding operation. To this end, the minimum distance allowed between two consecutive pitch marks is defined as:
where
is the sampling rate and
is the upper limit of the YIN algorithm, which is 900 Hz in our case.
If the distance between two pitch marks is smaller than the threshold, the closest one to the adjacent mark is eliminated. In case of similar distances to the adjacent marks, a new mark is located halfway between them, and both of them are removed.
Finally, in this feature extraction stage, the spectral envelope
of the original sound is estimated by making use of the model described in
Section 2. Note that FDPS performs the spectral transformation by shifting the central frequency of the formants, so only the resonator coefficients are needed in order to perform the transformation, as will be described next.
4.2. Pitch Shifting Stage
This stage performs the actual pitch shifting process with spectral envelope transformation; the pitch of an audio waveform will be increased or decreased by using the PSOLA technique, and also, the spectral envelope will be modified by means of formant shifting and filtering.
The pitch-shifting factor,
β (shown in
Figure 6), is used to define the strength of the shift of the pitch. This parameter can be larger than one (transposing up) or smaller than one (transposing down), and it is related to the number of semitones shifted through the following expression:
The PSOLA [
9] algorithm is composed of two steps: in the first step, the input waveform is conveniently segmented, and in the second one, a time-stretched version of the original signal is synthesized by overlapping and adding the time segments extracted before [
37]. The complete process is detailed below:
Once the and the pitch marks are determined, the algorithm extracts a signal segment at every pitch mark by using a Hanning window of length , with the pitch period at the current pitch mark location.
Overlap and add the selected segment at the specified instant
.
is used to center the next synthesis segment, which is obtained according to:
where
is the new estimated period of the signal and
β is the pitch shifting factor or skip, a multiple of the number of half steps
N expressed as shown in Equation (
18) [
37].
At this point, a pitch-shifted version of the original signal has been generated by a formant preservation technique. However, the spectral envelope changes as pitch varies [
10], so an additional step is performed in order to modify the spectral envelope of the synthesized signal to achieve a more natural result.
The first three formants (
,
and
) are modified according to the expressions (
13)–(
15), resulting in a new spectral envelope
. The resulting resonator coefficients are stored and combined with the original ones, generating the filter response in charge of modeling the shifting of the formants. Finally, the pitch-shifted signal is inverse-filtered by
and filtered by
.
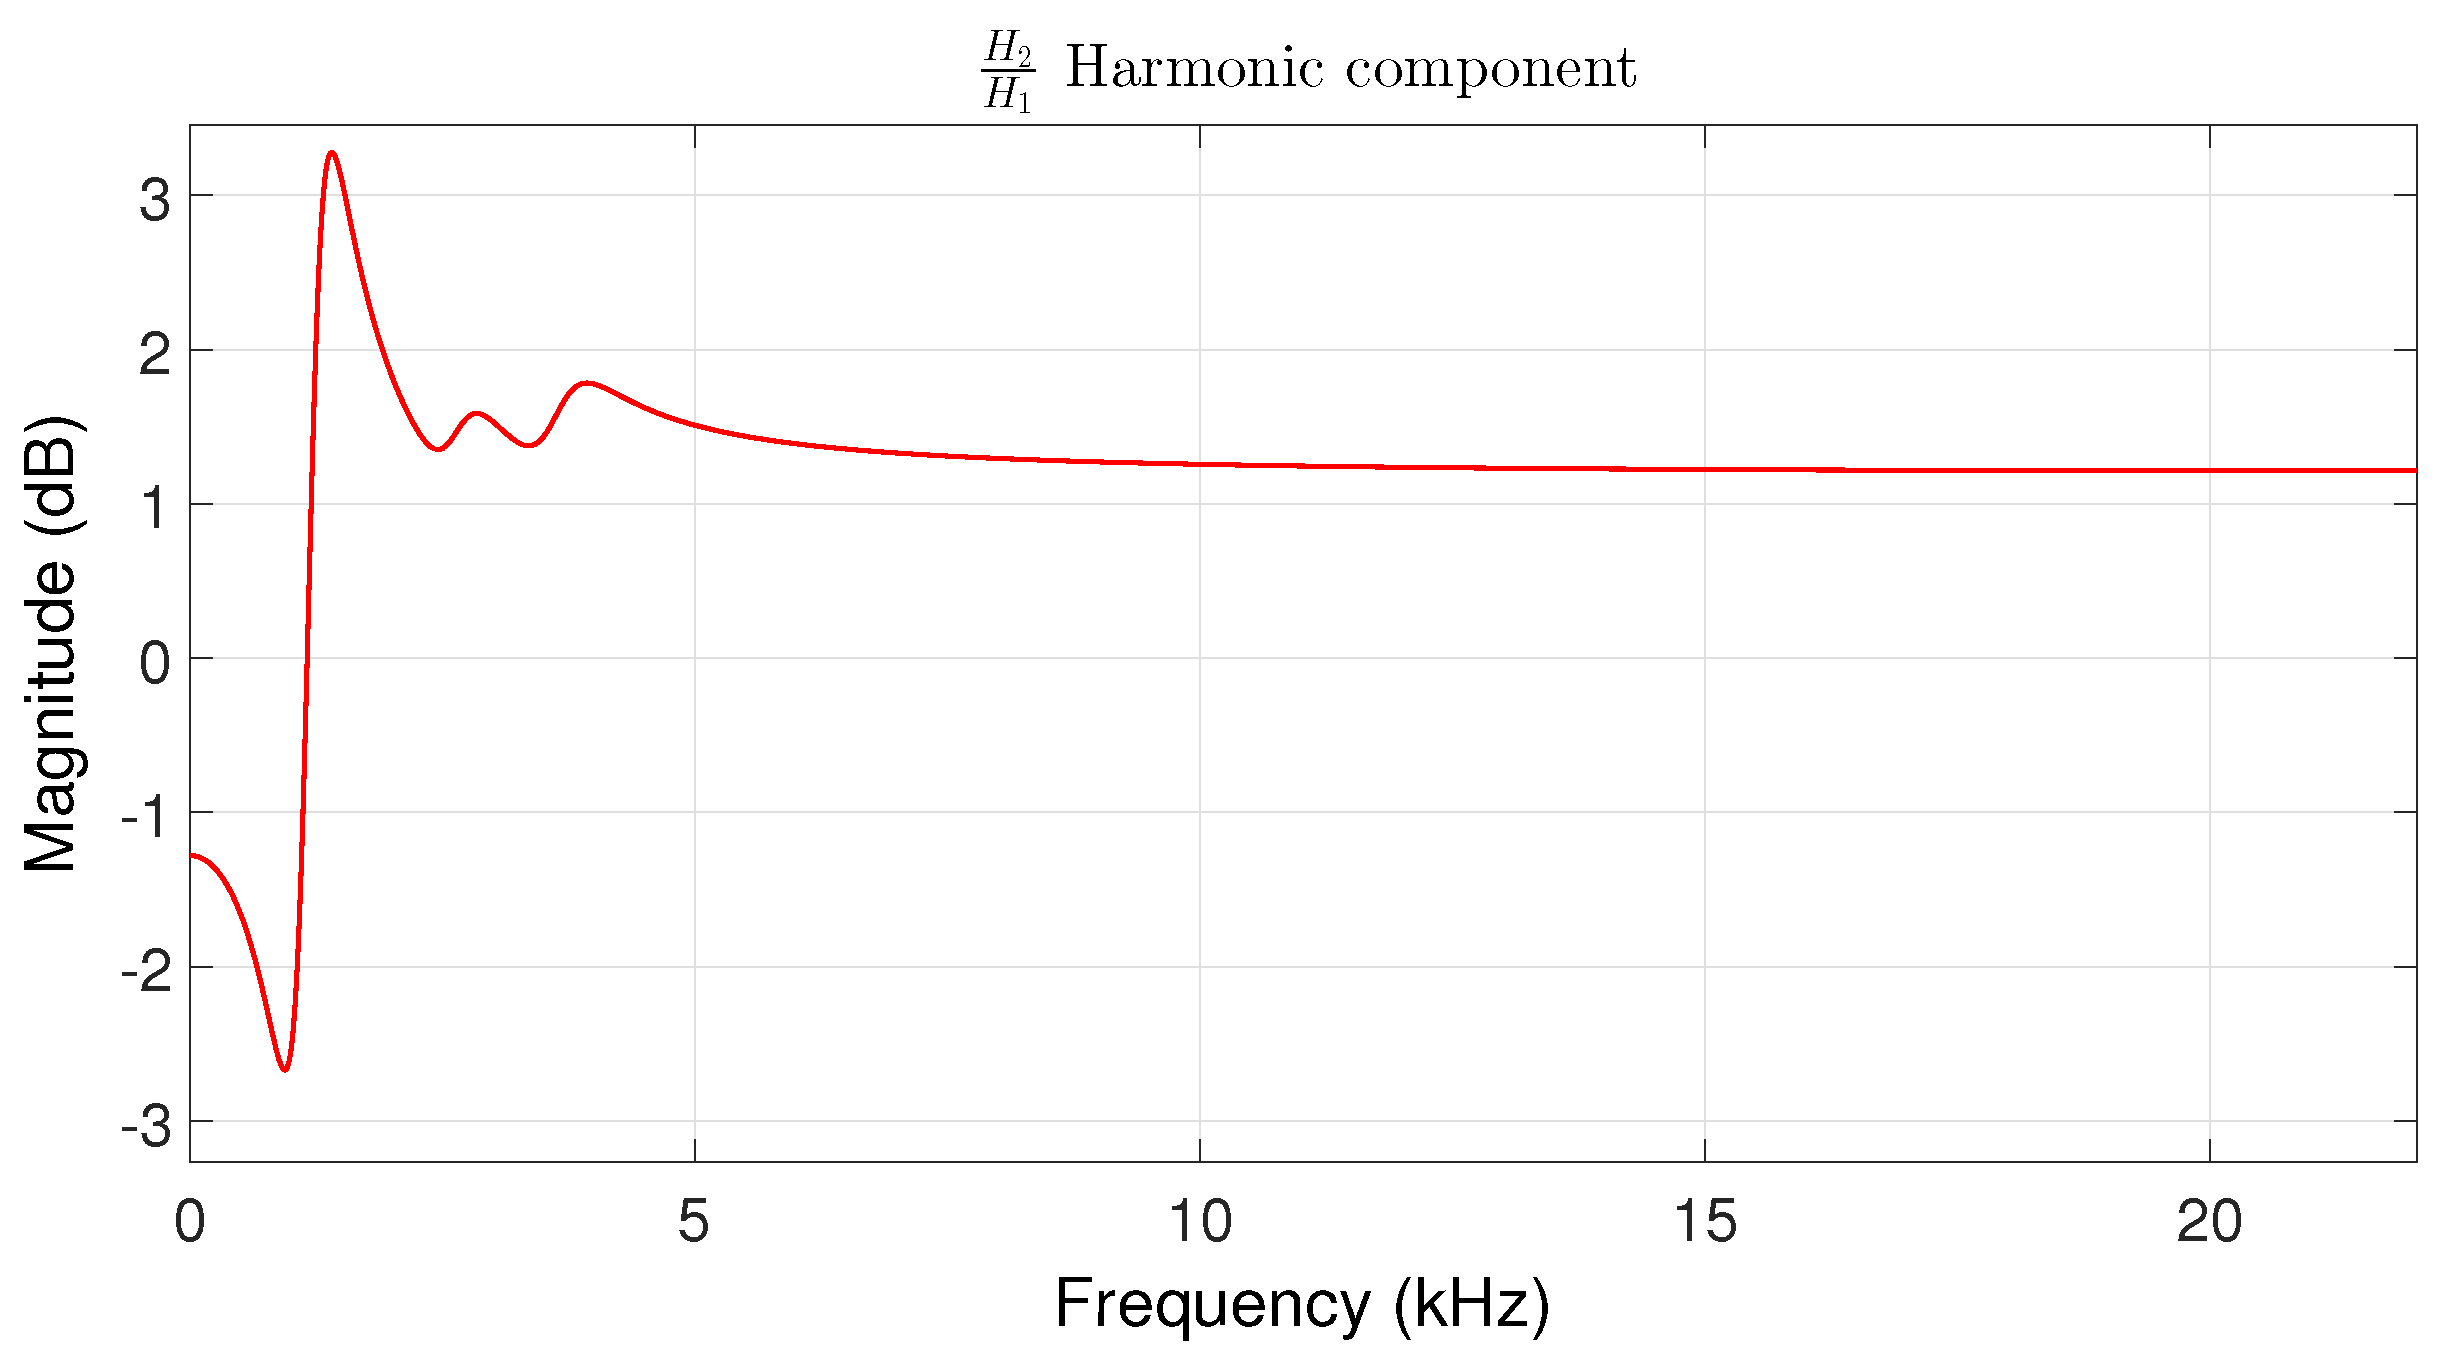
Figure 8 shows an example of the resulting filter response of the
filter for a
note (172.6 Hz) to be pitch-shifted a fifth above (C3 at 261.63 Hz), sung by a male amateur singer. The filter corresponds to shifting the formants of the harmonic component in the range of [0,5000] Hz, with a sampling rate of 44,100 Hz. As can be observed, the first formant is the most strongly affected in terms of correction (note the valley-peak sequence with a difference of almost 6 dB), whereas Formants 2 and 3 are just slightly modified.
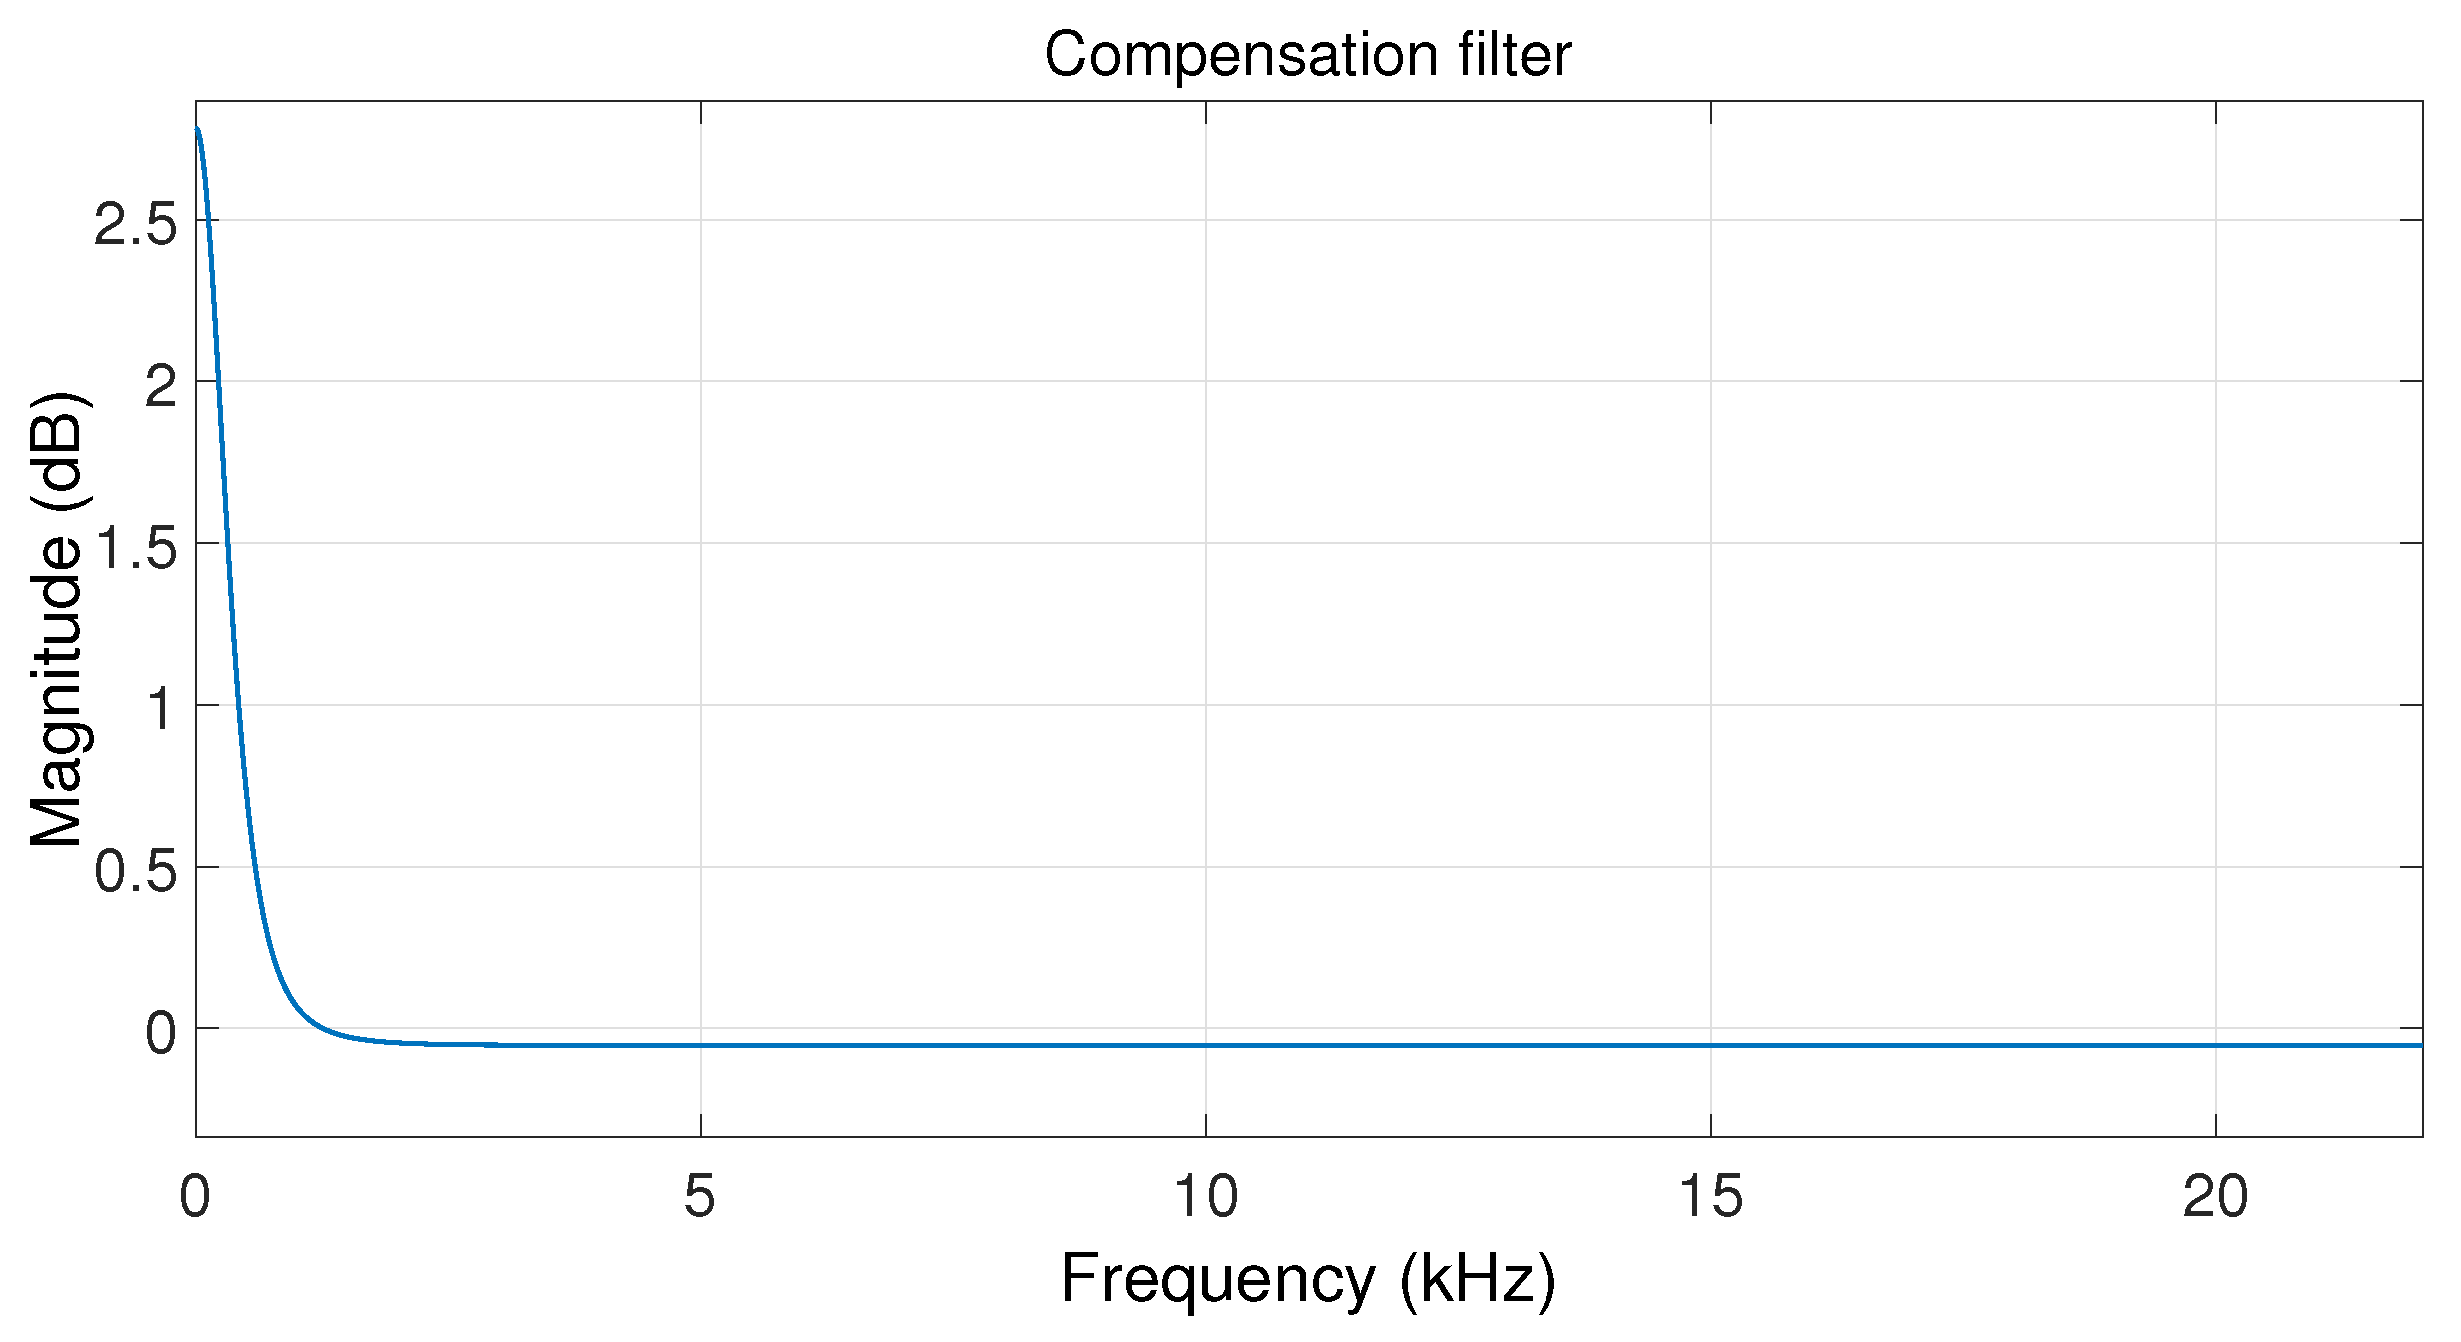
Due to our filtering stage and the way in which the envelopes are modeled, the low frequency band ([0,550] Hz approximately) is attenuated in the case of shifting to a higher pitch, so a compensation filter has been added. In
Figure 9, the magnitude response of this filter when shifting to a higher pitch is shown, making up for the attenuation of the previous
filter. This compensation stage is a pre-defined second-order low shelf filter with a gain of 3 dB and a cut-off frequency at 500 Hz. In the case of shifting to a lower pitch, the result is exactly the inverse: the low frequency band needs to be attenuated; this is accomplished applying the inverse of the compensation filter defined as described above. These two filters, in our implementation, add a maximum delay of 60 samples.
Note that the whole process described is carried out for the harmonic and residual components of the audio signal separately due to the fact that the resulting filters may be different, according to the parameters of the transformation model shown in
Table 2.
5. Evaluation Methodology
This section presents the evaluation methodology, which ultimately consists of two different evaluation processes based on objective and subjective measures. However, note that the actual target of the method devised is related to perception, which implies, in our opinion, that priority should be given to the results of the subjective evaluation performed by means of an open survey.
In this section, the measurements employed for the objective evaluation of the system will be described (
Section 5.1); then, the subjective evaluation methodology followed will be shown in
Section 5.2.
The results of the evaluation will be presented in
Section 6, including comparisons against a modern commercial software tool and a widely-used and well-known pitch shifting scheme. The dataset that will be used for the evaluation was described previously in
Section 3.1.
5.1. Objective Evaluation Methodology
In order to assess the naturalness of the pitch-shifted audio samples generated, some objective measures were defined. The measures were aimed at assessing the similarity between the notes obtained after a pitch shifting process (of an octave) and the corresponding notes naturally sung in the same target pitch. The similarity measures were obtained for three pitch shifting schemes: the Flex Pitch plugin of Logic Pro X, the PSOLA algorithm and our system. We call our measure normalized similarity (NS), and it is defined as:
which is a normalized inverse of the mean absolute difference of two variables
X and
Y, where
X and
Y are the normalized magnitudes of the original and transformed samples, respectively, of the different parameters to measure, namely: the magnitude and phase of spectral peaks and the central frequency and bandwidth of formants. In our case, the variables are normalized by the maximum of their spectrum. Specifically, the parameters considered to be evaluated by using the NS statistic are:
Magnitude and phase of the 10 first spectral peaks.
Central frequency of the three first formants (, and ).
Bandwidth of the three first formants (, and ).
Observe that NS (Equation (
20)) ranges between zero and one. The lower the value of NS, the lower the similarity between the variables compared.
Recall that the ultimate purpose of the evaluation is to provide an objective comparison regarding the goodness of the spectral envelope transformation. Note that all of the spectral envelopes of the original samples and their transformed versions were estimated by using the optimization method detailed in
Section 2.2.
5.2. Subjective Evaluation Methodology
A subjective comparison between our method, PSOLA and the Flex Pitch plugin of Logic Pro X [
38] has been carried out. Each selected note was pitch shifted a fifth or an octave above or below the original pitch by using the three different methods mentioned. The system performance was subjectively evaluated by means of a survey open to volunteers on our website (
https://encuestas.uma.es/73985/lang-en). The participants listened to the different transformations randomly ordered, and they were asked to evaluate the quality of each of them from zero to 100, regarding naturalness, vowel intelligibility and breathiness. The scoring scheme was made based on a continuous quality scale (CQS), following the Recommendation ITU-R BS.1534-3 [
39], which divides the range into five equal intervals with the following adjectives, from worst to best: bad, poor, fair, good and excellent (see
Figure 10). The participants were inquired about the listening conditions and their musical training knowledge.
The samples were grouped into two blocks. The first block contained five isolated sung notes and their corresponding three transformations per note. The second block contained three melodies consisting of four notes placed together and their transformations; this setup was prepared so that the participants were able to listen to lengthier samples of transformed musical notes, making it easier to notice the differences between them.
6. Results and Discussion
In this section, the results of the evaluation process will be presented. First, the results of the objective evaluation will be shown, then the results of the subjective evaluation will be presented. A discussion will accompany the data.
6.1. Objective Evaluation
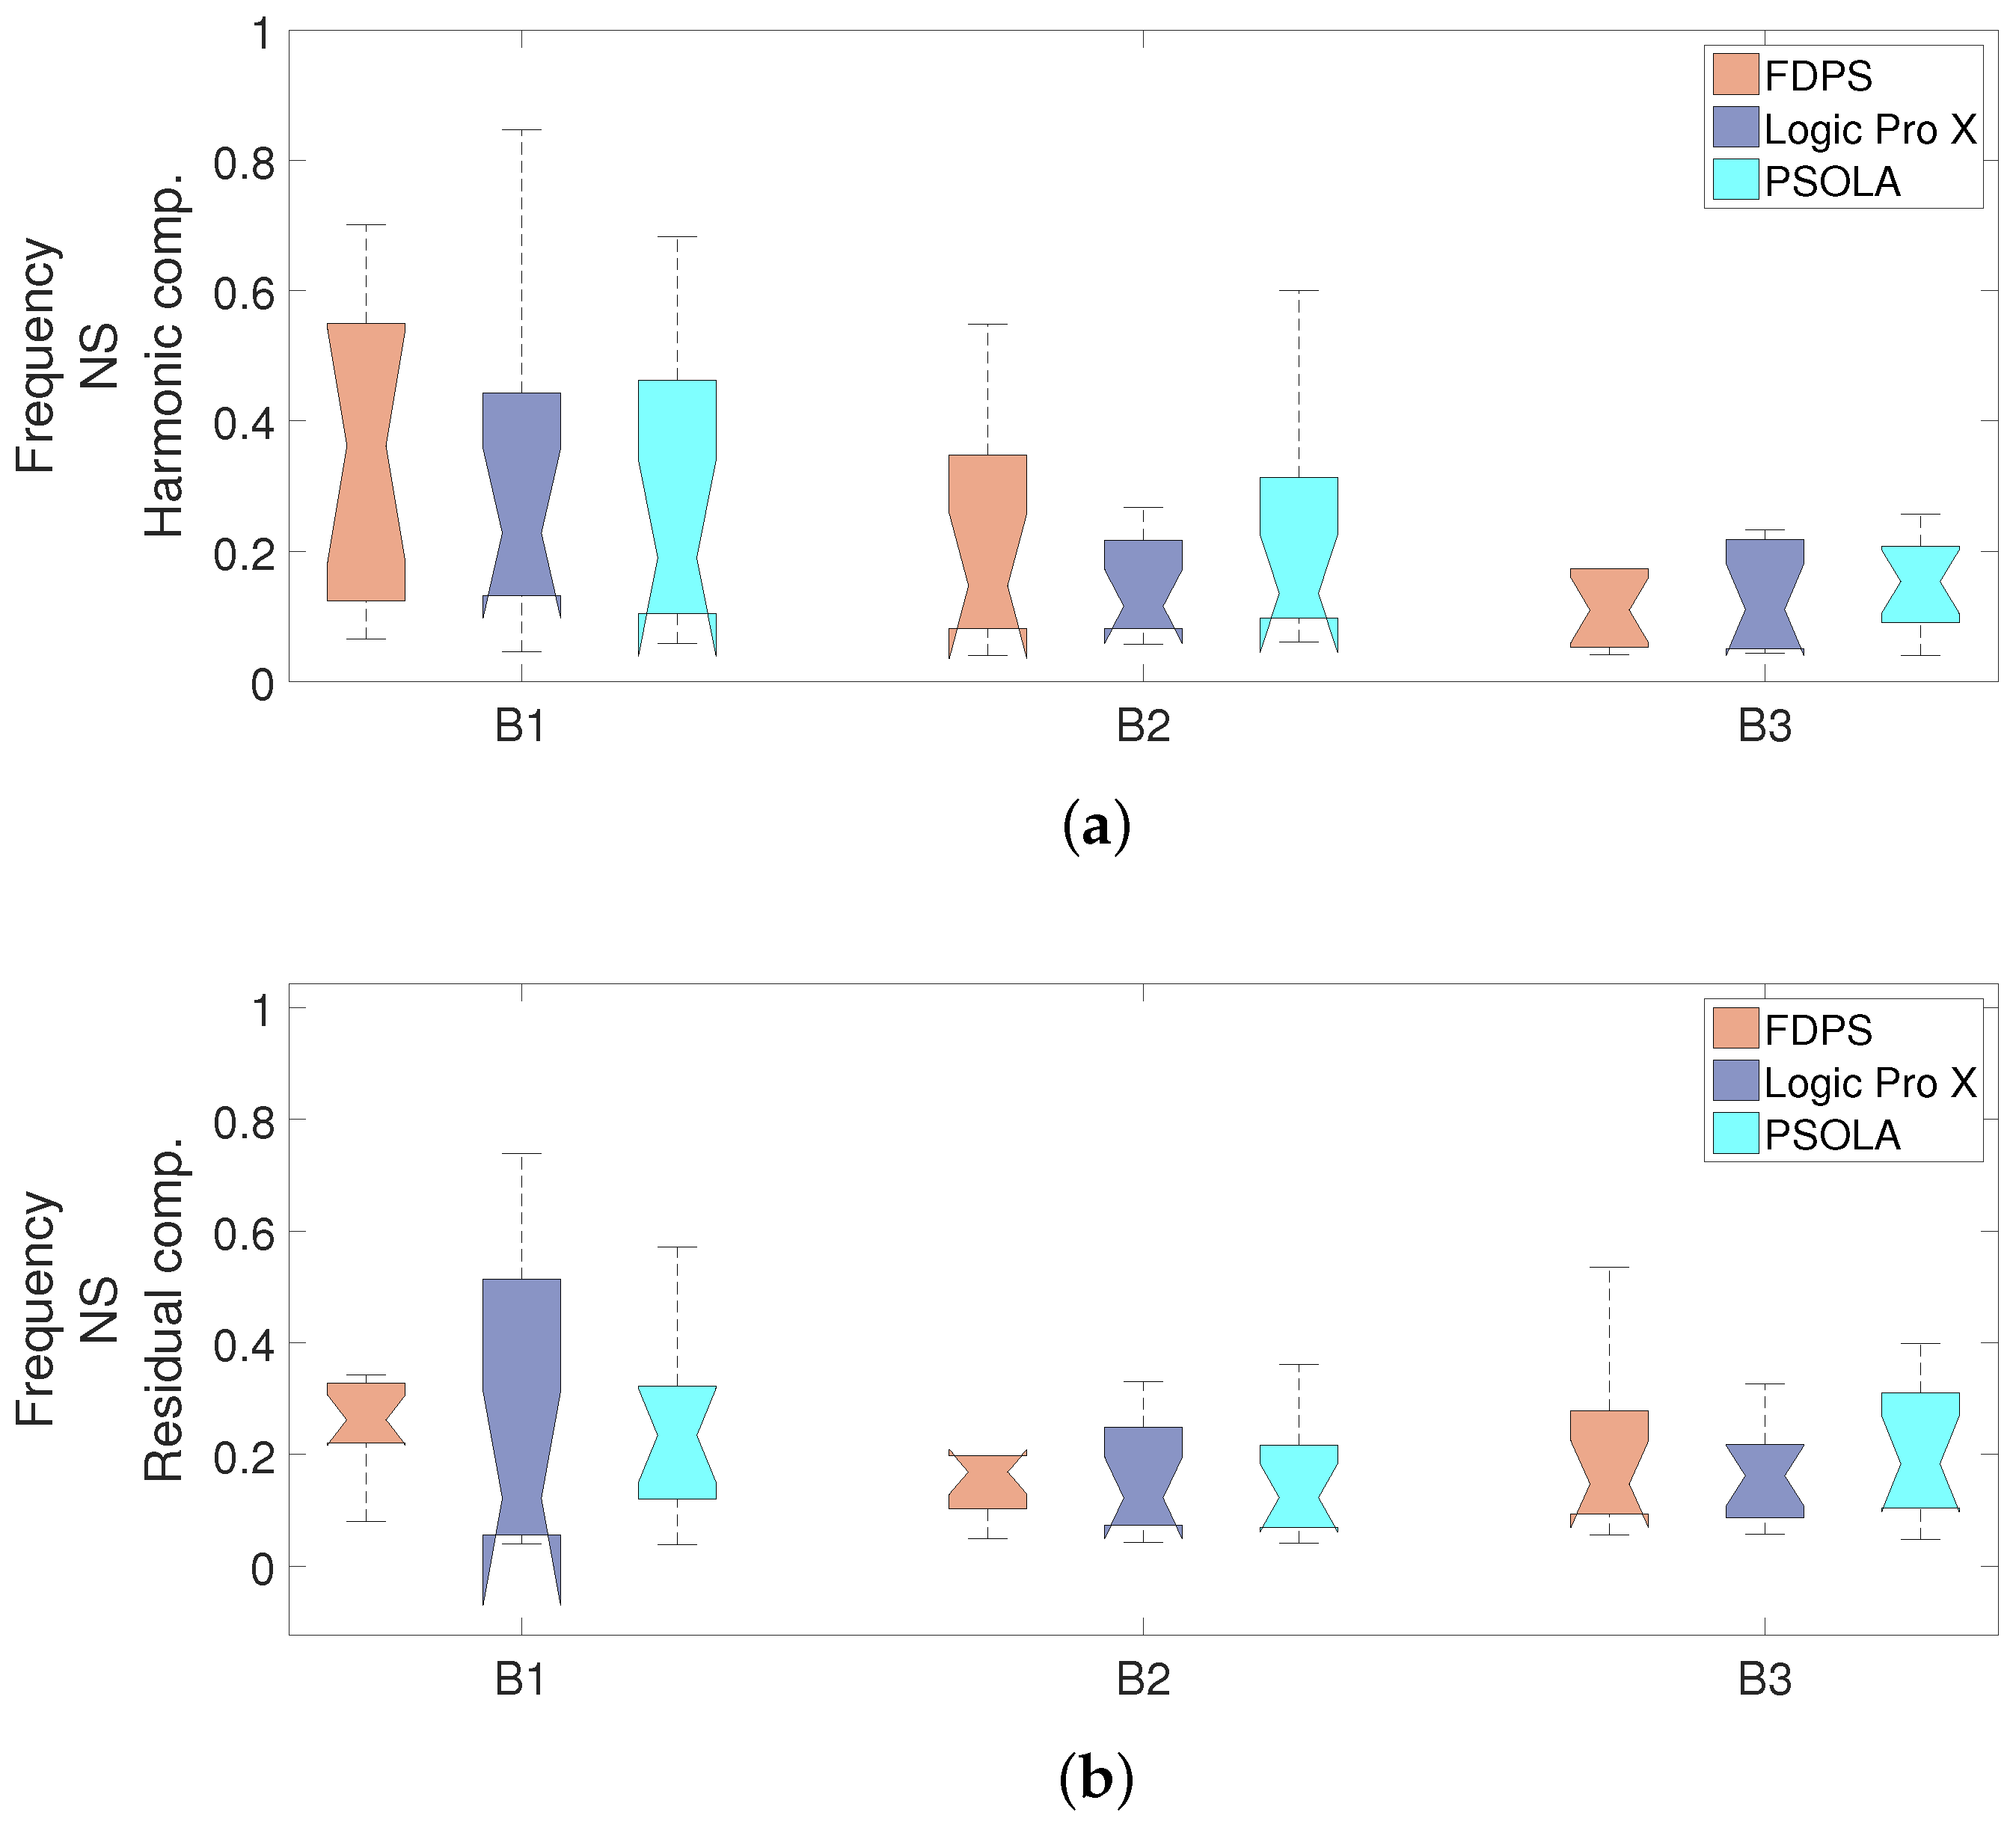
The objective evaluation provided satisfactory results. The NS measure described in the previous section allowed comparing the results of our scheme with Logic Pro X and PSOLA, quantifying the similarity between the spectral envelopes of the transformed samples and the corresponding original one, which defined the target of the transformation.
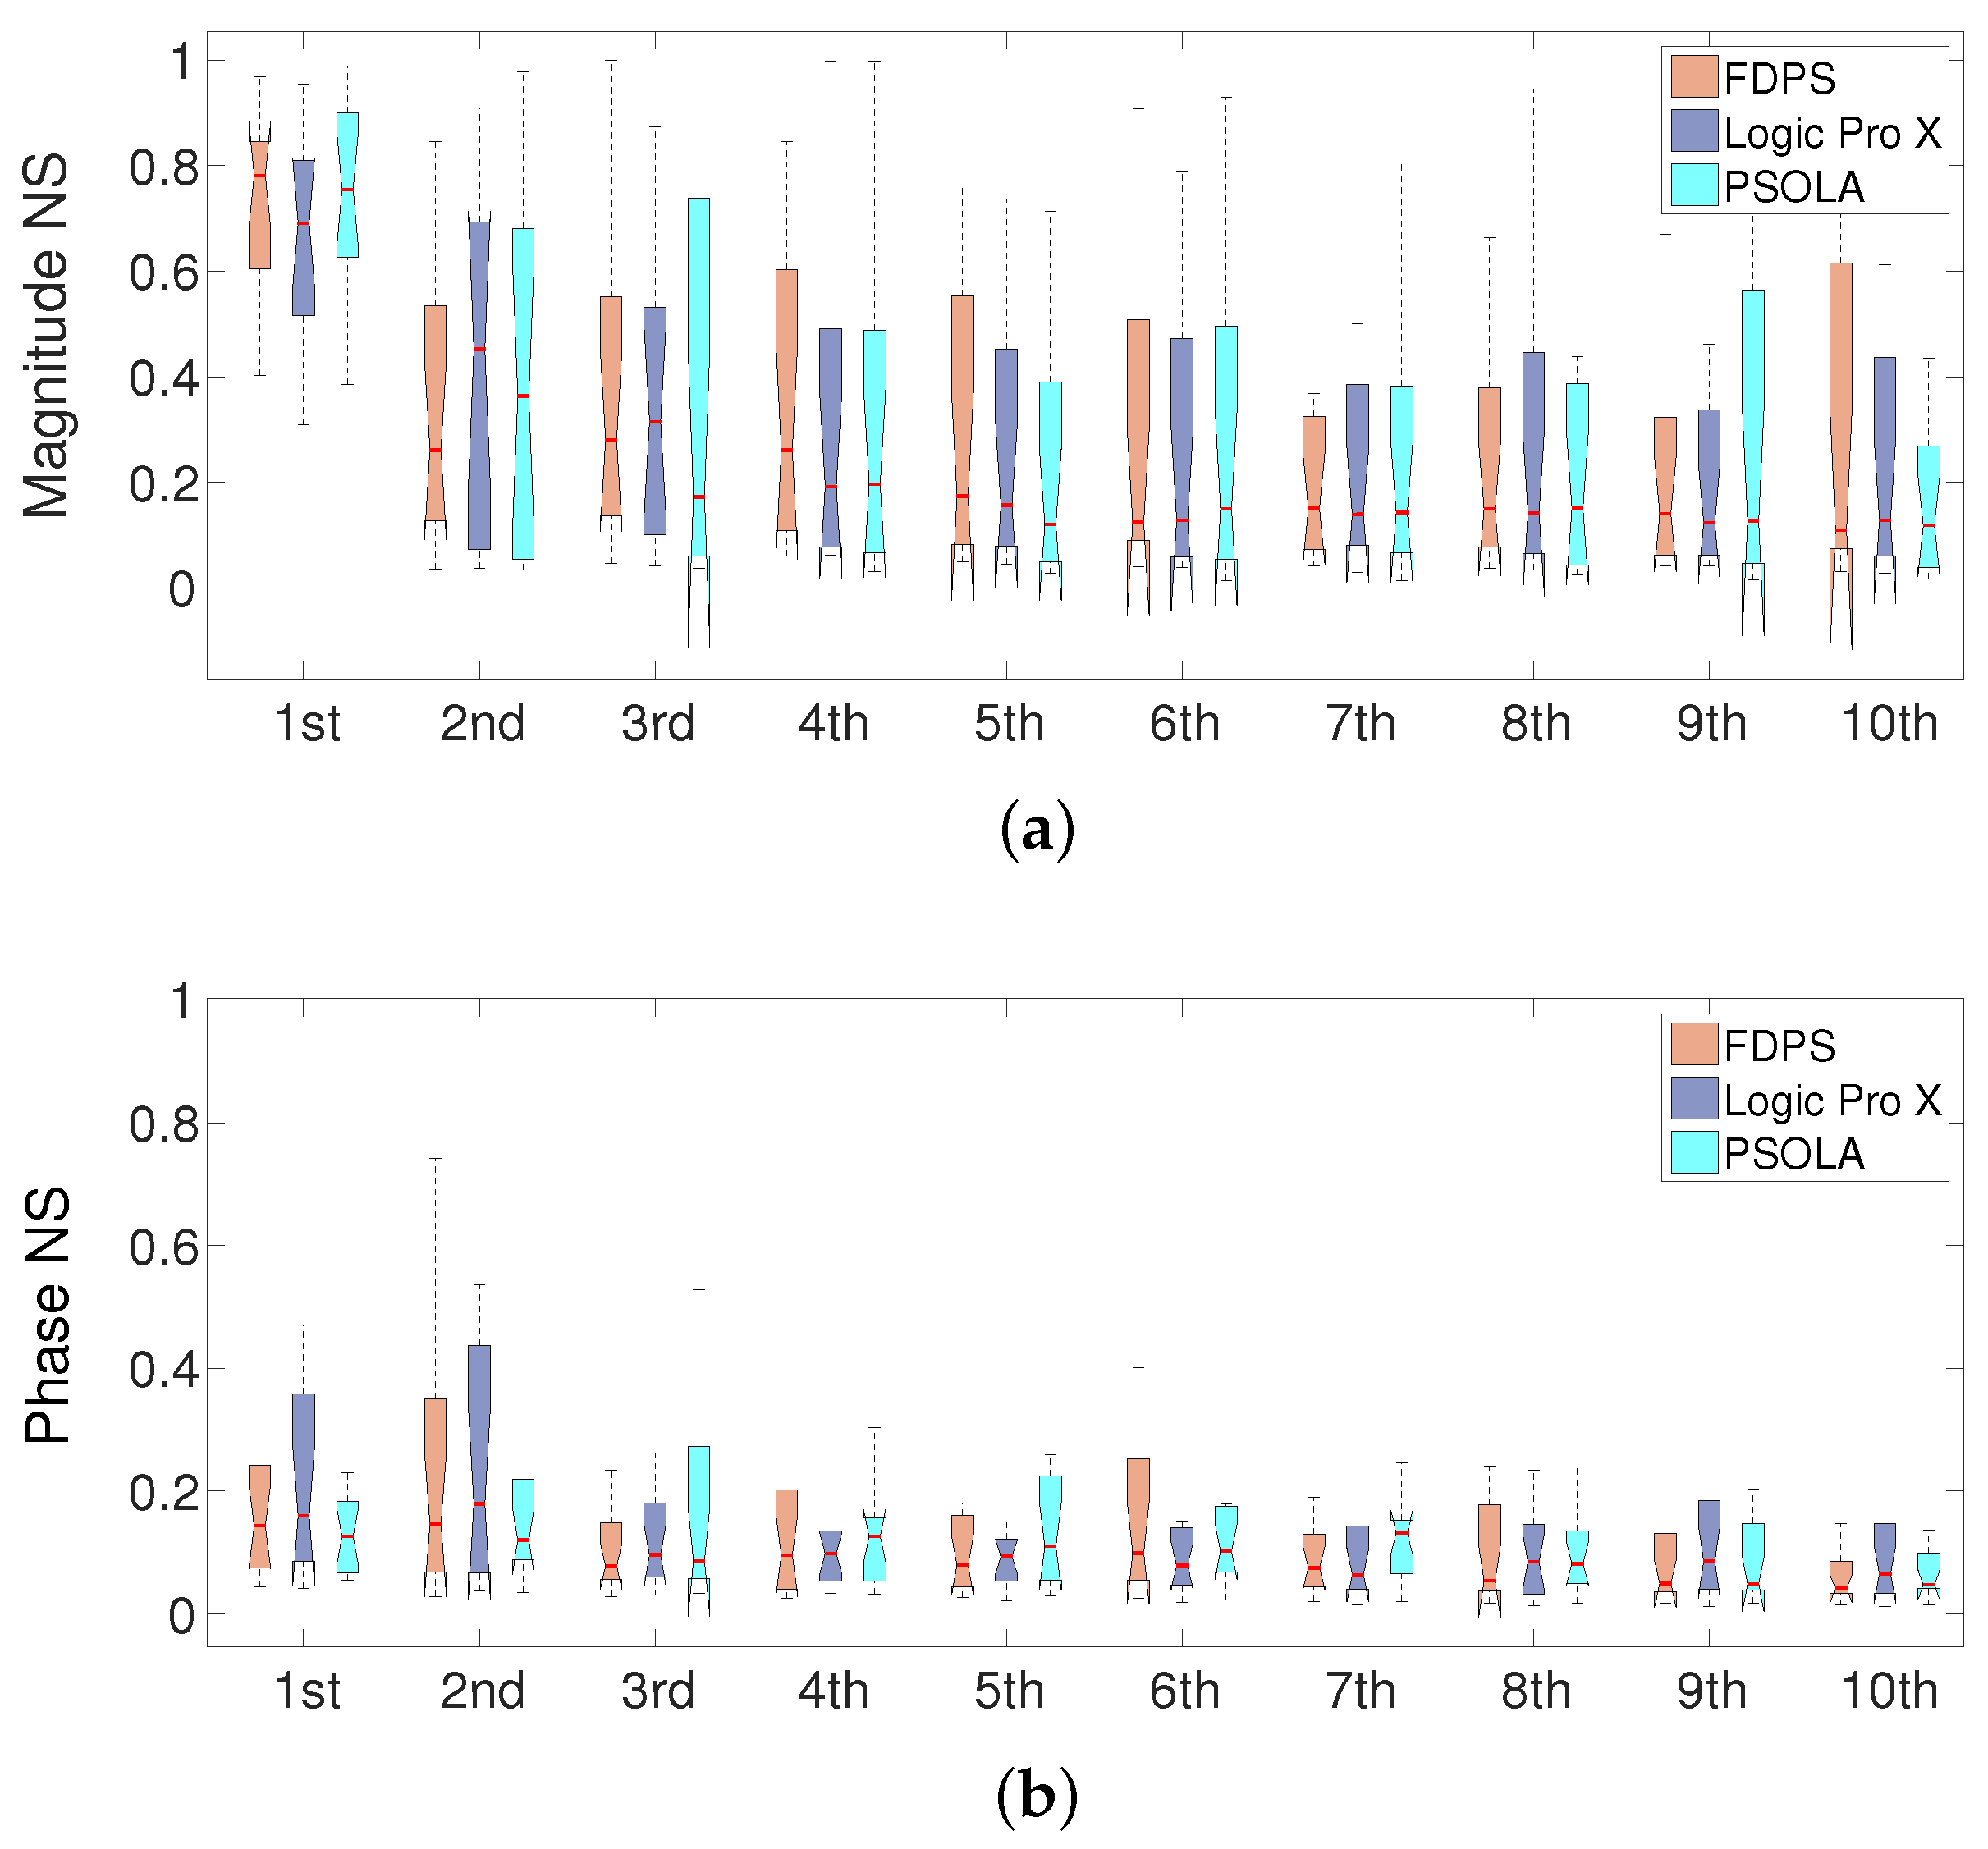
Figure 11,
Figure 12 and
Figure 13 show 95% confidence intervals with a notch at the median of each measure.
The first parameters to be measured were the magnitude and phase of the harmonic peaks.
Figure 11 shows the NS of the magnitude and phase of the first 10 harmonic peaks with respect to the envelope target. In general, the NS of the magnitude of the peaks was mostly similar among all of the pitch shifting schemes, but the mean of the first peak is slightly better adjusted to the target by using FDPS. This peak is under the fist formant, which presented a clearer transformation tendency, as shown in
Section 3.2.1, and it is the most predominant one. From our point of view, the rest of the peaks do not provide any clue on the difference of the performance of the three schemes; anyway, their relative importance with respect to the lower peaks diminishes with the peak number. Regarding the phase of the harmonic peaks, the results were also very similar for the three schemes.
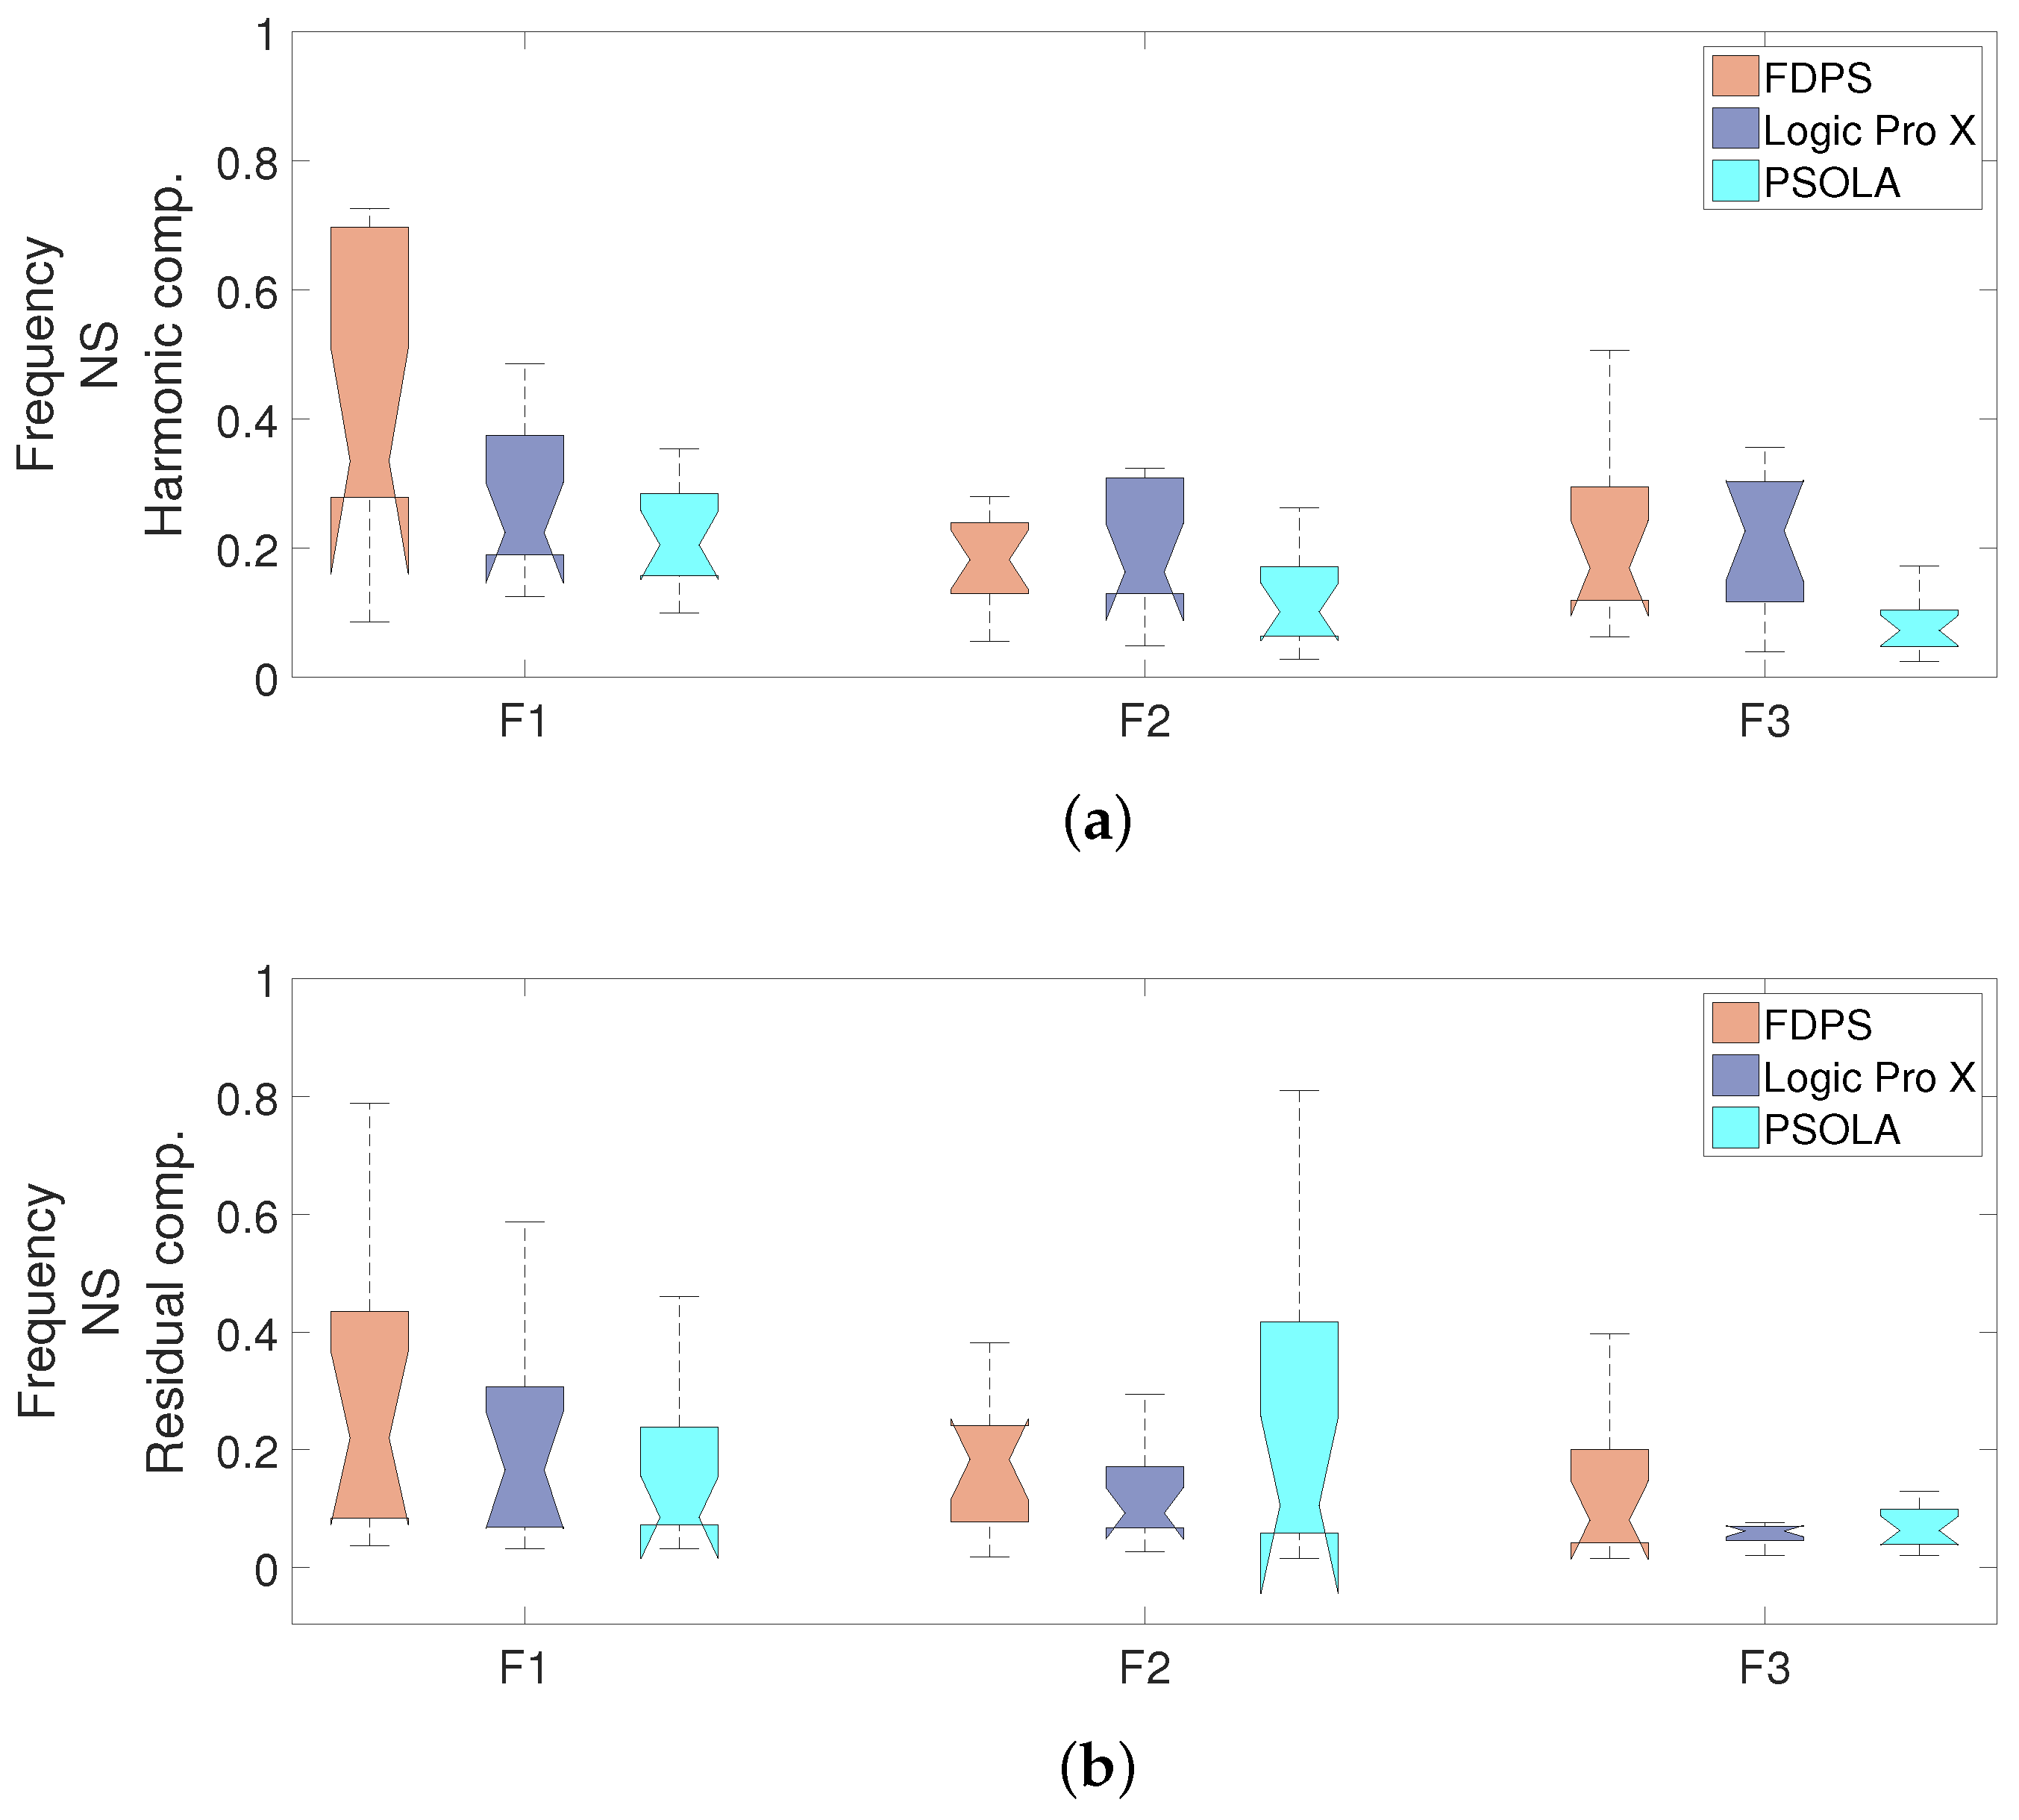
The similarity of the central frequency and the bandwidth of the formants was measured, as well.
Figure 12 shows the results of the NS parameter for the central frequency of the formants for both the harmonic and residual component. The average of the NS measurements indicates that the
of the harmonic component achieved a 35.6% better estimation with Logic Pro X than FDPS, whereas the more dominant
and
formants were 34.5% and 12%, respectively, more accurately adjusted with FDPS. In the residual component, the mean NS of
and
was, respectively, 18.6% and 32.5%, closer to the target with FDPS than with Logic Pro X. The mean NS for
was similar in these two cases. However, observe that the median (shown in the figures) and the shape of the distributions suggests a trend to a higher score with our approach also in this evaluation. In both components, PSOLA achieved the worst results.
Finally, the results regarding the formant bandwidths are shown in
Figure 13. Again, the mean of the NS results, for both the harmonic and residual components, indicate that our FDPS scheme attained better performance (larger mean NS) in the two first formants (
and
) than Logic Pro X and PSOLA. Moreover, the most significant difference appears in the bandwidth of the first formant, which highlights the better performance of our scheme.
6.2. Subjective Evaluation
As the objective evaluation, the subjective evaluation provided other interesting results. A total of 23 anonymous subjects participated and fully completed the survey. Most of the participants had some musical background. There were six female and 17 male participants. The survey informed the participant that the differences between the audio samples might be subtle and recommended the usage of good quality headphones.
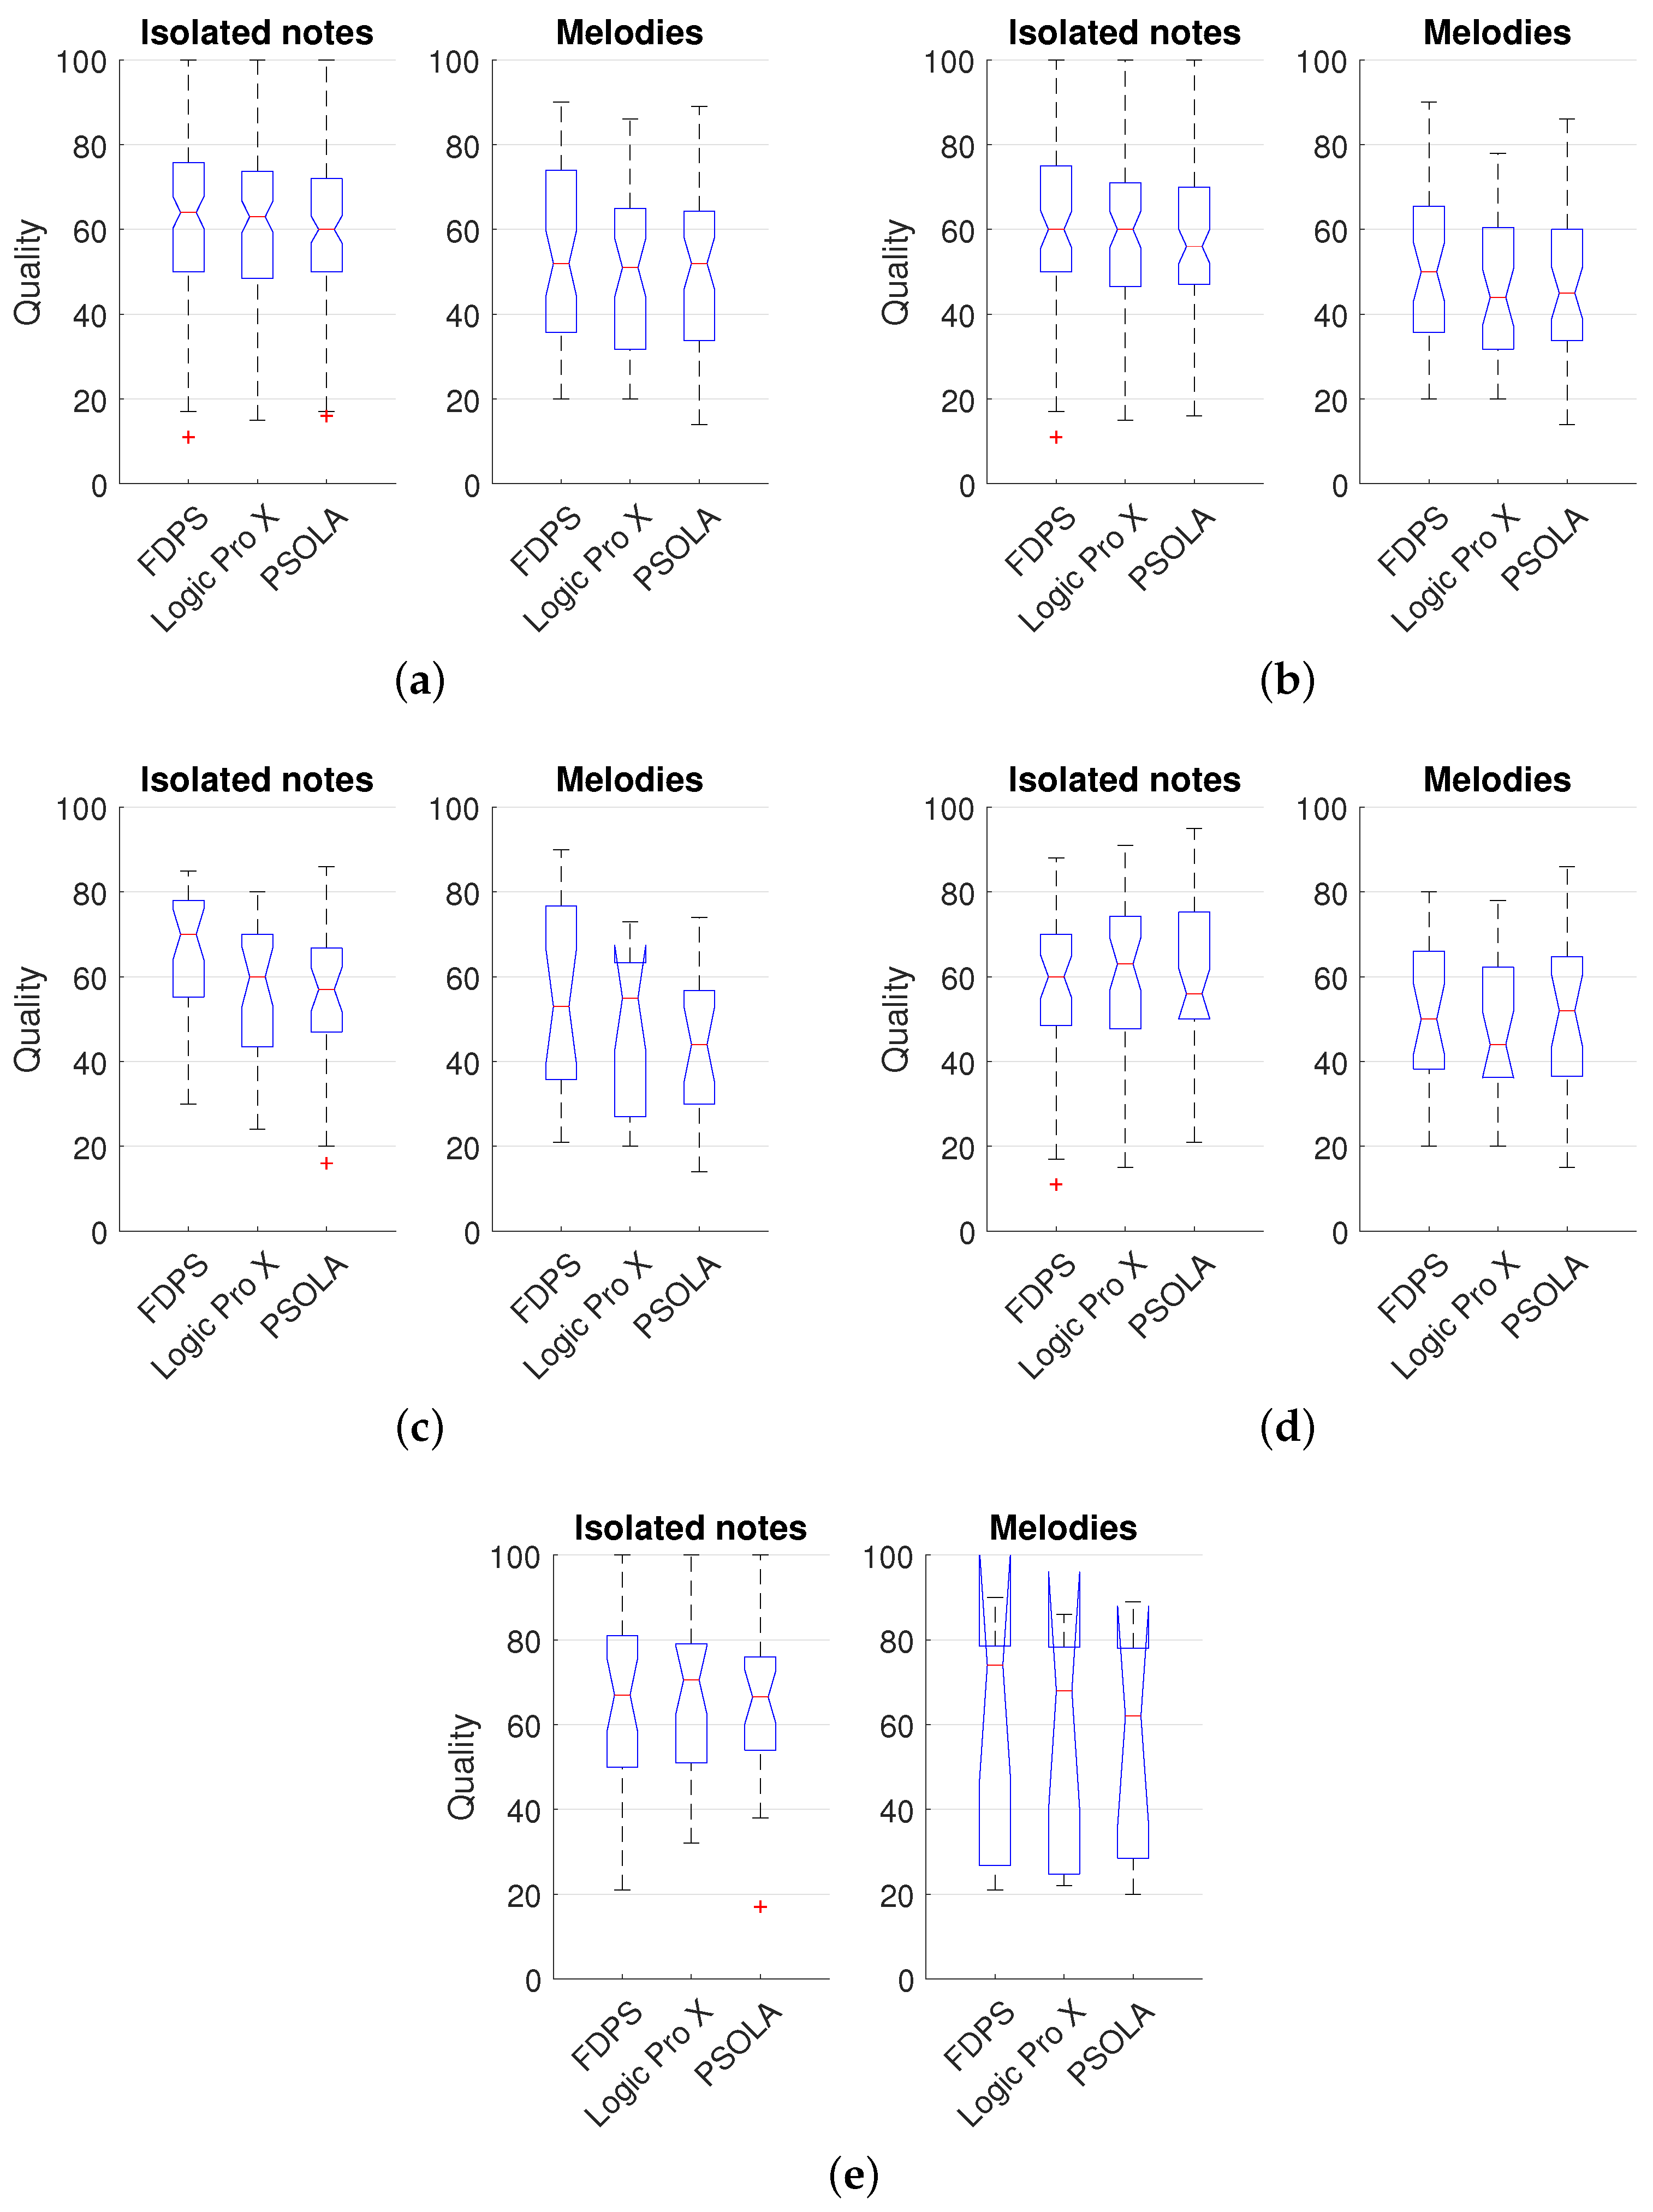
Figure 14 shows the results of the survey; five different participant categories have been identified to interpret the results. The figures show the 95% confidence interval of the scores with a notch placed at the median value. The evaluation of the three transformations considered was done for isolated notes and melodies, separately.
In
Figure 14a, the global results including all of the participants are shown. Our approach achieved a mean quality of 61.4%, whereas Logic Pro X and PSOLA attained 60.8% and 60.0%, respectively, in the case of isolated notes. In the case of the melodies, the three schemes achieved very similar results; although our scheme is skewed towards a higher score.
Figure 14b shows the values obtained from the participants using headphones/earphones (as recommended) for the test; they were 73% of the total number of participants. For isolated notes, the mean score of FDPS and Logic was 60.4% and 58.7%, respectively. The mean score of PSOLA was 58.2%. In the case of melodies, FDPS obtained a 52.6% mean quality score while Logic and PSOLA attained lower scores, 47.3% and 47.9%, respectively.
Figure 14c shows the result of the survey considering only the participants with professional music studies or professional music production background using headphones (30% of the total). In this case, FDPS achieved 65.2% of mean quality score in the case of isolated notes, while Logic and PSOLA obtained 58.0% and 54.7%, respectively. Regarding the melodies, our FDPS scheme achieved a 55.9% mean quality, whereas Logic Pro X and PSOLA attained mean scores of 46.5% and 43.9%, respectively. As in the previous cases analyzed, our algorithm attained better results than the other two schemes, but in this case, in which the participants have significant musical background and do the survey in good listening conditions (according to their answers), the difference in the performance between our scheme and the others is larger.
In
Figure 14d, the participants with no more than elementary musical background using headphones were considered. FPDS, Logic and PSOLA achieved a mean score of 53.9%, 58.6% and 58.8% in isolated notes and 47.0%, 45.2% and 49.2% in melodies, respectively. Somehow, curiously, the results for the musically untrained subjects do not follow the trend of the results attained by trained subjects. The latter reveals rather clearly the better performance of our scheme, whereas untrained subjects do not show the same difference in performance. This can be due to the combination of two factors: the lack of musical knowledge and the inadequate listening conditions (subjects in this group are using speakers instead of headphones/earphones). The latter seems corroborated by the results shown in
Figure 14e.
Figure 14e shows the results of the participants using speakers during the test (26%). In this case, the mean score for notes was 64.2%, 66.7% and 65.0% for FDPS, Logic Pro X and PSOLA, respectively. The mean score attained for the melodies was 60.1%, 56.7% and 56.5% for FDPS, Logic Pro X and PSOLA, respectively.
Considering all of the results analyzed above, it can bee seen that our FDPS approach achieved better quality according to the assessment of the participants doing the survey with a professional musical background. More specifically, the FDPS score in the case of the notes evaluated achieved greater differences of quality with regard to PSOLA and Logic Pro X. Furthermore, in the case of melodies, FPPS performance was perceived more clearly better when listening in good conditions (using headphones). This evidence is probably due to the wide variation from note to note, since melodies were made by means of the concatenation of different notes.
Globally, our scheme performs better according to the scores given by listeners with high musical knowledge listening in good listening conditions.
7. Conclusions
This paper presented a novel scheme to achieve more natural modifications of singing voice when applying a pitch shifting process. The system addresses the problem of timbre variation with the pitch by modifying the spectral envelope, unlike most of the systems developed until now, which are based on the idea of formant preservation.
To this end, a parametric model of the spectral envelope with four-pole resonators is employed to synthesize the vocal formants. With this model, a set of vowels sung at different notes has been analyzed in order to define a set of functions describing the variation of formants along pitch in singing voice. Then, a pitch shifting process for sung vowels has been defined by using a PSOLA algorithm with envelope processing according to the obtained functions. Special attention has also been paid to the estimation of the spectral envelope and the determination of pitch marks.
The method devised was evaluated by using both objective and subjective measures. The objective results show more precise envelope adjustment when using our method than with the competitors, when comparing the spectra of the shifted notes against the target samples, especially in the most important features analyzed.
The subjective evaluation of the system performance was carried out by means of an open survey, comparing the performance of our system with the Flex Pitch plugin of Logic Pro X and PSOLA. The results showed that our FDPS approach performed better than the two other schemes. Moreover, musically-trained participants doing the survey in good listening conditions rated our FDPS scheme higher.
Acknowledgments
This work has been funded by the Ministerio de Economía y Competitividad of the Spanish Government under Project No. TIN2013-47276-C6-2-R . This work has been done at Universidad de Málaga, Campus de Excelencia Internacional (CEI) Andalucía TECH.
Author Contributions
José L. Santacruz, Lorenzo J. Tardón, Isabel Barbancho and Ana M. Barbancho jointly conceived of and designed the envelope transformation model and the pitch shifting scheme; they also defined the evaluation methodology, analyzed the results obtained and wrote the manuscript.
Conflicts of Interest
The authors declare no conflict of interest. The founding sponsors had no role in the design of the study; in the collection, analyses or interpretation of data; in the writing of the manuscript; nor in the decision to publish the results.
References
- Celemony Software: Melodyne Editor. Available online: http://www.celemony.com (accessed on 16 November 2016).
- Kenmochi, H.; Ohshita, H. VOCALOID—Commercial singing synthesizer based on sample concatenation. In Proceedings of INTERSPEECH-2007, Antwerp, Belgium, 27–31 August 2007; pp. 4009–4010.
- Nakano, T.; Goto, M. VocaListener: A singing-to-singing synthesis system based on iterative parameter estimation. In Proceedings of the 6th Sound and Music Computing Conference, Porto, Portugal, 23–25 July 2009; pp. 343–348.
- Röbel, A. Efficient Spectral Envelope Estimation and its application to pitch shifting and envelope preservation. In Proceedings of the 8th International Conference on Digital Audio Effects, Madrid, Spain, 20–22 September 2005; pp. 30–35.
- Roucos, S.; Wilgus, A.M. High quality time-scale modification for speech. In Proceedings of the IEEE International Conference on Acoustics, Speech, and Signal Processing (ICASSP’85), Tampa, FL, USA, 26–29 March 1985; pp. 493–496.
- Hamon, C.; Mouline, E.; Charpentier, F. A diphone synthesis system based on time-domain prosodic modifications of speech. In Proceedings of the International Conference on Acoustics, Speech, and Signal Processing (ICASSP-89), Glasgow, UK, 23–26 May 1989; pp. 238–241.
- Charpentier, F.J.; Stella, M. Diphone synthesis using an overlap-add technique for speech waveforms concatenation. In Proceedings of the IEEE International Conference on Acoustics, Speech, and Signal Processing (ICASSP’86), Tokyo, Japan, 7–11 April 1986; pp. 2015–2018.
- Verhelst, W.; Roelands, M. An overlap-add technique based on waveform similarity (WSOLA) for high quality time-scale modification of speech. In Proceedings of the IEEE International Conference on Acoustics, Speech, and Signal Processing (ICASSP-93), Minneapolis, MN, USA, 27–30 April 1993; pp. 554–557.
- Moulines, E.; Charpentier, F. Pitch-synchronous waveform processing techniques for text-to-speech synthesis using diphones. Speech Commun. 1990, 9, 453–467. [Google Scholar] [CrossRef]
- Chládková, K.; Boersma, P.; Podlipský, V.J. Online formant shifting as a function of F0. In Proceedings of INTERSPEECH-2009, Brighton, UK, 6–10 September 2009; pp. 464–467.
- Huber, J.E.; Stathopoulos, G.M.C.; Ash, T.A.; Johnson, K. Formants of children, women and men: The effects of vocal intensity variation. J. Acoust. Soc. Am. 1999, 106, 1532–1542. [Google Scholar] [CrossRef] [PubMed]
- Zölzer, U. DAFX: Digital Audio Effects; John Wiley & Sons: New York, NY, USA, 2011. [Google Scholar]
- Saitou, T.; Unoki, M.; Akagi, M. Development of an F0 control model based on F0 dynamic characteristics for singing-voice synthesis. Speech Commun. 2005, 46, 405–417. [Google Scholar] [CrossRef]
- Molina, E.; Barbancho, I.; Barbancho, A.M.; Tardón, L.J. Parametric model of spectral envelope to synthesize realistic intensity variations in singing voice. In Proceedings of the IEEE International Conference on Acoustics, Speech and Signal Processing (ICASSP2014), Florence, Italy, 4–9 May 2014; pp. 634–637.
- O’Shaughnessy, D. Linear predictive coding. IEEE Potentials 1988, 7, 29–32. [Google Scholar] [CrossRef]
- Atal, B.S.; Remde, J.R. A new model of LPC excitation for producing natural-sounding speech at low bit rates. In Proceedings of the IEEE International Conference on Acoustics, Speech, and Signal Processing (ICASSP’82), Paris, France, 3–5 May 1982; pp. 614–617.
- Kabal, P.; Ramachandran, R.P. The computation of line spectral frequencies using Chebyshev polynomials. IEEE Trans. Acoust. Speech Signal Proc. 1986, 34, 1419–1426. [Google Scholar] [CrossRef]
- Bonada, J.; Celma, Ò.; Loscos, À.; Ortolà, J.; Serra, X.; Yoshioka, Y.; Kayama, H.; Hisaminato, Y.; Kenmochi, H. Singing voice synthesis combining excitation plus resonance and sinusoidal plus residual models. In Proceedings of the International Computer Music Conference, La Habana, Cuba, 17–22 September 2001.
- Klatt, D.H. Software for a cascade/parallel formant synthesizer. J. Acoust. Soc. Am. 1980, 67, 971–995. [Google Scholar] [CrossRef]
- Snell, R.C.; Milinazzo, F. Formant location from LPC analysis data. IEEE Trans. Speech Audio Proc. 1993, 1, 129–134. [Google Scholar] [CrossRef]
- Gläser, C.; Heckmann, M.; Joublin, F.; Goerick, C. Combining Auditory Preprocessing and Bayesian Estimation for Robust Formant Tracking. IEEE Trans. Audio, Speech Lang. Proc. 2010, 18, 224–236. [Google Scholar] [CrossRef]
- Fulop, S.A. Accuracy of formant measurement for synthesized vowels using the reassigned spectrogram and comparison with linear prediction. J. Acoust. Soc. Am. 2010, 127, 2114–2117. [Google Scholar] [CrossRef] [PubMed]
- Bonada, J.; Serra, X.; Amatriain, X.; Loscos, A. Spectral processing. In DAFX: Digital Audio Effects, 2nd ed.; John Wiley & Sons: New York, NY, USA, 2011; pp. 393–445. [Google Scholar]
- Molina, E.; Barbancho, A.M.; Tardón, L.J.; Barbancho, I. Dissonance reduction in polyphonic audio using harmonic reorganization. IEEE/ACM Trans. Audio Speech Lang. Proc. 2013, 22, 325–334. [Google Scholar] [CrossRef]
- Iseli, M.; Shue, Y.L.; Alwan, A. Age, sex, and vowel dependencies of acoustic measures related to the voice source. J. Acoust. Soc. Am. 2007, 121, 2283–2295. [Google Scholar] [CrossRef] [PubMed]
- Dumouchel, W.; O’Brien, F. Integrating a robust option into a multiple regression computing environment. Inst. Math. Its Appl. 1991, 36, 41–48. [Google Scholar]
- Ohmura, H.; Tanaka, K. Speech synthesis using a nonlinear energy damping model for the vocal folds vibration effect. In Proceedings of the Fourth International Conference on Spoken Language Processing (ICSLP 96), Philadelphia, PA, USA, 3–6 October 1996; pp. 1241–1244.
- Watson, G.S. Linear least squares regression. Ann. Math. Stat. 1967, 38, 1679–1699. [Google Scholar] [CrossRef]
- Catford, J.C. A Practical Introduction to Phonetics; Clarendon Press: Oxford, UK, 1988. [Google Scholar]
- Mattheyses, W.; Verhelst, W.; Verhoeve, P. Robust pitch marking for prosodic modification of speech using TD-PSOLA. In Proceedings of the IEEE Benelux/DSP Valley Signal Processing Symposium, SPS-DARTS, Antwerp, Belgium, 28–29 March 2006; pp. 43–46.
- Lin, C.Y.; Jang, J.S.R. A two-phase pitch marking method for TD-PSOLA synthesis. In Proceedings of INTERSPEECH-2004, Jeju Island, Korea, 4–8 October 2004.
- De Cheveigné, A.; Kawahara, H. YIN, a fundamental frequency estimator for speech and music. J. Acoust. Soc. Am. 2002, 111, 1917–1930. [Google Scholar] [CrossRef] [PubMed]
- Poliner, G.E.; Ellis, D.; Ehmann, A.; Gomez, E.; Streich, S.; Beesuan, O. Melody Transcription From Music Audio: Approaches and Evaluation. IEEE Trans. Audio Speech Lang. Proc. 2007, 15, 1247–1256. [Google Scholar] [CrossRef]
- Ryynänen, M.; Klapuri, A. Modelling of note events for singing transcription. In Proceedings of the ISCA Tutorial and Research Workshop on Statistical and Perceptual Audio Processing, Jeju Island, Korea, 2–3 October 2004.
- Drugman, T.; Dutoit, T. Glottal closure and opening instant detection from speech signals. In Proceedings of INTERSPEECH-2009, Brighton, UK, 6–10 September 2009; pp. 2891–2894.
- Ykhlef, F.; Bendaouia, L. Pitch Marking Using the Fundamental Signal for Speech Modifications via TD-PSOLA. In Proceedings of the 2013 IEEE International Symposium on Multimedia (ISM), Anaheim, CA, USA, 9–11 December 2013; pp. 118–124.
- Dutilleux, P.; De Poli, G.; von dem Knesebeck, A.; Zoelzer, U. Time-Segment Processing. In DAFX: Digital Audio Effects, 2nd ed.; John Wiley & Sons: New York, NY, USA, 2002; pp. 185–217. [Google Scholar]
- Logic Pro X. Available online: http://www.apple.com/logic-pro/ (accessed on 16 November 2016).
- Radiocommunication Sector of the International Telecommunication Union (ITU-R). Method for the subjective assessment of intermediate quality level of audio systems. Broadcasting Service (sound) (BS) Series. Available online: https://www.itu.int/dms_pubrec/itu-r/rec/bs/R-REC-BS.1534-3-201510-I!!PDF-E.pdf (accessed on 16 November 2016).
Figure 1.
Diagram of the analysis of the envelope behavior and our pitch shifting scheme with spectral envelope transformation.
Figure 1.
Diagram of the analysis of the envelope behavior and our pitch shifting scheme with spectral envelope transformation.
Figure 2.
Estimation of the parameters of the spectral envelope. Harmonic component.
Figure 2.
Estimation of the parameters of the spectral envelope. Harmonic component.
Figure 3.
evolution with pitch (), harmonic component.
Figure 3.
evolution with pitch (), harmonic component.
Figure 4.
evolution with pitch, harmonic component.
Figure 4.
evolution with pitch, harmonic component.
Figure 5.
evolution with pitch, harmonic component.
Figure 5.
evolution with pitch, harmonic component.
Figure 6.
Pitch shifting scheme with envelope transformation.
Figure 6.
Pitch shifting scheme with envelope transformation.
Figure 7.
Pitch marking using two different methods. MBS achieves smaller differences between consecutive pitch marks than the glottal closure instant (GCI).
Figure 7.
Pitch marking using two different methods. MBS achieves smaller differences between consecutive pitch marks than the glottal closure instant (GCI).
Figure 8.
Magnitude of the filter response of the harmonic component of an note (172.6 Hz) of a male singer to be pitch shifted a fifth above.
Figure 8.
Magnitude of the filter response of the harmonic component of an note (172.6 Hz) of a male singer to be pitch shifted a fifth above.
Figure 9.
Magnitude of the compensation filter for pitch shifting an note (172.6 Hz) of a male singer to be pitch shifted a fifth above.
Figure 9.
Magnitude of the compensation filter for pitch shifting an note (172.6 Hz) of a male singer to be pitch shifted a fifth above.
Figure 10.
Continuous quality scale provided for the subjective evaluation.
Figure 10.
Continuous quality scale provided for the subjective evaluation.
Figure 11.
Normalized similarity (NS) of the 10 first harmonic peaks. (a) Magnitude of the peaks; (b) phase of the harmonic peaks.
Figure 11.
Normalized similarity (NS) of the 10 first harmonic peaks. (a) Magnitude of the peaks; (b) phase of the harmonic peaks.
Figure 12.
Normalized similarity of the central frequency of the first three formants. (a) Harmonic component; (b) residual component.
Figure 12.
Normalized similarity of the central frequency of the first three formants. (a) Harmonic component; (b) residual component.
Figure 13.
Normalized similarity of the bandwidth of the first three formants. (a) Harmonic component; (b) residual component.
Figure 13.
Normalized similarity of the bandwidth of the first three formants. (a) Harmonic component; (b) residual component.
Figure 14.
Quality score. Distributions obtained with the survey for isolated notes and melodies. (a) Global results including all participants; (b) participants using headphones for the test; (c) participants with professional music studies or a professional music production background using headphones; (d) participants using headphones for the test with elementary music studies or an elementary music production background; (e) participants using speakers during the test.
Table 1.
Range of values used in the proposed model.
Table 1.
Range of values used in the proposed model.
| Parameter | Range | Parameter | Range |
|---|
| [−200,0] dB | | [500,3000] Hz |
| [−50,100] dB | | [100,1000] Hz |
| [50,600] Hz | | [1300,3800] Hz |
| [200,2000] Hz | | [200,1000] Hz |
| [100,1800] Hz | | [2500,4500] Hz |
| [100,1000] Hz | | [200,1000] Hz |
Table 2.
Parameters involved in the expressions and to modify formant locations.
Table 2.
Parameters involved in the expressions and to modify formant locations.
| Constant | Value |
|---|
| Harmonic | Residual |
|---|
| A | 0.89 | 0.84 |
| B | 0.00806 | 0.0079 |
| C | | |
| D | 0.0058 | 0.0055 |
| E | | |
© 2016 by the authors; licensee MDPI, Basel, Switzerland. This article is an open access article distributed under the terms and conditions of the Creative Commons Attribution (CC-BY) license (http://creativecommons.org/licenses/by/4.0/).


