
Integrating Textural and Spectral Features to Classify Silicate-Bearing Rocks Using Landsat 8 Data

Abstract
:1. Introduction
2. Study Area and Data
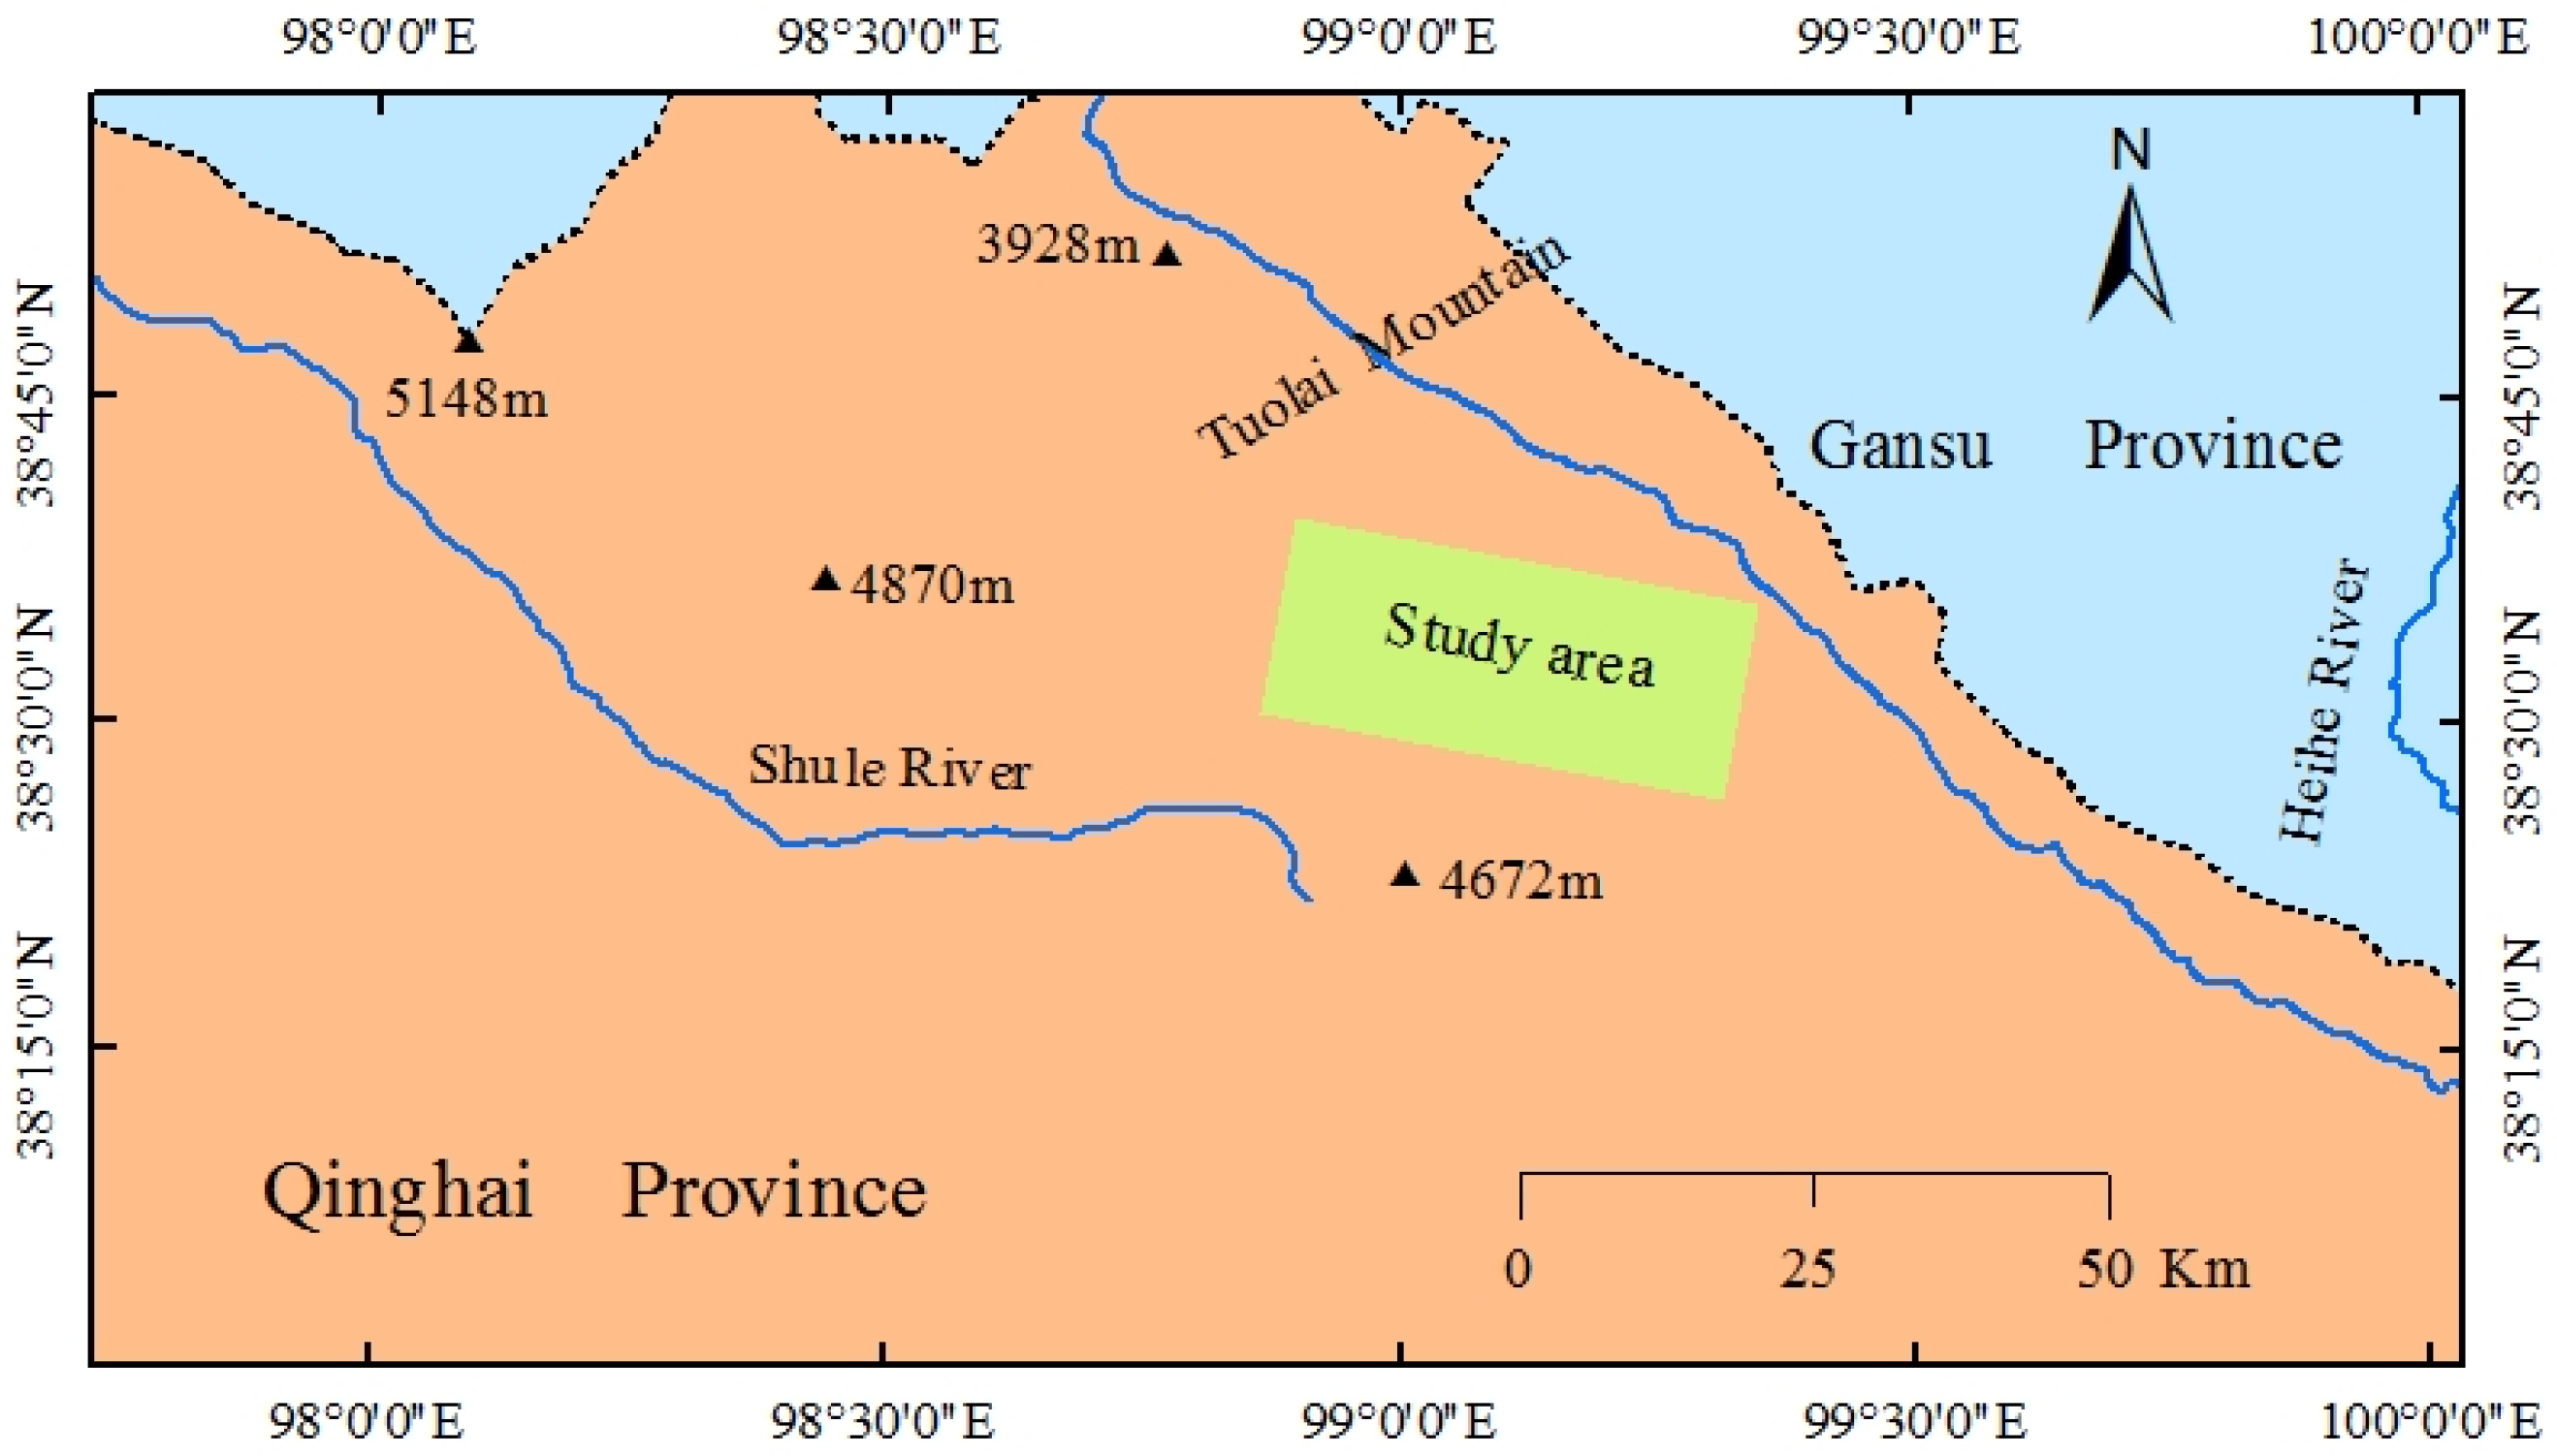
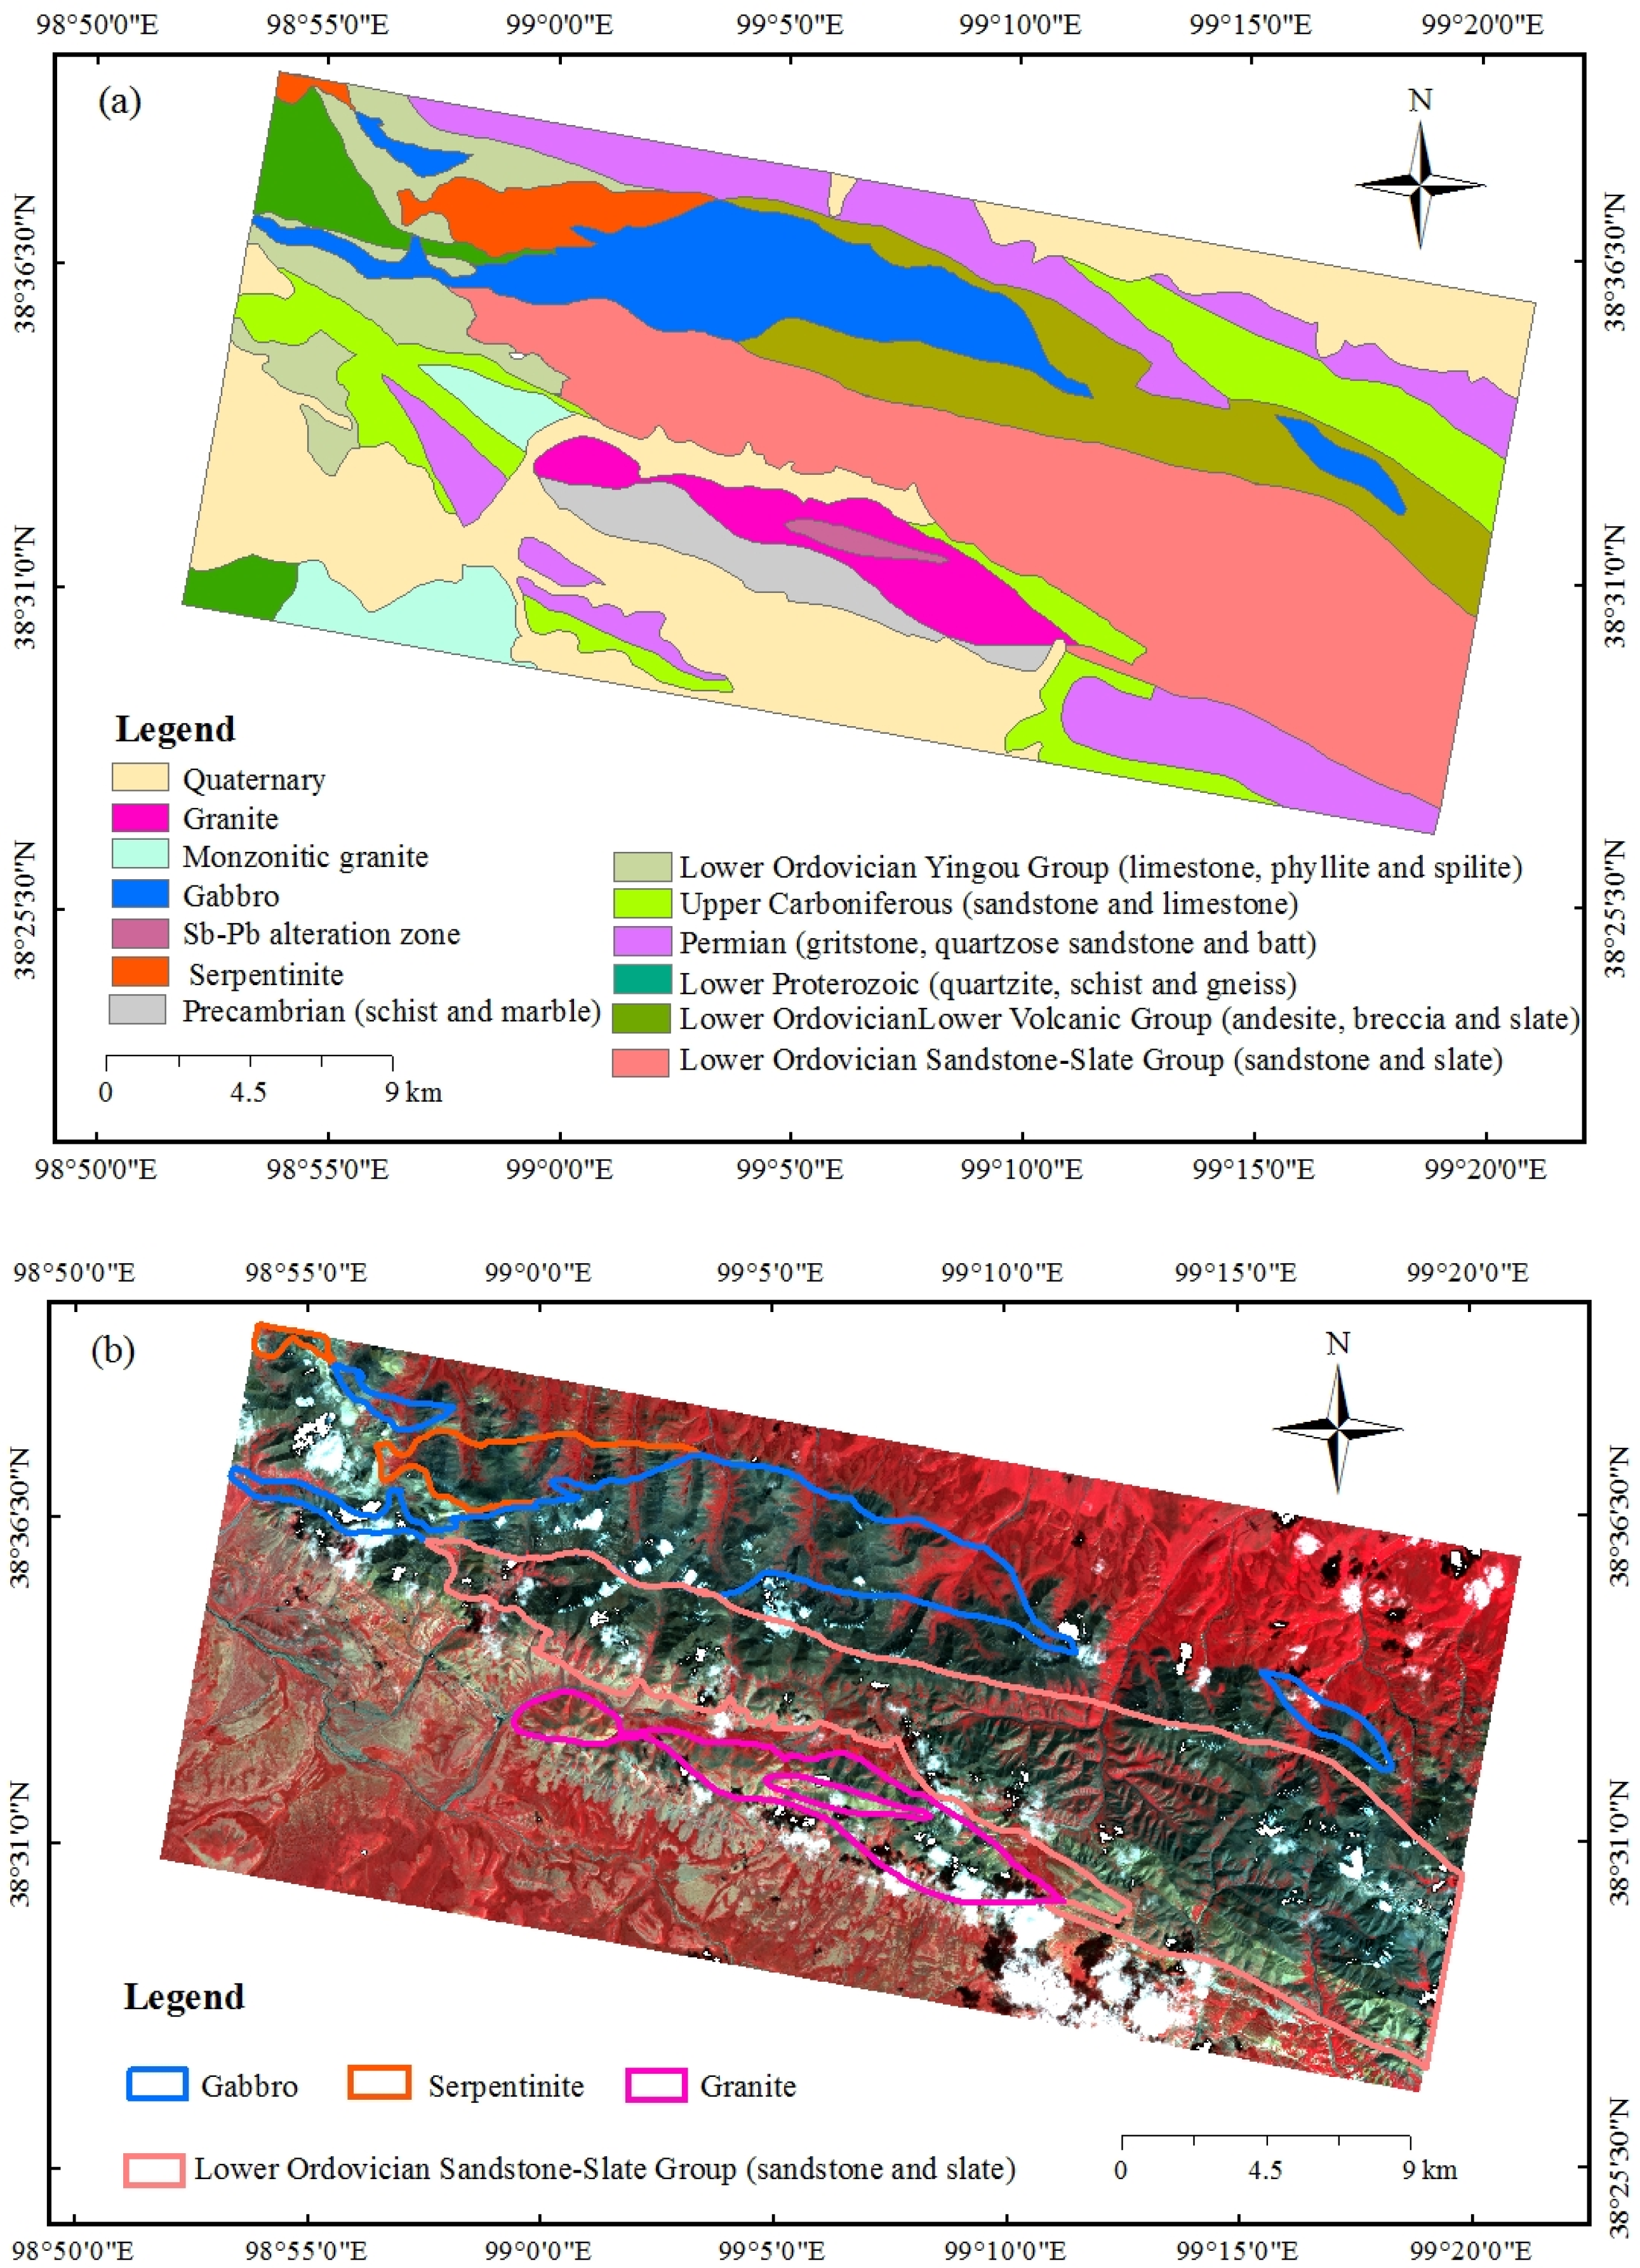
2.1. Study Area
2.2. Dataset and Processing
3. Methods
3.1. Extraction and Analysis of Spatial Textural Features
3.1.1. Box-Counting Dimension Method to Extract Textural Features
3.1.2. Optimal Feature Combinations of Spectra and Textural Vectors
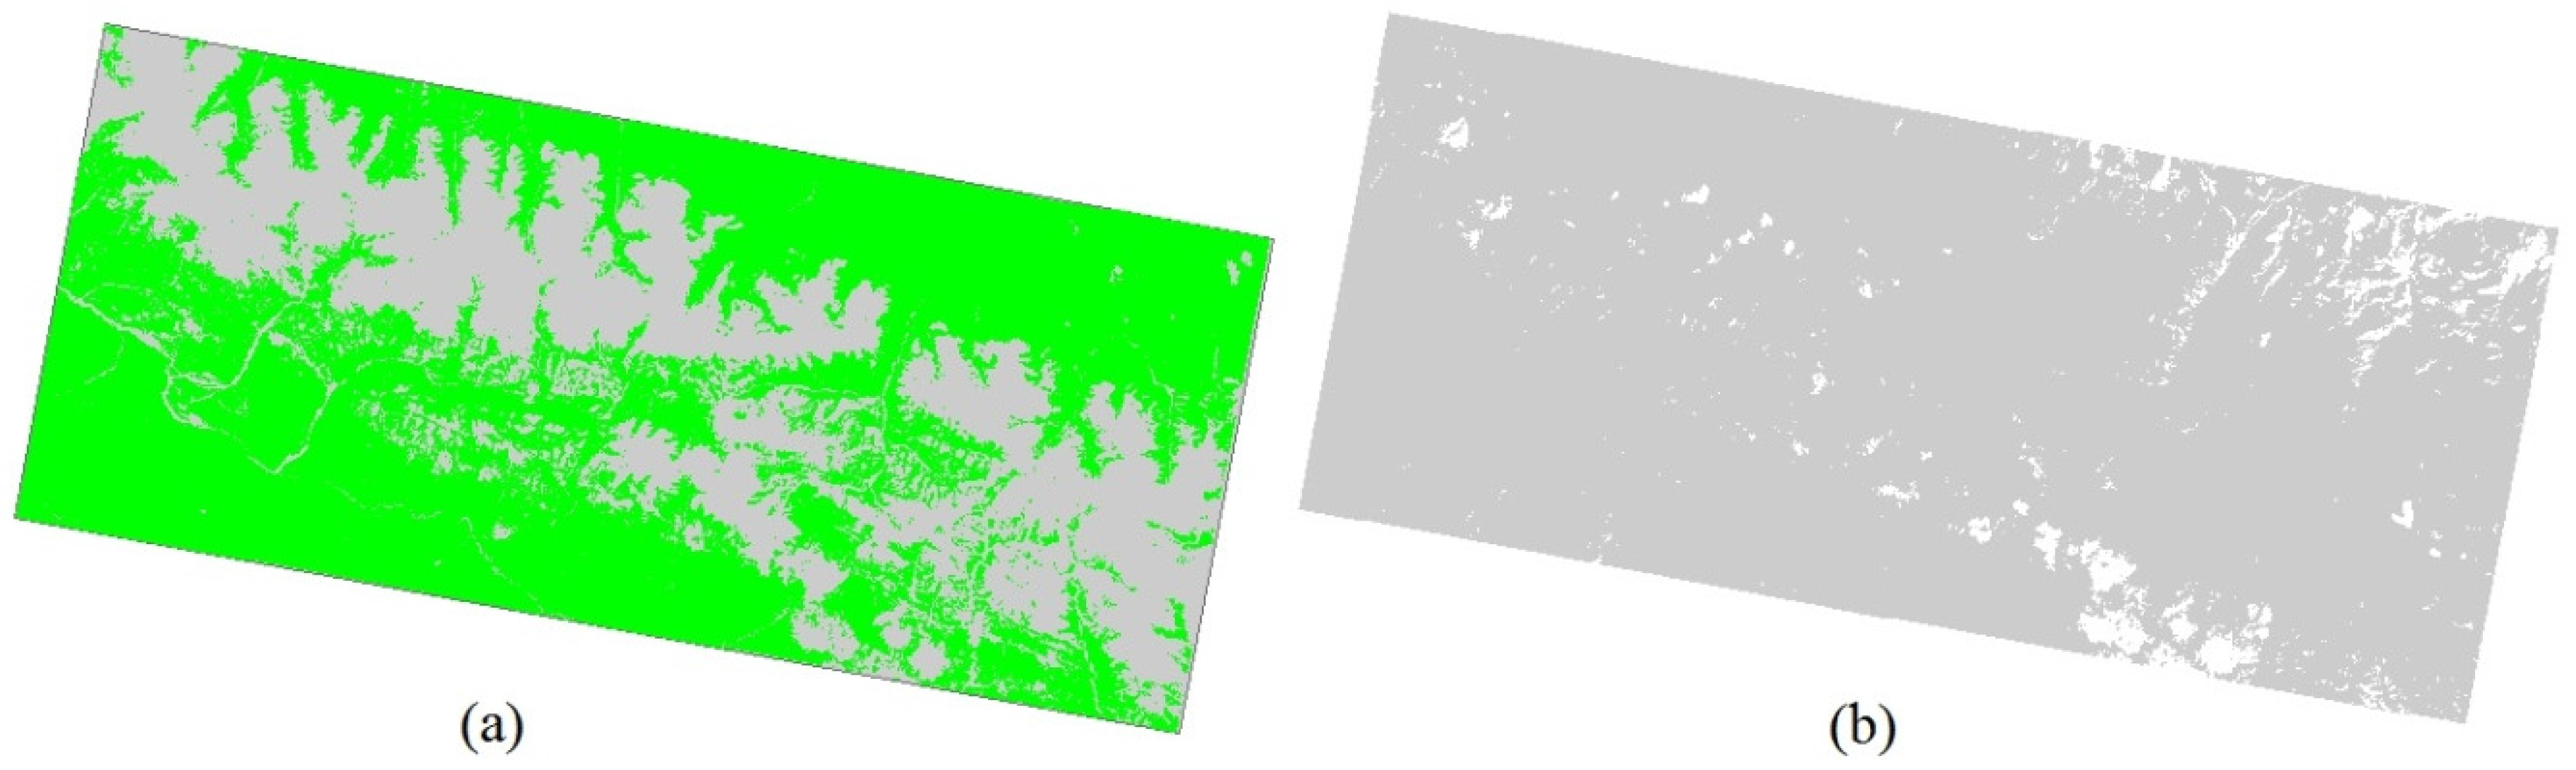
3.2. Interference Elimination in Remote Sensing Images
3.3. Support Vector Machine Classifier
- Map all input vectors to a high-dimensional feature space based on the kernel function, which is either linear or nonlinear.
- Construct an optimal hyperplane based on support vectors to separate the data into two classes according to the theory of the least errors and maximal margin between the hyperplane and the closest training data. The training samples that are closest to the hyperplane are support vectors, whereas the others are uncorrelated for establishing the class divisions.
4. Results and Discussions
4.1. Spatial Textural Feature Analysis
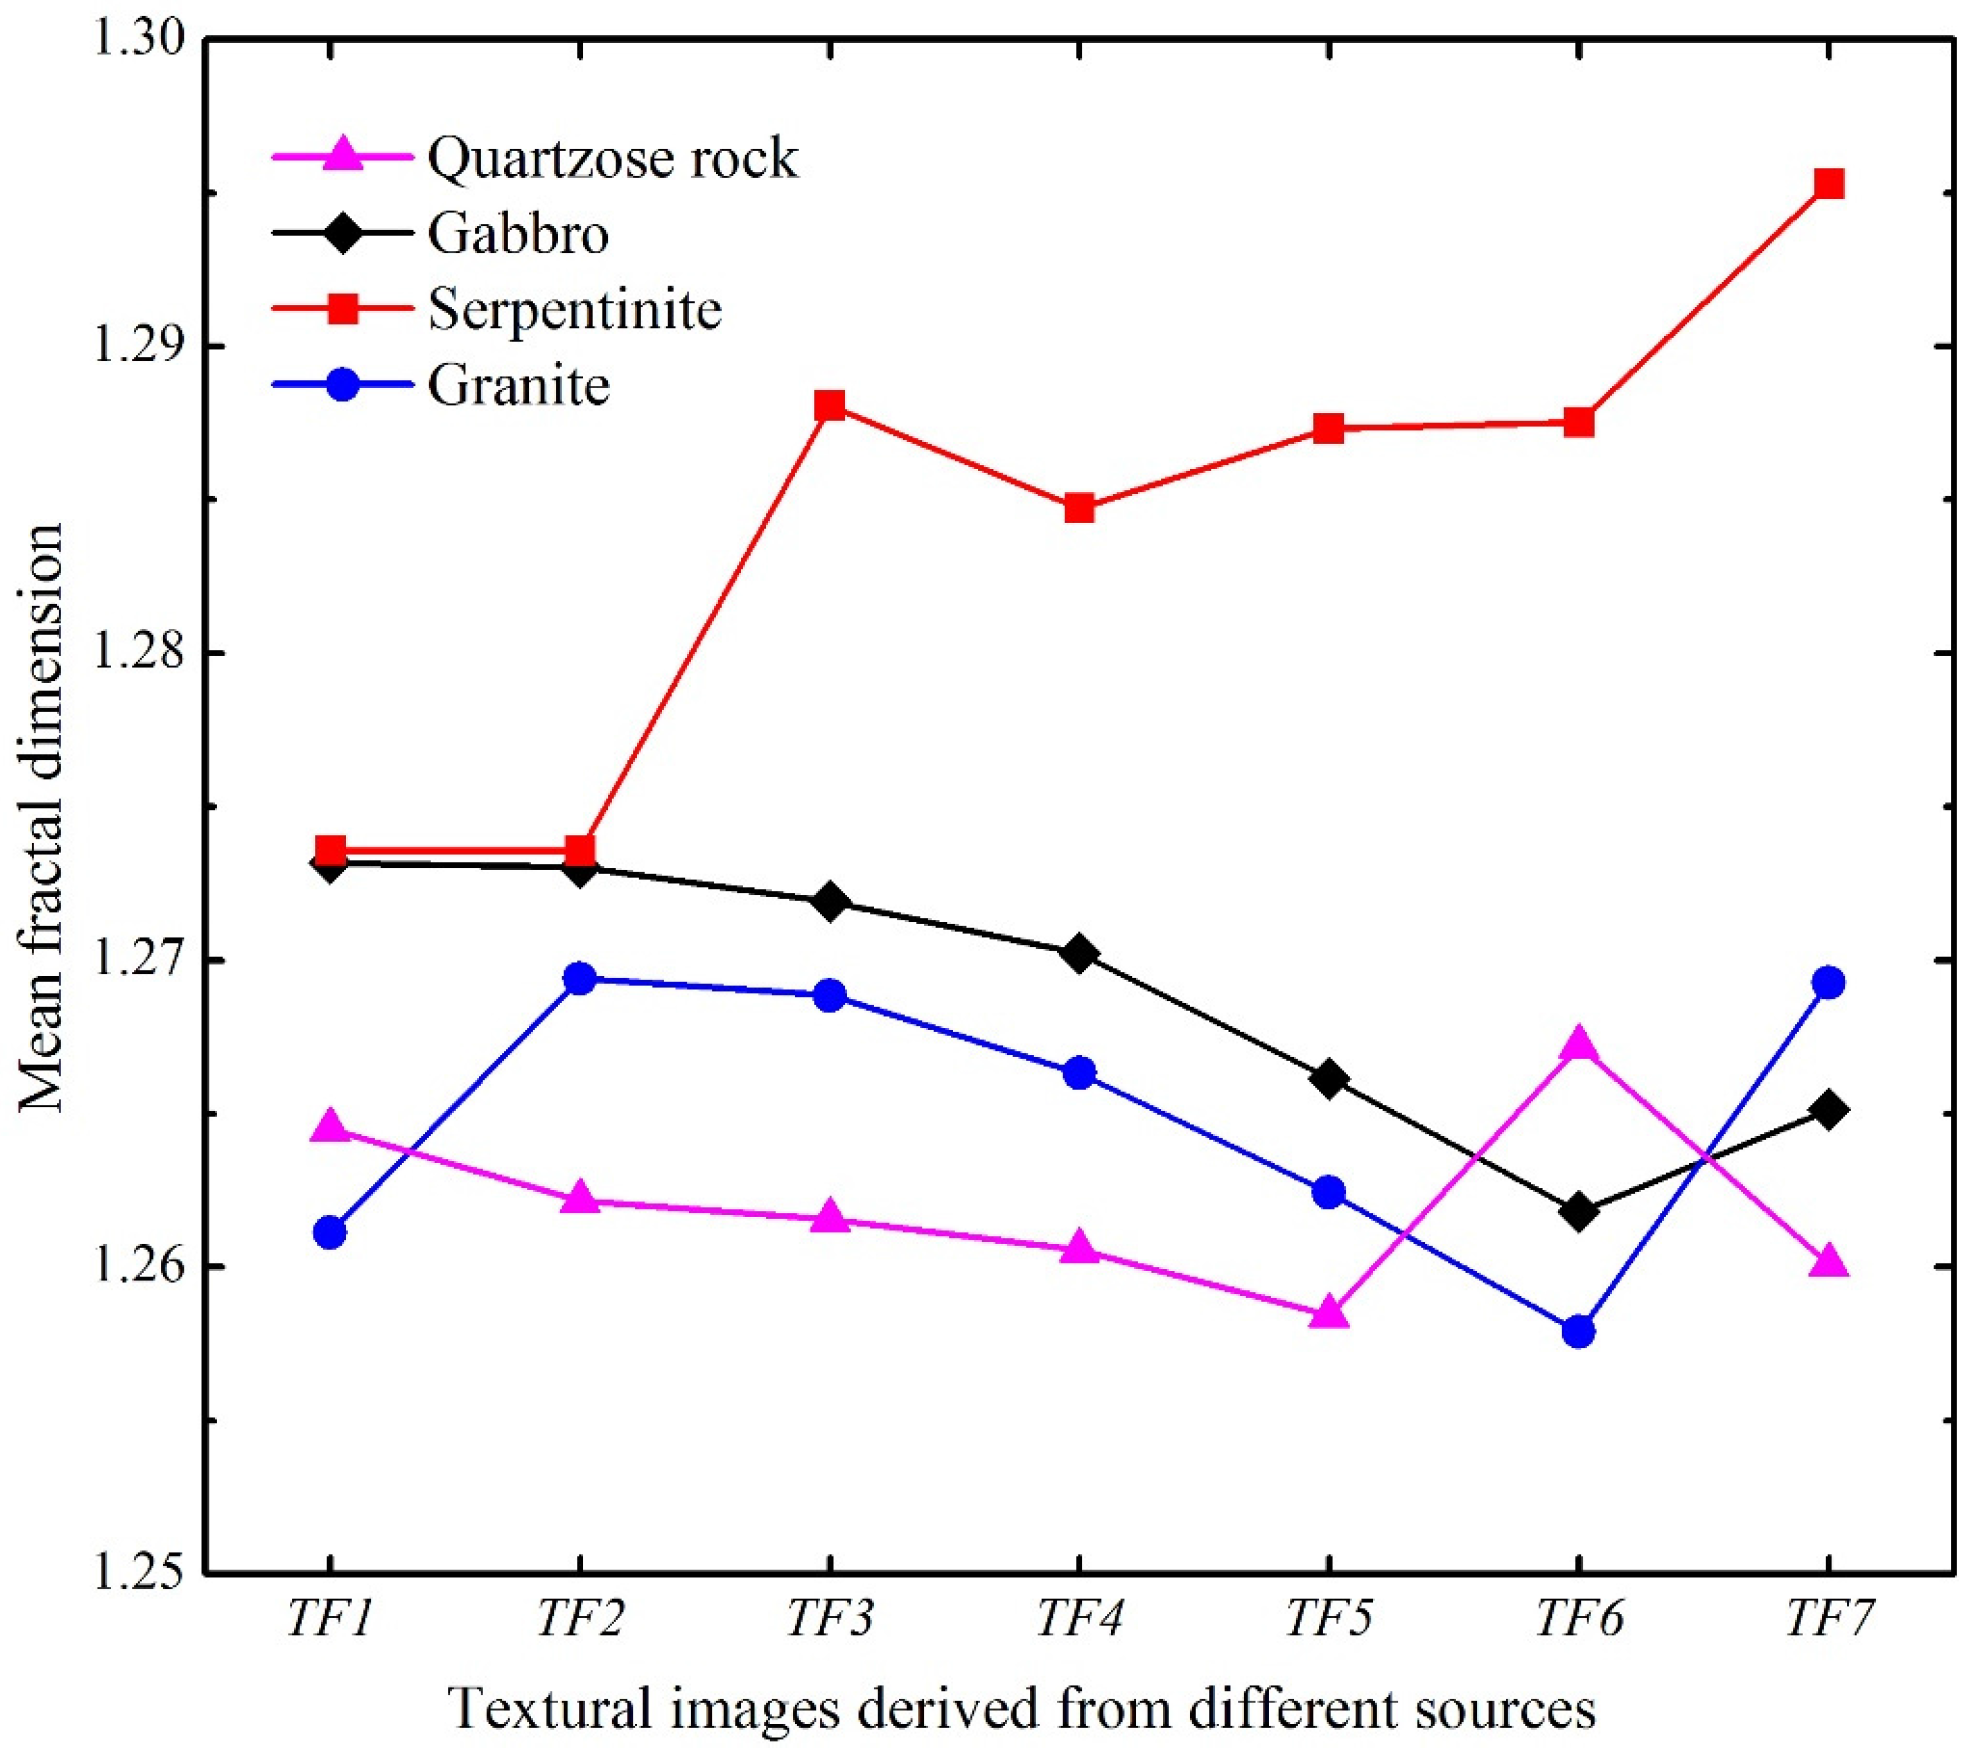
4.1.1. Spatial Textural Feature Extraction
- On the whole, shows a remarkable contrast between serpentinite and other rocks. The serpentinite has the highest , which means that its surface morphology is rougher than that of other rocks. In and TF2, the values for gabbro and serpentinite are close, while from to , there is an obvious difference between the values for gabbro and serpentinite, which may result from the fact that texture images derived from different source data have a variable effect on rock identification.
- Regardless of the different texture images, different values for the four rock types exist because of their different surface roughness, which would assist rock identification. From TF2 to TF6, the values for gabbro and granite are almost the same, while for other pairwise rocks, the contrast is not immutable.
4.1.2. Feature Vector Selection
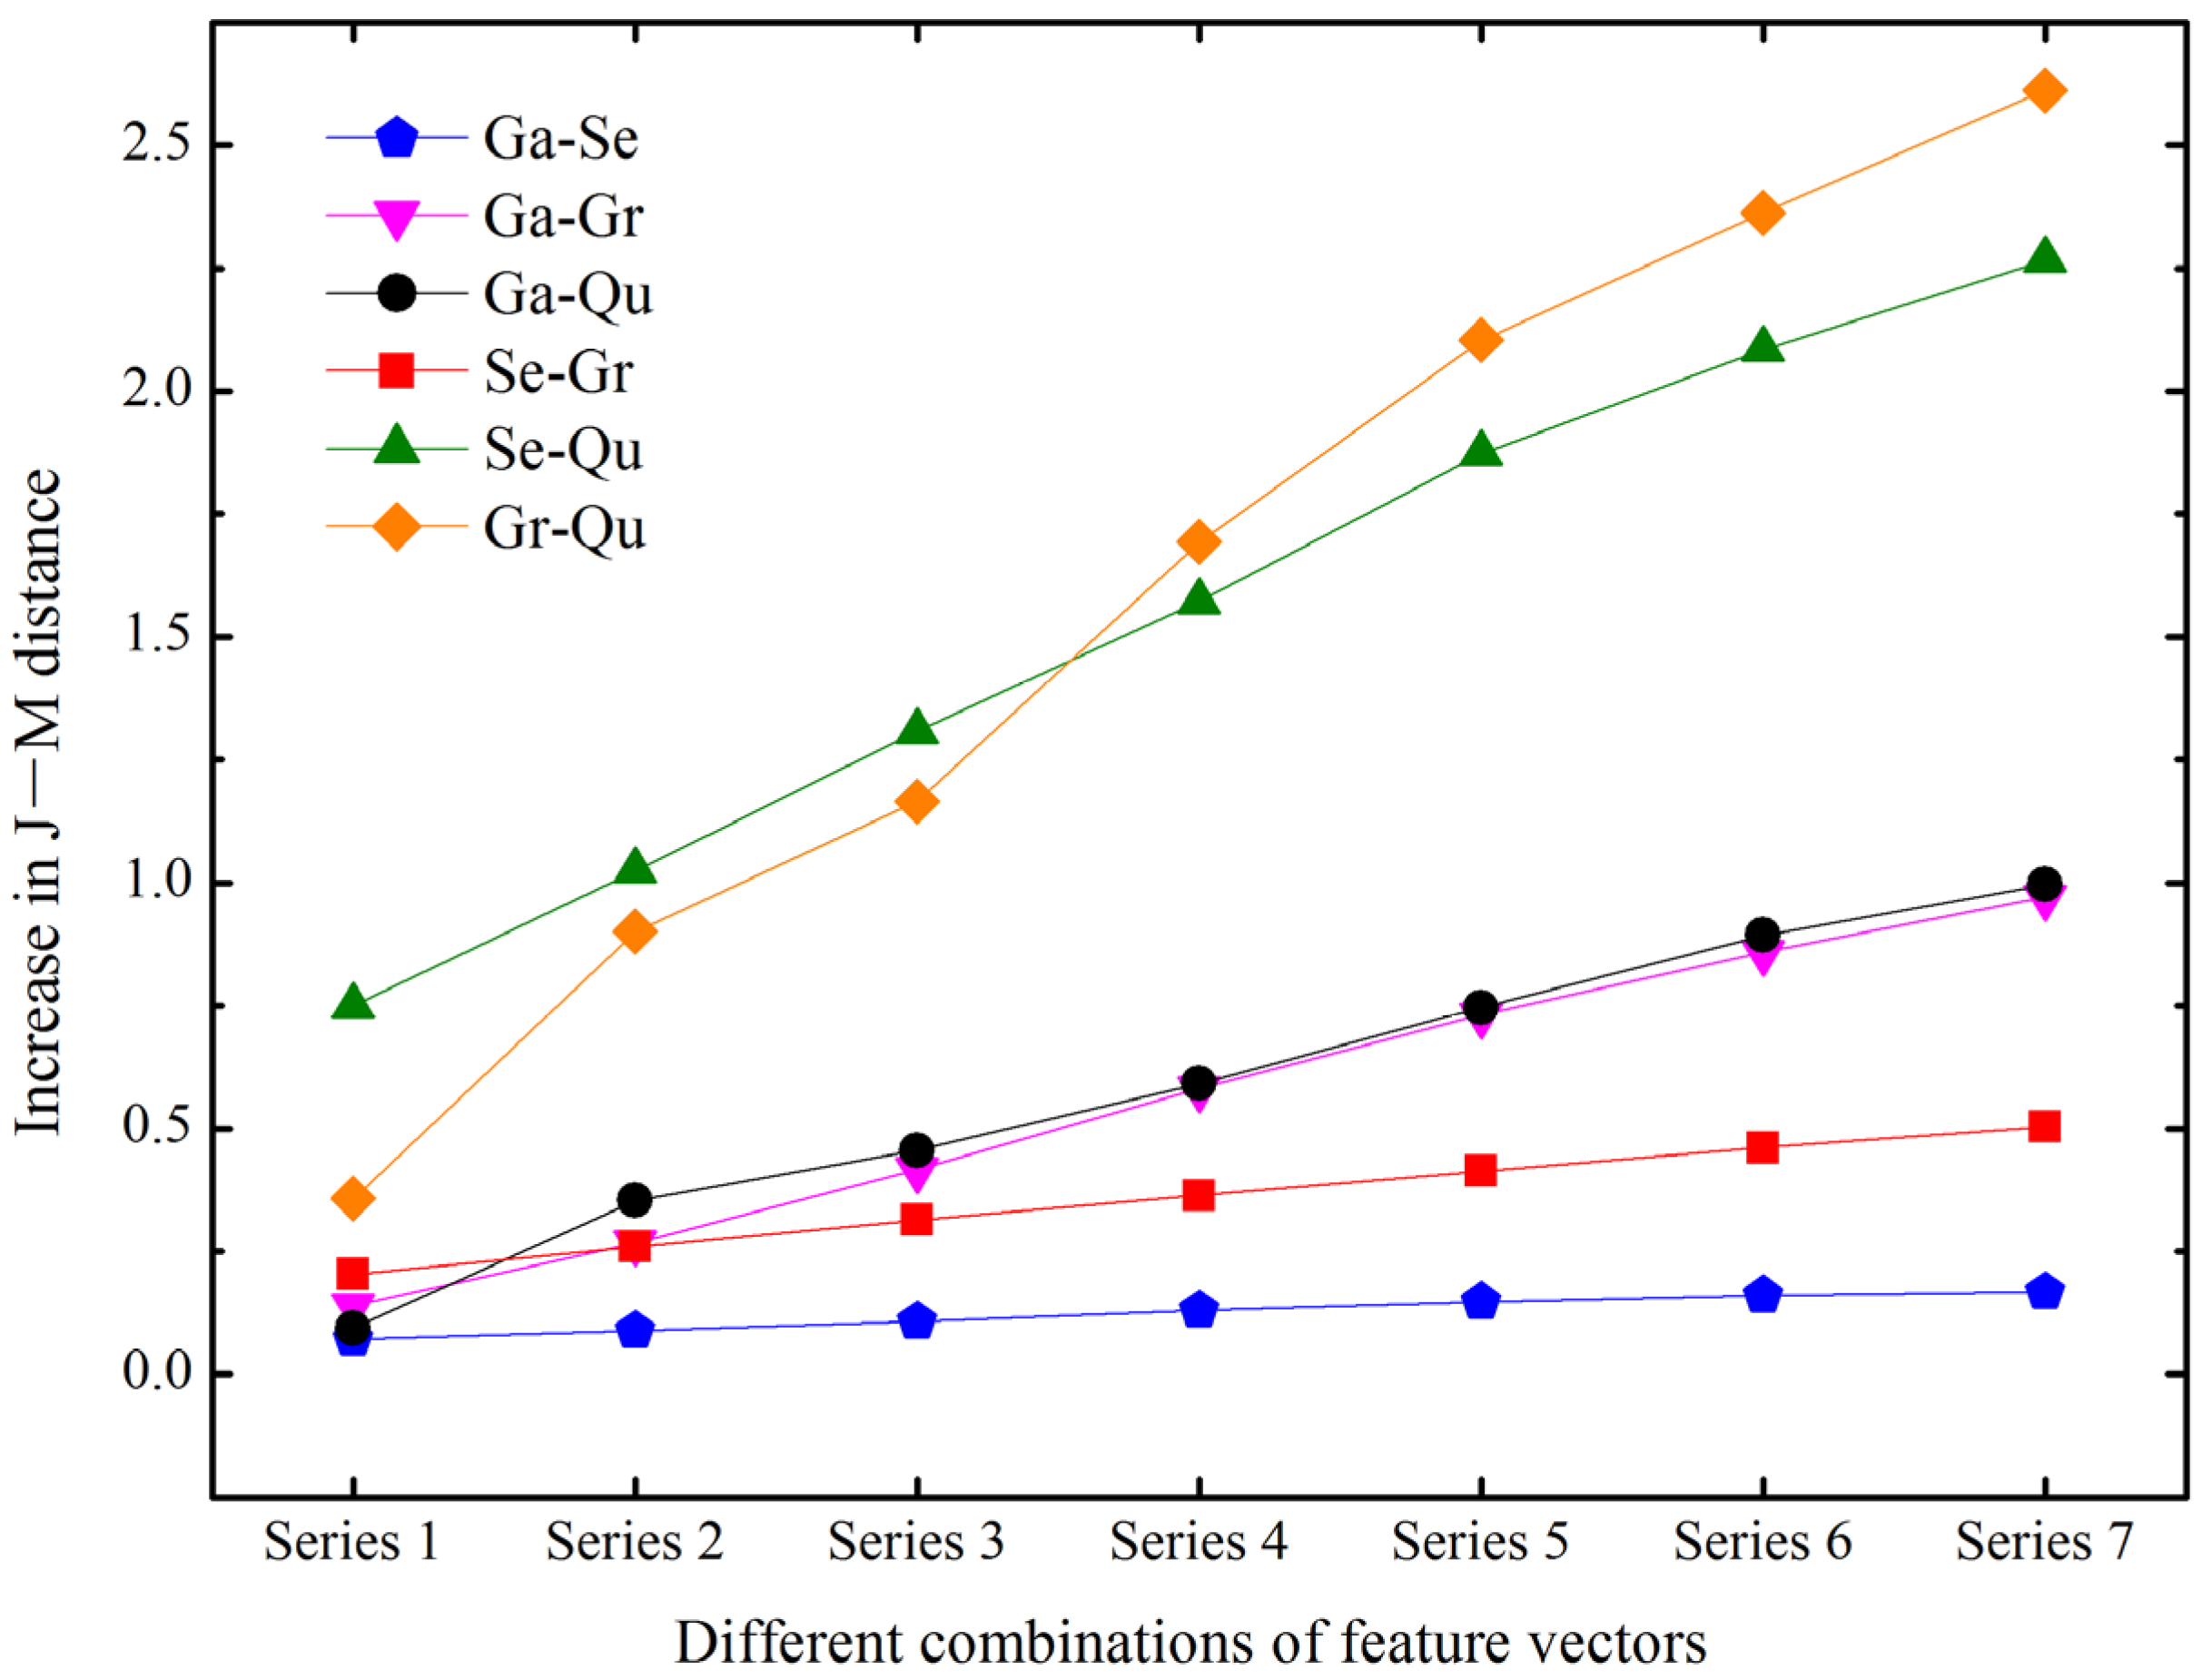
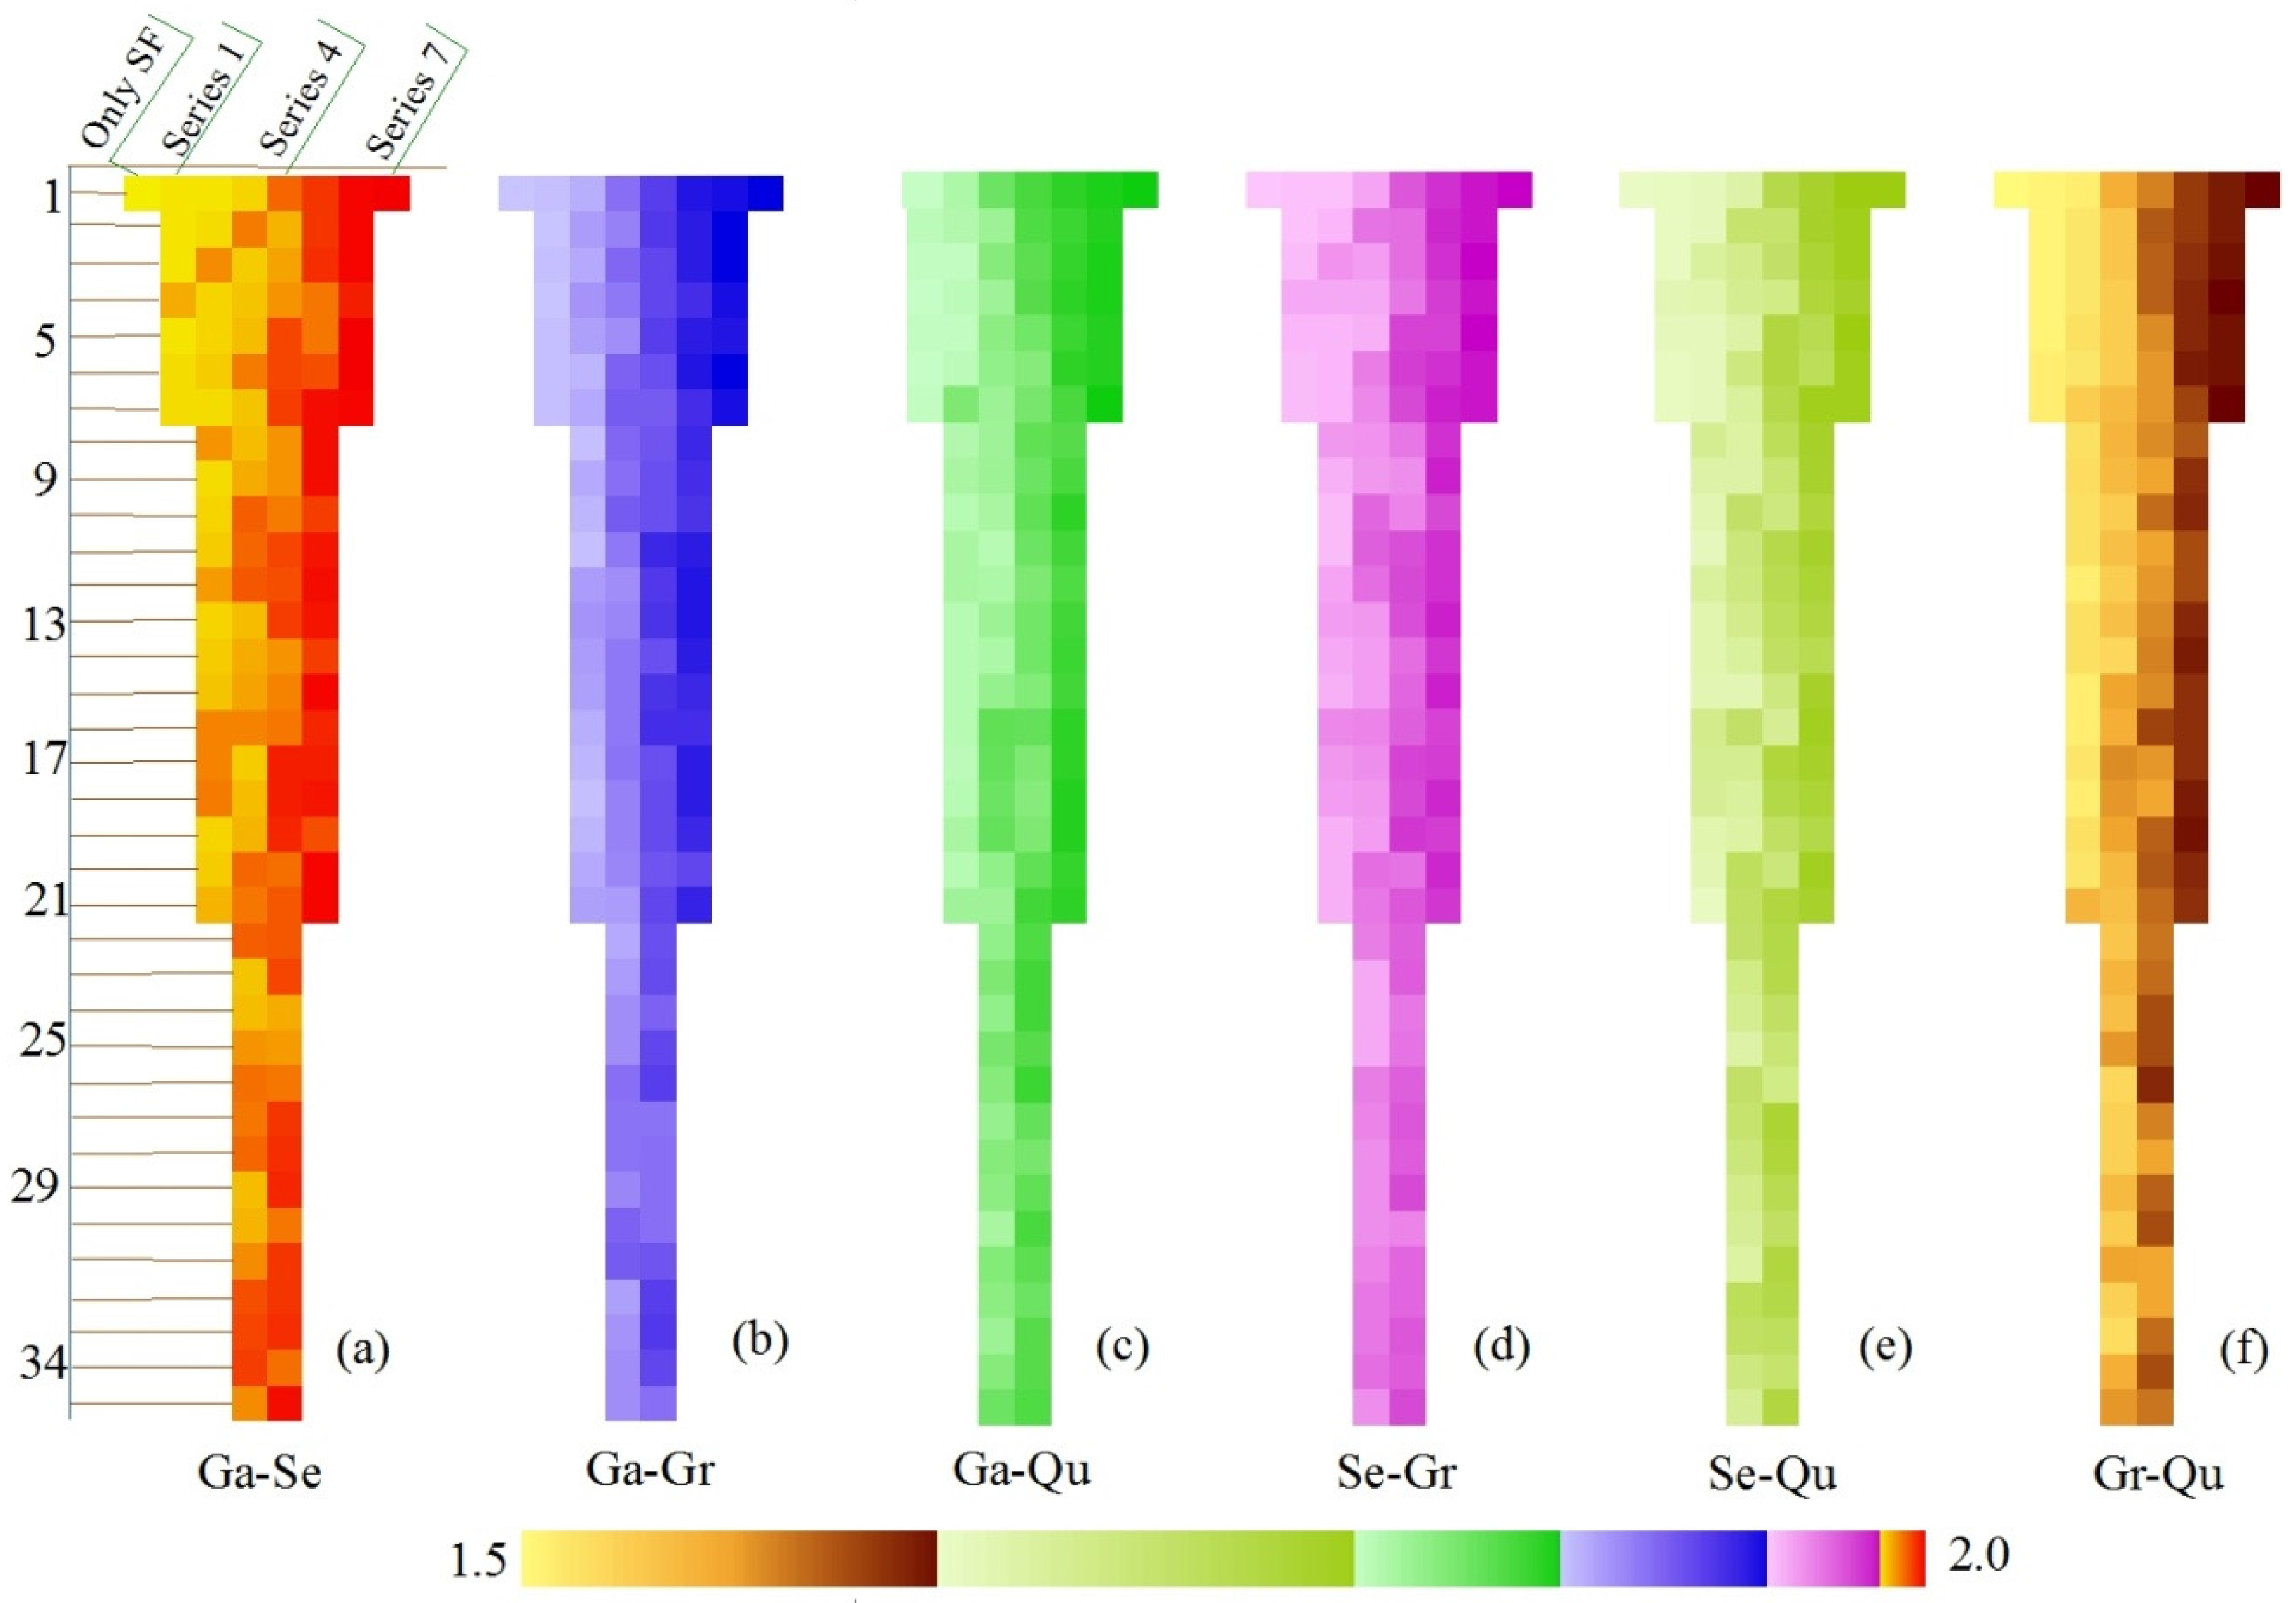
- For all six groups of pairwise rocks, the J–M distance increases significantly with the number of textural vectors, indicating that the incorporation of texture is useful for improving the identification of rocks. Moreover, for the same number of textural vectors, different combinations of them generate different J–M distances. The statistically significant J–M distances for the same number of vectors are detailed in Table 3. The textural vectors of had better performance in identifying gabbro–serpentinite, while were more effective in identifying gabbro–granite. The textural vectors of were more effective for gabbro-quartzose rock; for serpentinite–granite; for serpentinite–quartzose rock; and were more effective for identifying granite–quartzose rock. For all six pairs of rocks, the J–M distance has the highest value when all seven vectors are incorporated.
- It is clear that gabbro–serpentinite has the largest J–M distance, followed by serpentinite–granite, gabbro–granite, gabbro–quartzose rock, serpentinite–quartzose rocks and granite–quartzose rocks, which suggests that textural features are more useful for identifying granite and quartzose rocks.
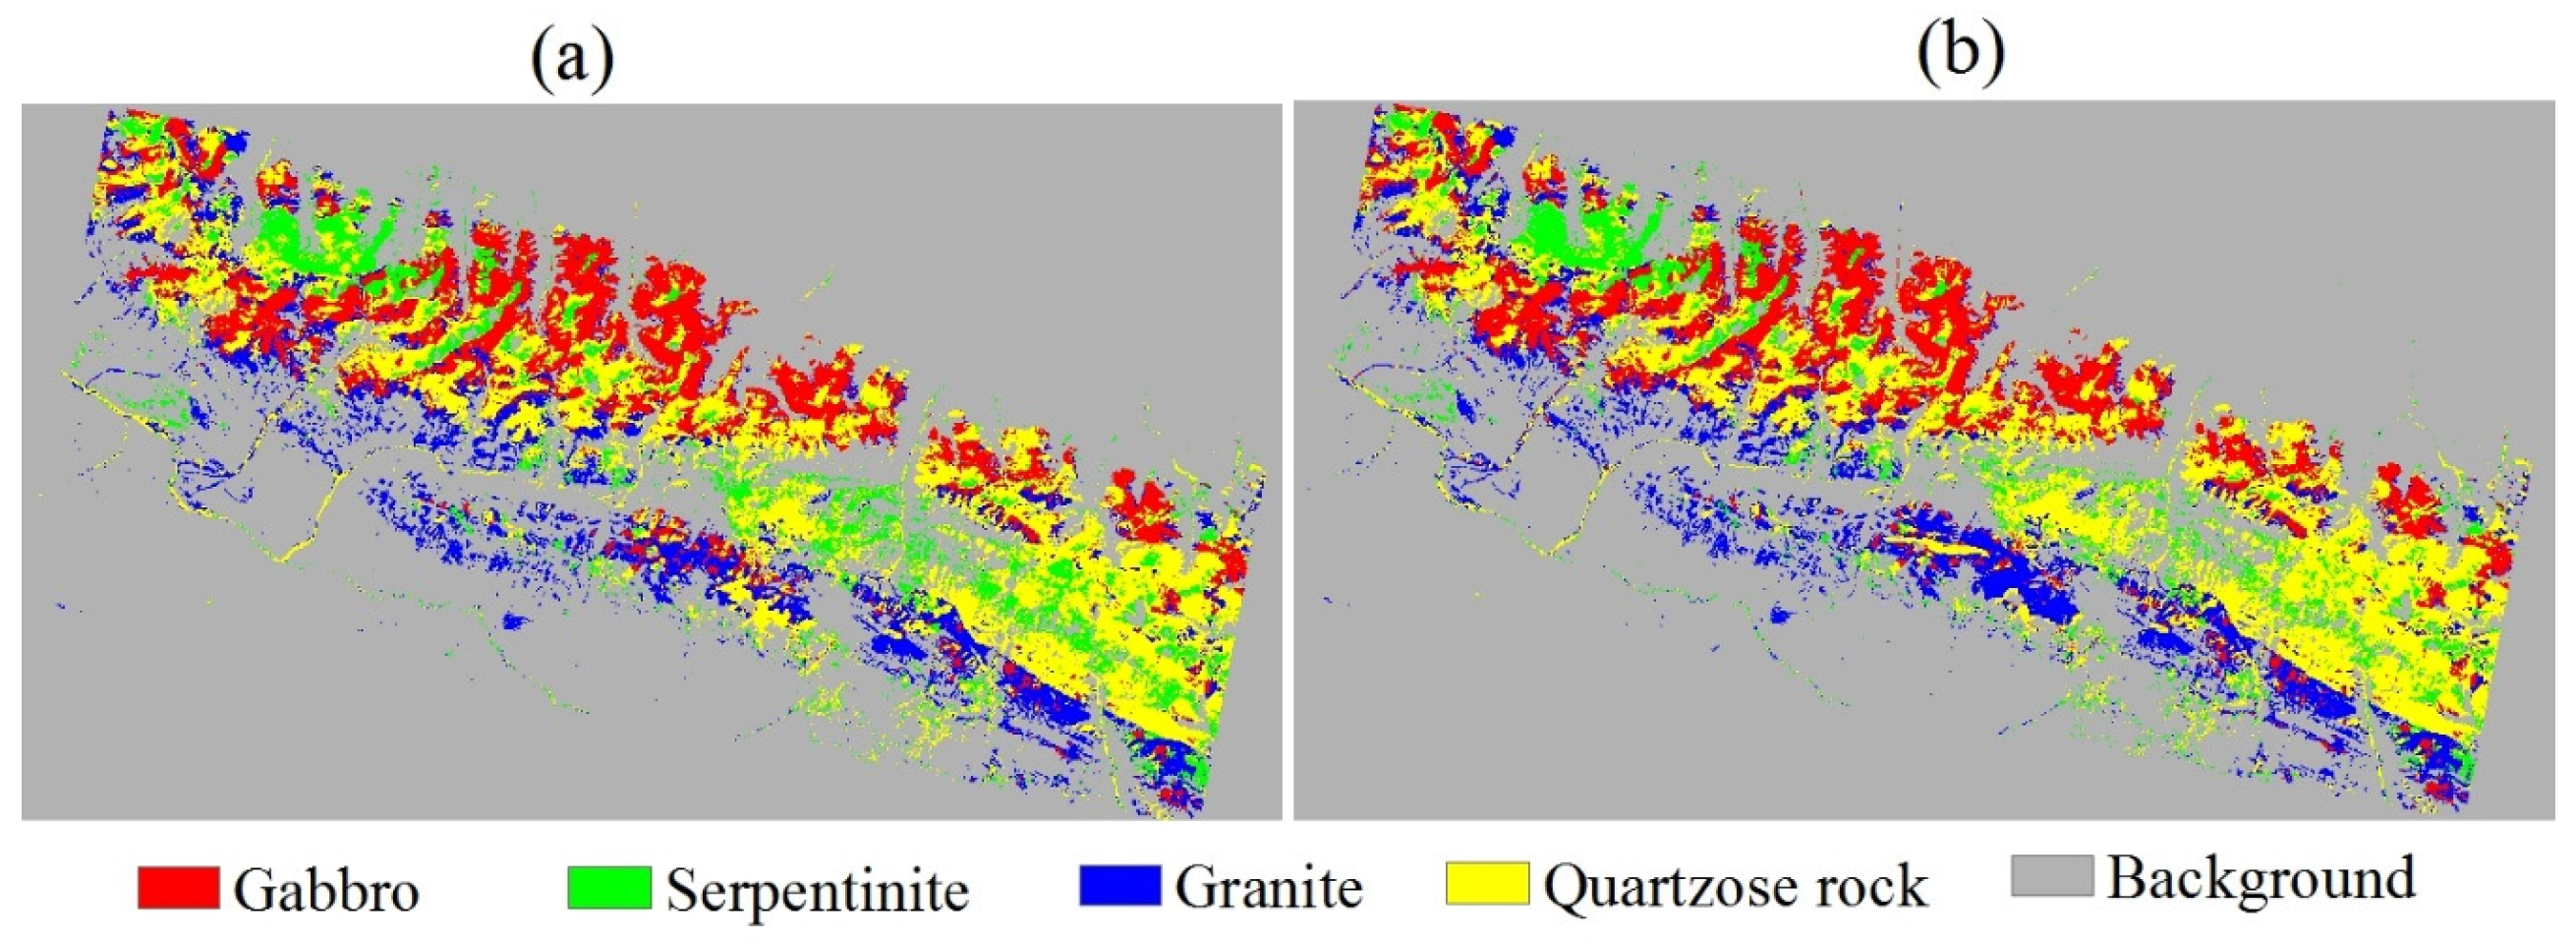
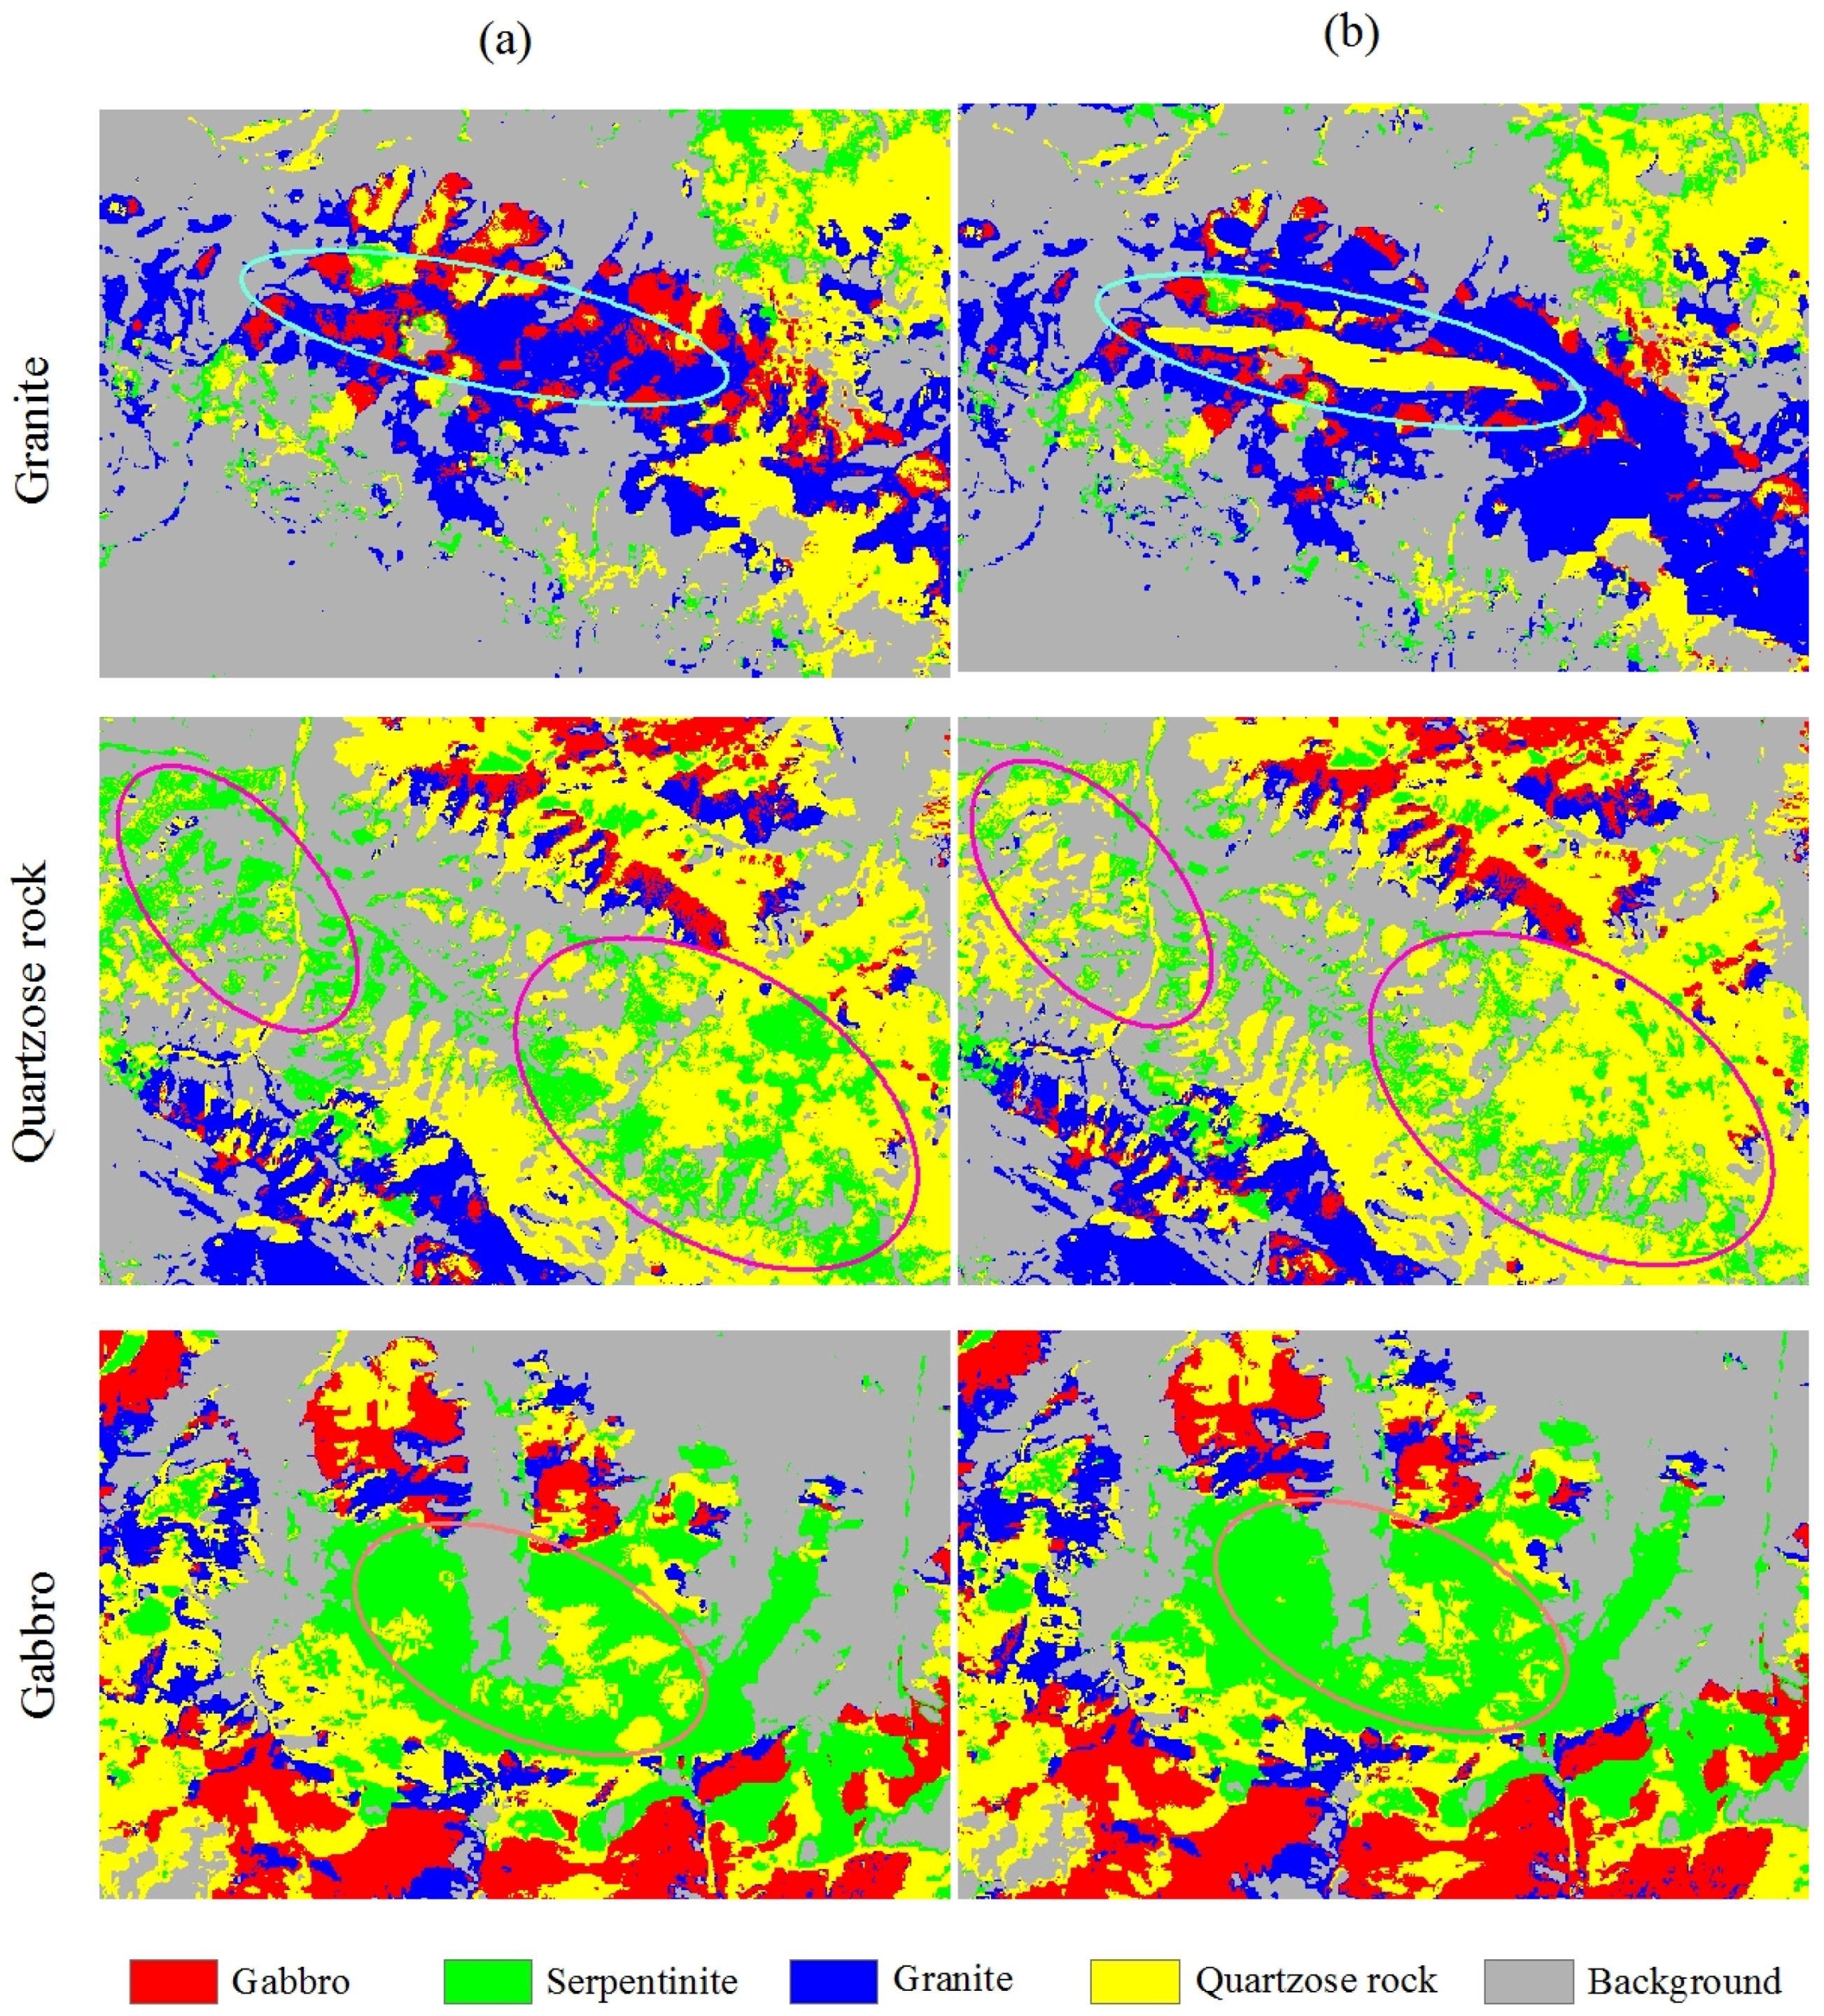
4.2. Lithological Classification Using Selected Features
5. Conclusions
Acknowledgments
Author Contributions
Conflicts of Interest
References
- BenDor, E.; Inbar, Y.; Chen, Y. The reflectance spectra of organic matter in the visible near-infrared and short wave infrared region (400–2500 nm) during a controlled decomposition process. Remote Sens. Environ. 1997, 61, 1–15. [Google Scholar] [CrossRef]
- Grove, C.I.; Hook, S.J.; Paylor, E.D. Laboratory Reflectance Spectrum of 160 Minerals, 0.4–2.5 Micron; JPL Publication 92-2; Jet Propulsion Laboratory: La Cañada Flintridge, CA, USA, 2010. [Google Scholar]
- Abrams, M.; Goetz, A.; Kahle, A.; Ashley, R.; Rowan, L. Mapping of hydrothermal alteration in the Cuprite mining district, Nevada, using aircraft scanner images for the spectral region 0.46 to 2.36 μm. Geology 1978, 5, 713–718. [Google Scholar] [CrossRef]
- Thompson, A.J.B.; Hauff, P.L.; Robitaille, A.J. Alteration mapping in exploration: Application of short-wave infrared SWIR spectroscopy. Soc. Econ. Geol. 1999, 39, 16–27. [Google Scholar]
- Ninomiya, Y.; Fu, B. Quartz Index, Carbonate index and SiO2 content index defined for ASTER TIR data. J. Remote Sens. Soc. Jpn. 2002, 22, 50–61. [Google Scholar]
- Rockwell, B.W.; Hofstra, A.H. Identification of quartz and carbonate minerals across northern Nevada using ASTER thermal infrared emissivity data—Implications for geologic mapping and mineral resource investigations in well-studied and frontier areas. Geosphere 2008, 4, 992–992. [Google Scholar] [CrossRef]
- Oztan, N.S.; Suzen, M.L. Mapping evaporate minerals by ASTER. Int. J. Remote Sens. 2011, 32, 1651–1673. [Google Scholar] [CrossRef]
- Bertoldi, L.; Massironi, M.; Visona, D.; Carosi, R.; Montomoli, C.; Gubert, F.; Naletto, G.; Pelizzo, M.G. Mapping the Buraburi granite in the Himalaya of Western Nepal: Remote sensing analysis in a collisional belt with vegetation cover and extreme variation of topography. Remote Sens. Environ. 2011, 115, 1129–1144. [Google Scholar] [CrossRef]
- Honarmand, M.; Ranjbar, H.; Shahabpour, J. Application of principal component analysis and spectral angle mapper in the mapping of hydrothermal alteration in the Jebal-Barez area, southeastern Iran. Resour. Geol. 2012, 62, 119–139. [Google Scholar] [CrossRef]
- Pournamdari, M.; Hashim, M. Detection of chromite bearing mineralized zones in Abdasht ophiolite complex using ASTER and ETM+ remote sensing data. Arab. J. Geosci. 2014, 7, 1973–1983. [Google Scholar] [CrossRef]
- Ding, C.; Li, X.Q.; Liu, X.N.; Zhao, L.T. Quartzose-mafic spectral feature space model: A methodology for extracting felsic rocks with ASTER thermal infrared radiance data. Ore Geol. Rev. 2015, 66, 283–292. [Google Scholar] [CrossRef]
- Peres, L.F.; Dacamara, C.C. Land surface temperature and emissivity estimation based on the two-temperature method: Sensitivity analysis using simulated MSG/SEVIRI data. Remote Sens. Environ. 2004, 91, 377–389. [Google Scholar] [CrossRef]
- Chen, X.; Warner, T.A.; Campagna, D.J. Integrating visible, near-infrared and short-wave infrared hyperspectral and multispectral thermal imagery for geological mapping at Cuprite, Nevada. Remote Sens. Environ. 2007, 110, 344–356. [Google Scholar] [CrossRef]
- Li, Z.L.; Tang, B.H.; Wu, H.; Ren, H.; Yan, G.; Wan, Z.; Trigo, I.F.; Sobrino, J.A. Satellite-derived land surface temperature: Current status and perspectives. Remote Sens. Environ. 2013, 131, 14–37. [Google Scholar] [CrossRef]
- Collins, A.H. Thermal infrared-spectra and images of altered volcanic-rocks in the virginia range, Nevada. Int. J. Remote Sens. 1991, 12, 1559–1574. [Google Scholar] [CrossRef]
- Hook, S.J.; Gabell, A.R.; Green, A.A.; Kealy, P.S. A comparison of techniques for extracting emissivity information from thermal infrared data for geologic studies. Remote Sens. Environ. 1992, 42, 123–135. [Google Scholar] [CrossRef]
- Satterwhite, M.B.; Henley, J.P.; Carney, J.M. Effects of lichens on the reflectance spectra of granitic rock surfaces. Remote Sens. Environ. 1985, 18, 105–112. [Google Scholar] [CrossRef]
- An, P.; Chung, C.F.; Rencz, A.N. Digital lithology mapping from airborne geophysical and remote sensing data in the Melville Peninsula, Northern Canada, using a neural network approach. Remote Sens. Environ. 1995, 53, 76–84. [Google Scholar] [CrossRef]
- Ryherd, S.; Woodcock, C. Combining spectral and texture data in the segmentation of remotely sensed images. Photogramm. Eng. Remote Sens. 1996, 62, 181–194. [Google Scholar]
- Sabins, F.F. Remote sensing for mineral exploration. Ore Geol. Rev. 1999, 14, 157–183. [Google Scholar] [CrossRef]
- Grebby, S.; Cunningham, D.; Naden, J.; Tansey, K. Lithological mapping of the Troodos ophiolite, Cyprus, using airborne LiDAR topographic data. Remote Sens. Environ. 2010, 114, 713–724. [Google Scholar] [CrossRef]
- Van der Meer, F.D.; Van der Werff, H.M.A.; Van Ruitenbeek, F.J.A.; Hecker, C.A.; Bakker, W.H.; Noomen, M.F.; Van der Meijde, M.; Carranza, E.J.M.; Smeth, J.B.D.; Woldai, T. Multi- and hyperspectral geologic remote sensing: A review. Int. J. Appl. Earth Obs. 2012, 14, 112–128. [Google Scholar] [CrossRef]
- Othman, A.; Gloaguen, R. Comparison of Different Machine Learning Algorithms for Lithological Mapping Using Remote Sensing Data and Morphological Features: A Case Study in Kurdistan Region, NE Iraq; EGU: Munich, Germany, 2015. [Google Scholar]
- Haralick, R.M.; Shanmugam, K.; Dinstein, I.H. Textural features for image classification. IEEE Trans. Syst. Man Cybern. 1973, 3, 610–621. [Google Scholar] [CrossRef]
- Barber, D.G.; Ledrew, E.F. SAR sea ice discrimination using texture statistics—A multivariate approach. Photogramm. Eng. Remote. Sens. 1991, 57, 385–395. [Google Scholar]
- Coburn, C.A.; Roberts, A.C.B. A multiscale texture analysis procedure for improved forest stand classification. Int. J. Remote Sens. 2004, 25, 4287–4308. [Google Scholar] [CrossRef]
- Su, H.; Wang, Y.; Xiao, J.; Yan, X.-H. Classification of MODIS images combining surface temperature and texture features using the Support Vector Machine method for estimation of the extent of sea ice in the frozen Bohai Bay, China. Int. J. Remote Sens. 2015, 36, 2734–2750. [Google Scholar]
- Fan, H. Land-cover mapping in the Nujiang Grand Canyon: Integrating spectral, textural, and topographic data in a random forest classifier. Int. J. Remote Sens. 2013, 34, 7545–7567. [Google Scholar] [CrossRef]
- Kittler, J. Processing for Remote Sensing. Philos. Trans. R. Soc. Lond. 1983, 309, 323–335. [Google Scholar] [CrossRef]
- Wood, E.M.; Pidgeon, A.M.; Radeloff, V.C.; Keuler, N.S. Image texture as a remotely sensed measure of vegetation structure. Remote Sens. Environ. 2012, 121, 516–526. [Google Scholar] [CrossRef]
- Mather, P.M.; Tso, B.; Koch, M. An evaluation of Landsat TM spectral data and SAR-derived textural information for lithological discrimination in the Red Sea Hills, Sudan. Int. J. Remote Sens. 1998, 19, 587–604. [Google Scholar] [CrossRef]
- Chica-Olmo, M.; Abarca-Hernández, F. Computing geostatistical image texture for remotely sensed data classification. Comput. Geosci. 2000, 26, 373–383. [Google Scholar] [CrossRef]
- Franklin, S.E.; Maudie, A.J.; Lavigne, M.B. Using spatial co-occurrence texture to increase forest structure and species composition classification accuracy. Photogramm. Eng. Remote Sens. 2001, 67, 849–855. [Google Scholar]
- Li, P.; Li, Z.; Moon, W.M. Lithological discrimination of Altun area in northwest China using Landsat TM data and geostatistical textural information. Geosci. J. 2001, 5, 293–300. [Google Scholar] [CrossRef]
- Corresponding, P.D.; Leblon, B. Rock unit discrimination on Landsat TM, SIR-C and Radarsat images using spectral and textural information. Int. J. Remote Sens. 2004, 25, 3745–3768. [Google Scholar]
- Jakob, S.; Bühler, B.; Gloaguen, R.; Breitkreuz, C.; Ali Eliwa, H.; El Gameel, K. Remote sensing based improvements of the geological maps of the Neoproterozoic Ras Gharib segment in the Easter Desert (NE-Egypt) using texture features. J. Afr. Earth Sci. 2015, 111, 138–147. [Google Scholar] [CrossRef]
- Qari, M. Application of landsat TM data to geological studies, al-khabt area, southern arabian shield. Photogramm. Eng. Remote Sens. 1991, 57, 421–429. [Google Scholar]
- Nalbant, S.S.; Alptekin, O. The use of Landsat Thematic Mapper imagery for analyzing lithology and structure of korucu-dugla area in western turkey. Int. J. Remote Sens. 1995, 16, 2357–2374. [Google Scholar] [CrossRef]
- Rajesh, H.M. Mapping Proterozoic unconformity-related uranium deposits in the Rockhole area, Northern Territory, Australia using landsat ETM. Ore Geol. Rev. 2008, 33, 382–396. [Google Scholar] [CrossRef]
- Pan, W.; Ni, G.; Li, H. A study of RS image landform frame and lithologic component decomposing algorithm and multifractal feature of rock types. Earth Sci. Front. 2009, 16, 248–256. [Google Scholar] [CrossRef]
- Wang, X.; Niu, R.; Wu, T. Research on lithology intelligent classification for Three Gorges Reservoir area. Rock Soil Mech. 2010, 31, 2946–2950. [Google Scholar]
- Xiong, Y.; Khan, S.D.; Mahmood, K.; Sisson, V.B. Lithological mapping of Bela ophiolite with remote-sensing data. Int. J. Remote Sens. 2011, 32, 4641–4658. [Google Scholar] [CrossRef]
- Zoheir, B.; Emam, A. Integrating geologic and satellite imagery data for high-resolution mapping and gold exploration targets in the South Eastern Desert, Egypt. J. Afr. Earth Sci. 2012, 66–67, 22–34. [Google Scholar] [CrossRef]
- He, J.; Harris, J.R.; Sawada, M.; Behnia, P. A comparison of classification algorithms using Landsat-7 and Landsat-8 data for mapping lithology in Canada’s Arctic. Int. J. Remote Sens. 2015, 36, 2252–2276. [Google Scholar] [CrossRef]
- Roy, D.P.; Wulder, M.A.; Loveland, T.R.; Woodcock, C.E.; Allen, R.G.; Anderson, M.C.; Helder, D.; Irons, J.R.; Johnson, D.M.; Kennedy, R.; et al. Landsat-8: Science and product vision for terrestrial global change research. Remote Sens. Environ. 2014, 145, 154–172. [Google Scholar] [CrossRef]
- United States Geological Survey (USGS) and Earth Resources Observation and Science (EROS) data center. Available online: http://glovis.usgs.gov/ (accessed on 6 May 2016).
- Marceau, D.J.; Howarth, P.J.; Dubois, J.M.M.; Gratton, D.J. Evaluation of The Grey-level Co-Occurrence Matrix Method for Land-Cover Classification Using Spot Imagery. IEEE Trans. Geosci. Remote Sens. 1990, 28, 513–519. [Google Scholar] [CrossRef]
- Cai, S.; Zhang, R.; Liu, L.; Zhou, D. A method of salt-affected soil information extraction based on a support vector machine with texture features. Math. Comput. Model. 2010, 51, 1319–1325. [Google Scholar] [CrossRef]
- Ding, C.; Liu, X.; Liu, W.; Liu, M.; Li, Y. Mafic-ultramafic and quartz-rich rock indices deduced from ASTER thermal infrared data using a linear approximation to the Planck function. Ore Geol. Rev. 2014, 60, 161–173. [Google Scholar] [CrossRef]
- Mandelbrot, B.B. Fractals: Form, Chance and Dimension; W.H. Freeman and Company: San Francisco, CA, USA, 1977. [Google Scholar]
- Lam, N.S.-N.; Cola, L.D. Fractals in Geography; Prentice Hall: Englewood Cliffs, NJ, USA, 1993. [Google Scholar]
- Sun, W.; Xu, G.; Liang, P.G.S. Fractal analysis of remotely sensed images: A review of methods and applications. Int. J. Remote Sens. 2006, 27, 4963–4990. [Google Scholar] [CrossRef]
- Myint, S.W. Fractal approaches in texture analysis and classification of remotely sensed data: Comparisons with spatial autocorrelation techniques and simple descriptive statistics. Int. J. Remote Sens. 2003, 24, 1925–1947. [Google Scholar] [CrossRef]
- Goodchild, M.F. Fractals and the accuracy of geographical measures. Math. Geol. 1980, 12, 85–98. [Google Scholar] [CrossRef]
- Proctor, C.; He, Y.; Robinson, V. Texture augmented detection of macrophyte species using decision trees. ISPRS J. Photogramm. 2013, 80, 10–20. [Google Scholar] [CrossRef]
- Richards, J.A. Remote Sensing Digital Image Analysis: An Introduction; Springer: Heidelberg, Germany, 1986; pp. 47–54. [Google Scholar]
- Adam, E.; Mutanga, O. Spectral discrimination of papyrus vegetation (Cyperus papyrus L.) in swamp wetlands using field spectrometry. ISPRS J. Photogramm. 2009, 64, 612–620. [Google Scholar] [CrossRef]
- Ma, N.; Hu, Y.; Zhuang, D.; Wang, X. Determination on the optimum band combination of HJ-1A hyperspectral data in the case region of dongguan based on optimum index factor and J–M distance. Remote Sens. Technol. Appl. 2010, 25, 358–365. [Google Scholar]
- Boser, B.E.; Guyon, I.M.; Vapnik, V.N. A training algorithm for optimal margin classifiers. In Proceedings of the Fifth Annual Workshop on Computational Learning Theory, Pittsburgh, PA, USA, 27–29 July 1992.
- Cortes, C.; Vapnik, V. Support-vector networks. Mach. Learn. 1995, 20, 273–297. [Google Scholar] [CrossRef]
- Schölkopf, B.; Burges, C.; Vapnik, V. Extracting support data for a given task. In Proceedings of the First International Conference on Knowledge Discovery and Data Mining, Montreal, PQ, Canada, 20–21 August 1995; AAAI Press: palo alto, CA, USA; pp. 252–257.
- Vapnik, V.N. The Vicinal Risk Minimization Principle and the SVMs. In The Nature of Statistical Learning Theory, 2nd ed.; Springer: Heidelberg, Germany, 1999. [Google Scholar]
- Mukherjee, S.; Osuna, E.; Girosi, F. Nonlinear prediction of chaotic time series using support vector machines. In Proceedings of the IEEE Workshop on Neural Networks for Signal Processing VII, Amelia Island, FL, USA, 24–26 September 1997; pp. 511–520.
- Osuna, E.; Freund, R.; Girosi, F.; Ieee Comp, S.O.C. Training support vector machines: An application to face detection. In Proceedings of the IEEE Computer Society Conference on Computer Vision and Pattern Recognition, San Juan, Puerto Rico, USA, 17–19 June 1997; pp. 130–136.
- Cai, Y.D.; Zhou, G.P.; Chou, K.C. Support vector machines for predicting membrane protein types by using functional domain composition. Biophys. J. 2003, 84, 3257–3263. [Google Scholar] [CrossRef]
- Akay, M.F. Support vector machines combined with feature selection for breast cancer diagnosis. Expert Syst. Appl. 2009, 36, 3240–3247. [Google Scholar] [CrossRef]
- Azar, A.T.; El-Said, S.A. Performance analysis of support vector machines classifiers in breast cancer mammography recognition. Neural Comput. Appl. 2014, 24, 1163–1177. [Google Scholar] [CrossRef]
- Waske, B.; Van, D.L.S. Classifying multilevel imagery from SAR and optical sensors by decision fusion. IEEE Trans. Geosci. Remote Sens. 2008, 46, 1457–1466. [Google Scholar] [CrossRef]
- Chen, Y.Q.; Bi, G. On texture classification using fractal dimension. Int. J. Pattern Recognit. Artif. Intell. 1999, 13, 929–943. [Google Scholar] [CrossRef]


| Band Description | Wavelength () | Spatial Resolution (m) |
|---|---|---|
| Band 1 Coastal | 0.433–0.453 | 30 |
| Band 2 Blue | 0.450–0.515 | |
| Band 3 Green | 0.525–0.600 | |
| Band 4 Red | 0.630–0.680 | |
| Band 5 NIR | 0.845–0.885 | |
| Band 6 SWIR 1 | 1.560–1.660 | |
| Band 7 SWIR 2 | 2.100–2.300 | |
| Band 8 Pan | 0.500–0.680 | 15 |
| Rank | Series 1 | Series 2 | Series 3 | Series 4 | Series 5 | Series 6 | Series 7 |
|---|---|---|---|---|---|---|---|
| 1 | SF + TF1 | SF + TF12 | SF + TF123 | SF + TF1234 | SF + TF12345 | SF + TF123456 | SF + TF1–7 |
| 2 | SF + TF2 | SF + TF13 | SF + TF124 | SF + TF1235 | SF + TF12346 | SF + TF123457 | - |
| 3 | SF + TF3 | SF + TF14 | SF + TF125 | SF + TF1236 | SF + TF12347 | SF + TF123467 | - |
| 4 | SF + TF4 | SF + TF15 | SF + TF126 | SF + TF1237 | SF + TF12356 | SF + TF123567 | - |
| 5 | SF + TF5 | SF + TF16 | SF + TF127 | SF + TF1245 | SF + TF12357 | SF + TF124567 | - |
| 6 | SF + TF6 | SF + TF17 | SF + TF134 | SF + TF1246 | SF + TF12367 | SF + TF134567 | - |
| 7 | SF + TF7 | SF + TF23 | SF + TF135 | SF + TF1247 | SF + TF12456 | SF + TF234567 | - |
| 8 | - | SF + TF24 | SF + TF136 | SF + TF1256 | SF + TF12457 | - | - |
| 9 | - | SF + TF25 | SF + TF137 | SF + TF1257 | SF + TF12467 | - | - |
| 10 | - | SF + TF26 | SF + TF145 | SF + TF1267 | SF + TF12567 | - | - |
| 11 | - | SF + TF27 | SF + TF146 | SF + TF1345 | SF + TF13456 | - | - |
| 12 | - | SF + TF34 | SF + TF147 | SF + TF1346 | SF + TF13457 | - | - |
| 13 | - | SF + TF35 | SF + TF156 | SF + TF1347 | SF + TF13467 | - | - |
| 14 | - | SF + TF36 | SF + TF157 | SF + TF1356 | SF + TF13567 | - | - |
| 15 | - | SF + TF37 | SF + TF167 | SF + TF1357 | SF + TF14567 | - | - |
| 16 | - | SF + TF45 | SF + TF234 | SF + TF1367 | SF + TF23456 | - | - |
| 17 | - | SF + TF46 | SF + TF235 | SF + TF1456 | SF + TF23457 | - | - |
| 18 | - | SF + TF47 | SF + TF236 | SF + TF1457 | SF + TF23467 | - | - |
| 19 | - | SF + TF56 | SF + TF237 | SF + TF1467 | SF + TF23567 | - | - |
| 20 | - | SF + TF57 | SF + TF245 | SF + TF1567 | SF + TF24567 | - | - |
| 21 | - | SF + TF67 | SF + TF246 | SF + TF2345 | SF + TF34567 | - | - |
| 22 | - | - | SF + TF247 | SF + TF2346 | - | - | - |
| 23 | - | - | SF + TF256 | SF + TF2347 | - | - | - |
| 24 | - | - | SF + TF257 | SF + TF2356 | - | - | - |
| 25 | - | - | SF + TF267 | SF + TF2357 | - | - | - |
| 26 | - | - | SF + TF345 | SF + TF2367 | - | - | - |
| 27 | - | - | SF + TF346 | SF + TF2456 | - | - | - |
| 28 | - | - | SF + TF347 | SF + TF2457 | - | - | - |
| 29 | - | - | SF + TF356 | SF + TF2467 | - | - | - |
| 30 | - | - | SF + TF357 | SF + TF2567 | - | - | - |
| 31 | - | - | SF + TF367 | SF + TF3456 | - | - | - |
| 32 | - | - | SF + TF456 | SF + TF3457 | - | - | - |
| 33 | - | - | SF + TF457 | SF + TF3467 | - | - | - |
| 34 | - | - | SF + TF467 | SF + TF3567 | - | - | - |
| 35 | - | - | SF + TF567 | SF + TF4567 | - | - | - |
| Pairwise Rocks | Series 1 | Series 2 | Series 3 | Series 4 | Series 5 | Series 6 | Series 7 |
|---|---|---|---|---|---|---|---|
| Ga–Se | SF + TF4 | SF + TF47 | SF + TF467 | SF + TF4567 | SF + TF14567 | SF + TF124567 | SF + TF1–7 |
| Ga–Gr | SF + TF3 | SF + TF15 | SF + TF367 | SF + TF1345 | SF + TF13457 | SF + TF123457 | SF + TF1–7 |
| Ga–Qu | SF + TF2 | SF + TF23 | SF + TF234 | SF + TF2367 | SF + TF23567 | SF + TF234567 | SF + TF1–7 |
| Se–Gr | SF + TF4 | SF + TF45 | SF + TF146 | SF + TF1467 | SF + TF12467 | SF + TF123467 | SF + TF1–7 |
| Se–Qu | SF + TF4 | SF + TF45 | SF + TF456 | SF + TF2456 | SF + TF12456 | SF + TF124567 | SF + TF1–7 |
| Gr–Qu | SF + TF6 | SF + TF67 | SF + TF235 | SF + TF2367 | SF + TF23567 | SF + TF123567 | SF + TF1–7 |
| Class | Gabbro | Serpentinite | Granite | Quartzose Rock | Total | |||
| Gabbro | 730 | 0 | 87 | 97 | 914 | |||
| Serpentinite | 0 | 250 | 0 | 93 | 343 | |||
| Granite | 26 | 85 | 120 | 553 | 784 | |||
| Quartzose rock | 13 | 0 | 120 | 39 | 172 | |||
| Total | 769 | 335 | 327 | 782 | 2213 | |||
| Overall accuracy: 74.69%; κ: 0.6366 | ||||||||
| Class | Product Accuracy (%) | User Accuracy (%) | Commission (%) | Omission (%) | ||||
| Gabbro | 94.93 (730/769) | 79.87 (730/914) | 20.13 (184/914) | 5.07 (39/769) | ||||
| Serpentinite | 74.63 (250/335) | 72.89 (250/343) | 27.11 (93/343) | 25.37 (85/335) | ||||
| Granite | 36.70 (120/327) | 69.77 (120/172) | 30.23 (52/172) | 63.30 (207/327) | ||||
| Quartzose rock | 70.72 (553/782) | 70.54 (553/784) | 29.46 (231/784) | 29.28 (229/782) | ||||
| Class | Gabbro | Serpentinite | Granite | Quartzose Rock | Total | |||
| Gabbro | 731 | 0 | 120 | 45 | 896 | |||
| Serpentinite | 0 | 267 | 29 | 0 | 296 | |||
| Granite | 32 | 68 | 608 | 35 | 743 | |||
| Quartzose rock | 6 | 0 | 25 | 247 | 278 | |||
| Total | 769 | 335 | 782 | 327 | 2213 | |||
| Overall accuracy: 83.73%; κ: 0.7682 | ||||||||
| Class | Product Accuracy (%) | User Accuracy (%) | Commission (%) | Omission (%) | ||||
| Gabbro | 95.06 (731/769) | 81.58 (731/896) | 18.42 (165/896) | 4.94 (38/769) | ||||
| Serpentinite | 79.7 (267/335) | 90.2 (267/296) | 9.8 (29/296) | 20.3 (68/335) | ||||
| Granite | 77.75 (608/782) | 81.83 (608/743) | 18.17 (135/743) | 22.25 (174/782) | ||||
| Quartzose rock | 75.54 (247/327) | 88.85 (247/278) | 11.15 (31/278) | 24.46 (80/327) | ||||
© 2016 by the authors; licensee MDPI, Basel, Switzerland. This article is an open access article distributed under the terms and conditions of the Creative Commons Attribution (CC-BY) license (http://creativecommons.org/licenses/by/4.0/).
Share and Cite
Wei, J.; Liu, X.; Liu, J. Integrating Textural and Spectral Features to Classify Silicate-Bearing Rocks Using Landsat 8 Data. Appl. Sci. 2016, 6, 283. https://doi.org/10.3390/app6100283
Wei J, Liu X, Liu J. Integrating Textural and Spectral Features to Classify Silicate-Bearing Rocks Using Landsat 8 Data. Applied Sciences. 2016; 6(10):283. https://doi.org/10.3390/app6100283
Chicago/Turabian StyleWei, Jiali, Xiangnan Liu, and Jilei Liu. 2016. "Integrating Textural and Spectral Features to Classify Silicate-Bearing Rocks Using Landsat 8 Data" Applied Sciences 6, no. 10: 283. https://doi.org/10.3390/app6100283
APA StyleWei, J., Liu, X., & Liu, J. (2016). Integrating Textural and Spectral Features to Classify Silicate-Bearing Rocks Using Landsat 8 Data. Applied Sciences, 6(10), 283. https://doi.org/10.3390/app6100283