1. Introduction
The generation of subfemtosecond pulses would extend the horizon of ultrafast measurements to the time scale of electronic motion. Remarkable progress has been made toward generation and characterization of ever-shorter pulses in the short-wavelength spectral region. For example, a single isolated attosecond (as) pulse of 67 as was composed from an extreme UV supercontinuum covering 55–130 eV generated by the double optical gating technique [
1].
On the other hand, a few-femtosecond pulse in the optical region would have a great deal of potential in the research of ultrafast science and technology [
2,
3]. There have been several techniques developed to achieve sub-cycle ultrashort pulses. For example, a subcycle field transient, which spans the infrared, visible, and ultraviolet spectral regions, was produced with a 1.5-octave three-channel optical field synthesizer by Wirth
et al. [
4]. The 2.4 fs transient was focused into a krypton-gas cell to trigger sub-femtosecond electron motion. In another approach, based on cascaded four wave mixing (CFWM), Imasaka’s group reported a high energy multicolored femtosecond pulse generated in a hydrogen-filled gas cell and hollow fiber [
5]. Moreover, Kung’s group reported a multi-watt broadband continuous-wave multi-harmonic optical comb based on a frequency division-by-three singly-resonant optical parametric oscillator [
6].
Another light source that delivers sub-fs pulses with a spectrum centered on the visible region has been developed and ultimately may lead to optical arbitrary waveform generation (OAWG) [
7]. The light source is based on what has been called “molecular modulation” [
8,
9], which shares visual similarities with the approach for the generation of ultrashort optical pulses proposed by Yoshikawa and Imasaka [
10]. It has been predicted that coherent molecular oscillations can produce laser frequency modulation (FM), with a total bandwidth extending over the infrared, visible, and ultraviolet spectral regions, and with the possibility of sub-femtosecond pulse compression [
8]. The technique utilizes ideas of electromagnetically induced transparency (EIT) and relies on adiabatic preparation of maximal molecular coherence. The coherence is established by driving the molecular transition with two single-mode laser fields, slightly detuned from the Raman resonance so as to excite a single molecular eigenstate. Molecular oscillation, in turn, modulates the driving laser frequencies, causing the collinear generation of a very broad FM-like spectrum. This broadband light is inherently coherent and allows for sub-femtosecond (attosecond) pulse compression in the visible-UV range. Although attosecond pulses with wavelengths in the extreme ultraviolet and soft-X-ray pulses have been obtained by high-harmonic generation (HHG), the molecular modulation technique has the potential for generating high-energy sub-femtosecond pulses in the soft UV range, which will enable new experiments that exploit electronic resonances in molecules.
In recent years, several groups have made substantial advances in molecular modulation. For example, Kung’s group achieved absolute phase control of five discrete optical harmonics (two pump beams and three generated Raman sidebands from H
2 gas), and thus demonstrated the synthesis and measurement of ultrafast waveforms such as square and saw-tooth fields [
7]. Katsuragawa’s group reported the carrier envelope offset control of octave-spanning Raman comb by using dual-frequency laser radiation locked on a single laser cavity and, simultaneously, its second harmonic [
11]. Broadband spectra based on multifrequency Raman generation were also studied in photonic crystal fiber [
12] and hollow fibers filled with SF6 [
13]. Meanwhile, the molecular modulation method has been extended to the continuous-wave (CW) domain. For example, Yavuz’s group has studied CW—stimulated Raman scattering (SRS) inside a high-finesse cavity and demonstrated a continuous-wave optical modulator at 90 THz [
14]. Generation of a phase-locked Raman frequency comb has been demonstrated recently in a simple setup consisting of a microchip laser as pump source and two hydrogen-filled hollow-core photonic crystal fibers [
15].
Molecular modulation in gas produces high repetition rate, low-energy pulse trains [
16]. However, high energy, isolated pulses are generally more useful in studies of ultrafast phenomena. To this end, we have extended the molecular modulation technique to a qualitatively different time regime and to a different state of medium—Raman-active crystals driven by femtosecond pulses. We have demonstrated the mutual coherence of the spectral sidebands generated through molecular modulation in diamond and shown the capability to control spectral phases in a precise and stable manner in a setup that combined manual course adjustment of individual sideband phases with programmable pulse shaping and fine phase (and amplitude) tuning across the full spectrum [
17,
18]. Recently, we studied coherent transfer of optical orbital angular momentum in multi-order Raman sideband generation [
19,
20]. The energy of the ultrafast waveform produced in the scheme of References [
17,
18] is limited by the damage threshold of the pulse shaper. In order to obtain high energy ultrafast waveforms, we design a reflection scheme using spherical mirrors to combine the Raman sidebands [
21]. The sidebands and the driving pulses are refocused back to the Raman crystal and the relative spectral phases are retrieved from an interferogram based on nonlinear Raman interaction. Furthermore, using a deformable mirror (DM) to adjust the spectral phases, we demonstrate that the setup is capable of synthesizing ultrafast waveforms using coherent Raman sidebands.
In this paper, we review and expand on our recent work [
21]. We start by describing the algorithm used to retrieve the spectral phases from a two-sideband-interferogram, giving the details of our theoretical simulation of Reference [
21]. The method is then extended into the scenario of the interferogram composed of more sidebands; we show the standard deviation of the simulation
vs. original interferogram.
3. Results and Discussion
In the reflection scheme, by recording the spectrum as a function of time delay, we obtained an interferogram based on coherent Raman scattering. In this paper, we describe our procedure to retrieve the spectral phases from the inteferogram by using a theoretical simulation.
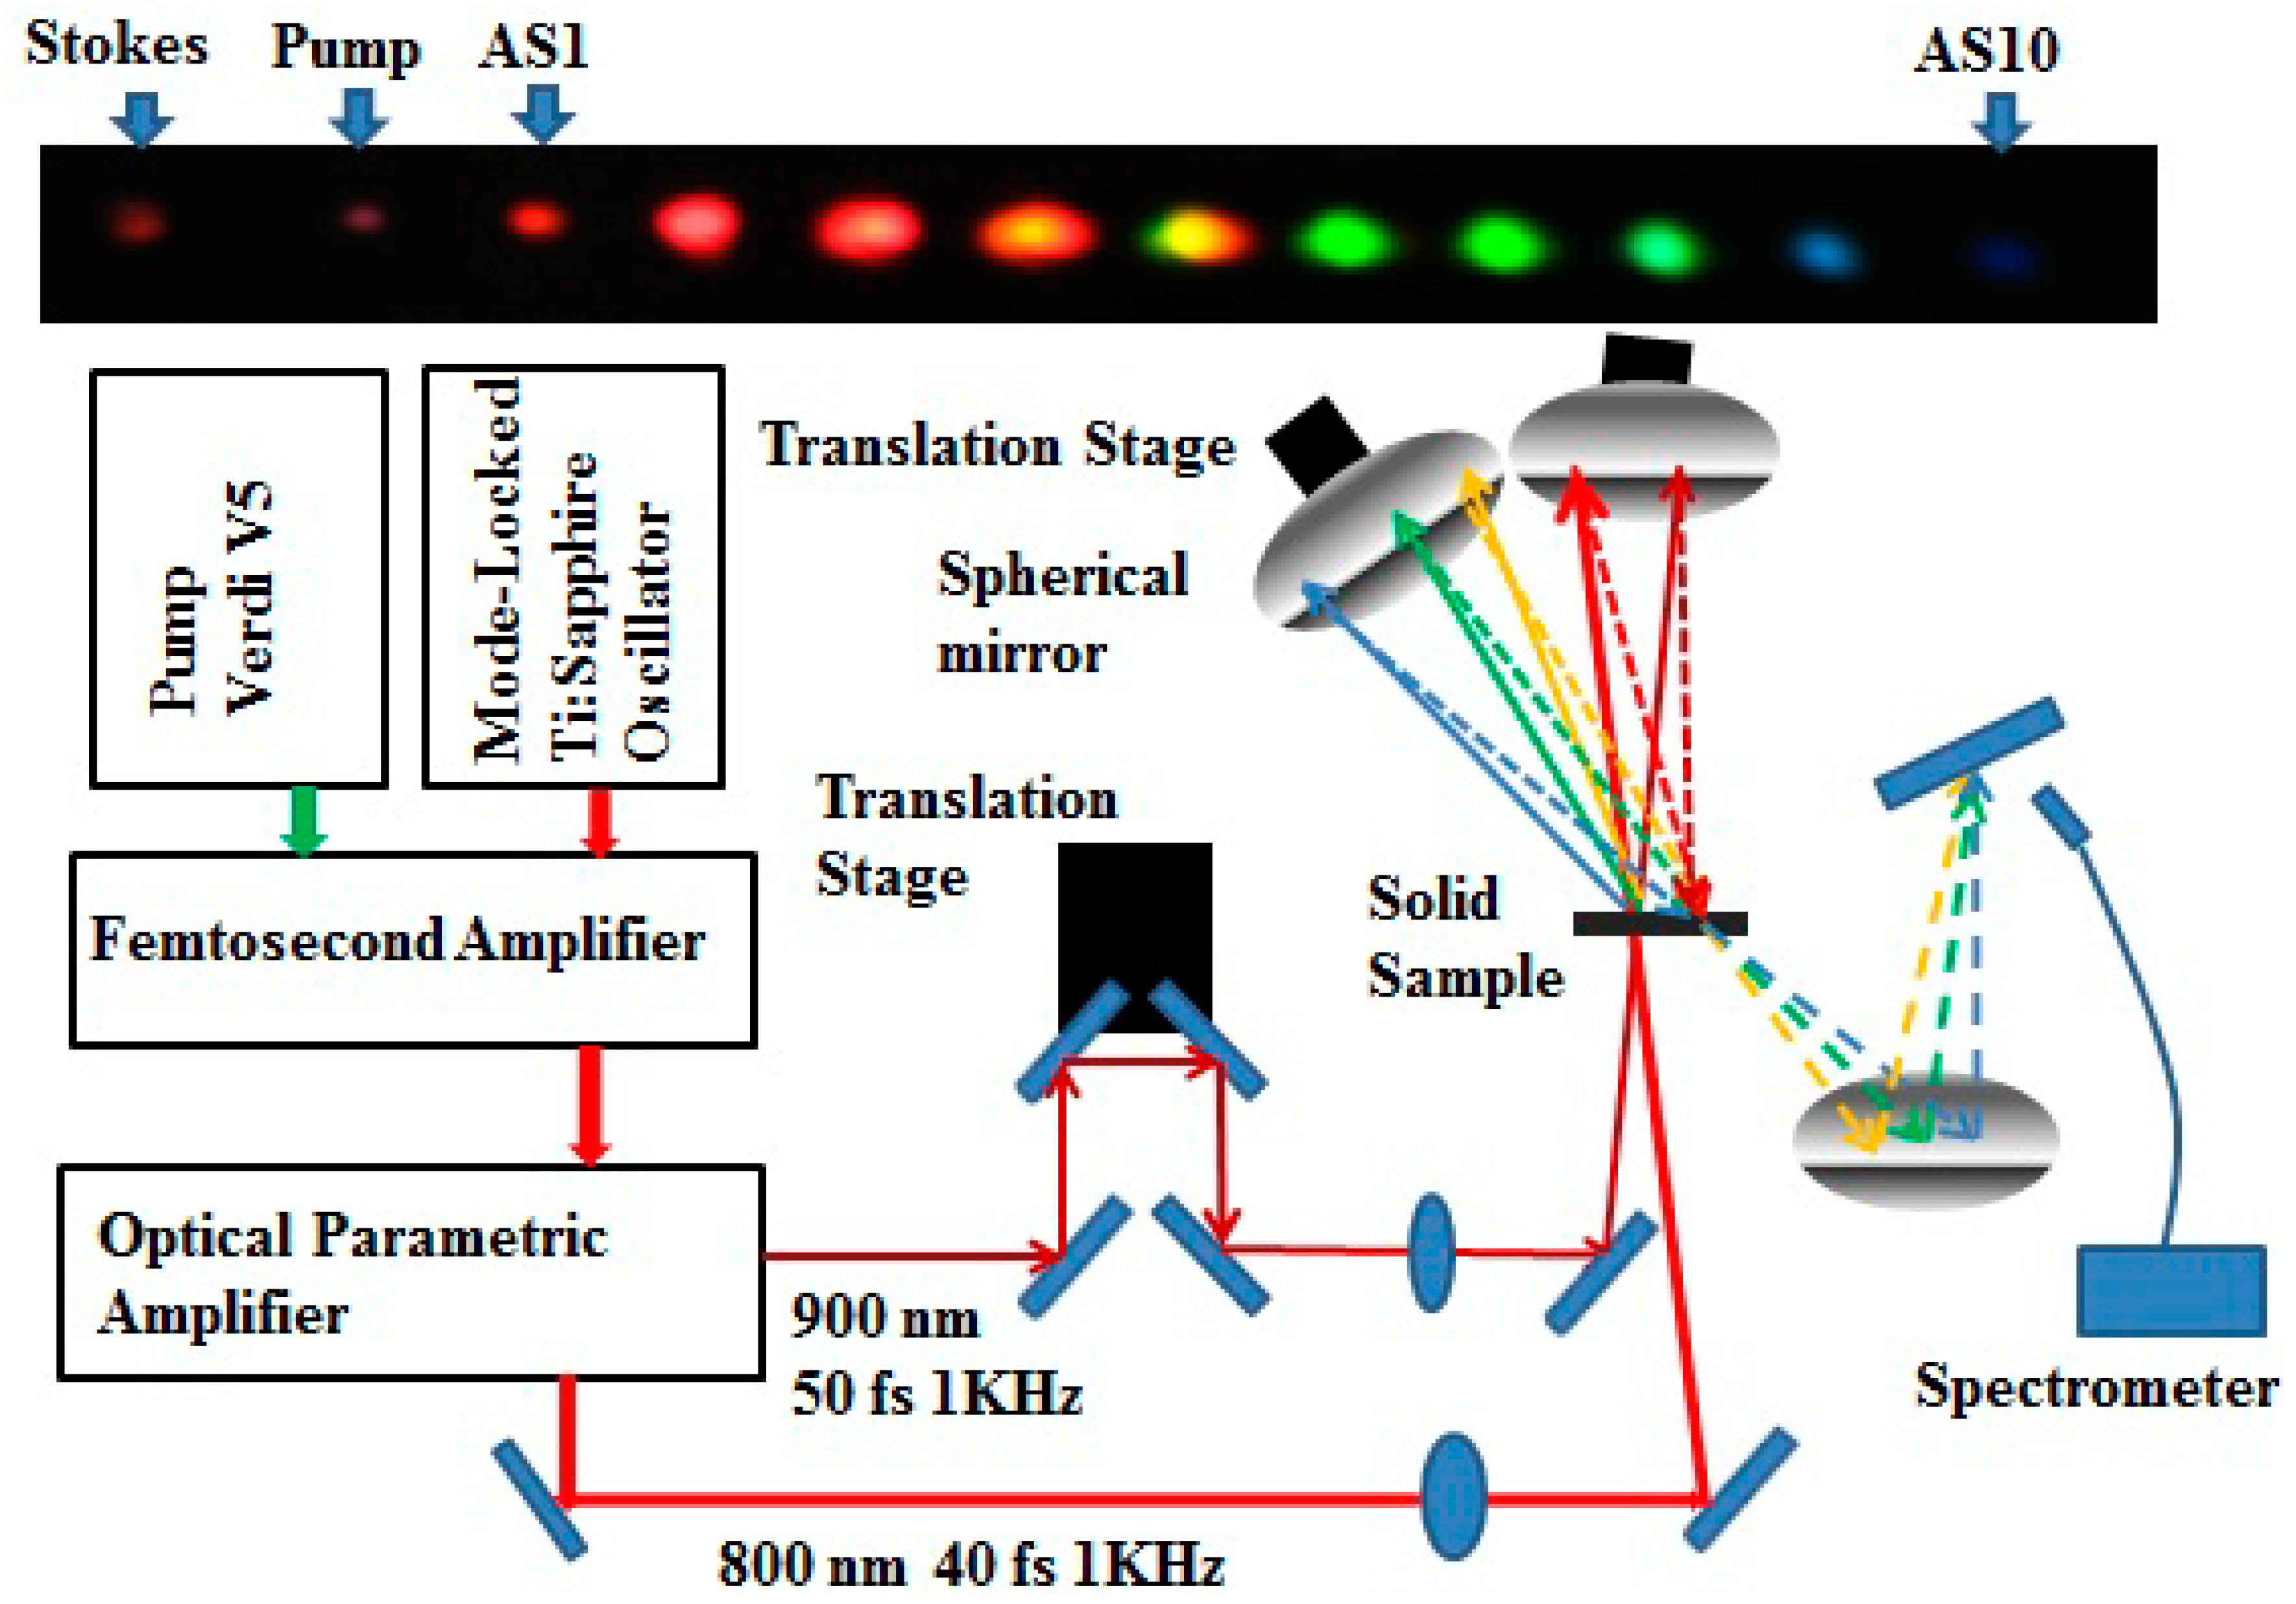
The experimental details were presented in Reference [
21] and all the data presented in this paper is generated from the same experimental setup. The spectra of Raman sidebands were recorded by spectrometer (HR 4000, Ocean Optics). The pulse durations of pump and Stokes were around 50 fs. The pulse durations of the sidebands were a little longer than 50 fs due to the dispersion of the crystal [
17,
18]. The experimental interferograms are shown in
Figure 2a (The range for the spectrometer is from 200 nm–1100 nm and in
Figure 2a, we only show the range from 500 nm–700 nm). The interferogram is recorded with an integration time (100 ms) of the spectrometer. Therefore, the spectrogram did not display the shot-to-shot robustness of the sideband generation. The spectrogram shows intensity oscillations due to Raman scattering. A cross-section of the spectrogram at 562.57 nm, which is the central wavelength of AS4, is displayed in
Figure 2b. The frequency of the intensity oscillations is roughly equal to the differences between the central frequencies of two sidebands. The peak intensity of the pump and the Stokes beam at the focal point were about 4 × 10
11 W/cm
2. These beams will induce the cross phase modulation for the sidebands. Theoretically, the phase shift at 562.57 nm is 7.99 (it is evaluated using the parameter from Reference [
24]). During the scanning, when the pump and Stokes beams encountered the sidebands, at the first moment, the intensity of the driving beams increased. The changing of the refractive index is proportional to the intensity, and the spectral phase will change faster when the beam approaches the maximum intensity. This will increase the intensity oscillation frequency on the interferogram. Moreover, when the intensity is decreasing, the intensity oscillation frequency will decrease. In our experiments, we have tried our best to limit the cross phase modulation. By analyzing the spectrogram, we did not see significant variation of the intensity oscillation frequency. However, we could still see that the central frequency of the sidebands is slightly shifted due to the cross-phase modulation induced by pump and Stokes. Another nonlinear effect which plays an important role is self-phase modulation. The high intensity of the pump and the Stokes beams will induce self-phase modulation. It would distort their spectral phases and also broaden their spectrum. All of these would affect the energy and spectrum of the Raman sideband.
The goal of our simulation is to retrieve the relative spectral phases of the sidebands from the interferogram. We emphasize that, in the experiment, the spectrogram was recorded with an integration time 100 ms, which resulted in averaging out the fluctuation of the phase and the energy of the sideband generation (according to Reference [
23], the deviation of the sideband’s energy is around 15% due to the shot-to-shot fluctuation). Our method is to retrieve the spectral phase for the particular spectrogram and so far we do not consider the shot-to-shot fluctuation in the simulation. Therefore, when judging our retrieval algorithm, the root-mean-square (rms) deviation of the retrieved
vs. original spectrogram is important. In the experiment, the spectral phase distortion was a combined effect resulting from the dispersion of the crystal and nonlinearities, such as cross phase modulation [
17,
18,
21]. The spherical aberration of the spherical mirror also contributed to the phase distortion. To find the best value for the spectral phases, we compared the theoretical simulation with the experimental interferogram. Therefore, the experimental data was processed for the convenience of comparison with the theoretical simulation. At first, to remove the experimental noise due to laser fluctuations, the data was smoothed. Next, the interferogram was recorded by the spectrometer with a resolution of 0.75 nm; the sampling points were not equally distributed in the frequency domain. Thus, we used 2D bilinear interpolation to reconstruct an interferogram from the experimental data. The reconstructed spectrogram had data points uniformly sampled in the frequency domain with spectral range cut down to 400 nm–700 nm, which covered the spectrum of the sidebands used in our simulation. Between 400 nm and 700 nm, there were 250 sampling points. The reconstructed interferogram is shown in
Figure 2c. The vertical axis in the interferogram gives wavlenegth in nanometers, which is converted from ω following λ = 2πc/ω, here, c is the speed of light. The step of interpolations is 1 fs in the other dimension of the interferogram (which is the time delay between the two spherical mirrors).
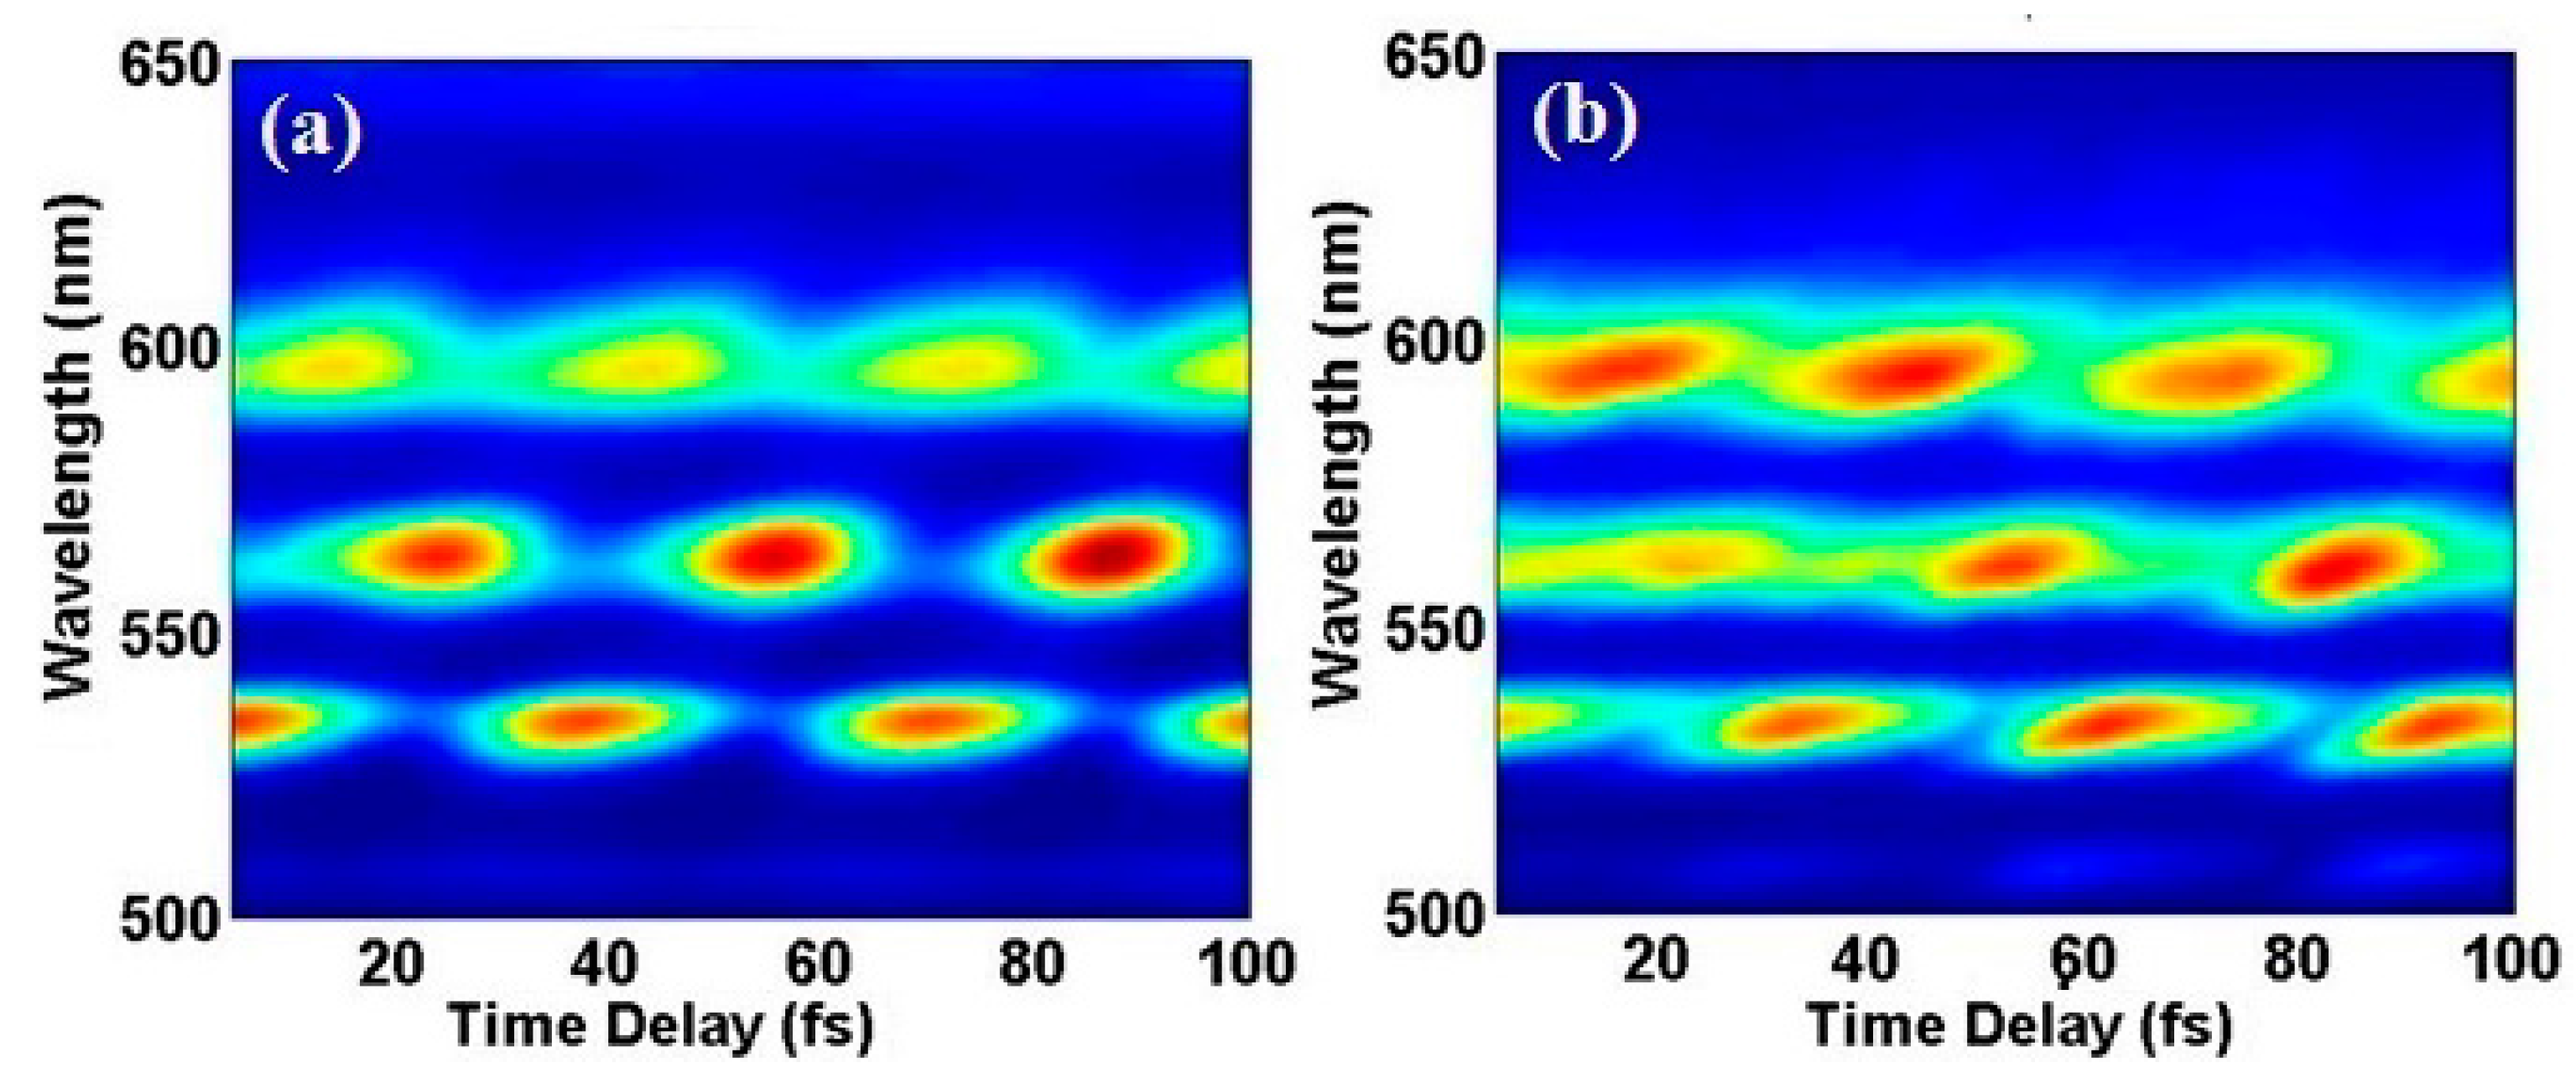
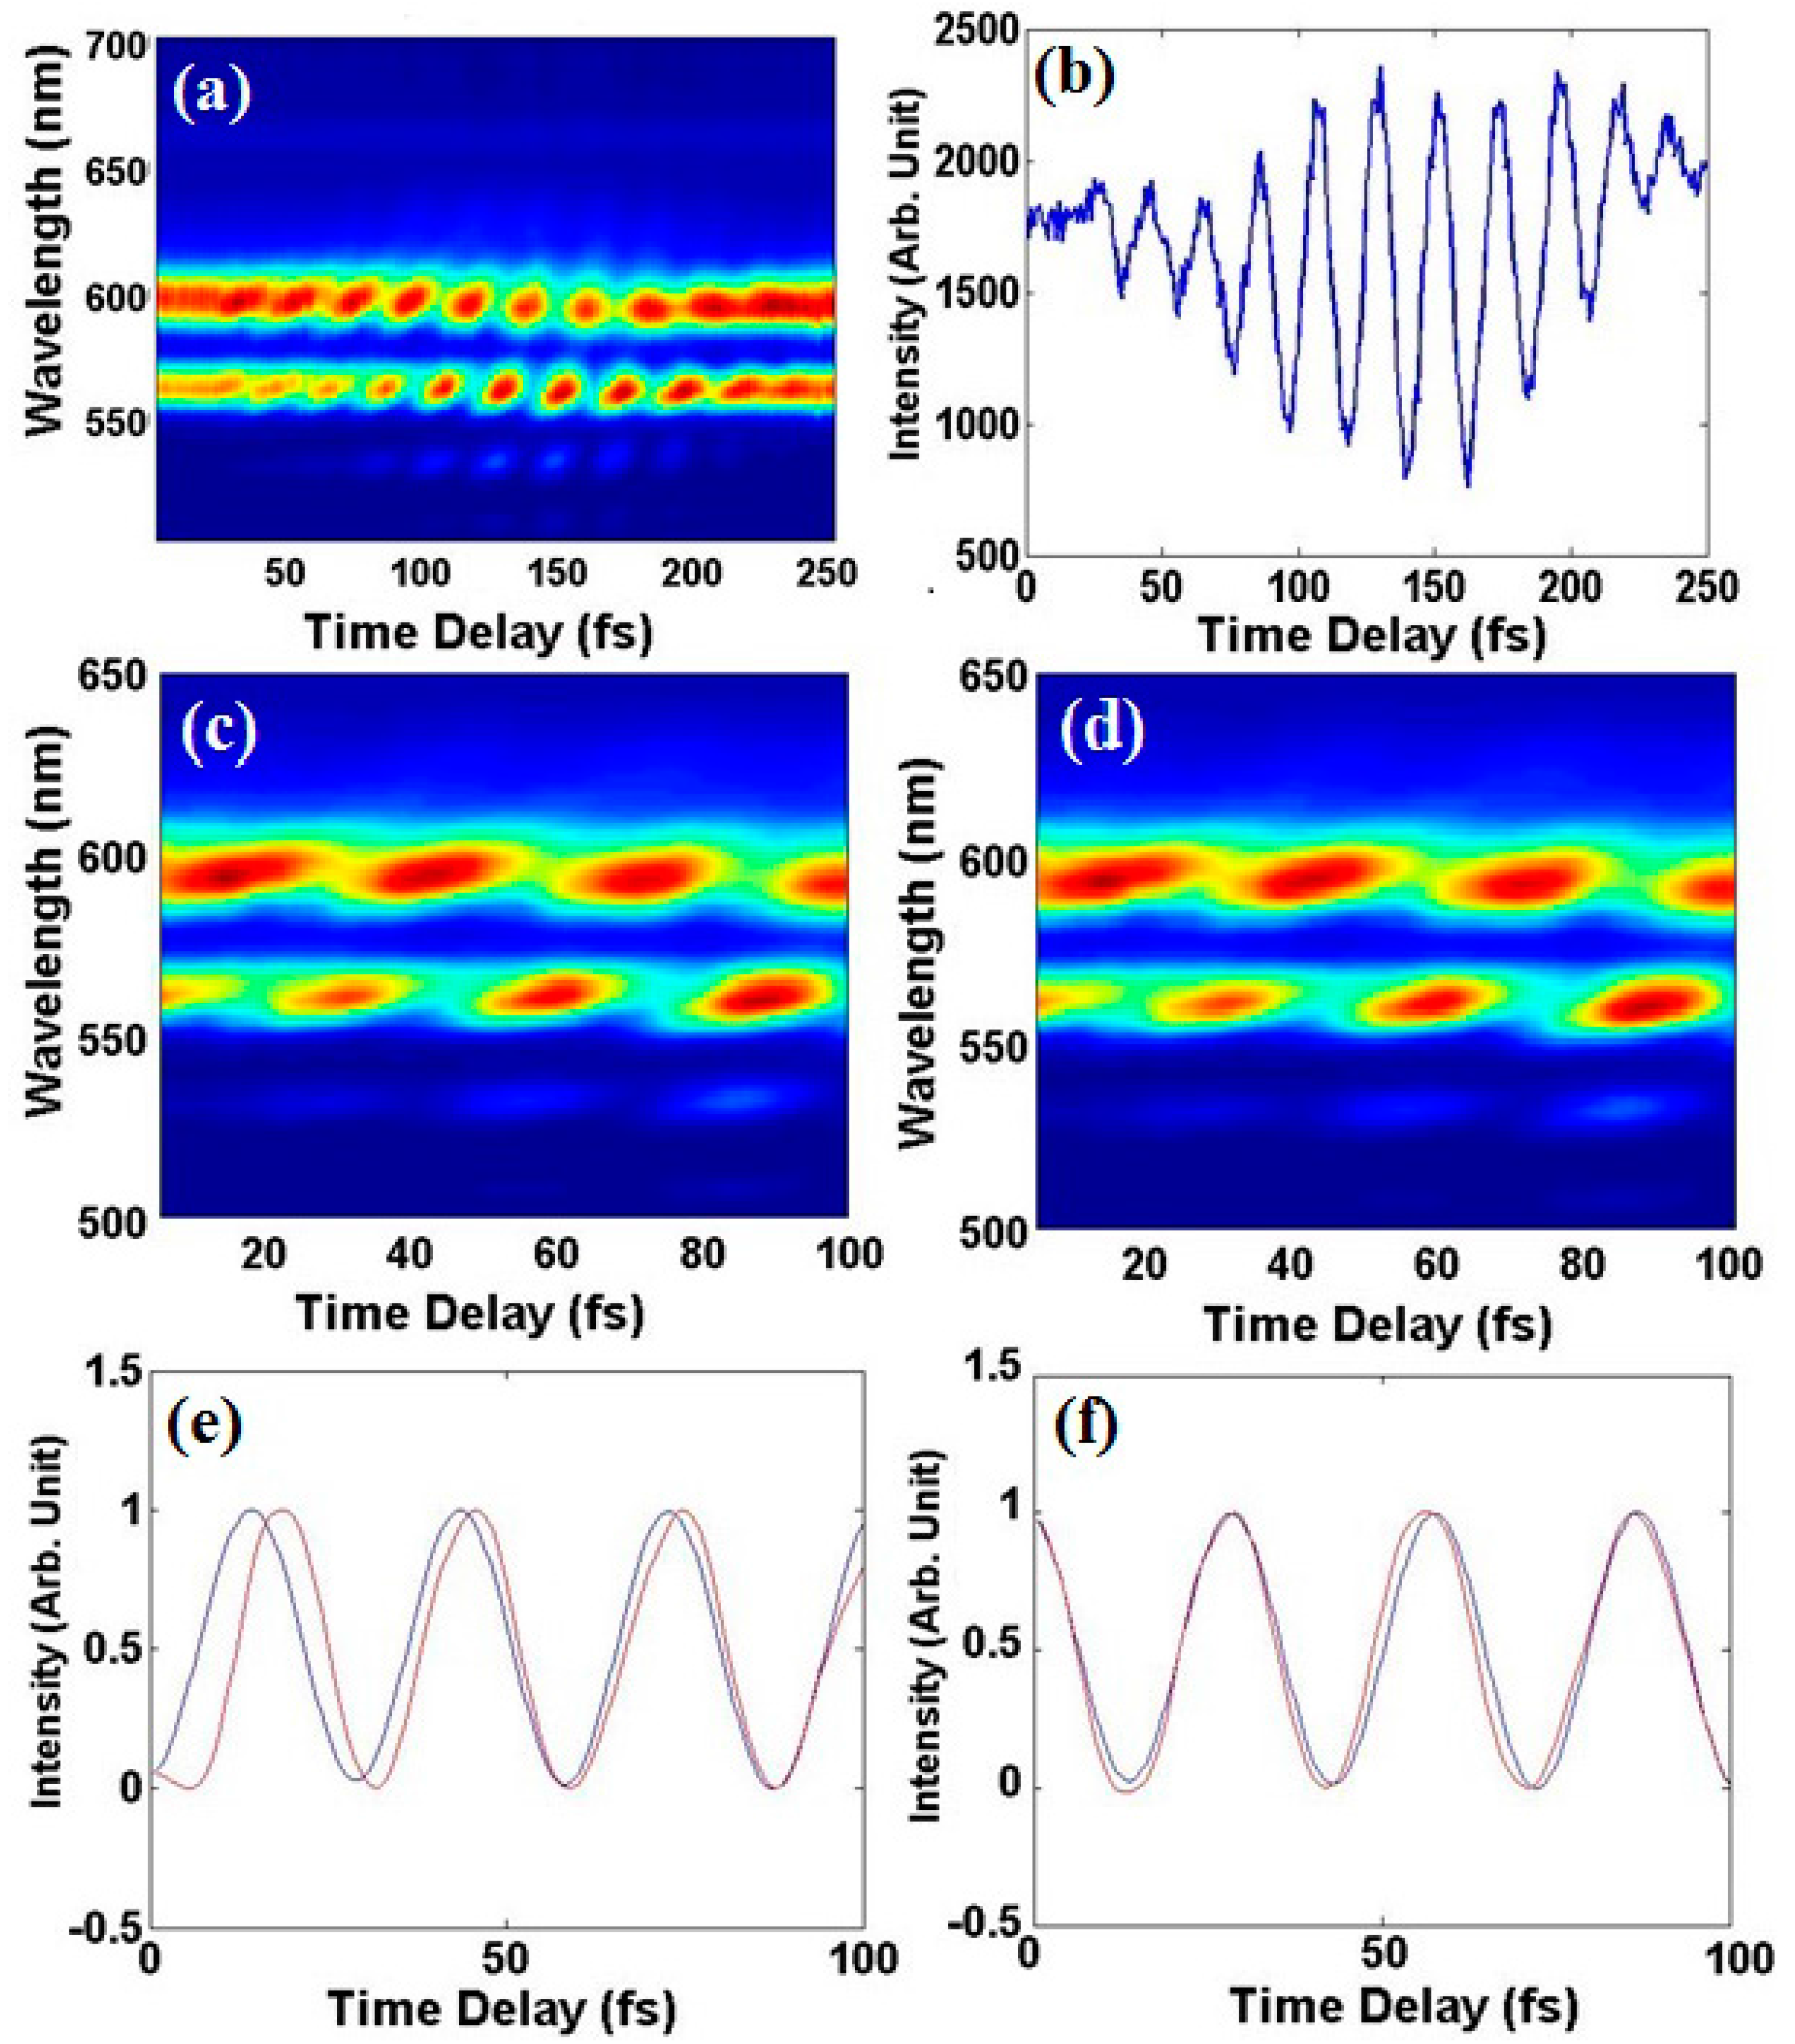
Figure 2.
(a) Interferogram of sidebands AS3 and AS4 recorded by spectrometer; (b) The cross-section of the interferogram at 562.57 nm, which is the central wavelength of AS 4, shows the intensity oscillation; (c) Reconstructed interferogram of AS3 and AS4 with the 2D bilinear interpolation; (d) Theoretical simulation of the interferogram using AS3 and AS4; (e) Cross-section of the interferogram from simulation (blue) and experiments (red) at the central wavelength of AS 3 (597.7 nm); (f) Cross-section of the interferogram from simulation (blue) and experimental data (red) at 562.57 nm.
As a demonstration of our phase retrieval algorithm, the total time delay span in our theoretical calculation was 100 fs, which suppressed the effect of phase distortion from spherical aberration induced by the displacement of translation stage. In the simulation, we solved the partial differential equations that described the coherent Raman interaction between the Raman sidebands. We took all the sidebands as being far from the resonance as in Reference [
21]. The equations can be written as Equation (1):
where
and
,
. The line profile is
, where α is a constant related to the spontaneous Raman cross-section,
ωs and
ωp are the angular frequencies of the pump and Stokes beams, and
γ is the half-width of the spontaneous Raman line. The propagation constant is defined as
for different wavelength and the definition of
and
can be found in References [
8,
21].
Eq(ω) =
Aq(ω) × exp(
j(φ
q(ω)+ω
qtq)). For the amplitude
Aq(ω), we used the value measured by the spectrometer. We applied the same interpolation as that in the interferogram to reconstruct
Aq(ω), whose sampling points were uniformly distributed in the frequency domain. Spectral phase φ
q(ω) and time delay
tq of the sidebands are the fitting parameters we need to determine through simulation. The other parameters are determined by the theoretical evaluation and optimized by the calculation. In principle, there are infinite equations as n goes to ±∞. However, since our sidebands were AS3–AS5, we only considered the relevant equations, including these sidebands, within the spectral range 400 nm–700 nm. The boundary conditions are assumed to be the same as the experimental conditions. For example, in
Figure 2, in addition to AS3 and AS4, the amplitudes
Aq(ω) of all the other sidebands, AS2, AS5, AS6, AS7, and AS8, are zero in the initial condition.
We solved the equations using the Runge-Kutta method. In order to find the right spectral phases, we attributed the phase distortion to the dispersion of the crystal (1 mm thick synthetic single-crystal diamond in our experiment) and the retardation among the sidebands. By comparing the theoretical results (
Figure 2d) with the experimental results (
Figure 2c), the spectral phases were optimized by changing time delay between sidebands and the thickness of the crystal and obtained a best fit with experimental results for a thickness of 200 μm. The thickness of the crystal was about 1 mm, which was much larger than the 200 μm in the simulation. In other words, the spectral phases included the effect resulting from the dispersion of the crystal and cross phase modulation. For the results presented in the paper, we did not consider the effect of cross phase modulation separately. The reason was that when adding the cross-phase modulation induced by pump and Stokes fields into the simulation, we did not see significant improvement in the simulation. The theoretical results were also normalized in order to compare with the experimental data.
Figure 2e,f displays the cross section of the interferogram at the central wavelength of AS3 at 597.7 nm AS3 and AS4 at 562.57 nm, which showed that our theoretical results fit the experimental results well. However, the results were not perfect, as we did not separately consider the phase distortions due to the nonlinear effects, such as self/cross phase modulation and spherical aberration of the mirrors.
The spectral phases retrieved in our simulation were relative. Thus, we took the spectral phase of AS3 as the reference. After finding the proper phase for AS4 using the interferogram of AS3 and AS4, we continued to retrieve the spectral phases of AS5 from the interferogram between AS4 and AS5. With the same method, the spectral phases of AS6 and AS7 were retrieved. Then we put multi-sidebands with the retrieved spectral phases together and reconstructed the corresponding interferogram to compare with the experimental result. The theoretical interferogram and experimental interferogram of multi-sidebands are shown in
Figure 3.
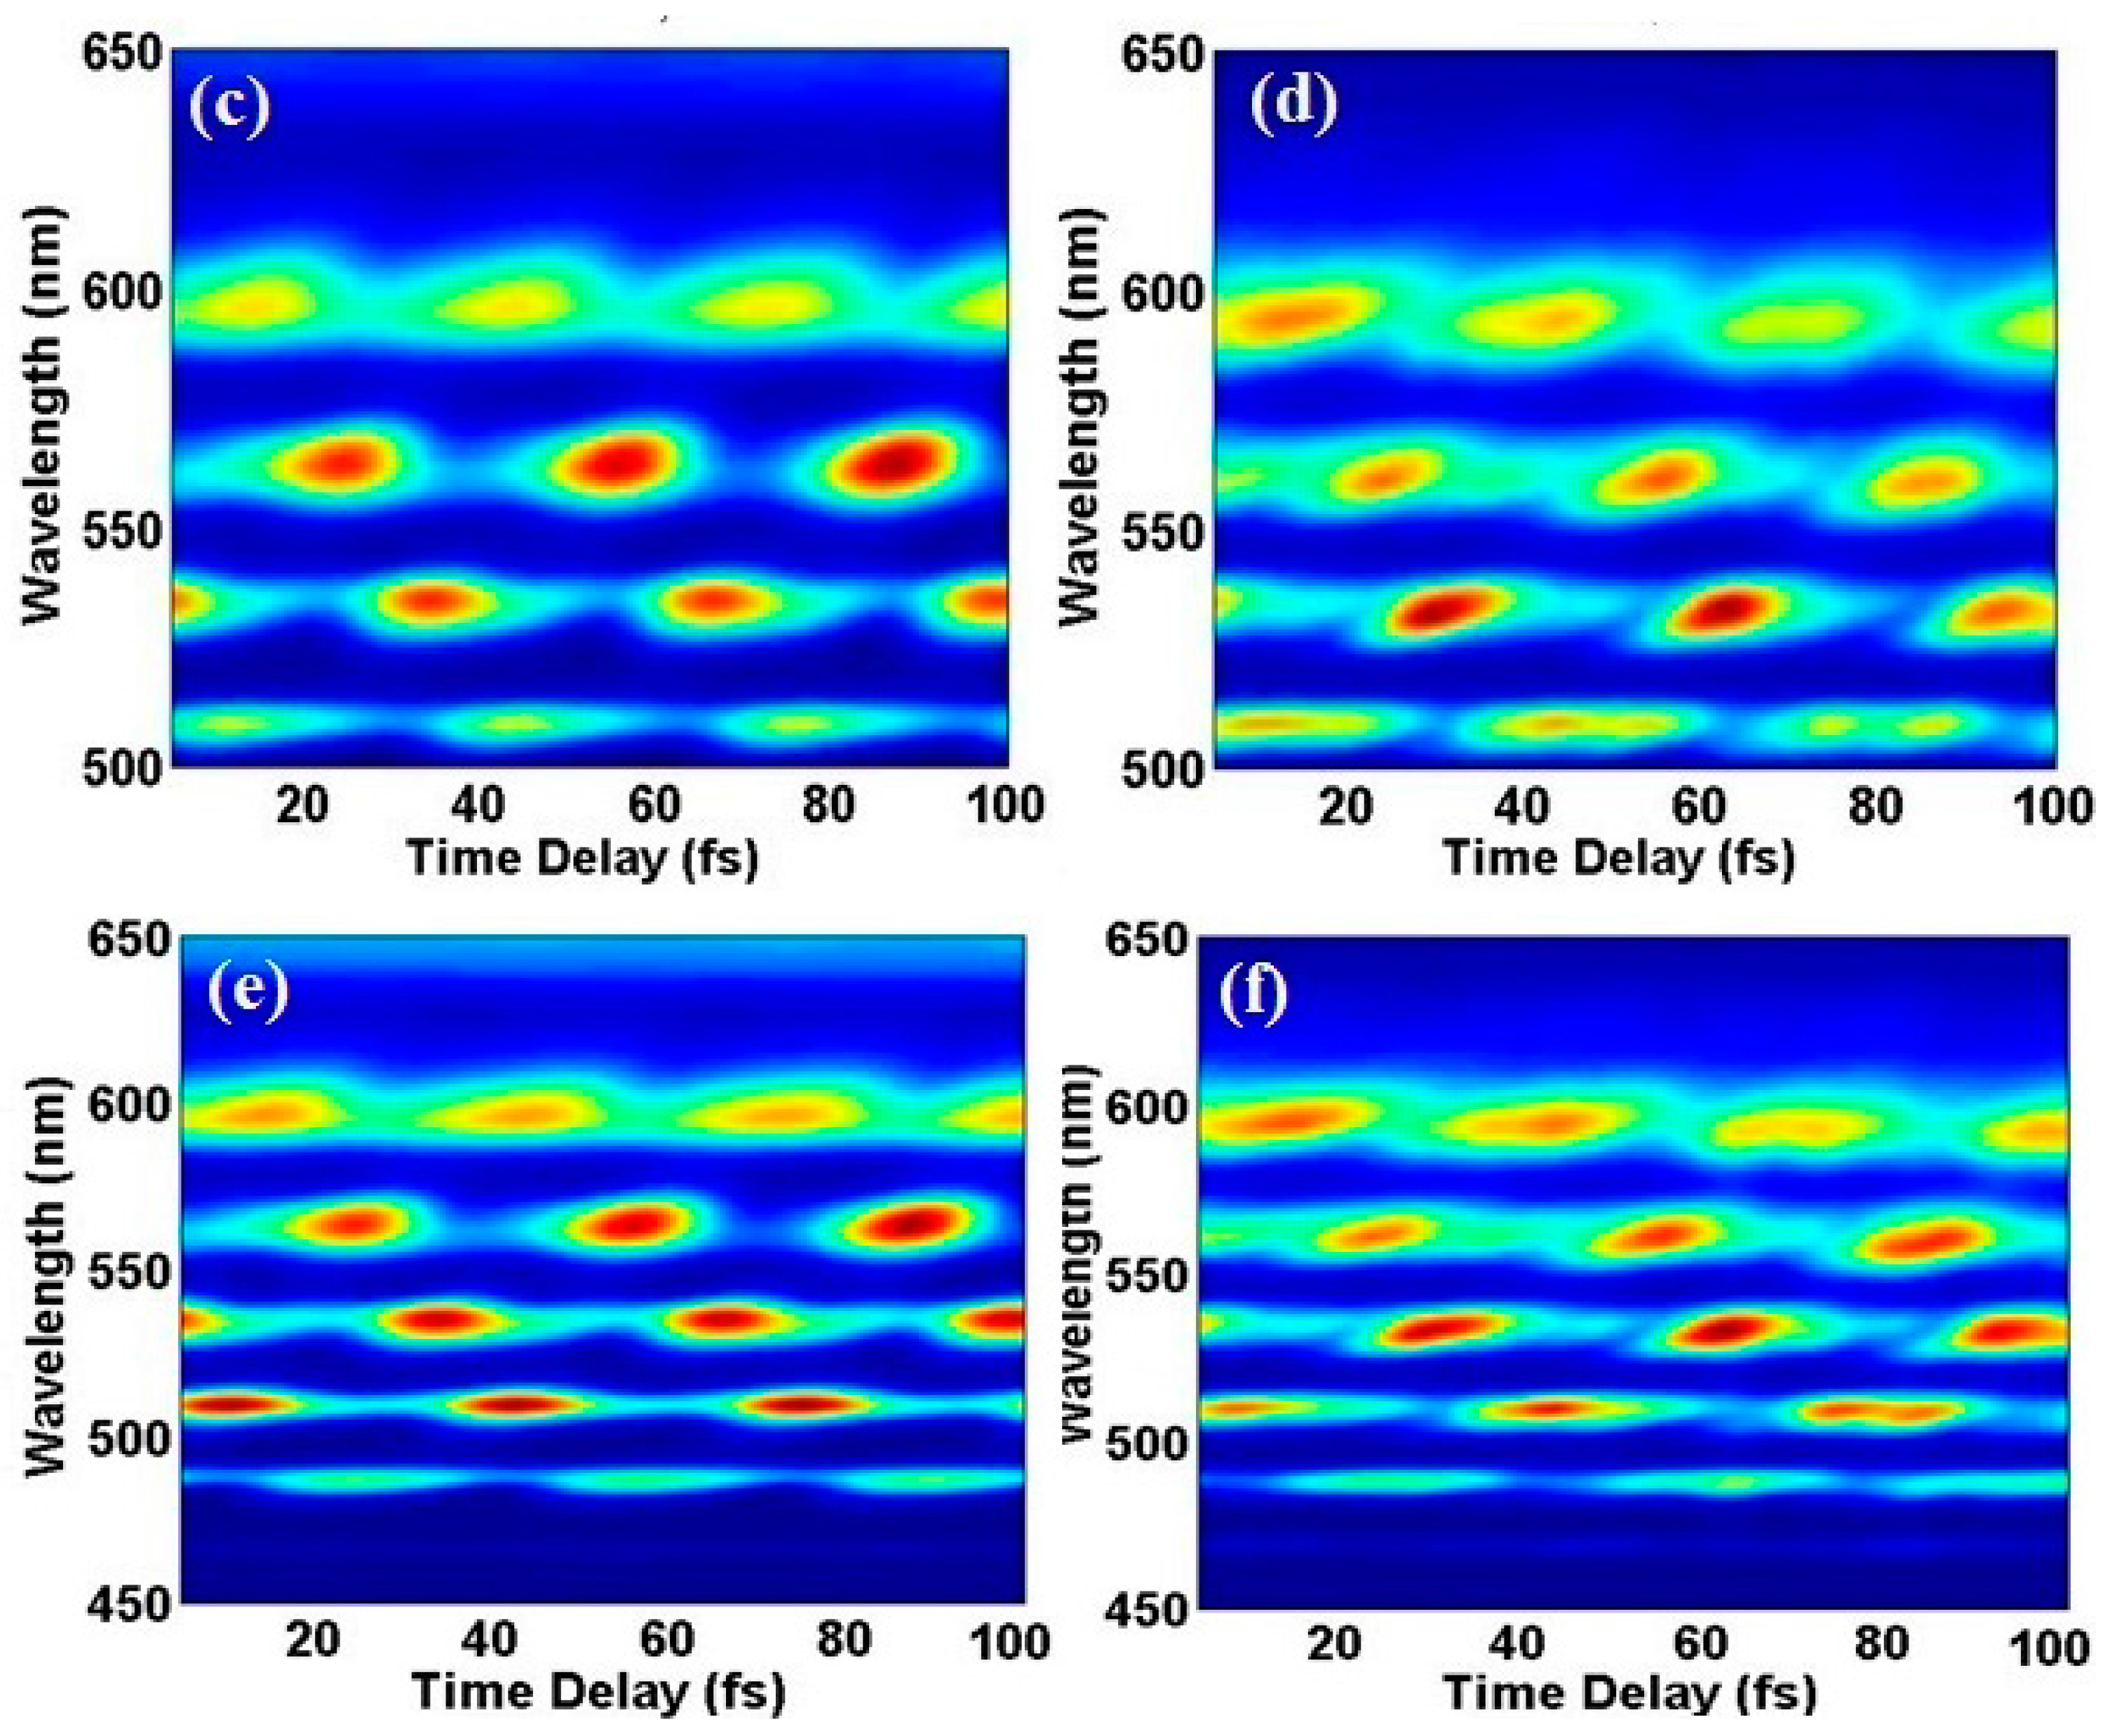
Figure 3a,b show the numerical results and experimental results with sidebands AS3, AS4, and AS5.
Figure 3c,d show the numerical results and experimental results with sidebands AS3, AS4, AS5, and AS6.
Figure 3e,f show the numerical results and experimental results with sidebands AS3, AS4, AS5, AS6 and AS7. After we normalized both the retrieved and the original spectrograms, we calculated the total rms deviation between simulation and experimental spectrogram as: rms =
to be 0.0294 for our retrieval (here ω is the frequency,
t is the time delay,
Nt is the total scanning steps in time domain an,
Nω is the total number in frequency domain, and
Isimulation(ω,
t) and
Iexperiment(ω,
t) are the normalized intensities of simulation and experiment). In
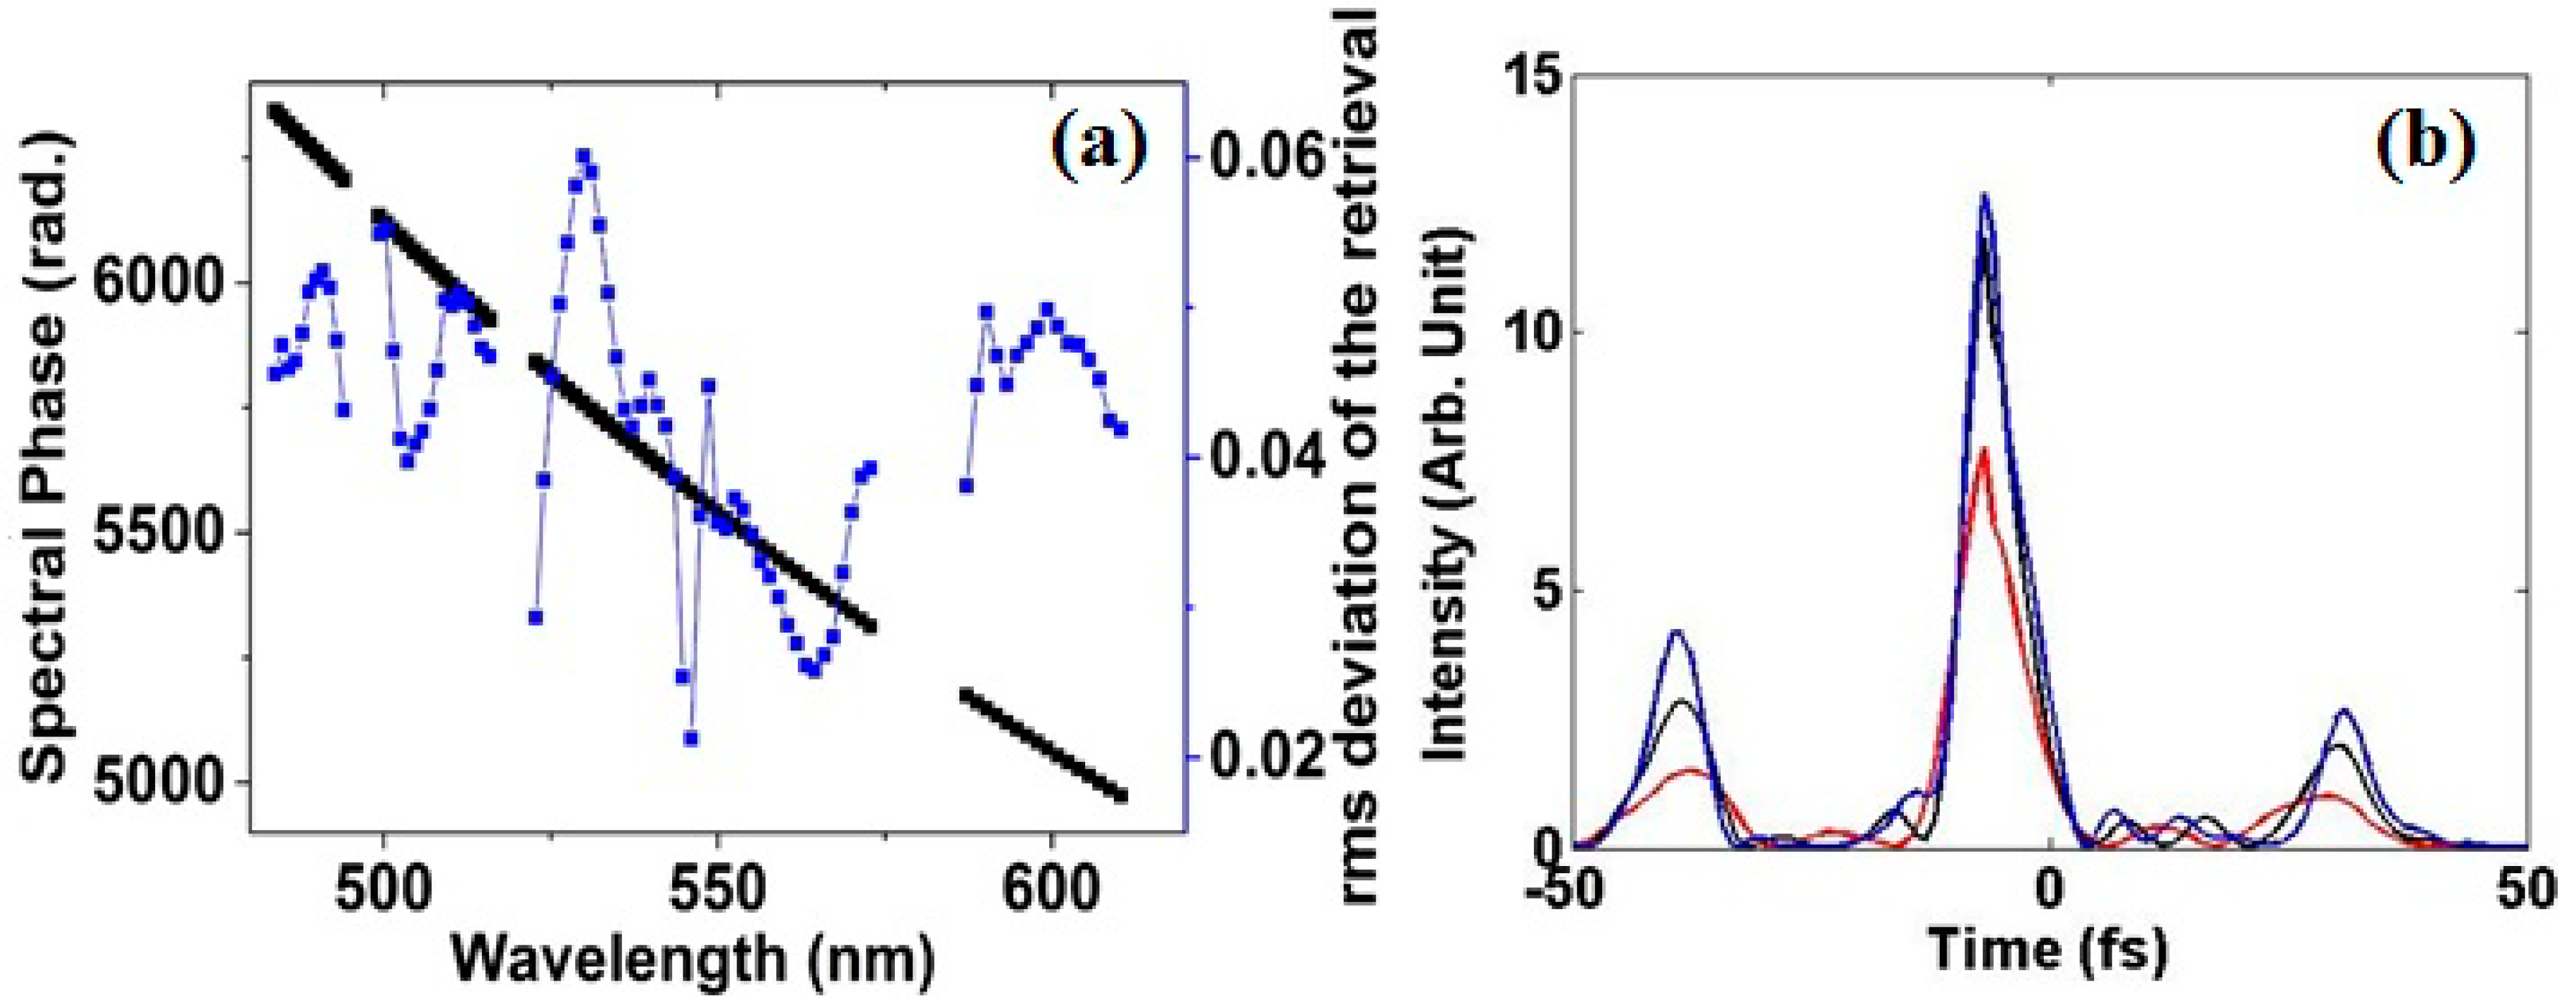
Figure 4a, we show the rms deviation at a variable
(
, which is a sum over scanning time steps) together with the spectral phases obtained from the retrieval. In
Figure 4, we convert
ω to the wavelength following λ
= 2π
c/ω, here,
c is the speed of light. The retrieval method we used did not include the iteration routine. Including the iteration in our algorithm is our future plan. The ultrafast waveform retrieved from
Figure 3e,f could be found in Reference [
21].
Figure 4b is the pulse retrieved from
Figure 3 (b) (red), (d) (black), and (f) (blue). The pulses duration (full-width half maximum (FWHM)) is 6.06 fs for five sidebands (blue), 6.10 for four sidebands (black) and 7.37 for three sidebands (red). In principle, the five sidebands AS3, AS4, AS5, AS6, and AS7 span the spectral range from 490 nm to 597 nm and, thereby, it is possible to obtain a pulse whose full-width half-maximum (FWHM) is around 4 fs with five sidebands (5 fs with four sidebands (AS3, AS4, AS5, and AS6) and 6 fs with three sidebands (AS3, AS4, and AS5)). However, in the experiment, the spectral phases of the sidebands were distorted due to the nonlinear effect and the pulse duration (FWHM) retrieved from the numerical result (
Figure 4a) is larger than that of the Fourier-transform limited pulse fs. Notably, our results showed that the pulse duration with five sidebands (AS3–7) is close to that of four sidebands (AS3–6). This is due to the fact that the spectral phase of AS7 is distorted too much and, thereby, when synthesizing the waveform using AS7, the pulse duration barely changes.
Figure 3.
(a) Theoretical interferogram of AS3, AS4 and AS5; (b) Interferogram of AS3, AS4 and AS5, which is reconstructed with 2D bilinear interpolation from experimental data; (c) Theoretical interferogram of AS3, AS4, AS5, and AS6; (d) Interferogram of AS3, AS4, AS5, and AS6 reconstructed with 2D bilinear interpolation from experimental data; (e) Theoretical interferogram of AS3, AS4, AS5, AS6, and AS7; (f) Interferogram of AS3, AS4, AS5, AS6, and AS7 reconstructed with 2D bilinear interpolation from experimental result.
Figure 4.
(a) The spectral phases retrieved from the numerical simulation (black) and the rms deviation of the simulation vs. experiment at different wavelength (rms is evaluated between the normalized simulated and original spectrograms by summing over the scanning of time steps). (b) The pulse retrieved from the interferogram of three sidebands AS3, AS4, and AS5 (red line), four sidebands AS3, AS4, AS5, and AS6 (black line), and five sidebands AS3, AS4, AS5, AS6, and AS7 (blue line).


