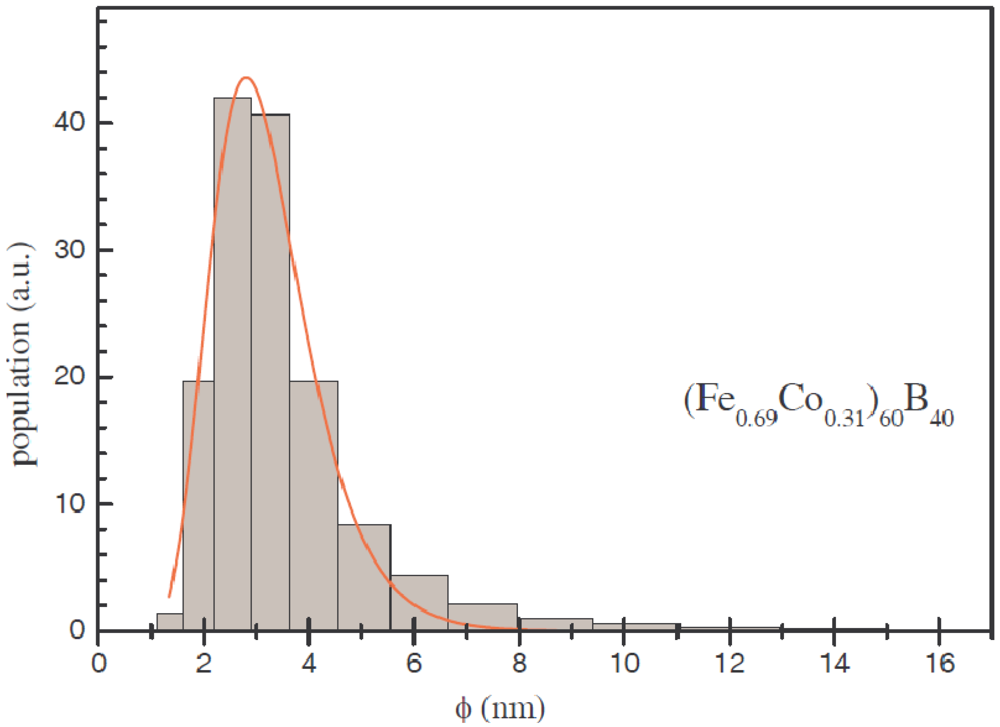
3. Results and Discussion
As our nanoparticles are ferromagnetically ordered at temperatures above room temperature, single domain behavior is expected to be observed. The magnetization results as a function of temperature of (Fe
0.69Co
0.31)B
0.4 particles measured under zero field cooling (ZFC) and field cooling (FC) conditions applying a field
H = 50 Oe are plotted in
Figure 2 for the dispersed and powder samples.
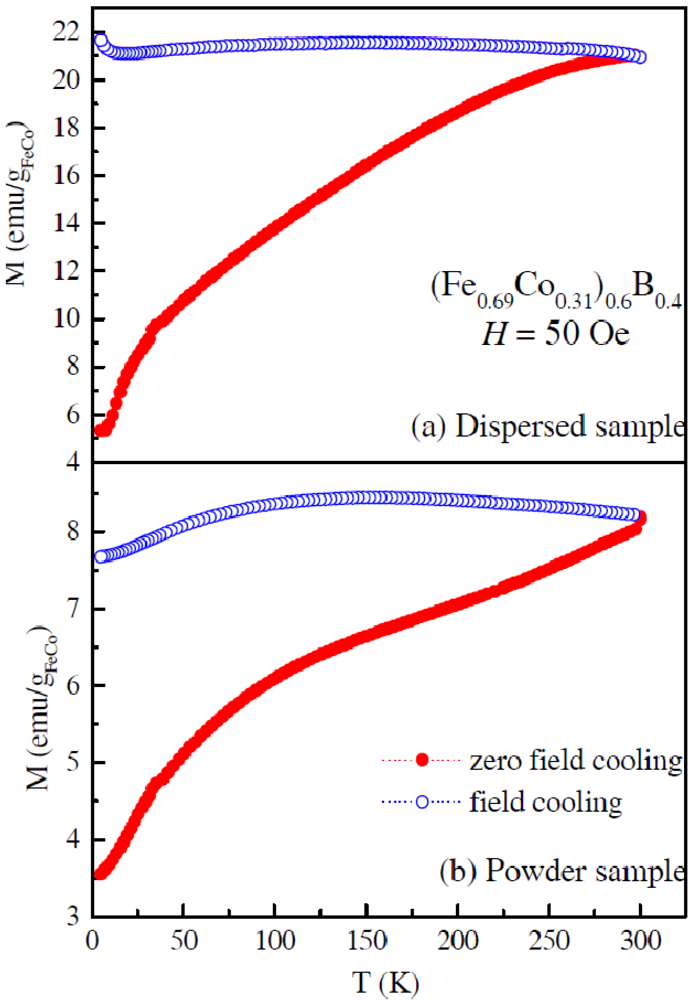
Figure 2.
Magnetization vs. temperature curves for (Fe0.69Co0.31)B0.4 dispersed (a) and powder (b) particles measured under zero-field-cooling (ZFC) and field-cooling (FC) conditions.
Figure 2.
Magnetization vs. temperature curves for (Fe0.69Co0.31)B0.4 dispersed (a) and powder (b) particles measured under zero-field-cooling (ZFC) and field-cooling (FC) conditions.
In both systems, the observed behavior represents irreversibility, and consequently the blocking temperature (the temperature above which the system behaves as a superparamagnet) is above room temperature. This blocking temperature is unexpected because the usual energy barrier for 3 nm amorphous ferromagnetic nanoparticles is small, generally giving a superparamagnetic regime at room temperature. In our case, the coupling of the single domain magnetization of the core of the particle with the surface anisotropy of the surface spins via exchange interaction enhances the effective anisotropy. Taking into account the non-interacting nature of the particles, the FC magnetization curve presents an atypical shape, remaining quasi-constant with decreasing temperature (
Figure 2(a)). This fact is probably evidence of intraparticle interactions or magnetic order frustration at the particle surface [
16,
17]. Monte Carlo simulations of non-interacting Fe-Co nanoparticles within the core-shell model satisfactorily reproduce the measured ZFC-FC magnetization curves [
24]. In this model, a different orientation of the uniaxial surface anisotropy axes for Fe and Co magnetic moments is considered, producing frustration in the superficial magnetic order. This effect leads to the anomalous FC curve measured on our non-interacting nanoparticles. The increase of the magnetization at low temperatures is also reproduced and it is related to an improvement of the internal magnetic order of the particles, as it will be described later with the hysteresis loops results. On the other hand, the
M(
T) curve under FC condition of the powder sample, where strong interparticle interactions are present, behaves very differently,
i.e., the magnetization decreases at low temperatures (
Figure 2(b)). This curve shape is typical of spin-glass and cluster-glass systems where interactions frustrate the magnetic order, giving the observed magnetization curve [
25,
26]. These interparticle interactions probably also frustrate the magnetic order of the particle surface spins, reinforcing the magnetization reduction effect.
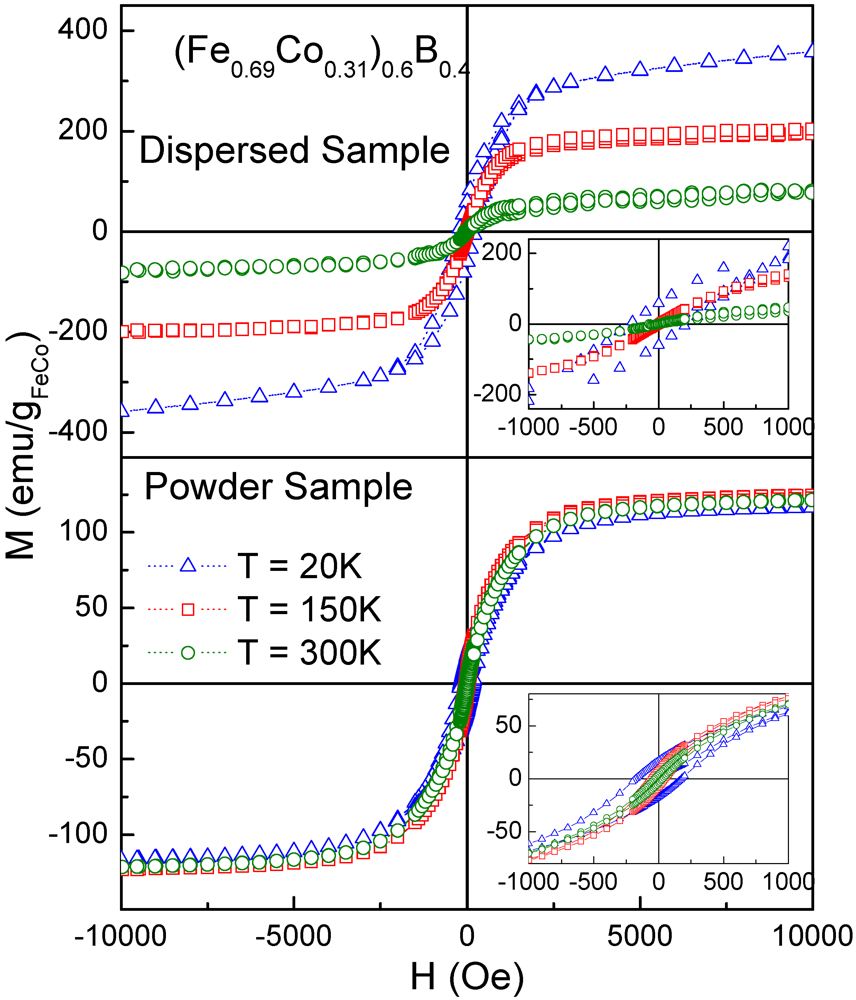
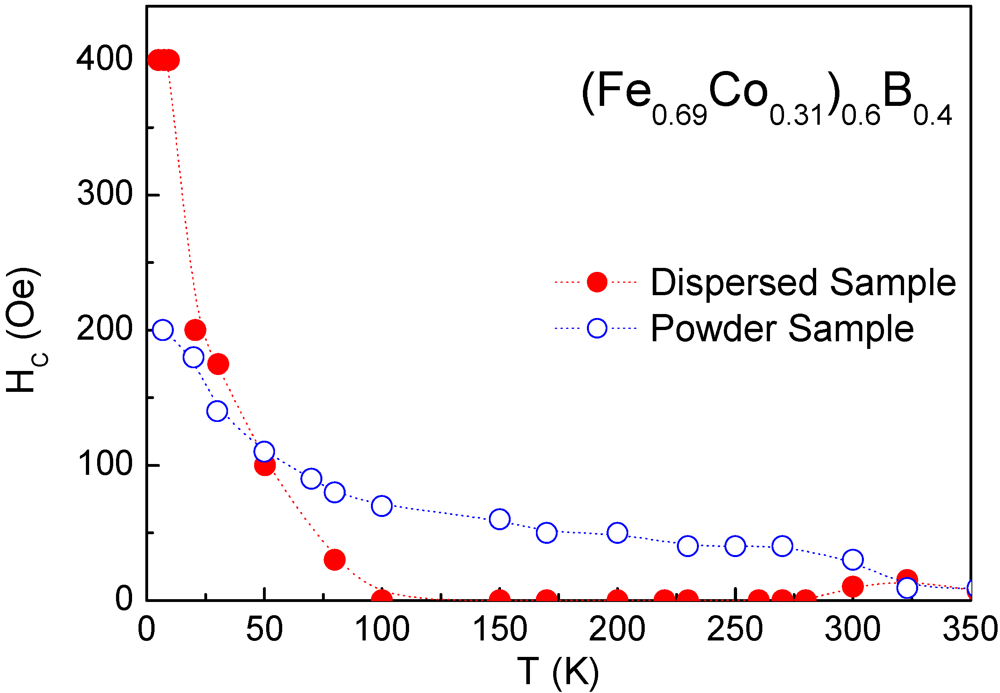
Magnetization loops,
M(
H), were performed at different temperatures. As an example,
Figure 3(a) displays the hysteresis loops for the (Fe
0.69Co
0.31)B
0.4 dispersed particles at three different temperatures. The different behavior of the dispersed and powder samples confirms the uniform dispersion of the nanoparticles in the polymer without dispersion of aggregates of particles. Note that the
M(
H) cycles have a negligibly coercive field (
HC) for
T ≥ 100 K (see
Figure 4). This fact is very irregular, taking into account the large irreversibility observed in the
M(
T) curves measured under ZFC-FC conditions, which is usually associated to open magnetization cycles in the blocked regime. At low temperatures,
HC grows abruptly, evidencing an increase of the effective anisotropy. On the other hand, the
M(
H) behavior of the interacting particles is very different (
Figure 3(b)). The powder sample shows a small
HC in all the temperature range, smoothly increasing at low temperatures (
Figure 4).
Figure 3.
Magnetization loops at different temperatures for (Fe0.69Co0.31)B0.4 dispersed (a) and powder (b) particles. The insets correspond to the low field magnetization detail.
Figure 3.
Magnetization loops at different temperatures for (Fe0.69Co0.31)B0.4 dispersed (a) and powder (b) particles. The insets correspond to the low field magnetization detail.
Figure 4.
Coercive field vs. temperature for (Fe0.69Co0.31)B0.4 samples. The lines are only a guide for the eye.
Figure 4.
Coercive field vs. temperature for (Fe0.69Co0.31)B0.4 samples. The lines are only a guide for the eye.
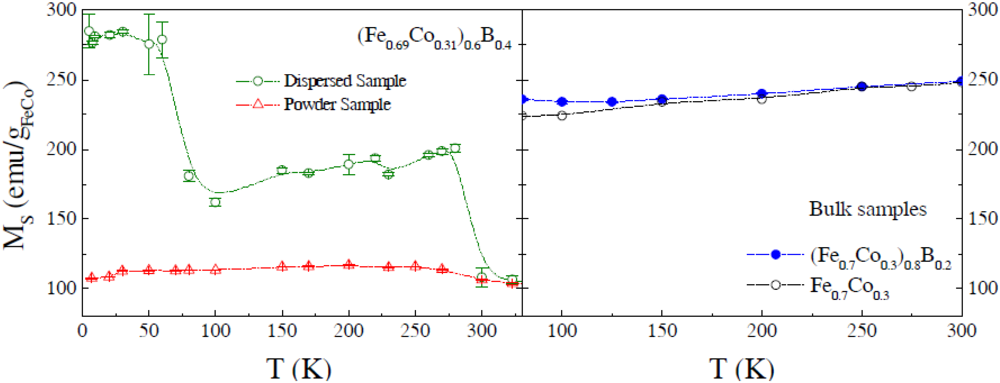
Figure 5.
Saturation magnetization (MS) vs. temperature for dispersed (non-interacting) and powder (with strong interparticle interactions) (Fe0.69Co0.31)B0.4 particles, and the bulk (Fe0.7Co0.3)0.8B0.2 and Fe0.7Co0.3 samples. The lines are only a guide for the eye.
Figure 5.
Saturation magnetization (MS) vs. temperature for dispersed (non-interacting) and powder (with strong interparticle interactions) (Fe0.69Co0.31)B0.4 particles, and the bulk (Fe0.7Co0.3)0.8B0.2 and Fe0.7Co0.3 samples. The lines are only a guide for the eye.
It is noticeable that
M(H) does not saturate even at the maximum applied field, with a linear behavior at high magnetic fields, suggesting the existence of two contributions to the magnetization:
M(
H)
= Mirr +
Mrev. The first term (
Mirr) is related to the blocked regime, which saturates at low field; whereas the second one (
Mrev) is related to a paramagnetic contribution to the magnetization. The saturation magnetization,
MS, of each curve is determined by subtracting the linear contribution of the magnetization at high field or, similarly, by extrapolating the magnetization at
H = 0 from the high field linear behavior. From the magnetization curves of the non-interacting system, the increase of
MS when the temperature decreases is evident, whereas
MS of the powder sample remains quasi-constant with a value equal to the lowest saturation magnetization measured for the non-interacting sample.
MS as a function of temperature (5–350 K) curves for the dispersed and powder samples of (Fe
0.69Co
0.31)B
0.4 are plotted particles in
Figure 5. The saturation magnetization of the non-interacting particles presents a peculiar characteristic, showing three regions of different behaviors. In the range of temperature of 300–350 K,
MS ~ 100 emu/g
FeCo; in the second region (80 K <
T < 280 K) we observed a plateau of
MS ~ 175 emu/g
FeCo; and in the last one (5 K <
T < 70 K) the saturation magnetization reaches ~280 emu/g
FeCo. The low temperature value of
MS is larger than the calculated value for the Fe-Co bulk alloy at this composition (~240 emu/g).
In order to characterize the magnetic properties of the alloy at this composition (
x = 0.69) and compare it with our particles, bulk samples of (Fe
0.7Co
0.3)
0.8B
0.2 and Fe
0.7Co
0.3 composition were prepared in an arc furnace. The relative boron/FeCo ratio in this sample is the maximum boron amount that the amorphous alloy can incorporate when synthesized by this method (at the eutectic point) [
27].
M(
H) was measured at different temperatures for these bulk samples, obtaining
MS approximately constant in the range of 5 K <
T < 300 K with a value of
MS ~ 240 emu/g
FeCo (see
Figure 5) close to the pure Fe-Co alloy saturation value. The
MS values obtained for both samples indicate that the boron content does not affect the magnetization of the system. The saturation magnetization of the bulk alloy when compared with the non-interacting nanoparticles (the dispersed sample) shows that the last one presents a very different temperature dependence, confirming that the changes in
MS (
T) observed in the particles did not originate in the intrinsic ferromagnetic order of the alloy. Consequently, the magnetization observed in the dispersed sample may evidence the existence of three different internal magnetic orders of the particle’s spins.
At high temperatures, a
core-shell magnetic structure of the particles is expected,
i.e., a core ferromagnetically ordered, whereas the shell spins in a paramagnetic state. This magnetic disorder originates in the broken exchange bonds (which reduce the effective exchange interaction in the shell), and in the surface anisotropy, that inevitably lead to surface spin misalignment with respect to the ordered core spins [
16,
17,
28]. Such spin disorder propagates from the surface to the core, giving a shell region with paramagnetic regime. In this case, the saturation magnetization measured originates in the small ordered core, also giving a negligibly small
HC field, because it originates only in the shape anisotropy (the sample is amorphous and we assume that the particles are not spherical, rather probably having an ellipsoidal shape). From the
MS value, an average 2 nm diameter for the magnetically ordered core has been estimated. At intermediate temperatures, 70 K <
T < 300 K, a change in
MS occurs, suggesting a modification of the surface contribution to the magnetization. With decreasing temperature, magnetic correlation between surface spins develops, giving rise to exchange-coupled ferromagnetic clusters in the shell, contributing to the total magnetization value. Additionally, these clusters are strongly influenced by the surface anisotropy, with the easy axis perpendicular (parallel) to the surface for the Fe (Co) spins, giving a disordered surface-spin state [
18,
19]. Due to the large surface anisotropy energy, the ferromagnetically ordered regions in the shell “freeze” in a disordered state, coupled to the ferromagnetic core. Because of this coupling, the freezing of the surface spins actually exerts a magnetic frustration on the core moment, giving a cluster-glass character to the whole particle, displaying anomalous closed magnetization loops with
HC ~ 0. This cluster-glass behavior avoids aligning the spins in a complete ferromagnetic order, giving the observed
MS value. At low temperatures,
T < 70 K, an additional change in the magnetic order of the non-interacting particles is observed. The saturation magnetization value grows, evidencing the full order of the spins, yielding larger
MS values than that measured in the bulk alloy. This effect is probably due to a modification in the conduction electron band, which is confined to metallic nanoparticles. In correspondence to the saturation magnetization, the coercive field shows an abrupt increase in this low temperature range. Actually, below 70 K, the subsequent growing of the ferromagnetic regions in the shell aligned in the field direction, allowing their exchange coupling with the ferromagnetic core of the nanoparticles, making its reversal more difficult, and thus strongly increasing the effective anisotropy of the whole particle [
18,
19]. This enhancement in the magnetic order is also evidenced in the increase of the FC magnetization at low temperatures measured at
H = 50 Oe [
16,
18,
19].
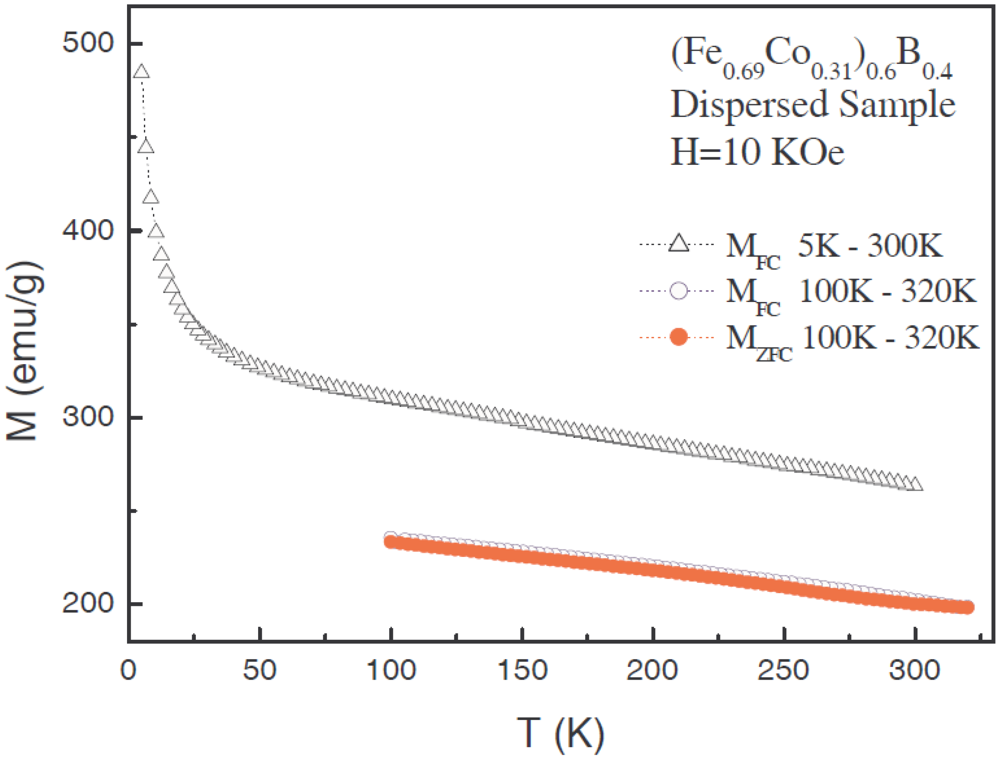
An additional confirmation of the internal magnetic order change below
T = 70 K is given by the
M(
T) curve measured at high fields. In
Figure 6 the measured
M(
T) curve is plotted, cooling the sample down to
T = 100 K, reflecting the magnetization value originated by the internal magnetic order of the spins corresponding to this range of temperature. On the other hand, on cooling the sample down to
T = 5 K a different magnetic order is favored, characteristic of low temperatures, where the spins are fully aligned. Performing the experiment warming the sample, the measured
M(
T) curve has larger values than the previous experiment, corresponding to the low-temperature ordered state. This low-temperature magnetic order remains even at room temperature because it is stabilized by the applied magnetic field. These results strongly contrast with the
MS(
T) values obtained from the magnetization loops. In the loops, where a previous zero-field-cooling is performed, the internal magnetic order is frozen at each characteristic temperature and then the magnetization is recorded applying the magnetic field. In this case, the maximum applied magnetic field
H = 10 kOe is not enough to change the magnetic order at the corresponding temperature, but is still enough to stabilize the low-temperature order in the
M(
T) experiment.
Figure 6.
Magnetization vs. temperature measured, applying a field of H = 10 kOe: cooling the sample down to T = 5 K with the field (open triangles), cooling the sample in zero field down to T = 100 K (open circles), and cooling applying the field down to T = 100 K (solid circles).
Figure 6.
Magnetization vs. temperature measured, applying a field of H = 10 kOe: cooling the sample down to T = 5 K with the field (open triangles), cooling the sample in zero field down to T = 100 K (open circles), and cooling applying the field down to T = 100 K (solid circles).
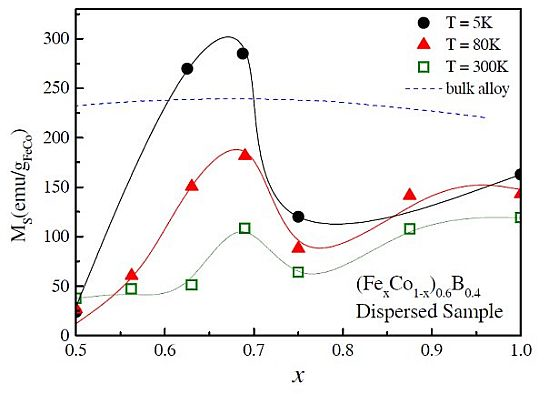
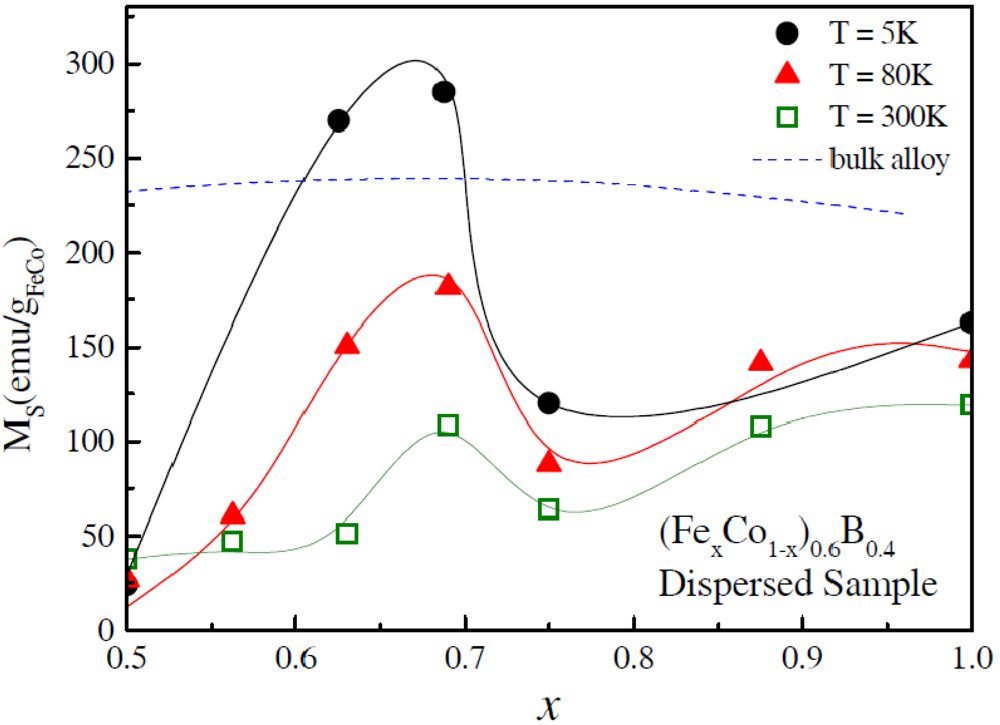
It is quite noticeable that the enhancement of the saturation magnetization decreasing temperature, related to the magnetic moment of the particles, is extremely dependent on composition.
Figure 7 shows the saturation magnetization
vs. composition for the dispersed samples at
T = 300 K, 80 K, and 5 K near the
x = 0.69 composition. In order to compare our results of magnetization in nanoparticles, we have also plotted the saturation magnetization for the bulk alloy. From the figure, it is evident that the magnetization enhancement takes effect only in a small range of composition, in opposition to the bulk materials where a broad maximum is observed. Moreover, magnetization increases with decreasing temperature for the nanoparticles at composition near
x = 0.69 are much larger than the changes of
MS for the other compositions studied. Probably, in the first case, the larger magnetic moment allows the complete ferromagnetic order in each particle at low temperature, yielding these saturation magnetization values.
Figure 7.
Saturation magnetization
vs. composition for (Fe
xCo
1−x)
0.6B
0.4 dispersed nanoparticles at
T = 5 K, 80K, and 300 K. The dashed line is the
MS bulk alloy value from [
1]. The solid lines are only a guide to the eye.
Figure 7.
Saturation magnetization
vs. composition for (Fe
xCo
1−x)
0.6B
0.4 dispersed nanoparticles at
T = 5 K, 80K, and 300 K. The dashed line is the
MS bulk alloy value from [
1]. The solid lines are only a guide to the eye.
On the other hand, the powder samples have a very different behavior. As previously mentioned, the
M(
T)measurements under ZFC and FC conditions of (Fe
0.69Co
0.31)B
0.4 composition reveal the presence of strong interactions between particles, suggesting the possibility of frustration in the magnetic order and cluster-glass behavior. Additionally, the
M(
H) curves are very different with respect to the non-interacting sample, confirming our description of the interparticle interaction role. The magnetization loops of the powder samples present a small but non-zero coercive field, which increases smoothly as the temperature decreases (
Figure 3(b) and
Figure 4). Also, the saturation magnetization is very different from the non-interacting case: the interacting particles show a
MS value close to the one at room temperature, approximately constant in temperature (
Figure 5). The different features of both samples can be understood, considering that the interparticle interactions in the powder samples strongly affect the surface spins avoiding the growing of ferromagnetic ordered regions in the shell. In the dispersed sample case, where interparticle interactions are negligible, the spins in the shell may align along the core direction and enhance particle saturation magnetization. Nevertheless, intra-particle interactions are present in the “non-interacting” (dispersed) particles, suggested by the anomalous behavior of the magnetization loop shape, the coercive field and the saturation magnetization. Evidently, the contrast observed between the two samples with (Fe
0.69Co
0.31)B
0.4 composition (where the atomic magnetic moment is a maximum) is also present in the
MS values as a function of composition, where the maximum of
MS in the powder sample is also observed at
x = 0.69, but this value is approximately constant in temperature.
