1. Introduction
Buildings are essential components of cities and the most variable basic geographic data. Accurate extraction of building information holds significant application value in aspects such as urban planning, urban management, urban digitization, and the updating of geodatabases [
1,
2,
3]. Buildings in images possess richer detailed information due to the continuous improvement of remote sensing image quality and resolution. Nevertheless, this situation also brings in a greater amount of noise, leading to a more pronounced differentiation between building areas and non-building areas [
4]. Additionally, there are issues such as diverse building scales and complex structures. Therefore, accurate and efficient high-resolution remote sensing image-based building extraction is currently a key research area.
In large-scale practical applications, employing manual extraction of information will consume a lot of human and material resources, and accuracy cannot be guaranteed. In recent years, many building extraction methods have been proposed by related scholars, including traditional methods and deep learning methods. Traditional methods, such as maximum likelihood algorithms [
5,
6], support vector machines [
7,
8,
9,
10], decision trees [
11,
12], and random forests [
13,
14,
15,
16], etc., face challenges. Since top-quality remote sensing images are packed full of diverse feature details, these algorithms rely on a priori knowledge. They utilize the shape, color, and contour of the target objects to obtain feature parameters and establish decision rules. However, they are easily restricted to building areas with specific shapes. As a result, the “salt-and-pepper” phenomenon occurs when extracting building information. Moreover, the difference in spectral brightness between features can lead to the situations of “the same object with different spectra” and “different objects with the same spectrum”, which ultimately results in low extraction accuracy and blurred boundaries. Object-oriented classification approaches have the ability to efficiently prevent classification errors that are induced by spectral disparities. These methods mainly encompass the region segmentation method [
17], texture-based segmentation [
18], and several other techniques. The segmentation parameters play a vital part in determining the precision of image segmentation. Moreover, they also augment the complexity of the classification task. Owing to the intricacy of buildings, their high density, and the occlusion caused by trees, it becomes rather arduous to extract useful information from the images.
With the rapid advancement in the realm of computer vision, deep learning models have increasingly come into the spotlight. In particular, the capability of convolutional neural networks (CNNs) to autonomously extract features has been extensively utilized in the domain of image recognition. Prominent examples of such CNN architectures include VGG, GoogLeNet, and ResNet, among others [
19,
20,
21]. Mnih [
22] adopted a convolutional neural network-based method for the extraction of buildings. Nevertheless, the relatively high computational demands associated with this approach, which influenced the segmentation efficiency, had an impact on the quality of the processed images. Shelhamer et al. [
23] proposed the fully convolutional neural network (FCN) to solve the problem, and it became the mainstream semantic segmentation framework, making use of convolutional layers in lieu of fully connected layers to bring about the first end-to-end trained network, which effectively improved training efficiency.
Generalized convolutional neural network (CNN) models cannot accurately extract the contours of buildings. In an attempt to further enhance the precision of building extraction, scholars have proposed some improved methods based on the FCN, including PSPNet [
24], DeepLabV3+ [
25], U-Net [
26], and other networks. The pyramid pooling module plays the role of the essential component within the PSPNet network. This module has the function of aggregating the contextual information from diverse regions. Through such aggregation, it effectively boosts the capacity of the network to acquire global information. DeepLabV3+ balances the exactness in segmentation with the model training time by the null convolution, which has the capacity to extract the output features from the network and use them to work out images with distinct resolutions. It is able to adjust the perceptual field with constant feature map size to extract multi-scale information. The U-Net network model, which is an improved fully convolutional neural network, inherits the features of fully convolutional neural networks, allowing the model to utilize the feature connections to the fullest between the higher and lower layers to obtain accurate output results. Among various deep learning models, the U-Net network model has stable performance, strong learning power, and high robustness. It was initially used for detecting medical images and later widely used in building extraction, while for complex remote sensing image information extraction, detailed information would be lost in maximum pooling sampling, so related scholars proposed improved algorithms. Li et al. [
27] put forward a fully convolutional U-network model to establish close connections to pull out contextual information fully and completely, which boosts the exactness in building extraction by improving the model structure and post-processing but increases the complexity of building extraction. Lei et al. [
28] introduced a U-Net (DHAU-Net) based on a dual hybrid attention mechanism, which enhances feature integration and uses the attention mechanism to focus on relevant image details. Qiu et al. [
29] proposed a refined U-Net network (Refined-UNET) with the aim of pulling out buildings more accurately by introducing an expanded spatial convolution pyramid pooling (ASPP) module and an improved depth detachable convolution (IDSC) module. Ye et al. [
30] incorporated a spatial attention mechanism and a channel attention mechanism within the U-Net network. The aim of this incorporation was to mitigate the information disparities among features at various hierarchical levels. The U-Net-based multi-loss neural network model proposed by Guo et al. [
31] added the attention module to improve model sensitivity and curb the effect of unrelated feature regions. To solve the problem of low computational efficiency, Liu et al. [
32] proposed an asymmetric convolutional residual block network to reduce the model’s size. Even though these approaches possess certain benefits for extracting buildings, the following drawbacks remain: (1) For the scale invariance and structural complexity of buildings within high-resolution remote sensing images, the ability to extract small-scale or irregular buildings is insufficient, and there are problems of wrong detection, missed detection and unclear building contours. (2) The model’s expression of global features is not enough, and voids appear within buildings. (3) The inter-class variability of buildings is low.
To address the abovementioned problems, this paper puts forward FEPA-Net. A high-resolution remote sensing image building extraction network is what it is, which integrates feature extraction and position attention modules. This network is established on the architectural framework of the U-Net model. The model employs parallel dilated convolution with different receptive field in the input feature mapping by increasing the times of convolutions and fusing them together to reduce the computation, expanding the receptive field, and avoiding the convolutional degradation caused by convolution with a too large expansion rate while applying global averaging on the final feature mapping of the feature extraction module, convolving the result by 1 × 1, and then bilinear up-sampling to obtain the required spatial dimension. The issue of unclear outline of the buildings obtained through extraction is solved, and the position channel attention module is added to the network for the purpose of obtaining multi-scale contextual information, which enhances the inter-class variability of buildings, reduces the occurrence of error and omission detection, and improves the efficiency of building extraction.
The model is validated on the Massachusetts dataset [
22] and the WHU aerial image dataset [
33], and the findings indicate that the approach presented in this paper extracts buildings completely with higher accuracy and clear building contours.
2. Materials and Methods
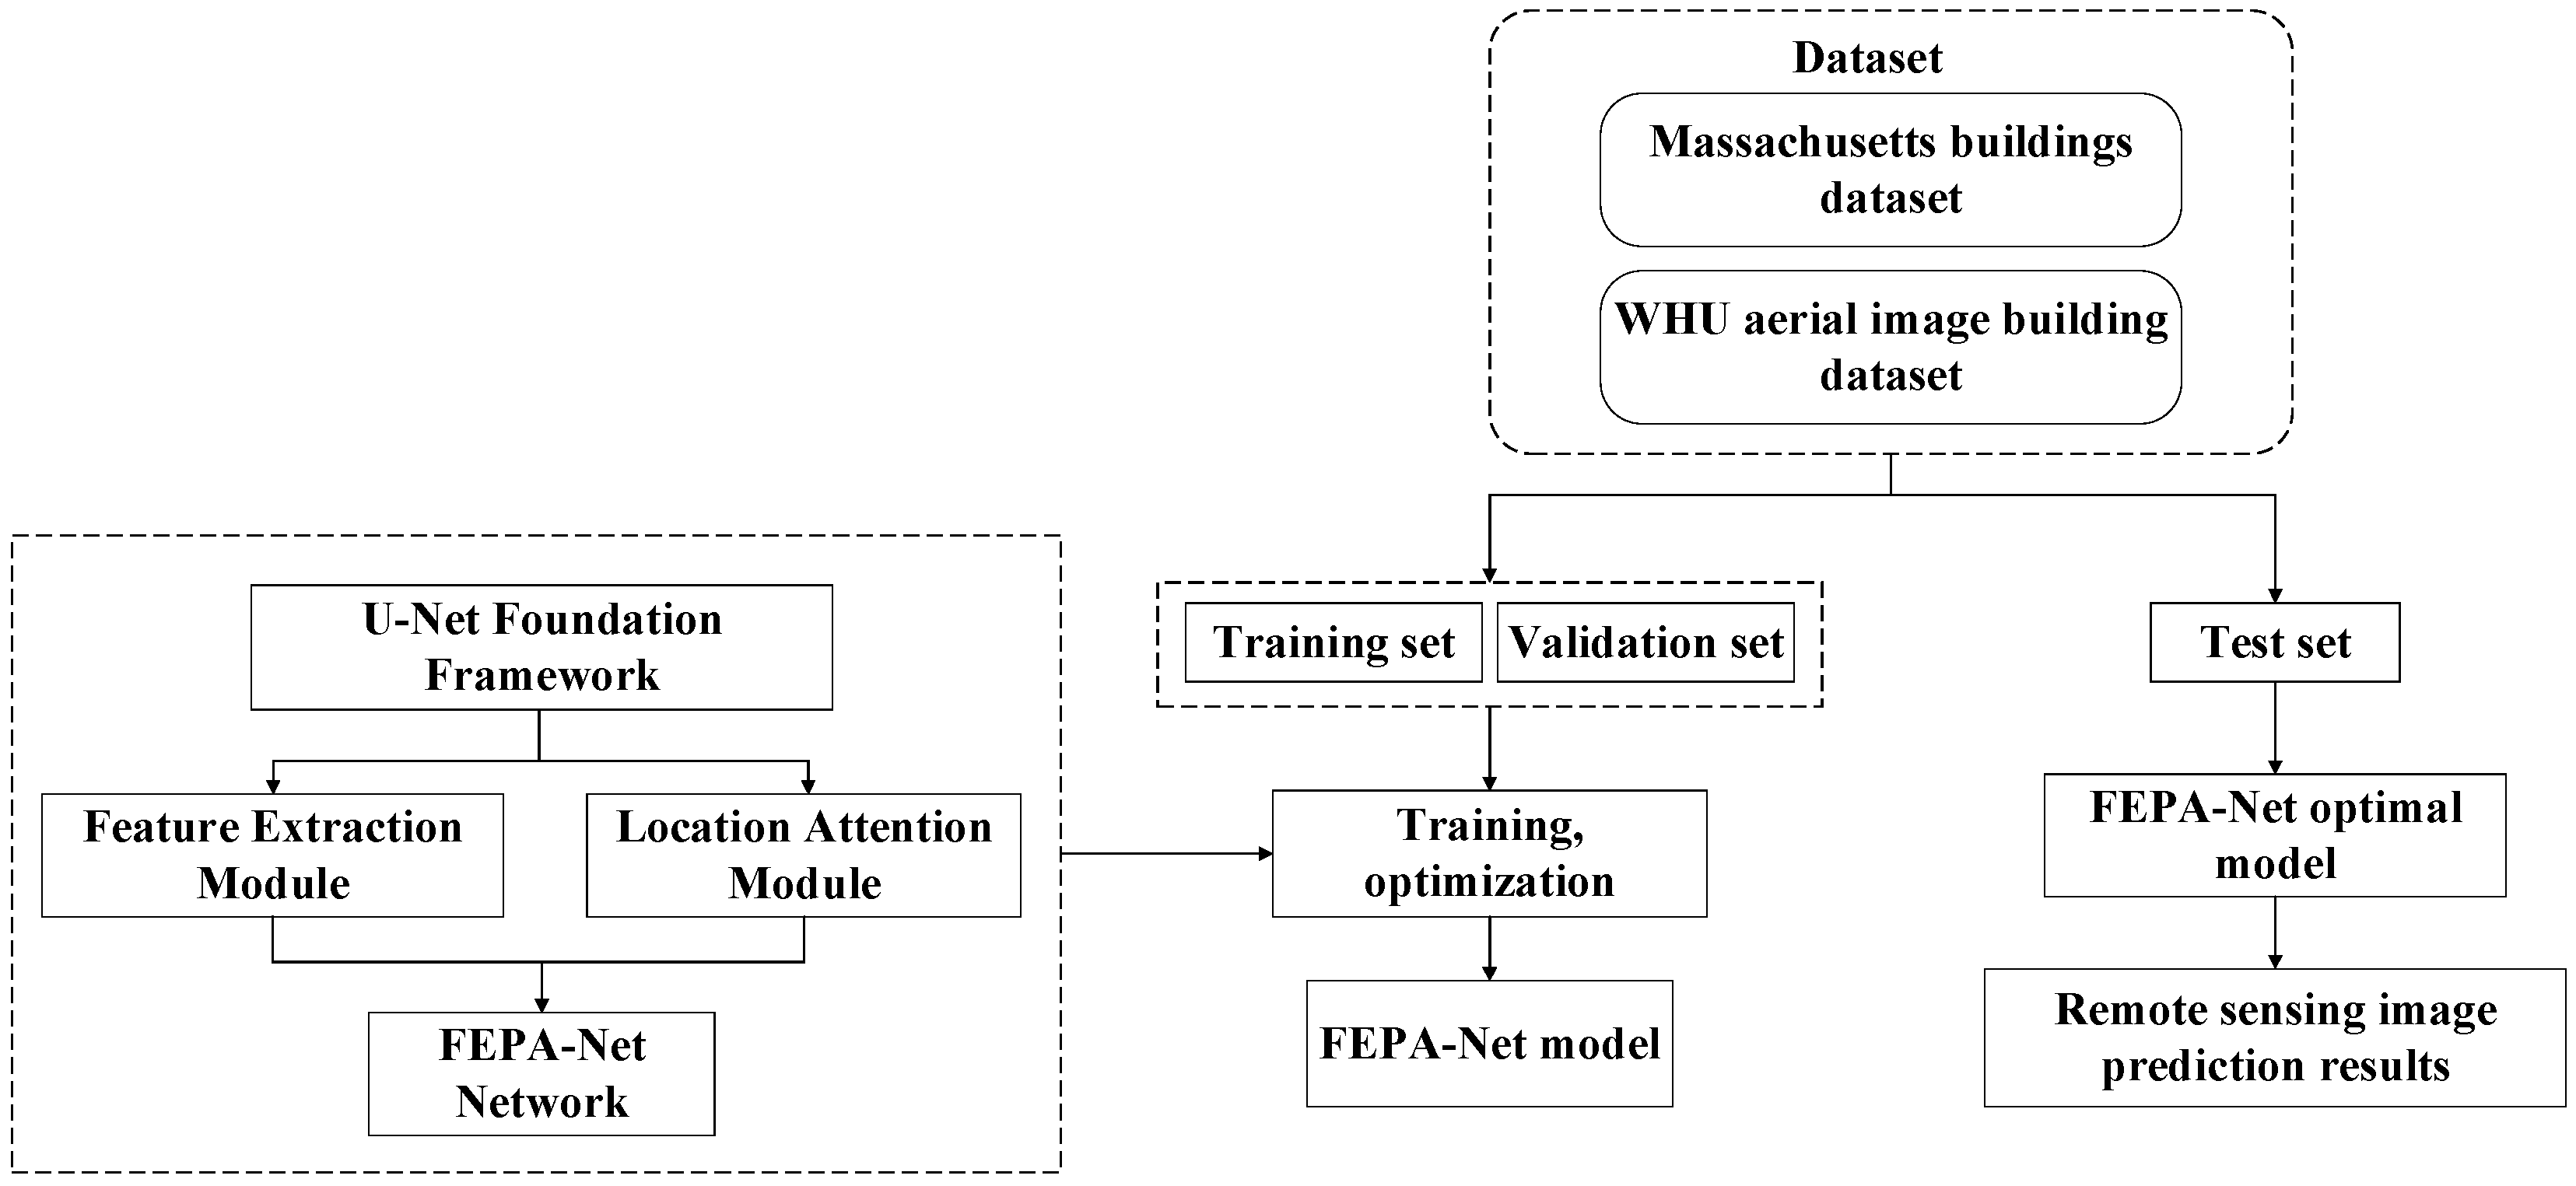
Since the classical U-Net network model based on the coding and decoding structure is prone to spatial accuracy loss, the study presented in this paper takes the improved network model FEPA-Net as the core, obtains deep multi-scale feature perceptual field information through the feature extraction module, increases the number of network convolutions, and adds the position attention module, which can effectively enhance the segmentation precision of building-related information in remote sensing images. The technical roadmap of this paper is shown in
Figure 1. First, we use two datasets, namely the Massachusetts dataset and the WHU aerial imagery dataset. The training set and the validation set are input into the FEPA-Net model. Through training and optimization, the parameters are adjusted to improve performance. Finally, the obtained optimal model is used to evaluate the accuracy of the test set and obtain the prediction results of the remote sensing images.
2.1. Dilated Convolution
To reduce the image size while increasing the field of perception, continuous convolution and pooling are usually performed on the image, or down-sampling operations are used to obtain multi-scale contextual information, which can reduce the resolution of the image as well as missing detail information. In this study, dilated convolution is incorporated into the U-Net network. This incorporation enables an expansion of the scope of perception of the convolution kernel without altering the number of parameters. As a result, each convolution output encompasses information from a broader area, and it guarantees that the extent of the output feature map remains unaltered.
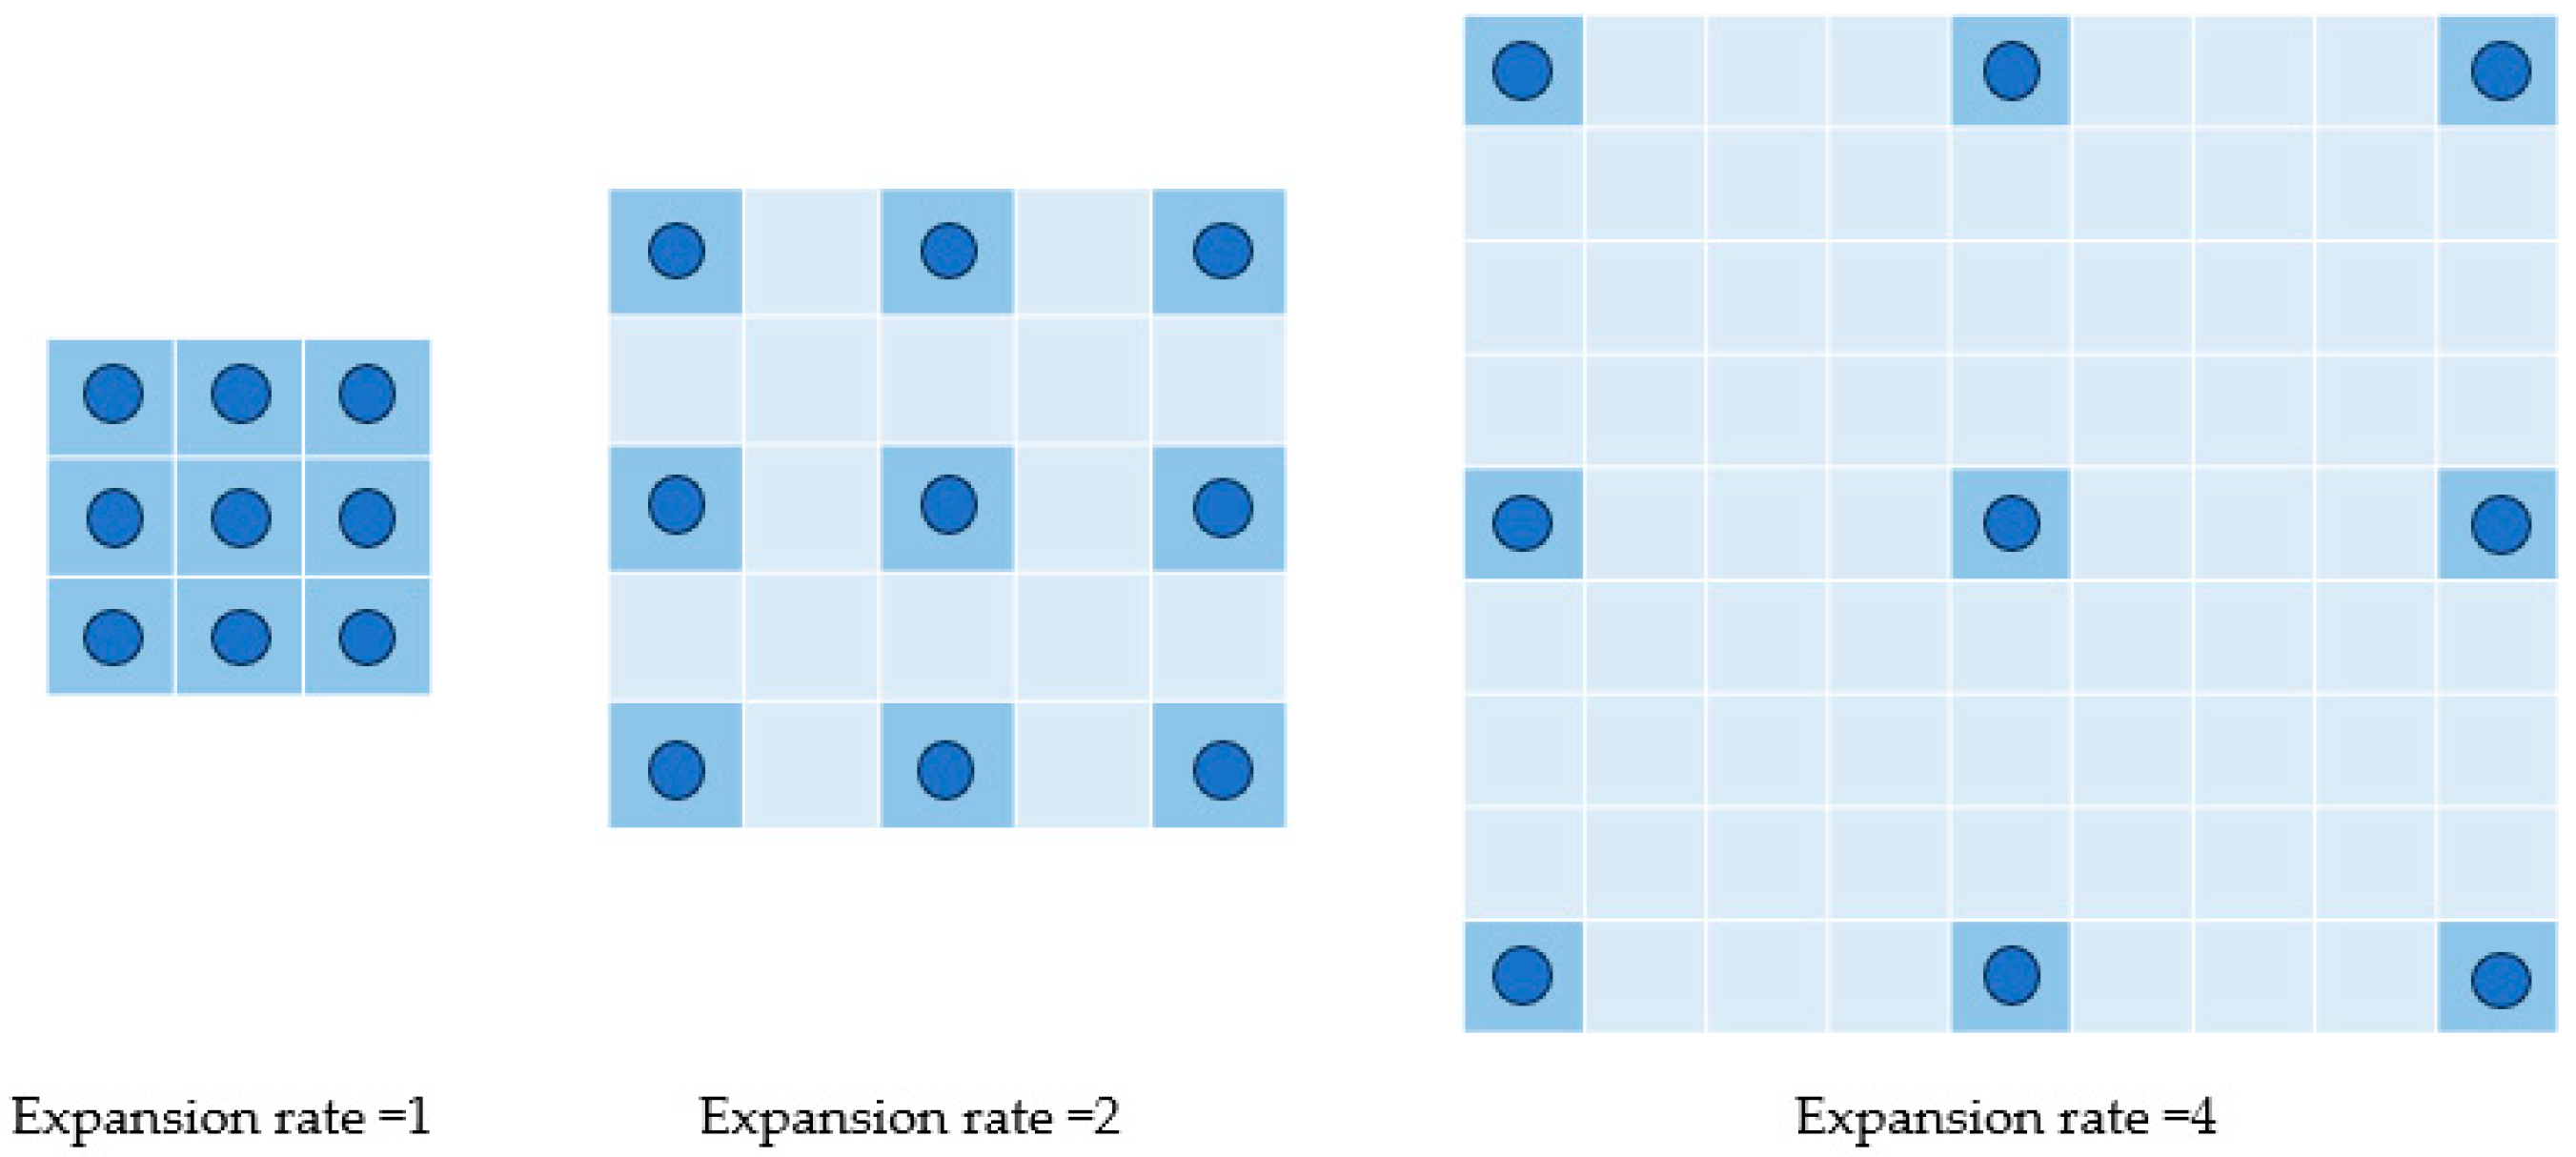
The expansion rate of the dilated convolution defines the spacing of each value when the convolution kernel processes the data, which determines the size of the perceptual field, as shown in
Figure 2. The feature maps are obtained by the dilated convolution operations with different void rates, and the fused convolutional feature maps can obtain the image’s global information and enrich the image features without increasing the number of parameters.
2.2. Feature Extraction Module
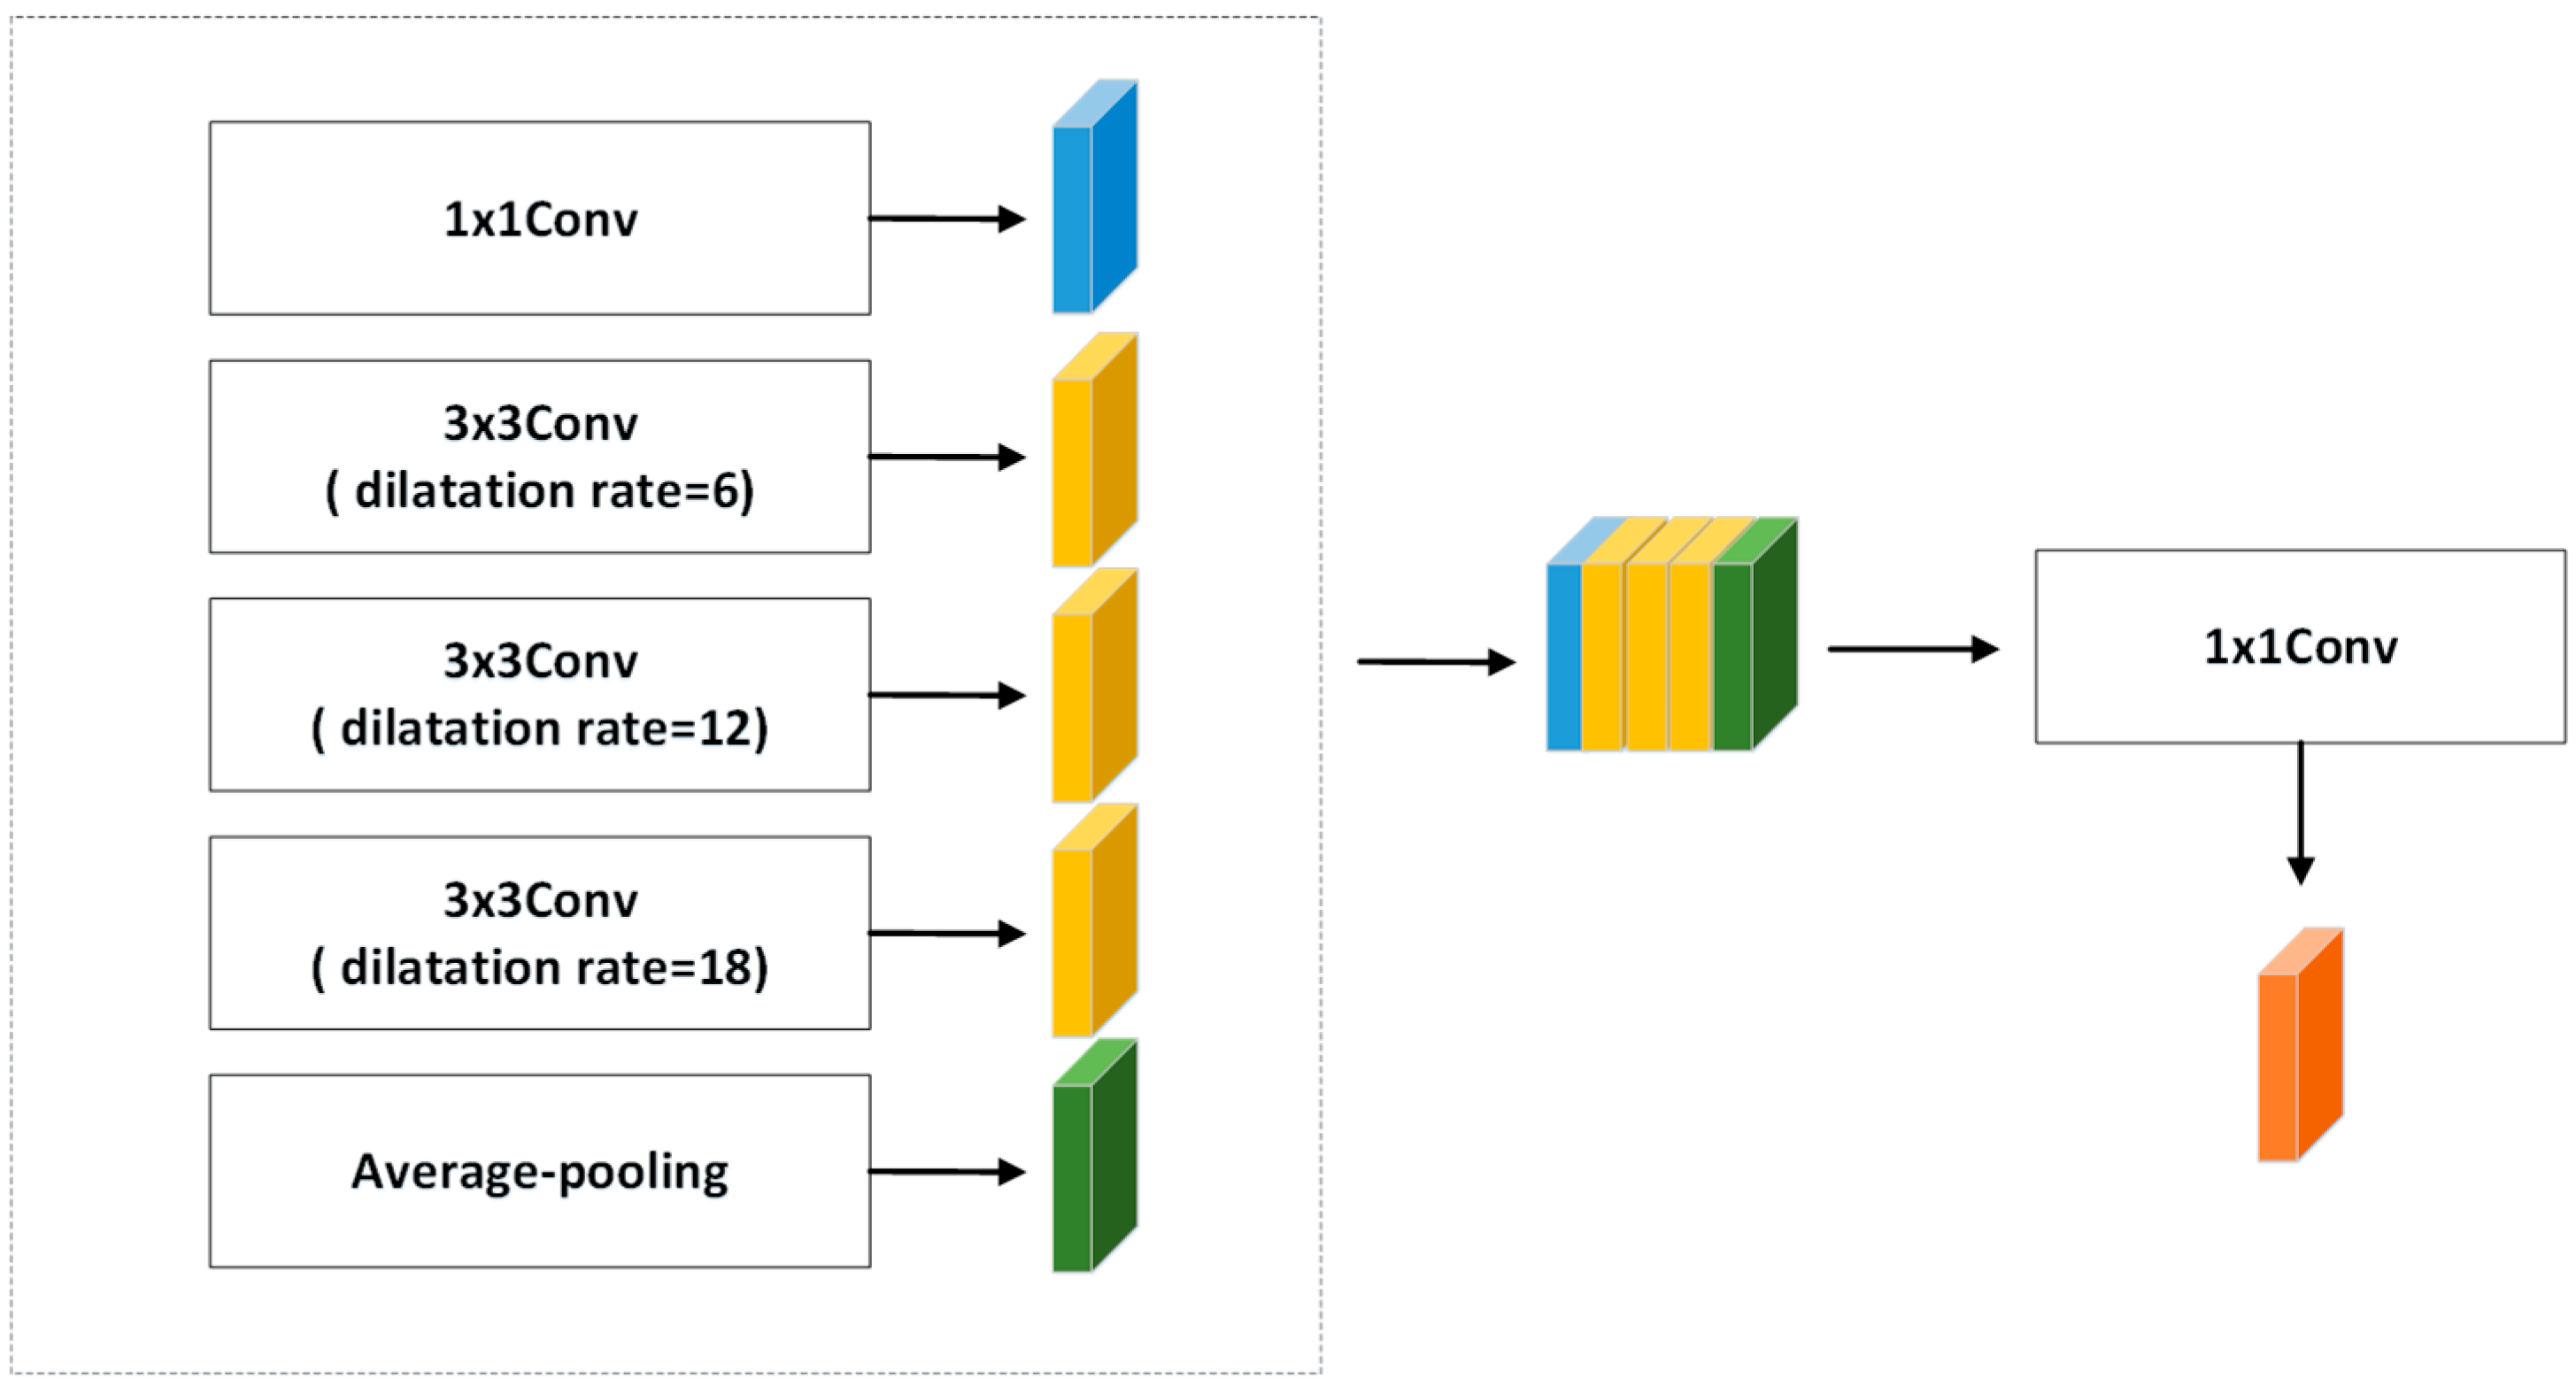
Continuous cavity convolution will image the target convolution, and the larger expansion rate cannot segment small objects completely. To address this issue, we used a feature extraction module to obtain multi-scale information using dilated convolution with different void rates. For the input image, the features are first downscaled by 1 × 1 convolution and then extracted using three parallel, kernel-sized 3 × 3 cavity convolutions with dilation rates of 6, 12, and 18 and filter numbers of 512, and then global average pooling is performed to derive the feature image, and finally the feature map is fused and the channels are adjusted by 1 × 1 convolution, which limits the model size and computational effort to derive the channel number of 512 for the new feature map, as shown in
Figure 3.
Through a series of cascades of dilated convolution combinations, the sensory field becomes larger and larger and also avoids the convolution degradation caused by convolution with too large an expansion rate. Feature maps are responsible for encoding semantic information at multiple scales. Specifically, various intermediate feature maps are utilized to encode information from distinct scales. As a result, the final output features encompass a broad spectrum of semantic information.
2.3. Position Attention Module
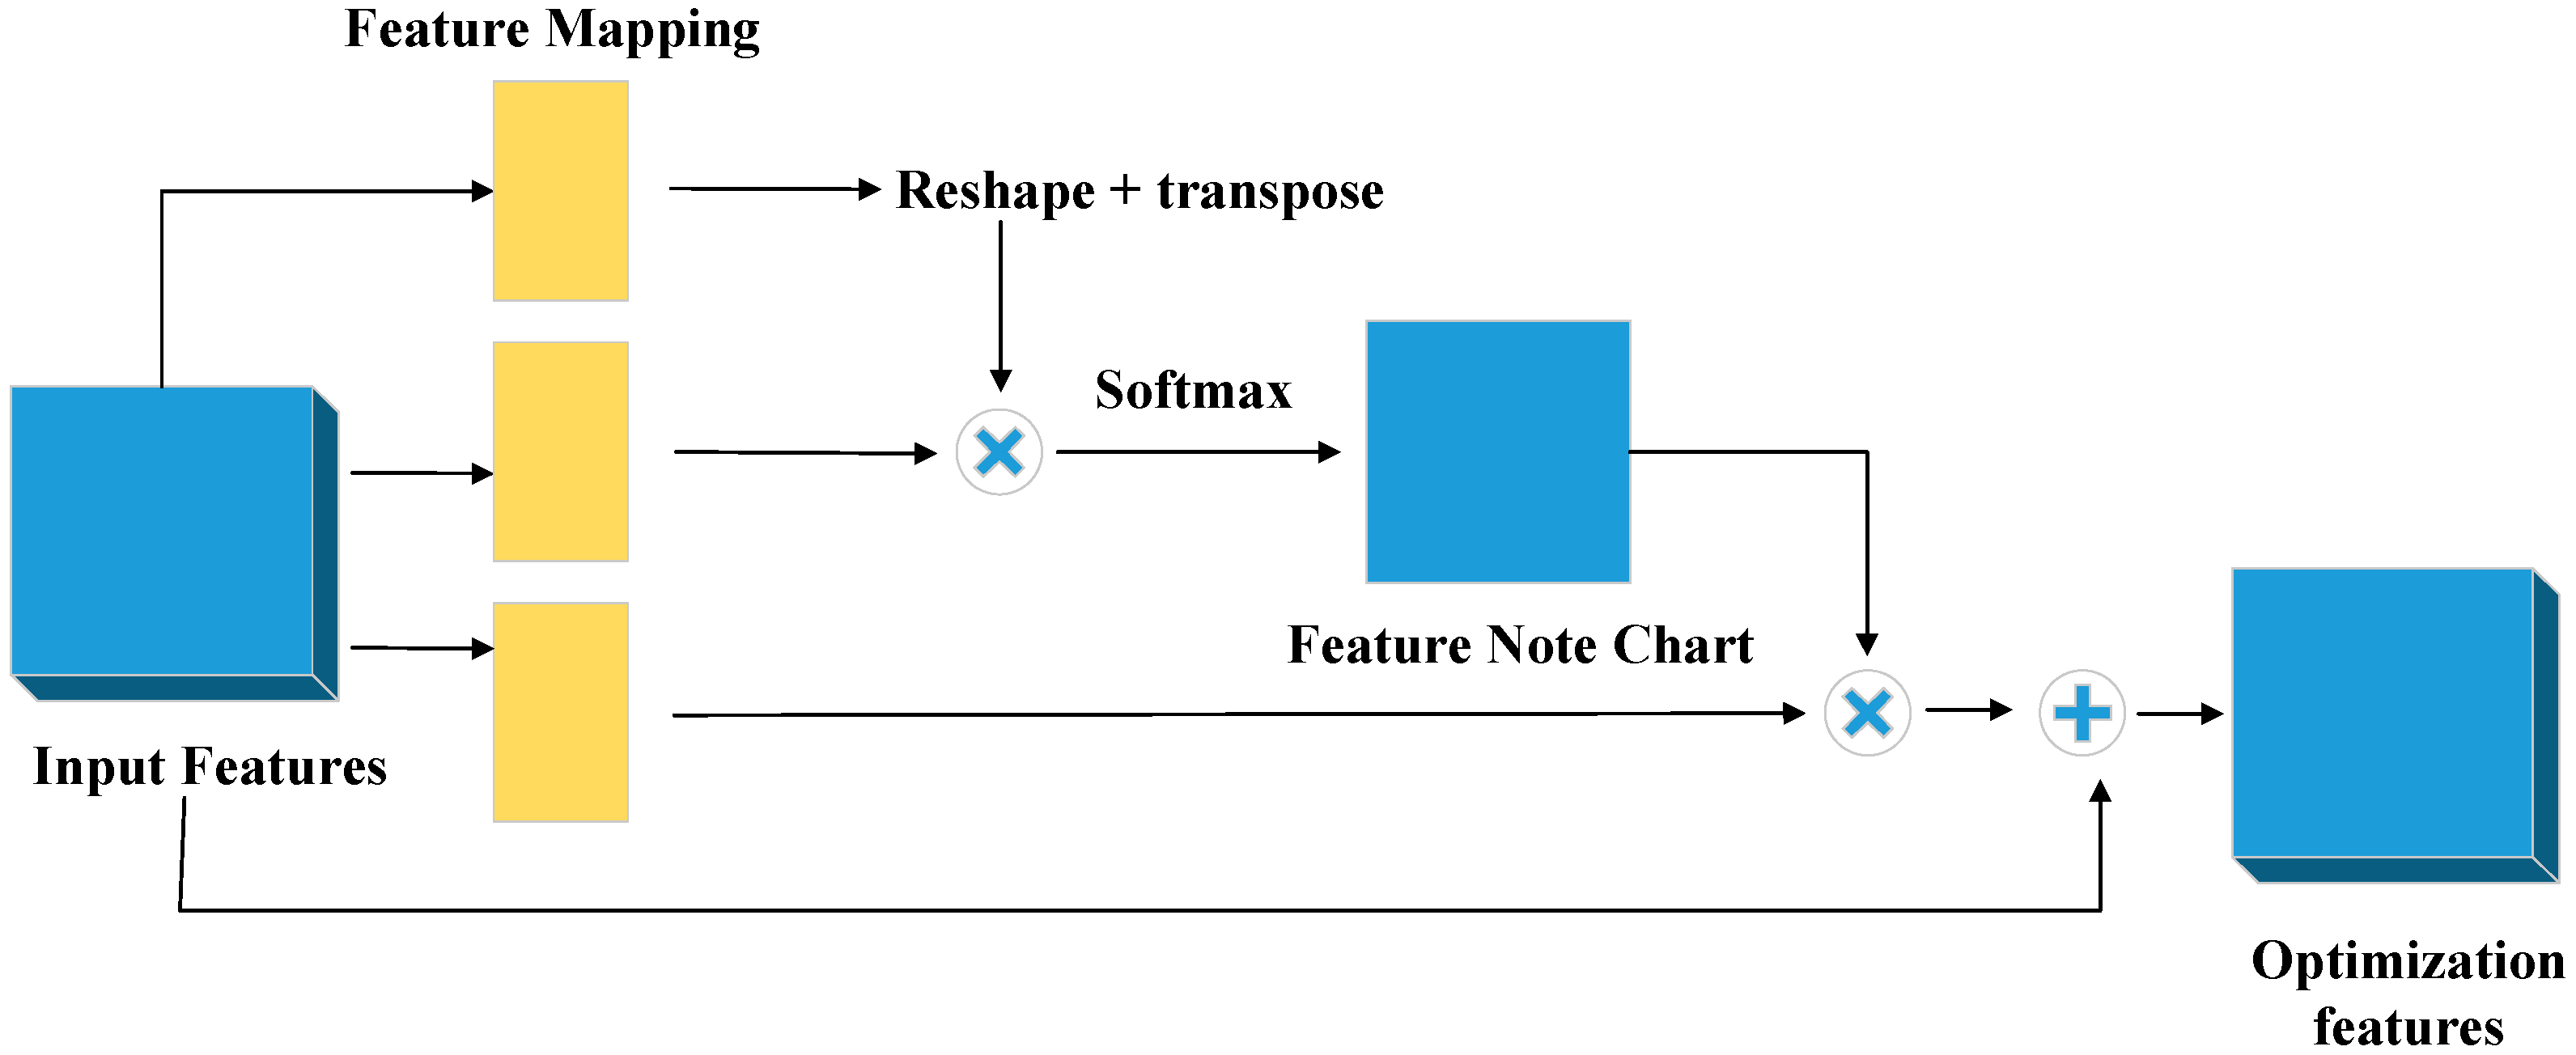
In this study, the position attention module [
34] is introduced with the aim of establishing abundant contextual relationships among local features. By leveraging the correlation between any two features, this approach enables the mutual enhancement of the representation of these individual features. Specifically, it encodes more extensive contextual information into the local features, thereby strengthening their representational capabilities. The specific working principle of the position attention module is presented in
Figure 4.
2.4. Loss Function
When aiming to train a convolutional neural network model that accurately captures the extent of divergence between the model’s predictions and the factual data, the loss function proves to be of utmost significance. It is formulated as a function of the prediction segmentation error. This error metric has the ability to be backpropagated to the preceding layers of the neural network. Through this backpropagation process, it enables the update and optimization of the weights within the network, thereby facilitating the model’s learning and improvement. The Cross-Entropy Loss (CEL) acts as a highly useful tool for assessing the performance of classification or segmentation models. It is designed to quantitatively measure the disparity between the real probability distribution state of the data and the probability distribution predicted by the model. By providing a numerical value that represents this difference, this function evaluates each pixel by considering the output of the softmax layer as a pixel classification problem; the lower the value of cross-entropy, the better the model prediction. For the binary classification problem, the cross-entropy loss function can be expressed as a binary cross-entropy (BCE) loss function as follows:
Previously, the Dice Coefficient (DC) was mainly applied as a metric for assessing the quality of segmentation results. In recent times, it has demonstrated remarkable performance when utilized as a loss function throughout the training of models.
represents the true label of the
-th sample.
represents the probability value that the model predicts the
-th sample as the positive class. DC measures the extent of overlap between the labeled image and the predicted image within the range [0, 1]; when a DC value reaches 1, it signifies a complete overlap. DC can be defined as follows:
In this paper, a combination of cross-entropy loss function and DC is employed for the training of the network model in order to facilitate the solution of the sample imbalance problem and prevent the model from overfitting.
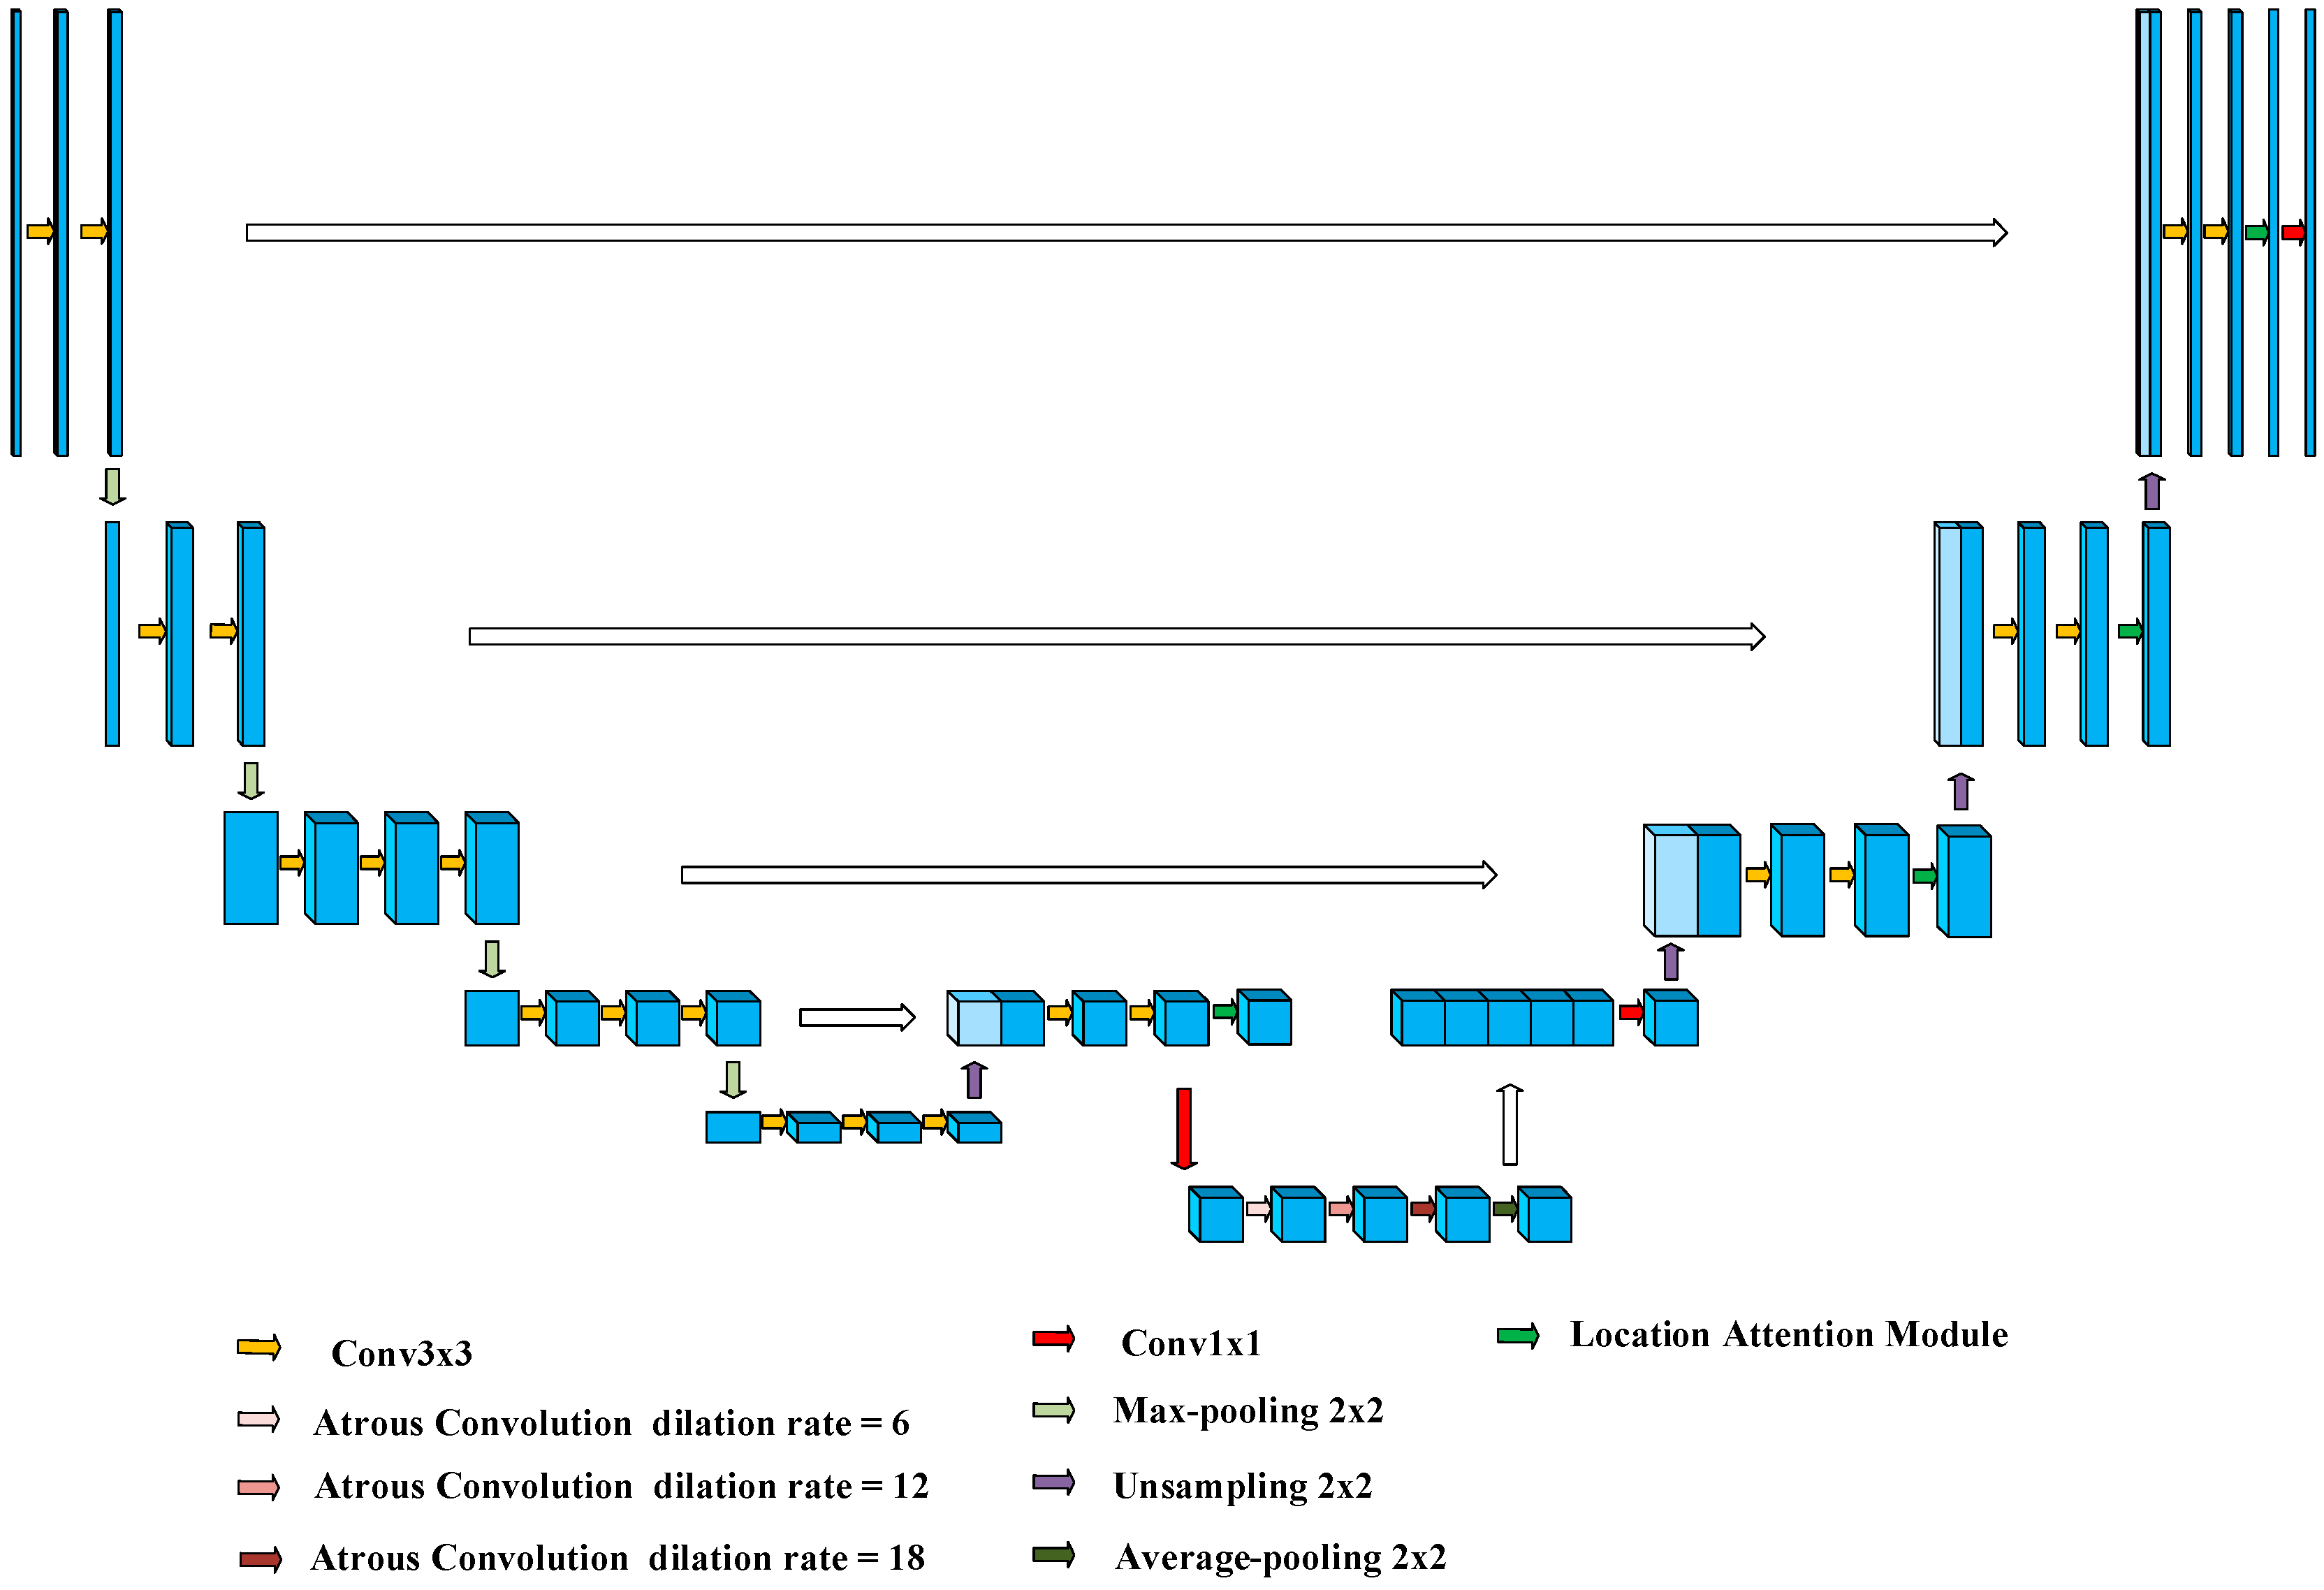
2.5. FEPA-Net Network Model
In this study, the network structure refers to the encoding–decoding structure of classical U-Net. The encoding component on the left side serves as the backbone feature extraction network. It is constructed by incorporating convolutional and max-pooling layers, enabling the acquisition of low-level spatial features. In contrast, the decoding component on the right side functions as the enhanced feature extraction network. This network is composed of up-sampling and convolutional layers, which are employed to restore the high-level abstract features of the feature map that were lost during the up-sampling process. Additionally, a stacking approach is utilized to integrate the information from diverse features, facilitating a more comprehensive feature representation, and the final obtained feature map is of the same height and width as the image taken as input.
The composition of the FEPA-Net network is presented in
Figure 5, which also adopts a symmetric encoding–decoding structure. The left half of the network is an ordinary convolutional network structure, which consists of five groups of convolution and four groups of maximum pooling; the first two groups of convolution have two 3 × 3 convolution operations, and the last three groups have three 3 × 3 convolutions, and each convolution is followed by a RELU activation function. The number of channels is 64, 128, 256, 512, and 1024. The pooling layer reduces the scale of the input feature map, allowing the model to have fewer parameters. The right portion of the network conducts up-sampling on the outputted deep abstract features and down-sampling on the outputted shallow sub-local features, with the aim of fusing these two types of features. Instead of using ordinary convolution, a feature extraction module is applied to acquire multi-scale feature information. Moreover, a position attention module is incorporated. This module is employed to fuse the feature maps at different levels for the purpose of implementing jump connections. By doing so, it enables the acquisition of contextual information relying on the feature maps of various levels; thus, it improves the network’s capability to represent features. To avoid gradient explosion and gradient disappearance, a BN (Batch Normalization) layer and a RELU activation function are added after the convolutional layer of the feature extraction module, and finally, dropout regularization is added to prevent overfitting after performing 1 × 1 convolutional compression.
2.6. Experimental Dataset
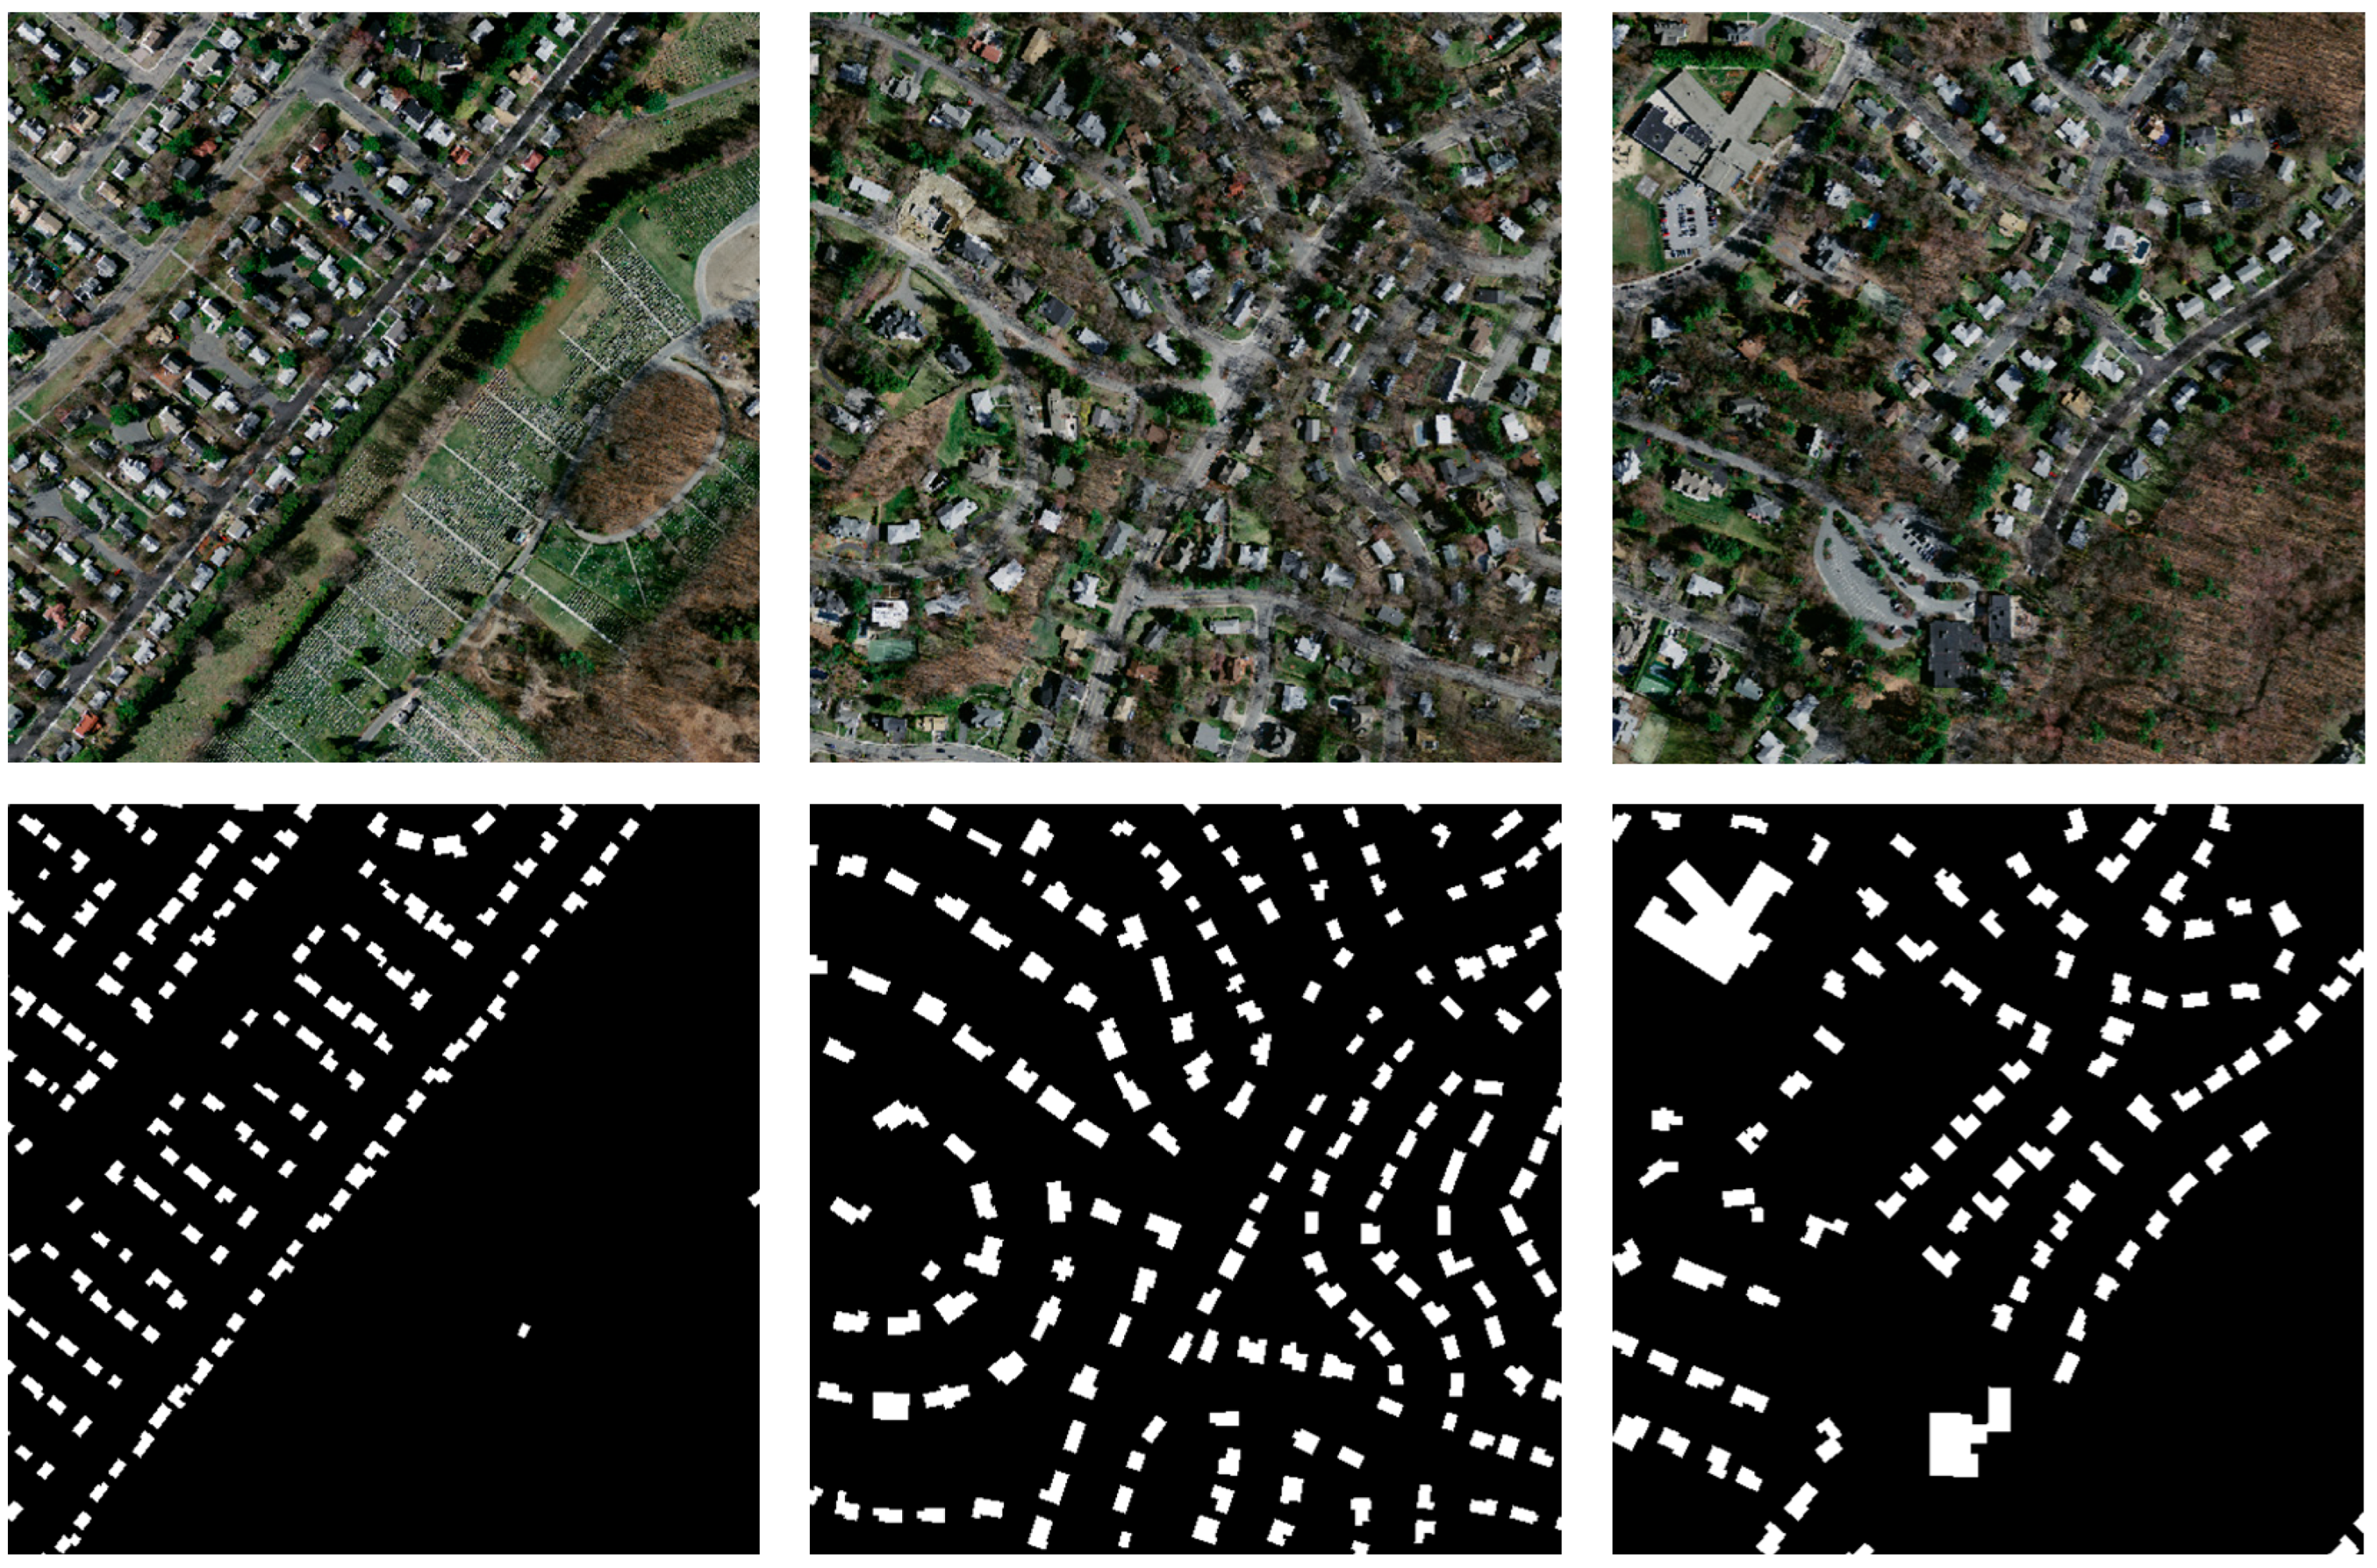
In 2013, Mnih put forward the Massachusetts dataset [
22] (
https://www.cs.toronto.edu/~vmnih/data, accessed on 15 October 2023) from the University of Toronto. This dataset consists of 151 remotely sensed images. Each image has a dimension of 1500 × 1500 pixels in terms of resolution, and the spatial resolution of these images is 1 m. The ground truth was obtained through the combination of high-resolution aerial imagery and professional geospatial analysis software. This remote sensing image dataset is divided into 137 training sets, 4 validation sets, and 10 test sets. In this study, the image size is cropped to 512 × 512 pixels, and considering the small number of datasets, the cut images are rotated, flipped horizontally and vertically and thus expanded to four times the original dataset. An example image of the Massachusetts dataset is shown in
Figure 6.
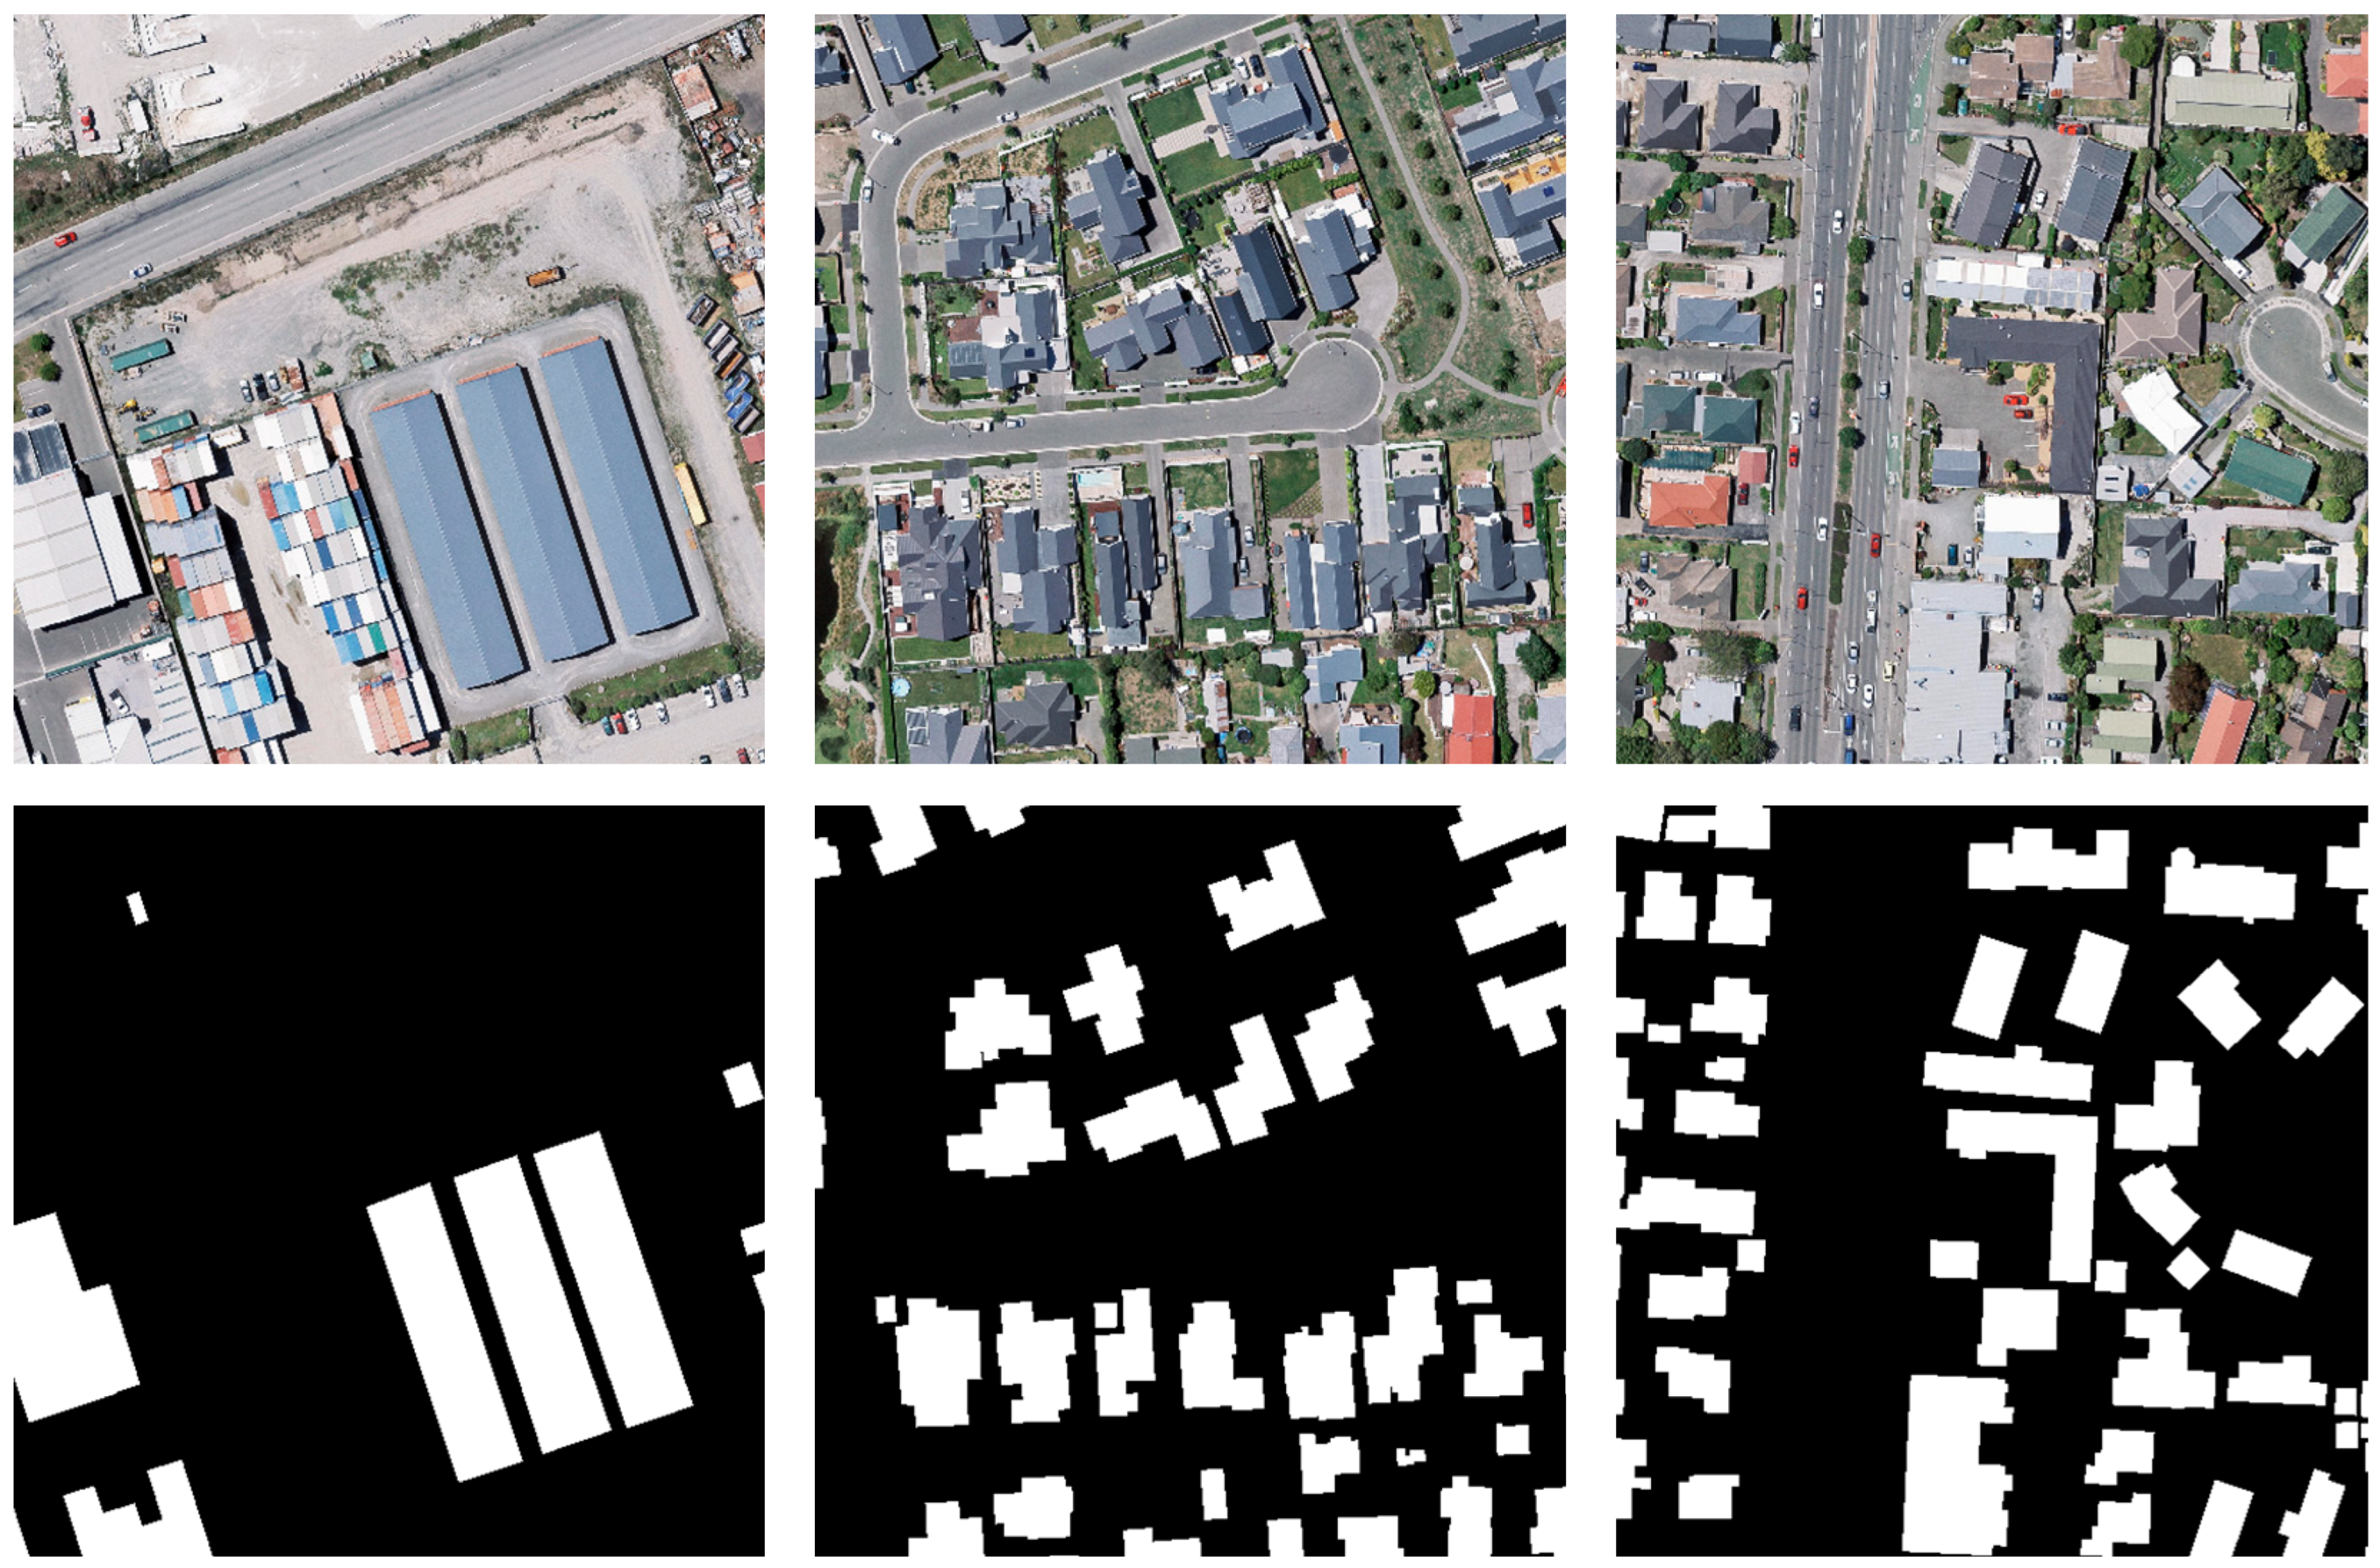
The WHU buildings dataset (
https://gpcv.whu.edu.cn/data/building_dataset.html, 15 October 2023) from Wuhan University [
33] includes an aerial dataset along with a satellite dataset, and this study uses an aerial image dataset, which covers an area of about 450 km
2 in New Zealand with a spatial resolution of 0.3 m. The ground truth data were created based on advanced photogrammetric techniques and multi-spectral remote sensing data processing. The image size in the dataset is 512 × 512 pixels, including 4736 training set, 1036 validation set, and 2416 test set images. An example image of the WHU aerial imagery dataset is shown in
Figure 7.
2.7. Experimental Conditions and Configuration
The hardware and software environment for the experiments in this study is the Ubuntu 20.04 operating system, the GPU model used is the NVIDIA GeForce RTX 3080 Ti, which is made by NVIDIA that is located in Santa Clara, CA, USA. the memory size is 12 G, and the CUDA driver and running version is 10.0. The development language used for the experiments in this study is Python 3.10, the main parameters of the network model are set before training, and the optimizer selects the Adam algorithm for network parameter update. The iteration count is set at 100 to speed up the training rate by freezing the training and also to prevent the weights from being destroyed. The starting learning rate is configured as 0.0001 for the first 50 epochs and 1 × 10⁻⁵ for the next 50; additionally, the learning rate is automatically regulated by means of stratified descent, while the values of the batch size are set to 8 and 4 in sequence.
2.8. Evaluation Index
In this paper, the confusion matrix approach is used to evaluate the model, and the following equations are chosen as the evaluation indexes of semantic segmentation: overall accuracy (OA), precision (Precision), recall (Recall), and Mean Intersection over Union (MIoU):
where TP denotes the real class, where the real class of the sample is positive and the model extracts it as positive; FN represents the class with false negative instances, in which the actual class of the sample is positive, yet the model classifies it as negative; FP is the false positive class, where the real class of the sample is negative but the model determines it to be positive; and TN is the real negative class, referring to the situation where the real class of the sample is negative and the model correctly classifies it as negative.
4. Discussion
4.1. Sensitivity Analysis
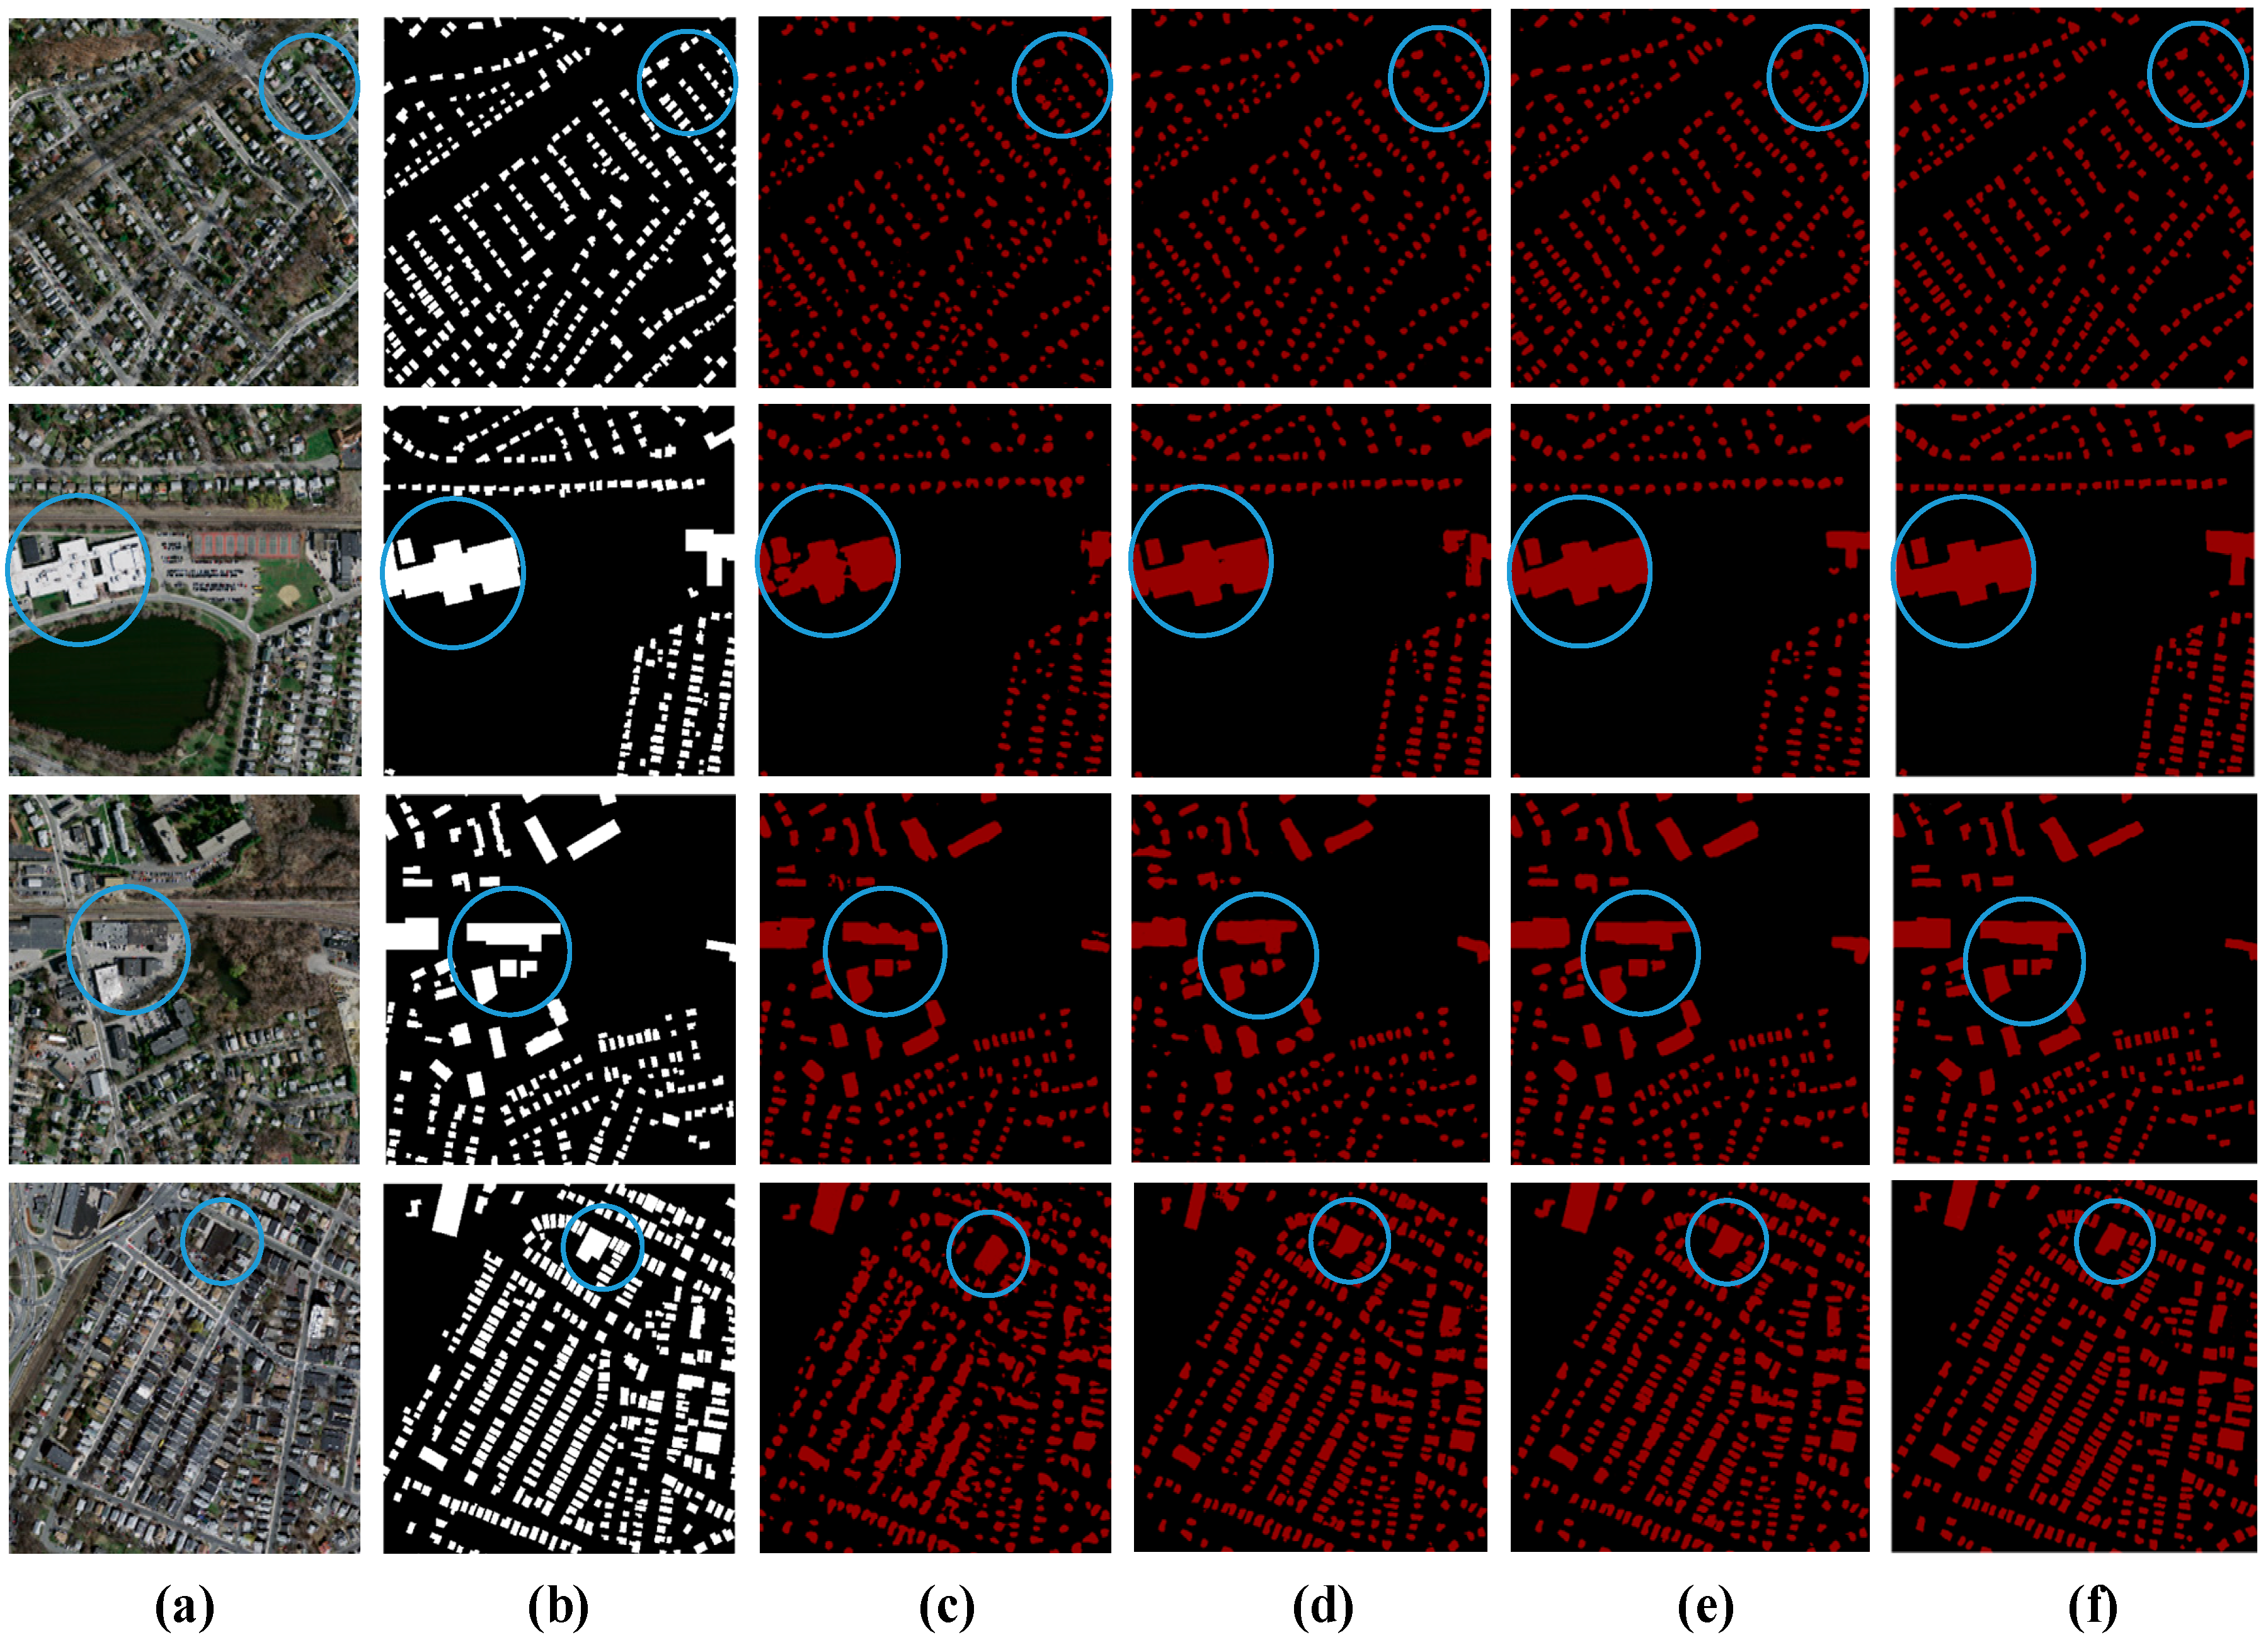
The experimental outcomes indicate that the method put forward is capable of attaining superior performance in various datasets through the integration of feature extraction and position attention modules. The put-forward method’s effectiveness predominantly stems from feature selection in both the spatial and channel dimensions, as well as label refinement by learning higher-order structural features. When dealing with building edge details, FEPA-Net can capture multi-scale features from local to global scales, facilitating the more effective capture of multi-scale spatial correlations among pixels. In particular, the spatial and channel attention mechanisms enhance useful features; they enable the model to segment buildings with high precision across various terrains and effectively filter out background information. Moreover, the designed model demonstrates outstanding scalability, and it is possible to further optimize this scalability by strengthening the encoder structure.
Although the ablation experiments described in this paper are mainly used to assess the influence of each module on the performance of the model, they also provide a certain basis for analyzing the influence of the above-mentioned features. Through the comparison of the findings from the experiment between U-Net and the U-Net+ Feature Extraction Module, it is evident that upon the insertion of the feature extraction module, the recall rate of the model rises when handling complex features. This observation suggests that the feature extraction module can identify the multi-scale features of buildings more effectively. Moreover, it mitigates, to some degree, the interference brought about by elements like lighting, color, image resolution, and texture features.
4.2. Digitization Footprint
In terms of computing resources, due to the adoption of dilated convolution, a feature extraction module, and a position attention module, compared with some basic neural network models, the demand for computing resources during its operation has increased. When conducting experiments using an NVIDIA GeForce RTX 3080 Ti GPU, although the training and inference tasks can be effectively completed, compared with the simple U-Net model, its memory usage and computational load are relatively higher. This is because dilated convolution expands the receptive field while escalating he complication of the convolution operation; the feature extraction module obtains information through multi-scale dilated convolution operations, further increasing the computational amount; and the position attention module calculates the correlation between features, which also consumes a certain amount of computing resources.
4.3. Application of the Actual Results
In the domain of urban planning, precise building extraction outcomes can offer essential foundations for urban zoning and land use planning. By accurately grasping the distribution information of buildings, planners can rationally optimize the urban spatial structure. Regarding disaster management, by contrasting the building extraction results prior to and following a disaster, the damage state of buildings can be swiftly assessed. This assessment offers support for the reasonable distribution of rescue resources and expedites the post-disaster reconstruction process. In the context of urban digitization and the updating of geographical databases, accurate building information serves as the basis for creating high-precision digital city models. Whether the building data in the geographical database are accurate directly affects the accuracy and practicality of map navigation, urban information management systems, and the like.
4.4. Limitations of the Study
Even though the FEPA-Net model has obtained favorable outcomes in building segmentation, there remain certain aspects requiring further improvement. In actuality, buildings can be influenced by multiple factors like vegetation obstruction and shadow interference. This makes it arduous to precisely extract the features of some buildings. In the future, it is essential to explore ways to further optimize the model structure. This will enable the model to more efficiently handle these intricate scenarios and accurately recognize buildings that are obscured or located in shadow areas. Meanwhile, this study is based on a vast quantity of sample data. In future work, self-learning signals generated from unlabeled data can be utilized to improve the segmentation network. Additionally, the extended applications of FEPA-Net in scenarios such as road extraction and water body extraction should be explored.
5. Conclusions
By using the FEPA-Net model to precisely extract buildings from high-resolution remote sensing images, the following conclusions were drawn:
(1) The FEPA-Net model increases the number of convolutional operations in the main part of feature extraction. It utilizes dilated convolutions with varying dilation rates on the input feature maps and integrates a module for extracting features, with the aim of obtaining the global and comprehensive information of high-resolution images. This expands the receptive field and prevents the occurrence of holes when extracting buildings.
(2) The FEPA-Net model incorporates the position attention module to obtain more abundant contextual information, thereby reducing the loss of building detail features, which not only boosts the network’s generalization ability but also enhances the completeness of building extraction.
(3) To validate the effectiveness of the FEPA-Net model, optimization and training are performed based on the Massachusetts dataset and WHU aerial image dataset, respectively, and automated building extraction is performed with PSPNet, DeepLabv3+, U-Net, and other networks for remote sensing images, and the results of qualitative and quantitative analyses show that the FEPA-Net model achieved improved results compared with the other methods.
Although the method presented in this paper can extract building information effectively, its prediction accuracy has the potential to improve. Regarding the model structure, it is feasible to contemplate incorporating other algorithms to enhance the applicability of the building extraction method, and the extraction performance merits further exploration.


