Article

Monitoring of High-Speed Railway Ground Deformation Using Interferometric Synthetic Aperture Radar Image Analysis

Geodesy Laboratory, Department of Civil, Architectural and Environmental System Engineering, Sungkyunkwan University (SKKU), Suwon 16419, Gyeonggi-do, Republic of Korea
*
Author to whom correspondence should be addressed.
Appl. Sci. 2025, 15(8), 4318; https://doi.org/10.3390/app15084318
Submission received: 20 March 2025 / Revised: 6 April 2025 / Accepted: 10 April 2025 / Published: 14 April 2025
(This article belongs to the Section Earth Sciences)

Abstract

:
Ground subsidence is a critical factor affecting the structural integrity and operational safety of high-speed railways, especially in areas with widespread soft ground. This study applies Persistent Scatterer Interferometric Synthetic Aperture Radar (PS-InSAR) techniques to monitor ground deformation along the Honam High-Speed Railway in South Korea. By processing a time series of 29 high-resolution SAR images from 2016 to 2019, the analysis yielded continuous, millimeter-level measurements of surface displacement. Maximum subsidence rates exceeding −12 mm/year were detected in embankment zones with soft subsoil conditions Validation using leveling data and corner reflectors showed strong agreement (R2 > 0.93), confirming the accuracy and reliability of PS-InSAR-derived results. The study also revealed seasonal variation in settlement patterns, highlighting the influence of rainfall and pore water pressure. The findings underscore the utility of PS-InSAR as a sustainable and cost-effective tool for long-term infrastructure monitoring. This study further contributes to the development of predictive maintenance strategies and highlights the need for future research integrating PS-InSAR with geotechnical, hydrological, and construction-related variables to enhance monitoring precision and expand its practical applicability in infrastructure management.

1. Introduction

High-speed railways play a vital role in modern transportation infrastructure, offering rapid, efficient, and sustainable mobility. However, their operational safety is highly sensitive to ground deformation, particularly in regions characterized by soft soils and active geotechnical processes. As the demand for high-speed rail services increases, ensuring the long-term safety and structural stability of railway networks becomes a critical concern, particularly in regions characterized by soft ground and active ground deformation processes [1,2]. Ground subsidence, caused by factors such as the natural consolidation of soft soils, groundwater extraction, and seismic activity, poses a persistent threat to the operational safety of high-speed railways by inducing uneven track settlements, structural distortions, and service disruptions [3,4,5,6,7]. In South Korea, the Honam High-Speed Railway traverses expansive alluvial plains, which are known for long-term consolidation and uneven settlement. These conditions have led to measurable subsidence in several sections, posing potential risks to track alignment and structural integrity [8].
Conventional ground deformation monitoring methods, such as precise leveling, Global Navigation Satellite System (GNSS) surveys, and in situ instrumentation (e.g., inclinometers and piezometers), have been widely used to assess ground stability and structural performance. These methods provide essential data for evaluating structural integrity, detecting potential hazards, and implementing timely mitigation measures.
Precise Leveling: This technique measures vertical displacements by determining height differences between fixed points and is particularly effective in monitoring subsidence and uplift in geotechnically unstable regions. For instance, geodetic leveling can determine height differences accurate to a few millimeters over tens of kilometers, making it valuable for detecting vertical land motion. Geodetic leveling has been utilized in subsidence-prone areas to track long-term vertical movements and assess their impacts on infrastructure [9].
GNSS Surveys: GNSS technology enables the accurate tracking of three-dimensional positional changes over time. By utilizing continuously operating reference stations (CORSs) and periodic geodetic surveys, GNSS has significantly improved the accuracy and efficiency of ground movement assessments. The integration of GNSS with CORSs allows for precise positioning, enhancing the reliability of deformation monitoring. Studies have demonstrated that GNSS-based monitoring can effectively detect both rapid and gradual ground deformation, supporting the early detection of potential geohazards [10,11,12,13].
While these methods offer high accuracy for localized measurements, they are inherently limited by high operational costs, labor-intensive procedures, and sparse spatial coverage, making them impractical for the large-scale, long-term monitoring of extensive high-speed railway corridors [14]. As a result, there is growing interest in adopting remote sensing technologies that can provide comprehensive, cost-effective, and continuous ground deformation monitoring across broad areas. Among these, Persistent Scatterer Interferometric Synthetic Aperture Radar (PS-InSAR) has emerged as a leading technique for detecting millimeter-level surface displacement with high temporal resolution, independent of weather conditions and daylight [15,16,17,18,19].
PS-InSAR utilizes time-series Synthetic Aperture Radar (SAR) satellite images to analyze phase differences between acquisitions, allowing for the precise detection of surface movements over long periods. This technology is particularly advantageous for monitoring critical infrastructure, such as high-speed railways, where continuous ground stability is essential for safe operations [18]. Recent studies have demonstrated the successful application of PS-InSAR for monitoring urban subsidence, landslide progression, and the structural health of large-scale facilities [19,20,21]. However, its application to high-speed railway networks, which require high levels of accuracy and reliability in detecting subtle ground movements, remains an area of ongoing research and technological development [22].
Given the complex geotechnical conditions of the Honam High-Speed Railway, combined with the critical need for preventive maintenance and disaster risk mitigation, the use of PS-InSAR represents a promising solution for enhancing infrastructure resilience. By capturing the spatial and temporal patterns of ground deformation, PS-InSAR allows railway operators to identify early warning signs of potential subsidence-related hazards, prioritize maintenance interventions, and reduce the risk of operational disruptions [1]. Furthermore, when integrated with Geographic Information System (GIS) platforms, PS-InSAR outputs can provide valuable insights into the relationship between subsidence patterns and local geotechnical, hydrological, and infrastructural factors, enabling more comprehensive and data-driven decision-making for railway asset management [23].
Although PS-InSAR has been widely applied to urban deformation and geological hazard monitoring, its implementation in high-speed railway networks—where high precision and reliability are essential—remains limited due to technical challenges and insufficient validation efforts [22]. To address these limitations, this study applies PS-InSAR techniques to monitor ground deformation along the Honam High-Speed Railway, a corridor known for soft-ground conditions and long-term subsidence risks. A total of 29 high-resolution TerraSAR-X and TanDEM-X images spanning a three-year period were utilized to ensure the accurate detection of millimeter-scale displacement.
Therefore, the objective of this study is to apply PS-InSAR techniques to monitor ground deformation along the Honam High-Speed Railway and assess the feasibility of satellite-based remote sensing for long-term infrastructure maintenance. By analyzing multi-temporal SAR datasets and validating the results through comparison with ground-based measurements, this research aims to identify critical areas of subsidence and demonstrate the advantages of PS-InSAR for high-speed railway monitoring. The findings contribute to the development of scalable, cost-effective monitoring strategies that support preventive maintenance and ensure the structural safety of railway systems in geotechnically unstable regions.

2. Materials and Methods
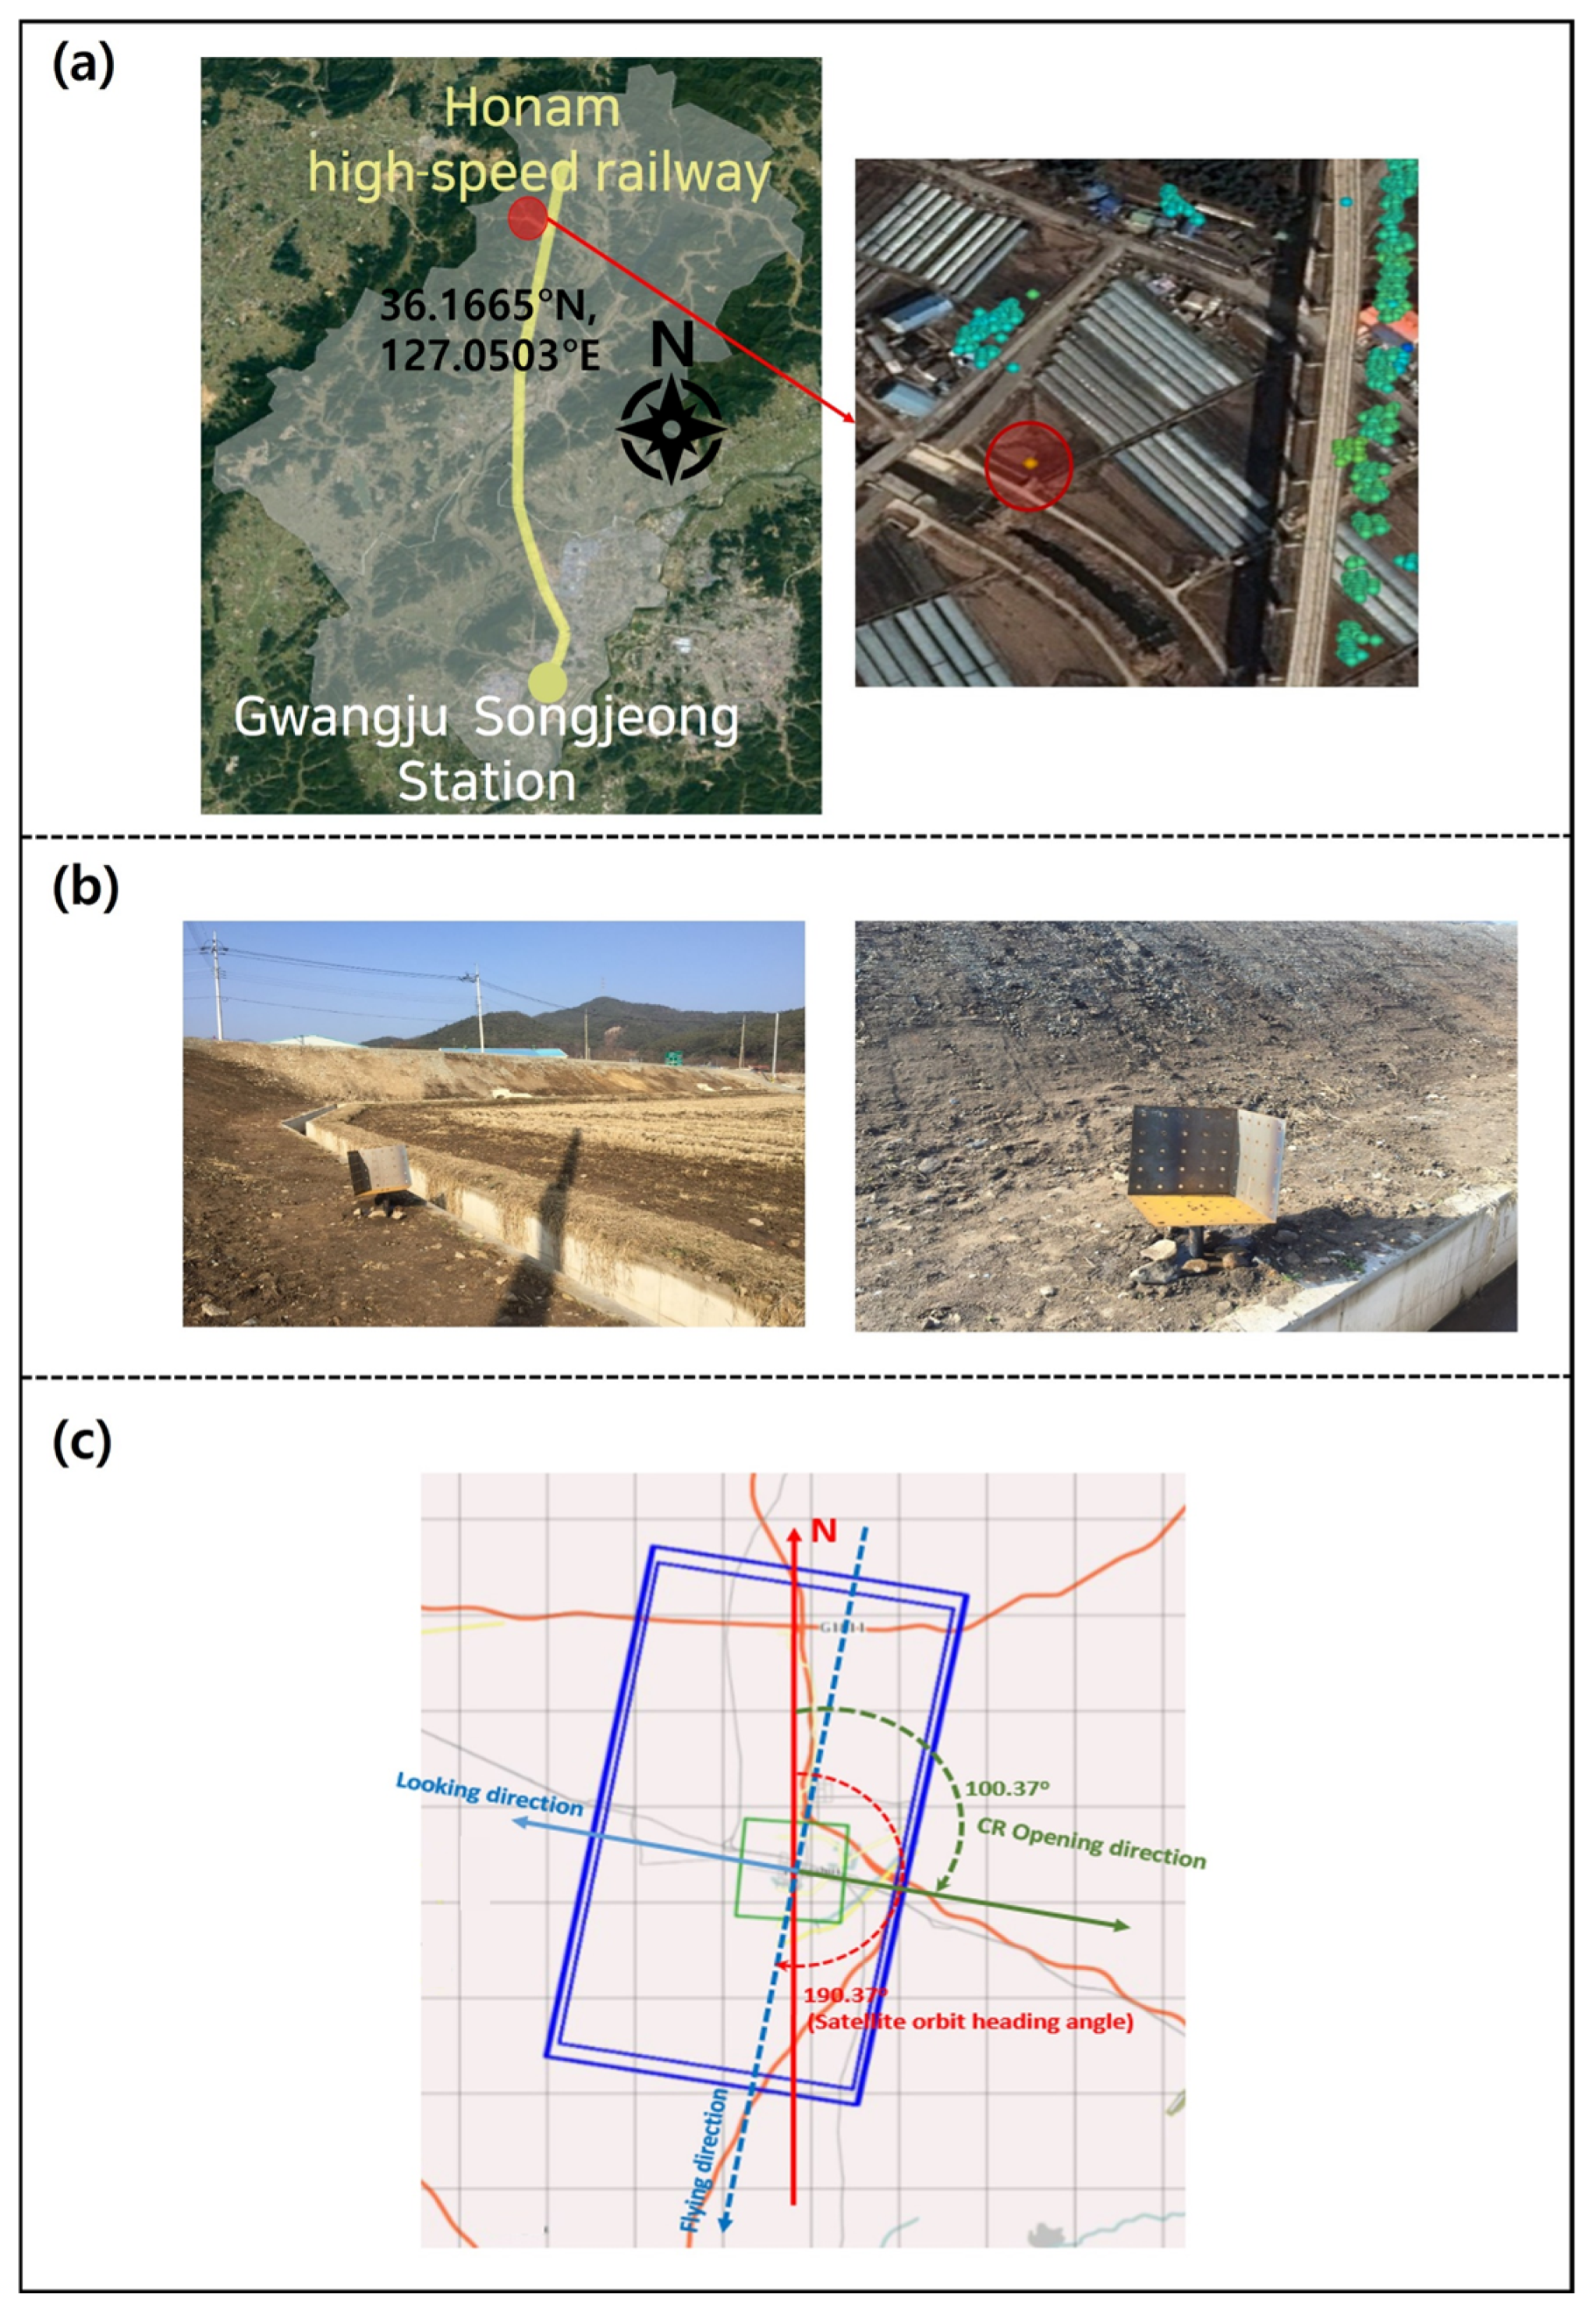
2.1. Study Area

The Honam High-Speed Railway, located in the southwestern part of South Korea, extends approximately 182.3 km, connecting the Osong and Gwangju Songjeong stations. This railway corridor crosses extensive alluvial plains characterized by weak and highly compressible soils, including clay and silty layers that are prone to long-term settlement and differential deformation [1]. These ground conditions have been identified as one of the primary risk factors affecting the structural stability and safety of high-speed rail operations in the region. Following the opening of the Honam High-Speed Railway, continuous monitoring programs reported subsidence in approximately 16% of the total line length, with maximum vertical displacements of up to 5.6 cm observed within critical embankment zones [8].
Given the presence of soft ground and the sensitivity of high-speed railway tracks to even minor deformations, this corridor has been prioritized for systematic ground deformation monitoring. Seasonal fluctuations, groundwater table variations, and cyclic loading from high-speed trains exacerbate the vulnerability of this region to cumulative subsidence. Therefore, a reliable monitoring solution capable of capturing both spatial and temporal patterns of settlement is essential for proactive maintenance and risk mitigation, as highlighted by Herrera-García et al. (2023) [24], who used InSAR to study land surface changes caused by groundwater over-extraction and their impacts on infrastructure stability.

2.2. SAR Data Description

A total of 29 high-resolution X-band SAR images were used in this study, including 24 TerraSAR-X and 5 TanDEM-X acquisitions. These images were obtained from August 2016 to September 2018, covering the entire Honam High-Speed Railway corridor. All images were acquired in HH polarization mode and exhibited varying baseline distances, temporal intervals, and Doppler centroid values.
Table 1 summarizes the detailed specifications of the SAR dataset, including the satellite type, acquisition dates, polarization, and baseline parameters. The image set was carefully selected to ensure consistent coverage and high coherence for the PS-InSAR analysis in this geotechnically sensitive corridor.
The combination of TerraSAR-X and TanDEM-X datasets ensures a sufficient data density and coverage to identify millimeter-level ground displacement across various structural elements of the railway, including embankments, bridges, tunnel entrances, and station platforms. These datasets form the core input for the interferometric processing described in the following section.
We exploited the Persistent Scatterer Interferometric Synthetic Aperture Radar (PS-InSAR) technique [15,16,19] with TERRA SAR radar images to study earth fill movements over a period of 3 years. A total of 61 Sentinel-1 images from descending orbit 8 were selected. The images were acquired in IW mode and cover the Paris city area over approximately 2.5 years, from 9 August 2016, to 29 September 2018. Only three bursts from the second swath cover the city and its surroundings, including all sites monitored using topography.

2.3. PS-InSAR Processing

The Persistent Scatterer Interferometric Synthetic Aperture Radar (PS-InSAR) technique was applied to extract time-series ground deformation data from the SAR imagery. PS-InSAR identifies stable reflectors, typically man-made structures such as railway tracks, bridges, and buildings, which maintain high coherence across multiple SAR acquisitions. This methodology is based on well-established principles described in previous studies [15,16,19], which demonstrate the capability of PS-InSAR to detect millimeter-level displacements by analyzing the phase stability of persistent scatterers over time. Figure 1 illustrates the PS-InSAR processing flowchart, detailing the sequential steps involved in the analysis.
The PS-InSAR processing workflow was as follows:
(1)
Co-registration—All SAR images were geometrically aligned to a master scene to ensure pixel-level correspondence throughout the stack [16].
(2)
Interferogram Generation—Interferograms were created for each SAR interferometric pair, calculating phase differences attributable to surface displacement while minimizing temporal and spatial decorrelation effects [20].
(3)
Atmospheric Phase Screen (APS) Correction—Subsequently, atmospheric artifacts, particularly those induced by tropospheric delays, were mitigated using spatial filtering techniques and temporal low-pass filters [21].
(4)
Persistent Scatterer Identification—Points with a high temporal amplitude stability and phase coherence were automatically identified and extracted as persistent scatterers [18].
(5)
Time-Series Analysis: Finally, displacement time series were computed relative to a network of ground control points (GCPs), ensuring temporal consistency throughout the analysis [19].
Commercial PS-InSAR processing software was used to conduct the analysis. The processing parameters were optimized based on the characteristics of the SAR dataset (pre-processed with SNAP 6.0), which consists of 29 high-resolution X-band images (24 TerraSAR-X images and 5 TanDEM-X images) acquired between August 2016 and September 2018. All scenes were acquired in HH polarization with varying baselines, temporal intervals, and Doppler centroid values. The reference (master) image, acquired on 23 October 2017, was used to generate interferometric pairs for the time-series analysis.
These processing configurations were carefully selected to reflect both the specific properties of the imagery and the geotechnical conditions of the Honam High-Speed Railway corridor, enabling precise and reliable deformation monitoring.

2.4. Validation with Ground Measurements

The validation of PS-InSAR results is essential to ensure the reliability of satellite-derived displacement measurements [19]. In this study, ground-based observations from precision leveling surveys and corner reflectors were used for verification purposes. Precision leveling was conducted along key sections of the railway, particularly those with a history of subsidence or where maintenance activities had been previously undertaken.
Seventeen corner reflectors were installed across the study area to enhance the PS-InSAR measurement accuracy by providing strong, stable radar targets. These reflectors were strategically placed in both stable and subsiding zones to enable a comparative analysis. Additionally, GPS-based ground control points (GCPs) were deployed to provide a continuous three-dimensional coordinate reference for validation. The displacement time series derived from PS-InSAR were directly compared with ground-based measurements, and correlation analyses were conducted to assess the agreement between the two datasets. Correlation coefficients (R2) exceeding 0.93 in critical sections indicated high consistency and validated the reliability of the PS-InSAR monitoring approach.
Quantitatively, the Root Mean Square Error (RMSE) between satellite-derived and field measurements remained within ±2.4 mm, satisfying engineering-level deformation monitoring thresholds. Figure 2 illustrates the spatial alignment between the PS-InSAR results and ground-based observations, emphasizing the capability of this technique to capture localized subsidence with high accuracy.

2.5. Fundamentals of InSAR and Interferometric Geometry

To support the interpretation of the PS-InSAR analysis results, this section introduces the fundamental physical and geometric principles of Interferometric Synthetic Aperture Radar (InSAR).
Radar signals transmitted from satellites are reflected back from the Earth’s surface, carrying both amplitude and phase information. The phase component is highly sensitive to changes in the distance between the satellite and the ground surface, allowing for the detection of subtle displacements through a differential phase analysis over time [15].
The primary output of InSAR processing is an interferogram, which visualizes phase differences as fringe patterns. These fringes indicate the relative displacement between acquisition dates, typically projected along the satellite’s Line-of-Sight (LOS) direction. However, the measured phase difference is affected not only by surface displacement but also by topographic variations, atmospheric delay, orbital errors, and noise. Therefore, a reliable deformation analysis requires correction procedures, such as orbital refinement, Atmospheric Phase Screen (APS) mitigation, and phase unwrapping [16].
Figure 3 illustrates the fundamental imaging geometry of repeat-pass InSAR. In the fundamental setup, a radar signal with a specific wavelength is transmitted from a satellite to a ground target point P, and the backscattered signal is received by the onboard sensor. Within the SAR data, these signals are stored as complex numbers comprising both amplitude and phase, known as a Single Look Complex (SLC) image. The SLC image represents radar data acquired from a specific satellite position during a single pass.
When the satellite passes over the same region again along a nearly identical orbit, a second SAR image is acquired from a slightly displaced antenna position. The distance between the first antenna position and the ground target point P is denoted as R, while the distance from the second antenna position to the same ground point is expressed as R’. Although the satellite maintains a consistent orbital path, there exists a spatial separation between these two imaging locations, referred to as the baseline (B). It is defined as the distance between the antenna positions and forms an angle α (alpha) with the horizontal plane. The satellite altitude is represented as H, and the look angle between the satellite and the ground target is denoted as θ (theta).
Due to this baseline, a slight geometric offset arises between the two imaging positions. This offset causes a phase difference between the corresponding pixels of the two SAR images, which reflects the variation in signal travel paths between the satellite and the ground surface. This phase difference serves as the fundamental observation in InSAR analysis for deriving surface deformation or topographic features.

2.6. Mathematical Modeling of InSAR Phase Components

Interferometric Synthetic Aperture Radar (InSAR) calculates surface deformation and topographic information by analyzing the phase difference between two SAR images acquired at different times from slightly different satellite positions [25]. The radar signals received from the ground are recorded as complex numbers containing both amplitude and phase, forming Single Look Complex (SLC) images [17,26].
When two SLC images are acquired from different positions, the difference in the distance between the satellite and the ground target introduces a phase difference. This phase difference is directly related to the surface displacement and is influenced by the baseline distance between the satellite positions, the radar wavelength, and the geometry of acquisition [27].
The interferometric phase is derived by multiplying one image with the complex conjugate of the other. This phase consists of contributions from ground deformation, topography, orbital errors, atmospheric delays, and noise. To isolate the deformation phase, these error components are removed through correction procedures [15].
The simplified interferometric phase can be expressed as a function of the perpendicular baseline, target height, radar wavelength, slant range, and incidence angle. Ultimately, the target elevation and deformation are calculated using these geometric and physical parameters. The final phase model is fundamental for generating Digital Elevation Models (DEMs) and monitoring ground deformation with high precision [16].
In Figure 3, the SAR data received by antennas A1 and A2 are represented as S1 and S2. Here, S1(R) and S2(R) are the complex numbers of the radar signal, ϕ (R) and ϕ (R + ΔR) are the phase components of the radar signal, and u1(R) and u1(R + ΔR) are the amplitude components of the radar signal.
S 1 R = u 1 R exp i ϕ R
S 2 ( R ) = u 2 R + Δ R exp i ϕ R + Δ R
The received data contain phase information obtained from repeat-pass orbits, along with error phases caused by noise, scattering, and other factors. The phase components arg(u1) and arg(u2) represent the error phases induced by scattering and noise. Due to the baseline distance B, a difference in incidence angles occurs between the two acquisitions, resulting in discrepancies between the two SAR images.
ψ 1 = 2 2 π λ R + arg u 1
ψ 2 = 2 2 π λ R + Δ R + arg u 2
By multiplying the two images with their complex conjugates, an interferometric image containing phase difference information can be obtained, where the phase values are represented as real numbers. Assuming that the irregular phase values of the two images are identical, the phase of the interferometric image is determined by ΔR.
ϕ = 4 π λ Δ R + 2 π N     where    N = 0 ,   ± 1 ,   ± 2 ,  
The phase value of the interferometric image is represented as the sum of the absolute phase value and residual noise. To derive the absolute phase, undergoing the absolute phase restoration process is necessary to eliminate noise. By simplifying this equation, excluding the ΔR2 term, the resulting expression is as follows:
s i n θ 0 α = R + Δ R 2 R 2 B 2 ( 2 R B )
z = H R c o s θ 0
In general, the value of ΔR is extremely small, and thus ΔR2 can be considered negligible and omitted. In the case of SAR sensors mounted on satellites, the baseline distance B between antennas is significantly smaller than the distance R between the satellite and the target point on the Earth’s surface. Therefore, the equation can be simplified in terms of B 2 2 R 0 as follows [26,27]:
Δ R B s i n θ 0 α + B 2 ( 2 R )
Δ R B sin θ 0 α
In the geometric relationship shown in Figure 3, the baseline B can be separated into horizontal and vertical components, expressed as B∥ and B⊥, respectively. By applying these to Equation (10), the final interferometric phase can be expressed as follows:
B = B × sin θ 0 α
B = B × cos θ 0 α
Δ R B  
φ = 4 π λ × B  
The final interferometric phase includes the elevation information of the ground target relative to the satellite; however, it also contains various error components in addition to the surface deformation phase. Therefore, these errors must be corrected and removed to obtain accurate measurements [15,16,26,28].
φ o b s e r v a t i o n = φ d e f o + φ t o p o + φ o r b i t + φ a t m + φ n o i s e
φ d e f o = φ o b s e r v a t i o n φ t o p o φ o r b i t φ a t m φ n o i s e
In Equations (14) and (15), φ_observation represents the total interferometric phase, which includes various error components. φ_defo indicates the phase component caused by surface deformation. φ_topo accounts for the phase component related to topography, which is corrected using a Digital Elevation Model (DEM). φ_orbit represents the orbital error phase due to inaccuracies in the satellite’s orbit. φ_atm refers to the atmospheric phase delay caused by atmospheric conditions, and φ_noise denotes the phase noise caused by system and environmental factors.
Based on the geometric structure of DEM generation illustrated in Figure 3 (geometric relationship), the resulting phase allows for the estimation of the elevation of the target point P on the surface. Here, h represents the elevation of the target point P, while H denotes the altitude of the radar antenna. By applying the law of cosines, the relationship can be expanded as follows, where φp represents the phase difference between the two radar signals [29,30,31].
The elevation h of a ground point is calculated by
h = H R × cos θ
where H is the satellite altitude and R is the slant range. This relationship is fundamental in topographic phase modeling [26]. Ultimately, the elevation h of the target point P can be expressed using the following equation. If no ground deformation occurs between the two SAR acquisitions, the elevation of the ground target point P represents the topographic height of the surface. Consequently, the Digital Elevation Model (DEM) of the target area is generated based on the terrain of the imaged region [25,26,32,33,34,35].
h = H R cos θ = H B 2 φ p λ 4 π 2 2 B sin θ α φ p λ 2 π × cos θ

3. Results

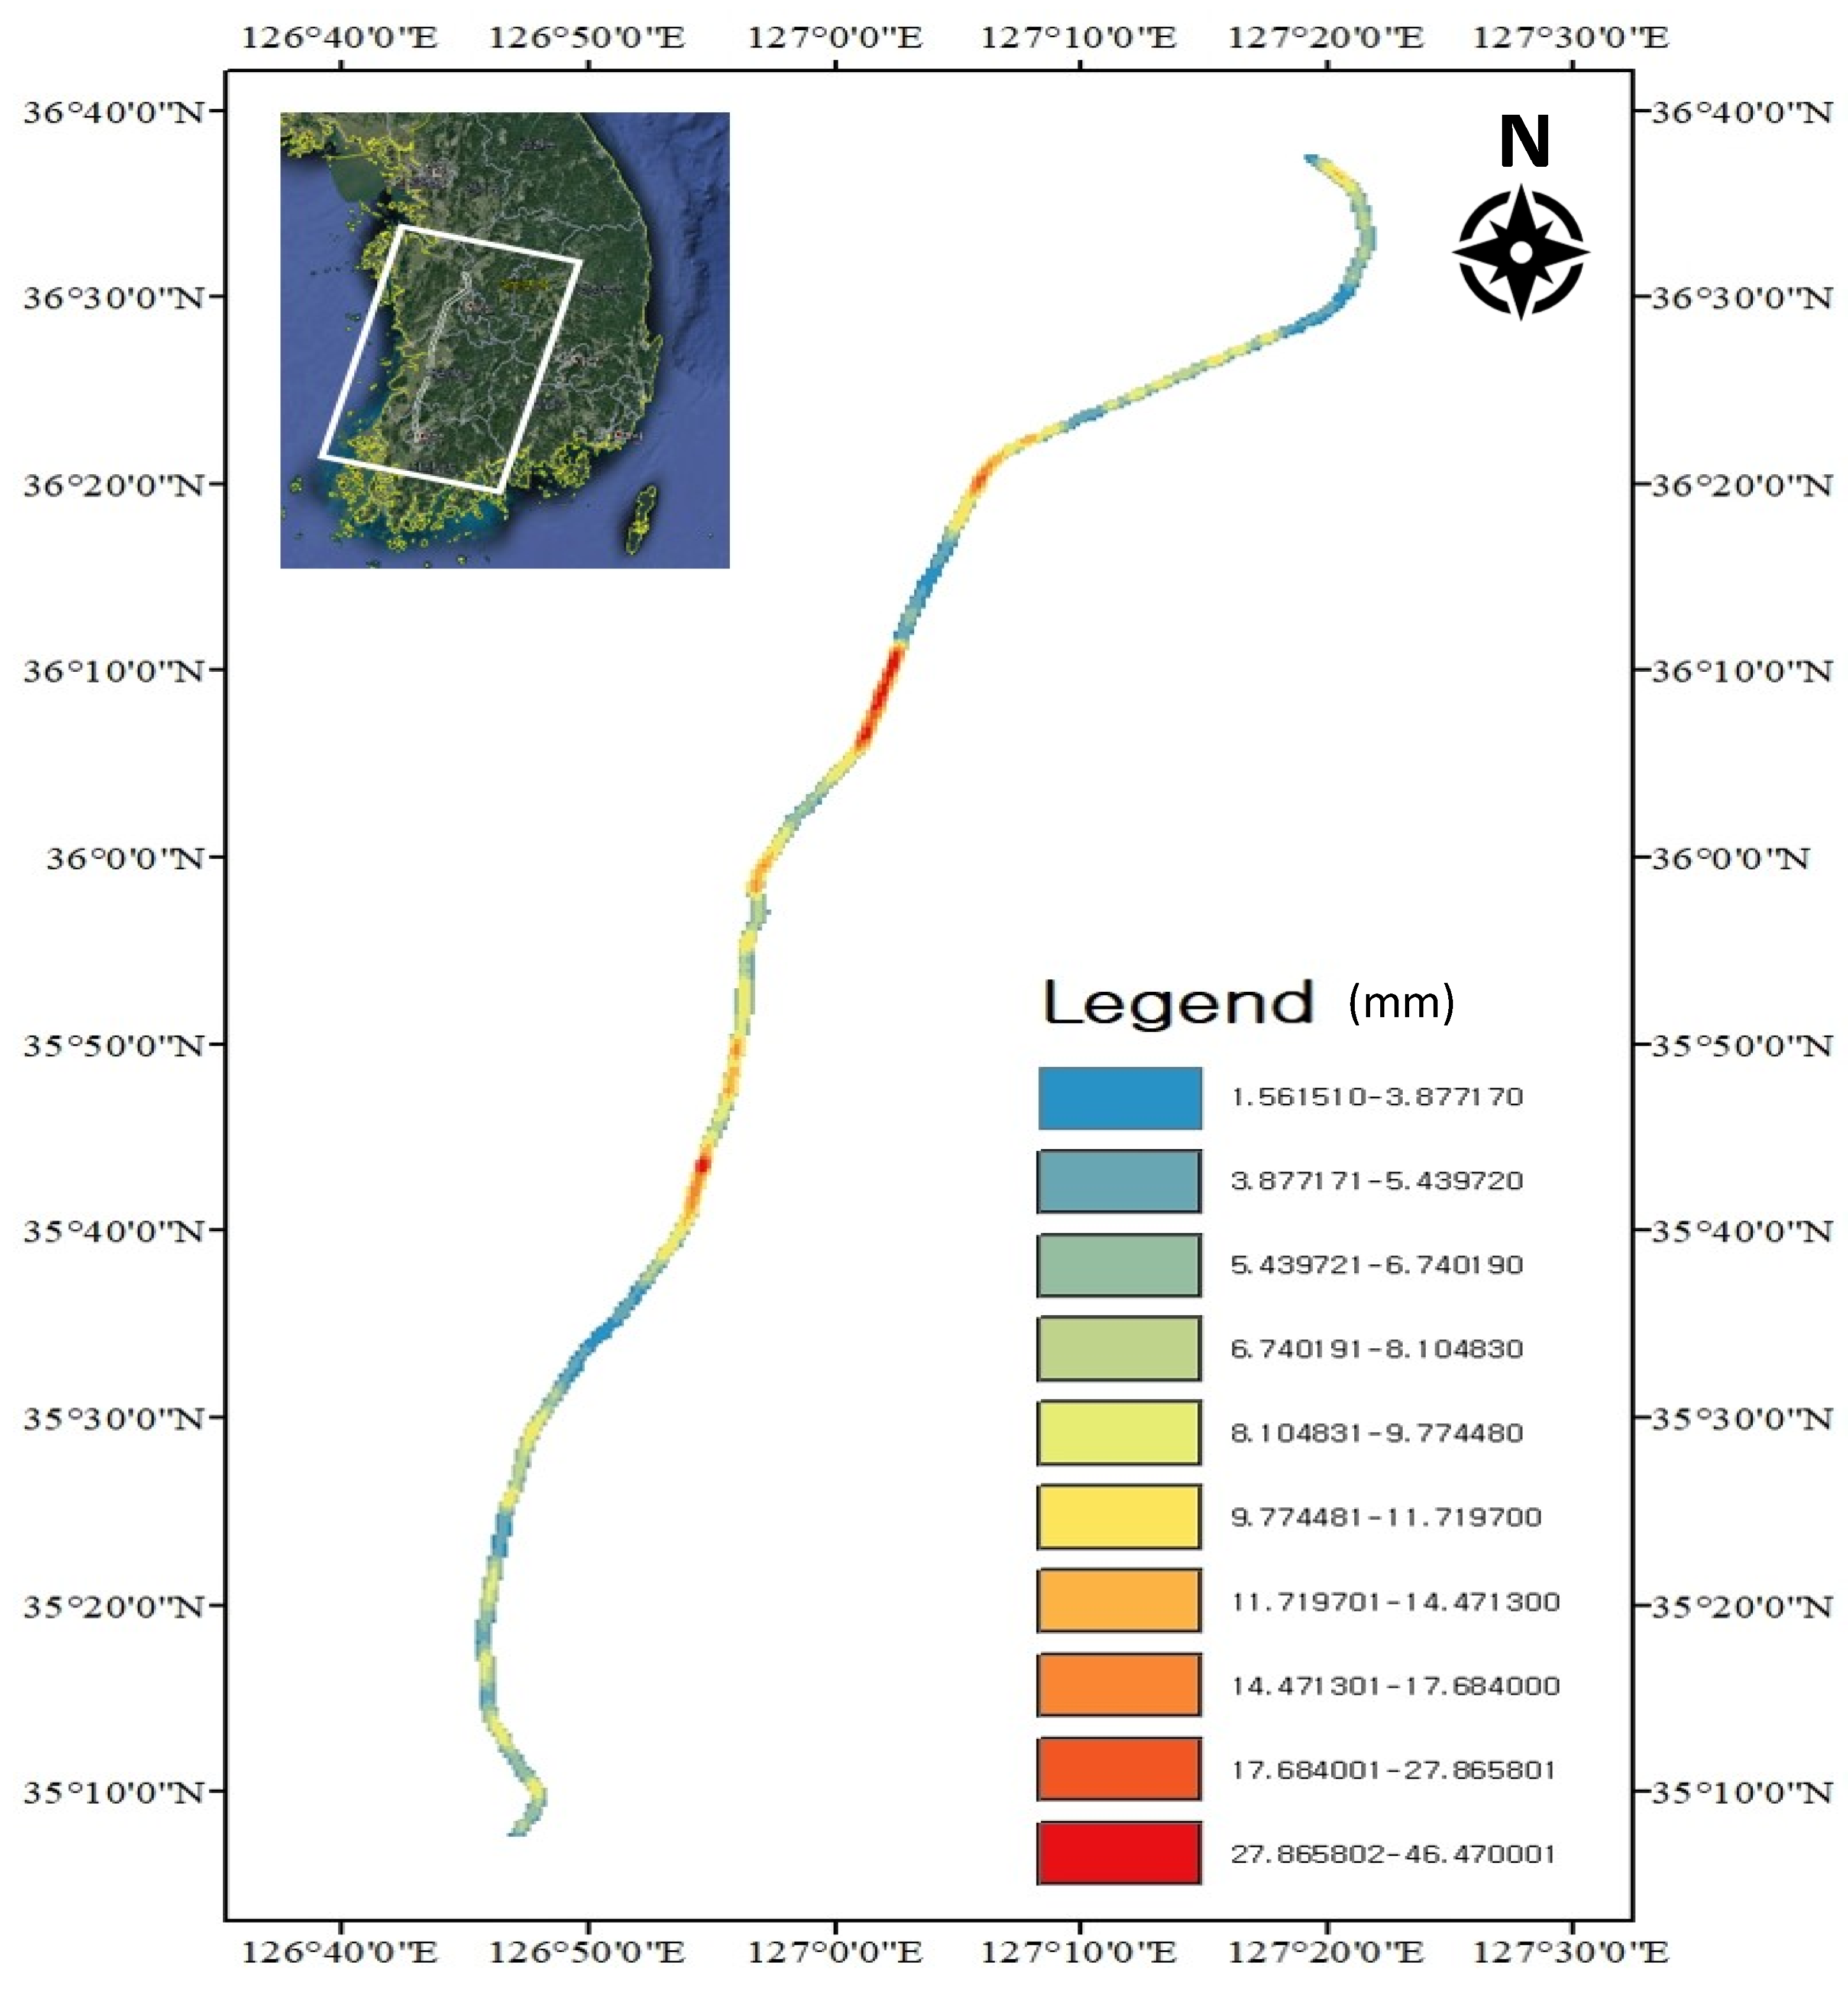
3.1. PS-InSAR-Derived Ground Deformation

The Honam High-Speed Railway extends approximately 188 km from Osong Station in Cheongju to Gwangju Songjeong Station, traversing both mountainous and plain areas. Due to the nature of the route, which passes through the Honam Plain and other soft-ground regions, ground subsidence has occurred in certain sections. This subsidence has continually raised concerns regarding the stability of the high-speed railway, necessitating precise analysis and reinforcement measures.
According to the “Honam High-Speed Railway Opening Preparation and Earthwork Roadbed Status Report”, ground subsidence has been observed in 29 km (both up and down tracks) of the 182.3 km section between Osong and Gwangju Songjeong, accounting for approximately 16% of the total length. The maximum settlement has been recorded at 5.6 cm. These findings indicate the necessity for continuous monitoring and reinforcement measures to ensure the long-term stability of the railway subgrade.
In this study, ground deformation measurements were conducted using a PS-InSAR analysis of the Honam High-Speed Railway region, where ground subsidence has been reported, from August 2016 to September 2018. A total of 24,386 persistent scatterers (PSs) were identified across the study area, with particularly high-density clusters observed along railway alignments, bridge structures, tunnel portals, and station facilities. These structures are generally known to exhibit strong radar reflectivity [15,19].
Additionally, several localized uplift phenomena were observed near reinforced structural foundations and recently constructed areas. These areas are likely to result from temporary ground heave due to loading adjustments or the incomplete consolidation of newly placed fill material [18]. The spatial correlation of these anomalous displacements with railway structural elements underscores the necessity of continuous and comprehensive monitoring to prevent unexpected track deformations that may compromise operational safety.

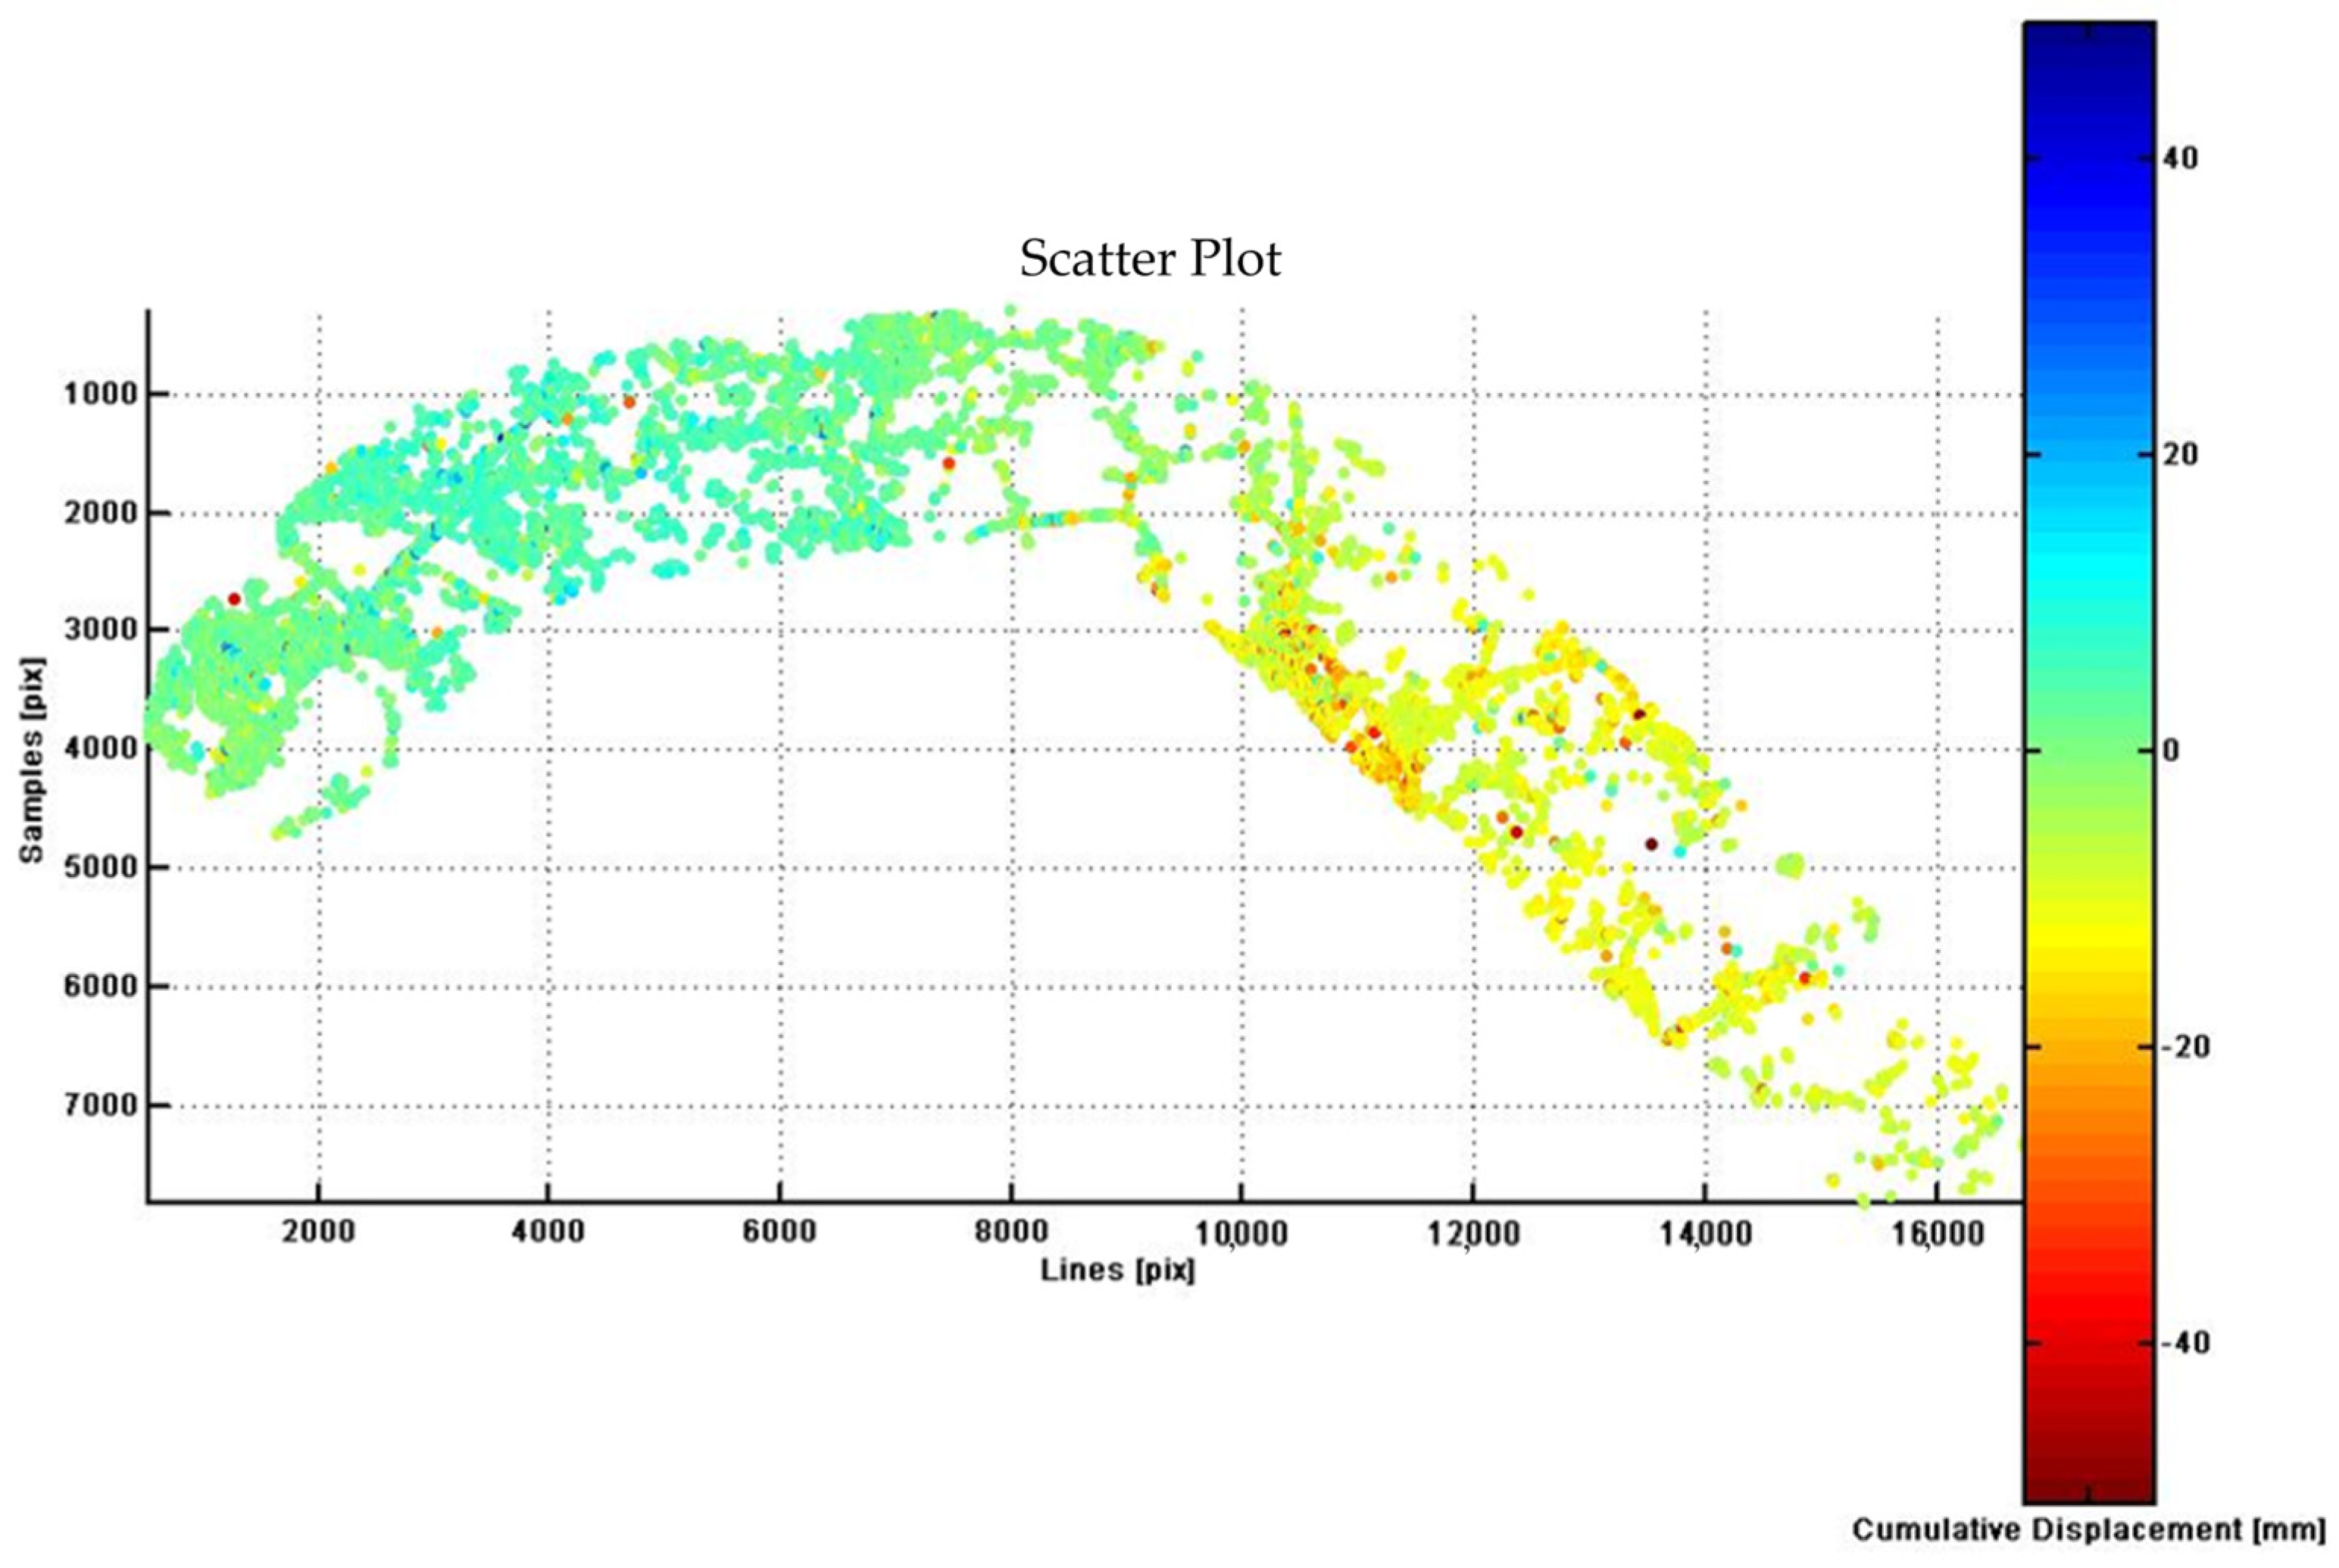
3.2. Acquisition of Backscatter Images and Co-Registration
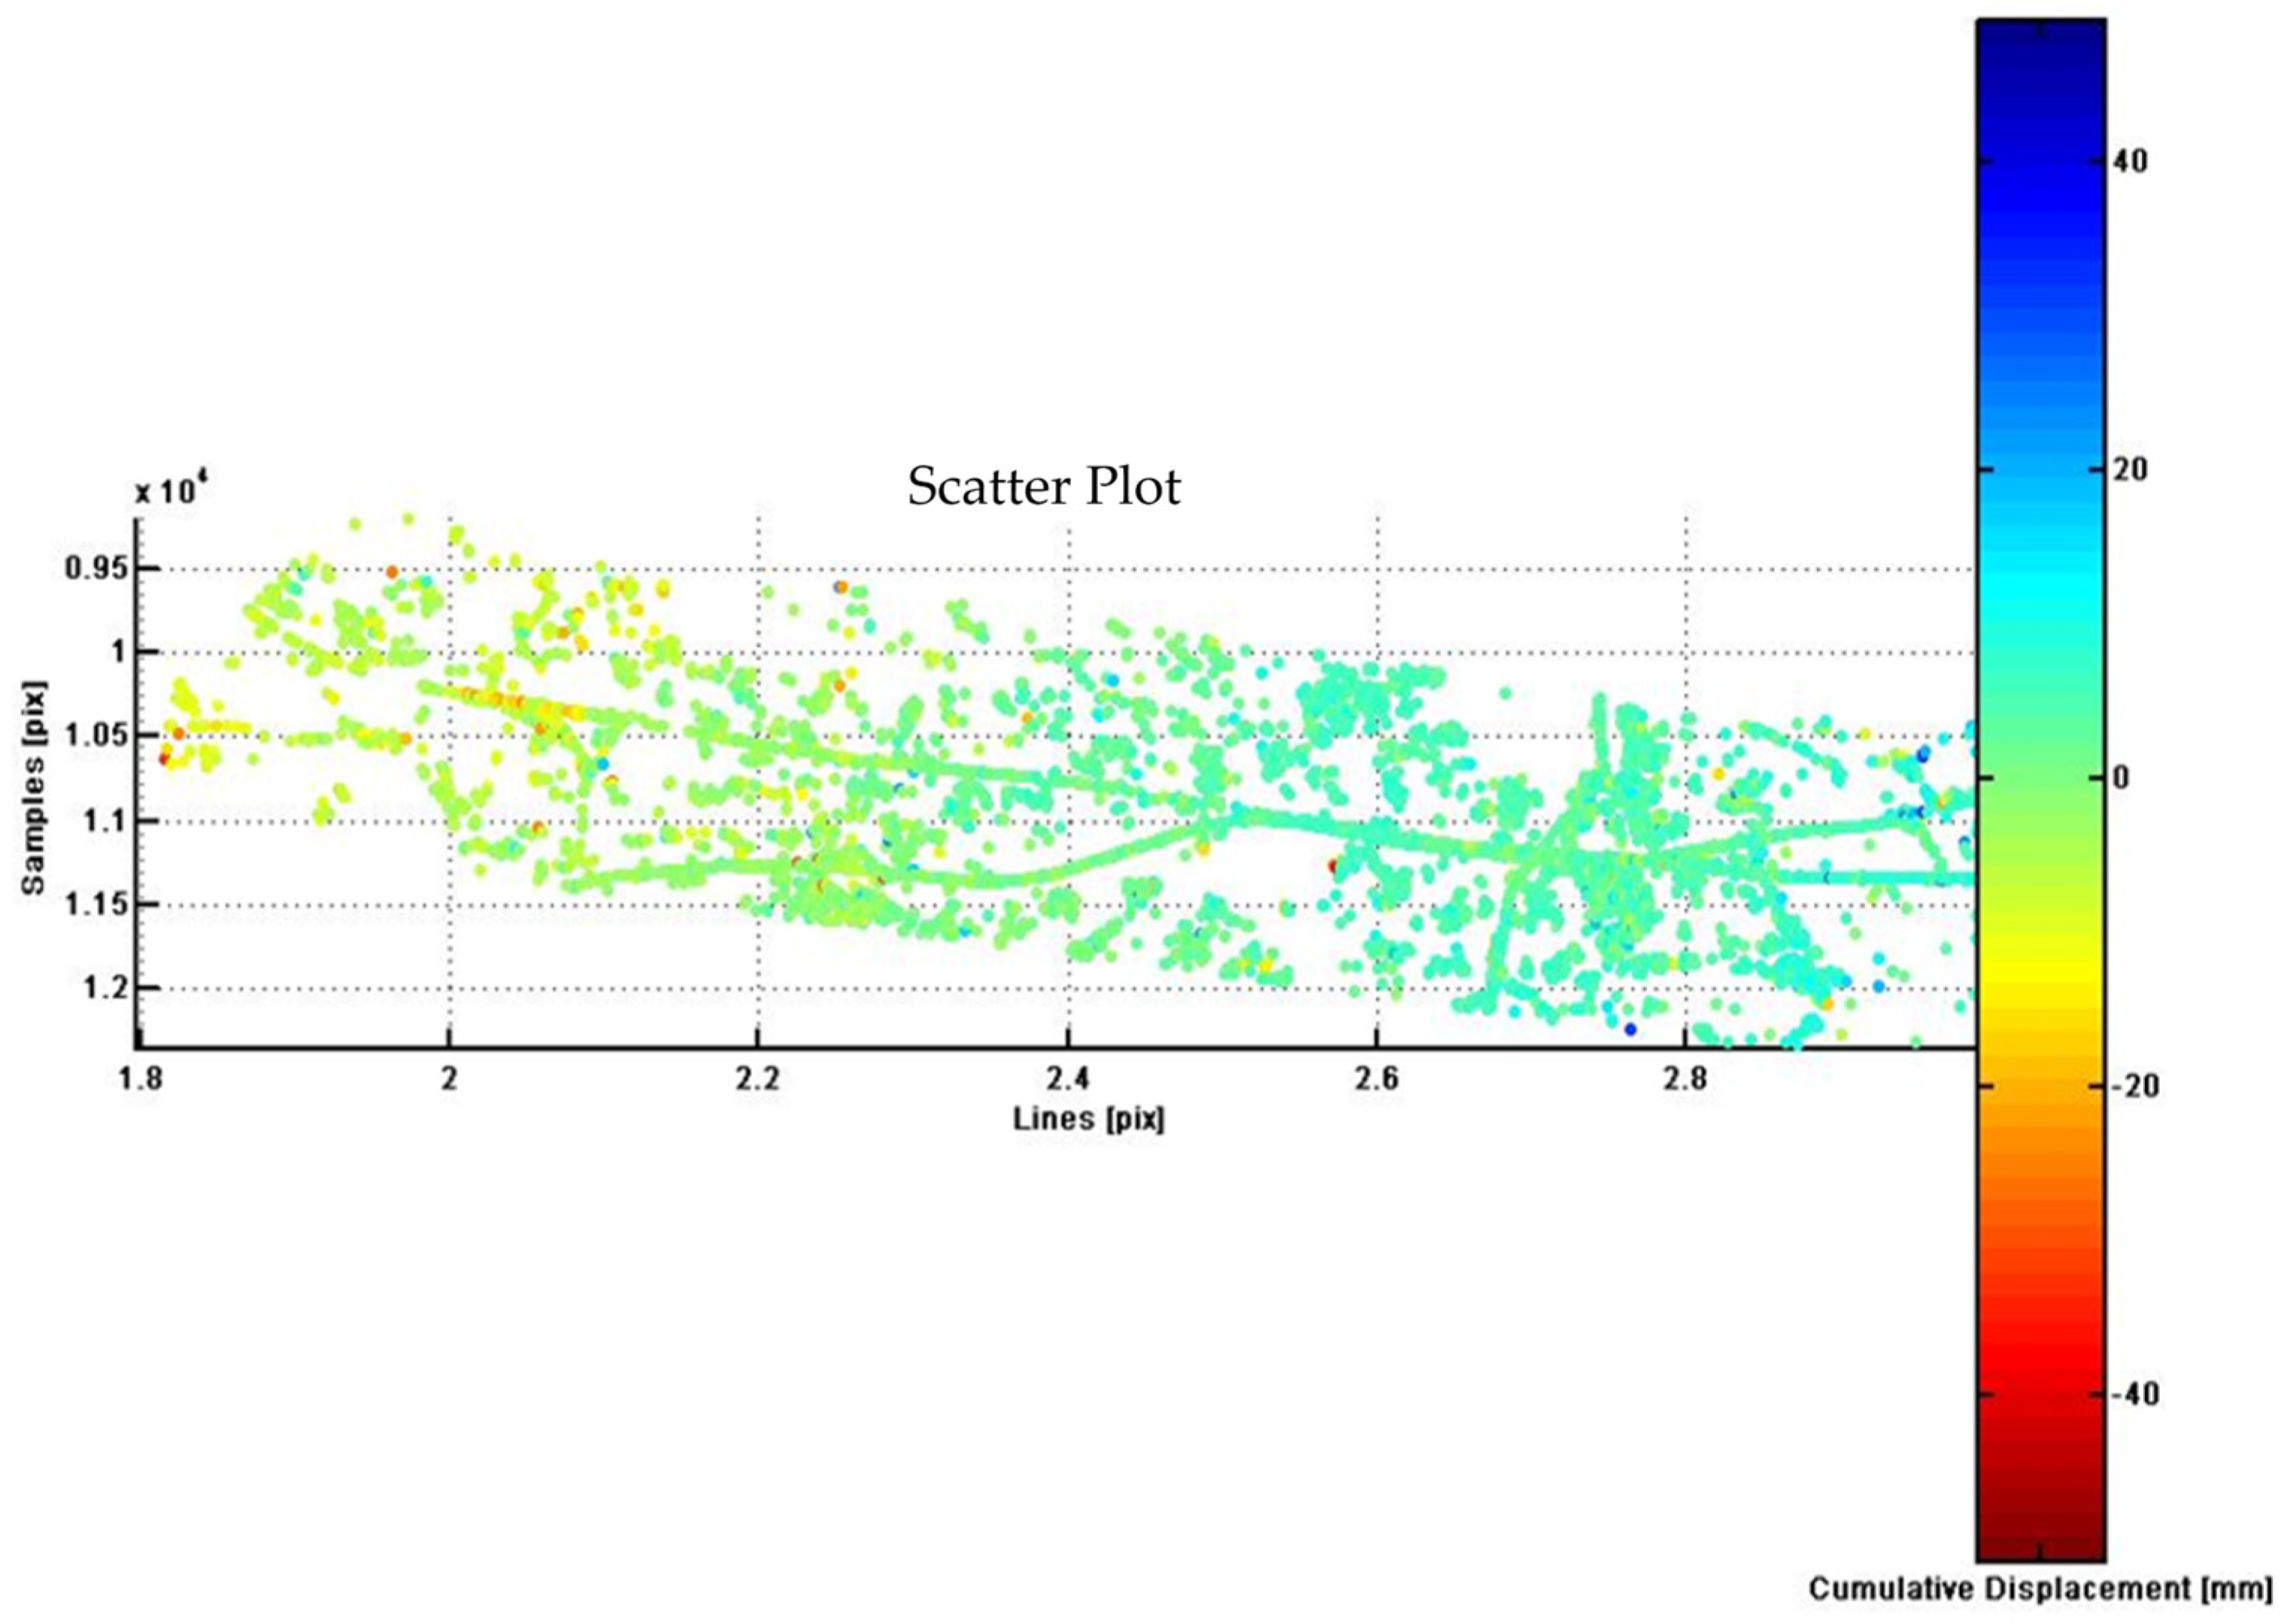
Although satellites revisit the same area along nominally identical orbits, perfect spatial overlap between SAR acquisitions cannot be achieved due to slight differences in spatial and temporal baselines. These differences result in pixel misalignment, which must be corrected through precise co-registration, particularly in PS-InSAR processing where millimetric accuracy is required. In this process, backscatter intensity maps were employed to ensure robust image alignment. One SAR image was designated as the master, and the remaining 28 images served as slave scenes. These were geometrically aligned to the master image using automated matching algorithms, resulting in a stack of co-registered Single Look Complex (SLC) images. The resulting backscatter images are expressed in grayscale, where brighter areas indicate stronger radar reflectivity and darker areas represent weaker reflectivity. The reflectivity of objects varies depending on the SAR satellite’s operating frequency band. Typically, steel structures and concrete buildings exhibit a high backscatter intensity, whereas agricultural fields, bare land, mountainous areas, and waterfront zones display a low backscatter intensity. Asphalt surfaces show high reflectivity in the X-band but lower reflectivity in the L-band and C-band.
Figure 4 presents the spatial overview of all 29 co-registered SAR acquisitions along the Honam High-Speed Railway corridor. High backscatter zones align with station buildings, bridge decks, and tunnel portals, confirming their suitability as persistent scatterer candidates.

3.3. Image Analysis

Scene 1-1 covers the area from Osong Station in Cheongju to Sejong City, which is characterized by extensive mountainous terrain. As a result, the railway in this section predominantly passes through tunnels rather than running on the surface. To effectively extract a high-density point cloud under these conditions, Sparse Point Processing was applied.
In total, 15,565 persistent scatterer (PS) points were extracted from this scene by applying an Amplitude Stability Index (ASI) threshold of 0.75 or higher to ensure data reliability. The extracted points were connected through 155,853 linkages using the Local Redundant method, which enhances the robustness of the network by creating multiple redundant connections between neighboring points.
Since this section represents the starting point of the Honam High-Speed Railway, the track alignment follows a curved path rather than a straight line. Consequently, the connection range parameter for point linking was set lower than in other regions to account for the geometry of the railway. The final deformation pattern of Test Area 1-1 is shown in Figure 5.
The area covered by Scene 1-2 is located to the right of the mountainous region and extends from Buyeo City to Nonsan City in Chungnam Province. Unlike the previous section, this area contains very few mountainous regions. However, it is largely composed of agricultural land rather than urban areas with high radar reflectivity, resulting in a relatively low number of high-density persistent scatterers (PSs).
To compensate for this, a combined index of the Amplitude Stability Index (ASI) and Spatial Coherence was applied, selecting points where the ASI + Spatial Coherence > 1.5 to ensure the reliability of the extracted PS points. After applying Sparse Point Processing, a total of 8290 PS points were extracted from this section.
The total number of connections established between the points was 82,900 using the same Local Redundant method as in Scene 1-1 to maintain network stability through overlapping connections. The final deformation pattern of Test Area 1-2 is shown in Figure 6.
In this study, the analysis was conducted by subdividing the area into two separate scenes, as described above. For each scene, persistent scatterers (PSs) were extracted using selection criteria and connection methods tailored to the specific topographic characteristics of the region. These extracted PS points were then processed through phase unwrapping, allowing them to be converted into single-value pixels within the ground deformation map.
The extracted point clouds were ultimately used to calculate ground deformation along the Honam High-Speed Railway (KTX) and its surrounding areas, which is the primary objective of this study. Table 2 summarizes the processing techniques applied to each scene, along with the total number of extracted persistent scatterers and the number of established connections.
To calculate the final ground deformation values, a phase unwrapping process was performed. Phase unwrapping is the procedure of converting wrapped phase values, which are constrained within a specific range (typically from −π to π), into continuous, unwrapped phase values.
Wrapped phase values are restricted within this fixed range, and the relative differences between adjacent pixels can be obtained by integrating these phase differences. This integration process is referred to as phase unwrapping.
In this study, the previously constructed Delaunay triangulation network was used to guide the unwrapping of the wrapped phase values of the persistent scatterers (PSs). Through this method, the constrained phase values were successfully transformed into continuous, meaningful values.
The unwrapped phase results were then converted from radians (rad), the unit of phase, into millimeters (mm), representing actual ground displacement.
Figure 7 presents the comprehensive ground deformation map for the Honam High-Speed Railway over the period from August 2016 to September 2018.

3.4. Verification of PS-InSAR Data Reliability

The most effective method for verifying the reliability of the final ground deformation data derived from the PS-InSAR technique is to directly compare the results with data from track-mounted monitoring instruments. However, due to difficulties in obtaining such instrumentation data, a direct comparison of settlement measurements could not be performed. Instead, a dedicated steel structure, referred to as a research corner reflector, was installed near the railway track to serve as a reference point for reliability verification.
In this study, the installed corner reflector was used to derive settlement values through the PS-InSAR analysis. To validate these results, leveling measurements were conducted at the same location, and the two datasets were compared to assess the accuracy of the PS-InSAR-derived deformation values. The reliability confirmed through this comparison was then applied as a basis to ensure the overall credibility of the entire PS-InSAR ground deformation dataset.
The corner reflector was installed at an angle of 100.37°, carefully considering the antenna aperture direction and satellite flight path of the TerraSAR-X and TanDEM-X satellites. The installation site was selected to avoid any obstacles that could interfere with signal transmission.
The research corner reflector was constructed using a high-reflectivity steel structure to secure a stable point with strong radar backscatter and high coherence. As a result, the corner reflector exhibited a coherence value of 0.91, which is considered very high, exceeding the typical threshold of 0.9 in the PS-InSAR analysis.
To ensure the reliability of the PS-InSAR data, first-order leveling surveys (with an accuracy of 2.5√L mm, where L represents the one-way distance between points) were conducted on the research corner reflector at approximately two-month intervals, taking into account the SAR image acquisition dates. The results of these leveling surveys are presented in Figure 8.

4. Discussion

The integrated use of PS-InSAR monitoring with traditional geotechnical data allows for enhanced decision-making regarding maintenance prioritization, emergency response planning, and resource allocation for high-speed railway operations [22]. The early identification of high-risk zones supports preventive reinforcement strategies, such as grouting, drainage improvement, and subgrade stabilization, thereby ensuring continued safe operation and reducing the potential for service disruptions.
The application of PS-InSAR techniques for monitoring ground deformation along the Honam High-Speed Railway has clearly demonstrated the effectiveness of satellite-based remote sensing in identifying both spatial and temporal patterns of settlement in complex geotechnical environments. Compared with traditional monitoring methods, such as leveling and GNSS surveys, PS-InSAR provides broad coverage and high temporal resolution, enabling the continuous observation of subtle displacements over extended areas [15,19]. This study’s results corroborate the findings of previous research, which emphasized the advantages of PS-InSAR in infrastructure monitoring, particularly in areas affected by long-term subsidence and soft ground conditions [21].
The spatial distribution of subsidence observed in this study aligns with the known geotechnical conditions of the railway corridor, where thick alluvial deposits and high groundwater levels contribute to ongoing consolidation settlement. The identification of critical subsidence zones between chainage 67 km and 82 km underscores the need for targeted ground improvement and reinforcement strategies. Moreover, temporal displacement trends revealed seasonal fluctuations, with acceleration during wet periods and deceleration during dry seasons, which can be attributed to fluctuations in pore water pressure and the soil moisture content.
A key finding of this research is the strong correlation between PS-InSAR-derived displacements and ground-based measurements, such as leveling and corner reflector data, with R2 values exceeding 0.93. This high degree of consistency validates the use of PS-InSAR as a reliable tool for long-term monitoring and confirms its potential for integration into railway maintenance and safety management systems. Furthermore, the ability to detect accelerating settlement trends before they exceed critical thresholds presents opportunities for predictive maintenance, reducing the likelihood of costly emergency repairs or operational disruptions. Moreover, combining PS-InSAR monitoring with conventional geotechnical data enables enhanced decision-making for maintenance prioritization, emergency responses, and efficient resource allocation in high-speed railway operations [22]. The early identification of vulnerable zones further supports preemptive reinforcement measures, such as grouting, drainage improvement, and subgrade stabilization, helping to mitigate risks and maintain continuous safe operation.
Despite these advantages, certain limitations must be considered. PS-InSAR performance can be affected by vegetation cover, atmospheric artifacts, and geometric decorrelation, especially in areas with rapid land cover changes or complex topography [16,18]. Therefore, the integration of PS-InSAR with other geotechnical data and field surveys remains essential to ensure comprehensive risk assessments and the design of effective mitigation measures.
The implications of this study are substantial for high-speed railway infrastructure management. By establishing a PS-InSAR-based monitoring system, railway operators can efficiently identify high-risk sections, plan maintenance interventions, and allocate resources strategically. This approach supports a shift from reactive to preventive maintenance strategies, enhancing safety, extending the infrastructure lifespan, and minimizing operational downtime.

5. Conclusions

This study demonstrated the applicability of PS-InSAR techniques for monitoring ground deformation along the Honam High-Speed Railway in South Korea. Through the analysis of multi-temporal SAR data from 2016 to 2019, the study successfully identified critical subsidence zones and revealed the temporal dynamics of ground movement in soft-ground regions.
(1)
The PS-InSAR approach accurately captured millimeter-scale displacements, with subsidence rates exceeding −12 mm/year in vulnerable embankment sections. Validation against leveling and corner reflector data showed a strong correlation (R2 > 0.93), confirming the method’s high reliability for infrastructure monitoring. Seasonal variations in deformation rates, linked to rainfall and soil moisture changes, were also observed, offering valuable insights into the dynamics of ground behavior under climatic influences.
(2)
These findings provide a practical foundation for enhancing railway asset management. Specifically, the integration of PS-InSAR into routine maintenance operations enables operators to identify high-risk sections in advance, prioritize reinforcement efforts, and allocate resources more strategically. By shifting from reactive to preventive maintenance practices, infrastructure safety and performance can be significantly improved while minimizing operational disruptions and emergency repair costs.
(3)
To strengthen the practical utility of this approach, future research should aim to combine PS-InSAR results with geotechnical, hydrological, and structural datasets to establish a comprehensive, data-driven monitoring framework. Moreover, extending the observation period and incorporating data from additional SAR platforms may improve the temporal resolution and support more effective early warning and risk mitigation strategies. In addition, introducing experimental variables—such as construction methods, subgrade material properties, drainage conditions, and traffic load variations—can further enhance the scientific contribution and broaden the applicability of PS-InSAR in infrastructure monitoring.

Author Contributions

Conceptualization, S.-J.L. and H.-S.Y.; methodology, S.-J.L.; software, S.-J.L.; validation, S.-J.L., H.-S.Y. and T.-Y.K.; formal analysis, T.-Y.K.; investigation, S.-J.L.; resources, S.-J.L.; data curation, S.-J.L.; writing—original draft preparation, S.-J.L.; writing—review and editing, H.-S.Y.; visualization, S.-J.L.; supervision, H.-S.Y.; project administration, H.-S.Y.; funding acquisition, T.-Y.K. All authors have read and agreed to the published version of the manuscript.

Funding

This work was supported by a National Research Foundation of Korea (NRF) grant funded by the Korea government (MSIT) (RS-2021-NR059478).

Institutional Review Board Statement

Not applicable.

Informed Consent Statement

Not applicable.

Data Availability Statement

The original contributions presented in the study are included in the article; further inquiries can be directed to the corresponding author.

Conflicts of Interest

The authors declare no conflicts of interest.

References

  1. Kim, B.K.; Kim, W.; Lee, C.; Yoo, M.; Lee, I. Validating Railway Infrastructure Deformation Monitoring: A Comparative Analysis of Field Data and TerraSAR-X PS-InSAR Results. KSCE J. Civ. Eng. 2024, 28, 1777–1786. [Google Scholar] [CrossRef]
  2. Yoo, C. Ground Settlement Monitoring Using SAR Satellite Images. J. Korean Geosynth. Soc. 2022, 21, 55–67. [Google Scholar] [CrossRef]
  3. Huang, Q.; Wang, Y.; Luzi, G.; Crosetto, M.; Monserrat, O.; Jiang, J.; Zhao, H.; Ding, Y. Ground-Based Radar Interferometry for Monitoring the Dynamic Performance of a Multitrack Steel Truss High-Speed Railway Bridge. Remote Sens. 2020, 12, 2594. [Google Scholar] [CrossRef]
  4. Navarro-Hernández, M.I.; Tomás, R.; Valdes-Abellan, J.; Bru, G.; Ezquerro, P.; Guardiola-Albert, C.; Elçi, A.; Batkan, E.A.; Caylak, B.; Ören, A.H.; et al. Monitoring Land Subsidence Induced by Tectonic Activity and Groundwater Extraction in the Eastern Gediz River Basin (Türkiye) Using Sentinel-1 Observations. Eng. Geol. 2023, 327, 107343. [Google Scholar] [CrossRef]
  5. Wang, C.; Hawlader, B.; Islam, N.; Soga, K. Implementation of a Large Deformation Finite Element Modelling Technique for Seismic Slope Stability Analyses. Soil Dyn. Earthq. Eng. 2019, 127, 105824. [Google Scholar] [CrossRef]
  6. Luo, Q.; Li, M.; Yin, Z.; Ma, P.; Perissin, D.; Zhang, Y. Land Subsidence Velocity and High-Speed Railway Risks in the Coastal Cities of Beijing–Tianjin–Hebei, China, with 2015–2021 ALOS PALSAR-2 Multi-Temporal InSAR Analysis. Remote Sens. 2024, 16, 4774. [Google Scholar] [CrossRef]
  7. Koohmishi, M.; Kaewunruen, S.; Chang, L.; Guo, Y. Advancing Railway Track Health Monitoring: Integrating GPR, InSAR and Machine Learning for Enhanced Asset Management. Autom. Constr. 2024, 162, 105378. [Google Scholar] [CrossRef]
  8. Korea National Railway. Ground Subsidence in Honam High-Speed Rail; Korea National Railway: Seoul, Republic of Korea, 2015; Available online: https://www.kr.or.kr/boardCnts/view.do?boardID=52&boardSeq=1101458&page=207 (accessed on 20 March 2025).
  9. Lyon, T.J.; Filmer, M.S.; Featherstone, W.E. On the Use of Repeat Leveling for the Determination of Vertical Land Motion: Artifacts, Aliasing, and Extrapolation Errors. J. Geophys. Res. Solid Earth 2018, 123, 7021–7039. [Google Scholar] [CrossRef]
  10. Moon, J.; Sung, J.; Yoon, H.; Ryu, J.; Kim, D. GNSS CORS Processing Using Automated Crustal Deformation Monitoring System in South Korea. In Proceedings of the IGS Workshop 2024, University of Bern, Bern, Switzerland, 1–5 July 2024; Available online: https://files.igs.org/pub/resource/pubs/workshop/2024/IGSWS-2024-PS0503-Moon-GNSS_CORS_Processing_using_Automated_Crustal_Deformation_Monitoring_System.pdf (accessed on 20 March 2025).
  11. Li, X.; Zhang, Y.; Wang, H. High Precision Deformation Monitoring with Integrated GNSS and Robotic Total Stations. Measurement 2022, 192, 110876. [Google Scholar] [CrossRef]
  12. Sikder, S.; Wu, H.; Li, X. Displacement Monitoring of CORS Reference Stations Using GNSS. In Proceedings of the 2023 International Technical Meeting of the Institute of Navigation, Long Beach, CA, USA, 23–26 January 2023; Available online: https://www.semanticscholar.org/paper/Displacement-Monitoring-of-CORS-Reference-Stations-Sikder-Wu/8fd463737c050a513eb20f9780695829cabc96be (accessed on 20 March 2025).
  13. Zhang, L.; Wang, J.; Li, H. Real-Time High-Precision Landslide Displacement Monitoring Based on GNSS Network RTK Algorithm. Measurement 2023, 210, 112564. [Google Scholar] [CrossRef]
  14. Shirzaei, M. A Kalman Filter Framework for Resolving 3D Displacement Field Time Series By Combining Multitrack Multitemporal InSAR and GNSS Horizontal Velocities. arXiv 2023, arXiv:2303.03954. [Google Scholar] [CrossRef]
  15. Ferretti, A.; Prati, C.; Rocca, F. Permanent scatterers in SAR interferometry. IEEE Trans. Geosci. Remote Sens. 2001, 39, 8–20. [Google Scholar] [CrossRef]
  16. Hooper, A.; Zebker, H.; Segall, P.; Kampes, B. A new method for measuring deformation on volcanoes and other natural terrains using InSAR persistent scatterers. Geophys. Res. Lett. 2012, 39, L09303. [Google Scholar] [CrossRef]
  17. Li, Z.; Fielding, E.J.; Cross, P.; Preusker, R. Advanced InSAR atmospheric correction: MERIS/MODIS combination and stacked water vapour models. Int. J. Remote Sens. 2009, 30, 3343–3363. [Google Scholar] [CrossRef]
  18. Bianchini, S.; Cigna, F.; Del Ventisette, C.; Moretti, S.; Casagli, N. Monitoring landslide-induced displacements with TerraSAR-X persistent scatterer interferometry (PSI): Gimigliano case study in Calabria region (Italy). Int. J. Geosci. 2013, 4, 1467–1482. [Google Scholar] [CrossRef]
  19. Crosetto, M.; Monserrat, O.; Cuevas-González, M.; Devanthéry, N.; Crippa, B. Persistent Scatterer Interferometry: A review. ISPRS J. Photogramm. Remote Sens. 2016, 115, 78–89. [Google Scholar] [CrossRef]
  20. Zhang, J.; Zhang, Q.; Bao, A.; Wang, Y. A New Remote Sensing Dryness Index Based on the Near-Infrared and Red Spectral Space. Remote Sens. 2019, 11, 456. [Google Scholar] [CrossRef]
  21. Zhang, L.; Ding, X.; Lu, Z.; Jung, H.S.; Hu, J.; Feng, G. A Novel Multitemporal InSAR Model for Joint Estimation of Deformation Rates and Orbital Errors. IEEE Trans. Geosci. Remote Sens. 2014, 52, 3529–3540. [Google Scholar] [CrossRef]
  22. Kizilirmak, G.; Cakir, Z. Application of PS-InSAR and Diagnostic Train Measurement Techniques for Monitoring Subsidence in High-Speed Railway in Konya, Türkiye. Infrastructures 2024, 9, 152. [Google Scholar] [CrossRef]
  23. Tao, R.; Lau, A.; Mossefin, M.E.; Kong, G.; Nordal, S.; Pan, Y. Monitoring of Ground Displacement-Induced Railway Anomalies Using PS-InSAR Techniques. Measurement 2025, 221, 116863. [Google Scholar] [CrossRef]
  24. Herrera-García, G.; Ezquerro, P.; Tomás, R.; Béjar-Pizarro, M.; Guardiola-Albert, C.; Martínez, R.; Mora, H.; Castaño, D.; de Sanjosé-Blasco, J.J. Selected Worldwide Cases of Land Subsidence Due to Aquifer Overexploitation. Water 2023, 15, 1094. [Google Scholar] [CrossRef]
  25. Massonnet, D.; Feigl, K.L. Radar interferometry and its application to changes in the Earth’s surface. Rev. Geophys. 1998, 36, 441–500. [Google Scholar] [CrossRef]
  26. Hanssen, R.F. Radar Interferometry: Data Interpretation and Error Analysis; Springer: Dordrecht, The Netherlands, 2001. [Google Scholar] [CrossRef]
  27. Bamler, R.; Hartl, P. Synthetic aperture radar interferometry. Inverse Probl. 1998, 14, R1–R54. [Google Scholar] [CrossRef]
  28. Zebker, H.A.; Villasenor, J. Decorrelation in interferometric radar echoes. IEEE Trans. Geosci. Remote Sens. 1992, 30, 950–959. [Google Scholar] [CrossRef]
  29. Gabriel, A.K.; Goldstein, R.M.; Zebker, H.A. Mapping small elevation changes over large areas: Differential radar interferometry. J. Geophys. Res. 1989, 94, 9183–9191. [Google Scholar] [CrossRef]
  30. Goldstein, R.M.; Zebker, H.A.; Werner, C.L. Satellite radar interferometry: Two-dimensional phase unwrapping. Radio Sci. 1988, 23, 713–720. [Google Scholar] [CrossRef]
  31. Small, D. Generation of Digital Elevation Models Through Spaceborne SAR Interferometry. Institute of Geography, University of Zurich. 1998. Available online: https://www.geo.uzh.ch/dam/jcr%3Acd893224-28bc-4edd-b4d7-9b9b3e847164/1998_DavidSmall.pdf-207 (accessed on 20 March 2025).
  32. Rosen, P.A.; Hensley, S.; Joughin, I.R.; Li, F.K.; Madsen, S.N.; Rodriguez, E.; Goldstein, R.M. Synthetic Aperture Radar Interferometry. Proc. IEEE 2000, 88, 333–382. [Google Scholar] [CrossRef]
  33. Bürgmann, R.; Rosen, P.A.; Fielding, E.J. Synthetic Aperture Radar Interferometry to Measure Earth’s Surface Topography and Its Deformation. Annu. Rev. Earth Planet. Sci. 2000, 28, 169–209. [Google Scholar] [CrossRef]
  34. Dzurisin, D.; Lu, Z.; Wicks, C. Interferometric Synthetic Aperture Radar (InSAR): Its Past, Present, and Future in Volcanology. J. Volcanol. Geotherm. Res. 2019, 385, 188–206. [Google Scholar] [CrossRef]
  35. Wright, T.J.; Parsons, B.E.; Lu, Z. Toward Mapping Surface Deformation in Three Dimensions Using InSAR. Geophys. Res. Lett. 2004, 31, L01607. [Google Scholar] [CrossRef]
Figure 1. PS-InSAR flow chart.
Applsci 15 04318 g001
Figure 2. Test area, (a) Honam High-Speed Railway (with the red circle marking the corner reflector), (b) corner reflector, and (c) satellite orbit direction.
Applsci 15 04318 g002
Figure 3. Principle of Interferometric Synthetic Aperture Radar (InSAR).
Applsci 15 04318 g003
Figure 4. Co-registered images and backscatter images (29 scenes).
Applsci 15 04318 g004
Figure 5. Final ground deformation map for Test Area 1-1.
Applsci 15 04318 g005
Figure 6. Final ground deformation map for Test Area 1-2.
Applsci 15 04318 g006
Figure 7. Comprehensive ground deformation map for the Honam High-Speed Railway (August 2016-September 2018). The white box indicates the Honam High-Speed Railway corridor.
Applsci 15 04318 g007
Figure 8. Deformation at the corner reflector site based on the PS-InSAR and leveling survey results.
Applsci 15 04318 g008
Table 1. Types of X-band SAR images used in this study.
29 Images (TerraSAR-X: 24, TanDEM-X: 5)
ImageSatelliteDatePolarizationBaselineIntervalDoppler
SlaveTerraSAR-X20160809HH−65.3631−440−0.03895
SlaveTerraSAR-X20160820HH−184.668−429−0.01011
SlaveTerraSAR-X20160911HH−68.8057−407−0.01479
SlaveTerraSAR-X20161025HH−20.0391−363−0.01932
SlaveTerraSAR-X20161116HH−11.2495−341−0.00188
SlaveTerraSAR-X20161230HH−65.8877−297−0.00235
SlaveTerraSAR-X20170121HH105.2725−2750.007928
SlaveTerraSAR-X20170212HH−15.54−2530.01236
SlaveTerraSAR-X20170306HH68.68008−231−0.00118
SlaveTerraSAR-X20170317HH130.595−220−0.00223
SlaveTerraSAR-X20170328HH53.00705−209−0.00973
SlaveTerraSAR-X20170419HH150.201−187−0.00322
SlaveTerraSAR-X20170511HH−109.816−165−0.01308
SlaveTerraSAR-X20170602HH17.77143−143−0.00789
SlaveTerraSAR-X20170624HH23.69538−121−0.01849
SlaveTanDEM-X20171001HH381.0312−22−0.01324
MasterTerraSAR-X20171023HH00−0.01263
SlaveTerraSAR-X20171114HH−186.22522−0.00716
SlaveTerraSAR-X20171206HH80.136744−0.00214
SlaveTanDEM-X20171228HH308.589966−0.01603
SlaveTanDEM-X20180130HH47.5524999−0.01462
SlaveTanDEM-X20180304HH179.8259132−0.01146
SlaveTerraSAR-X20180406HH160.1782165−0.00857
SlaveTerraSAR-X20180428HH−238.003187−0.0307
SlaveTanDEM-X20180520HH228.5573209−0.02224
SlaveTerraSAR-X20180622HH−10.676242−0.01708
SlaveTerraSAR-X20180725HH8.647546275−0.02195
SlaveTerraSAR-X20180827HH−28.856308−0.00247
SlaveTerraSAR-X20180929HH56.360563410.001123
Table 2. Detailed information of the Test Area 1-1 and 1-2 images.
Details of the Scenes1-11-2
Number of Persistent Scatterers15,5868290
Extraction MethodASIASI+IP
Number of Connections155,85382,900
Connection MethodLocal.RLocal.R
Average Coherence0.8250.902
Disclaimer/Publisher’s Note: The statements, opinions and data contained in all publications are solely those of the individual author(s) and contributor(s) and not of MDPI and/or the editor(s). MDPI and/or the editor(s) disclaim responsibility for any injury to people or property resulting from any ideas, methods, instructions or products referred to in the content.

