Article

Prediction of Water Inrush Hazard in Fully Mechanized Coal Seams’ Mining Under Aquifers by Numerical Simulation in ANSYS Software

1
Department of Mining, Mining and Metallurgy Faculty, Technical University “Metinvest Polytechnic” LLC, Pivdenne Shose 80, 69008 Zaporizhzhia, Ukraine
2
Department of Geoengineering, National Technical University of Ukraine “Igor Sikorsky Kyiv Polytechnic Institute”, Prospect Beresteiskyi 37, Solomyanskyi District, 03056 Kyiv, Ukraine
*
Author to whom correspondence should be addressed.
Appl. Sci. 2025, 15(8), 4302; https://doi.org/10.3390/app15084302
Submission received: 18 March 2025 / Revised: 6 April 2025 / Accepted: 10 April 2025 / Published: 14 April 2025
(This article belongs to the Section Civil Engineering)

Abstract

:
The process of fully mechanized coal seam mining under aquifers and surface water bodies has been a challenge in recent years for different countries. During the evolution of subsidence and the overburdening of rock mass movement above the longwall goaf, there is always a potential risk of connecting the water-conducting fracture zone with aquifers. The water inflows in the coal mine’s roadways have a negative impact on the productivity of the working faces and pose significant hazards to miners in the event of water inrush. Therefore, the assessment of the height of the water-flowing fractured zone has an important scientific and practical significance. The background of this study is the Xinhu Coal Mine in Anhui Province, China. In the number 81 mining area of the Xinhu Coal Mine during the mining of the number 815 longwall, a water inflow occurred due to fractures in the sandstone in the overburden rock. The experience of the successful implementation of the water inrush control method by horizontal regional grouting through multiple directional wells is described in this paper. This study proposes an algorithm for the assessment of the risk of water inrush from aquifers, based on an ANSYS 17.2 simulation in the complex anticline coal seam bedding. It was found that the safety factors based on the stress and strain parameters can be used as criteria for the risk of rock failure in the aquifer zone. For the number 817 longwall panel of the Xinhu Coal Mine, the probability of rock mass failure indicates a low risk of the occurrence of a water-flowing fractured zone.

1. Introduction

Nowadays, coal provides about a quarter of the world’s energy generation. In the near future, coal will remain an important source of energy.
The operation of coal mines inevitably leads to the interaction between the network of mine roadways and aquifers, disrupting natural hydrological conditions. Mine water infiltrates the underground roadways, necessitating continuous pumping to the surface. This process is not only highly energy- and cost-intensive but also leads to the contamination of surface and groundwater with highly mineralized water. Depending on mining-geological and hydro-geological conditions, water inflows into mines vary, sometimes reaching between 30 and 300 m3 per hour.
Water inrushes have not only a negative impact on technological processes but also pose significant hazards to miners. According to statistics, between 2008 and 2023, China alone recorded 1465 coal mine safety accidents, resulting in 5473 fatalities. Among these, 164 incidents were water-related, leading to 776 deaths, which accounted for 11.2% of all accidents and 14.2% of total fatalities, respectively [1].
Liang et al. [2], based on the analysis of statistics, summarized that a total of 1196 major water inrush accidents occurred in China in the past 20 years (Table 1), resulting in 4775 deaths and disappearances, and direct economic losses of more than tens of billions of yuan.
Water inrushes in coal mines are associated both with mining operations conducted beneath surface water bodies, which is characteristic of shallow mining depths, and with mining conducted beneath aquifers. Water inrushes become possible when, as a result of the failure of the overlying strata of the coal seam roof, the water-flowing fractured zone reaches the aquifer. Thus, determining the height of the overlying strata separation zone in the working face is a crucial task for assessing the risk of water inrush.
For nearly a century, scientists from various countries have been studying the failure law of the overlying strata of the coal seam roof. The current methods for investigating this process are divided into theoretical analysis, numerical simulation, physical similarity simulation, and field observation. Initially, the “vertical line theory”, “arch theory”, and “zoning theory” were proposed. These primitive structural models laid the foundation for further research, leading to the development of more advanced theories. One example of this was Stoker’s proposal of the cantilever beam theory to explain the phenomenon of periodic pressure. In another example, La Paz introduced the “pre-fracture hypothesis”, suggesting that the overlying strata would cease to collapse after mining [3]. Kuznetsov formulated the hinged rock block hypothesis, categorizing the rock strata into the irregular caving zone, regular caving zone, and regular moving zone [4]. Qian Minggao [5] advanced the “masonry beam theory” based on classical overburden movement and failure hypotheses, explaining the formation of “large structures” and “small structures” as well as the occurrence of stope pressure in a fully mechanized longwall. Zhenqi Song [6] proposed the “transfer rock beam theory”, which described the transmission path of stope overburden pressure and the pressure distribution in high-stress areas.
The “masonry beam theory” served as the foundation for the “key layer theory of strata control”. By integrating stope pressure, overburden migration law, and surface subsidence, the key layer theory provides a more comprehensive explanation of the evolution of fractures in overburden rock under mining influence [7]. Jianping et al. [8] proposed the “hyperbolic model”, which posited that the focal point of the “hyperbolic” rock layer is located at the position of the main key layer.
It is generally believed that overburden damage caused by mining is zoned and can be divided into caving zones, fracture zones, and subsidence zones. Gao et al. [9] based their theory on the “three-zone” model, subdividing a lower part of the subsidence zone into a separate delamination zone and proposed the “four-zone” model. This model served as the basis for the grouting construction design in the case of overburden delamination [10]. In addition, it was used to prevent and control water inrush hazards.
According to the “four-zone” theory, the subsidence zone is primarily influenced by the movement and deformation of the nearest key layer at the bottom, and the subsidence trajectory follows a paraboloid with an elliptical shape [11]. Sakhno et al. [12] applied the “three-zone” model for a numerical simulation of surface subsidence and flooding. A scheme illustrating the mechanism of water inrush is presented in Figure 1.
Budryk and Knothe [13] proposed the subsidence theory for the Upper Silesia region conditions. According to Budryk and Knothe [13], the maximum predicted subsidence is equal to the thickness of excavating seam multiplied by exploitation parameter a (values between 0 and 1). The maximum area of exploitation influences contains the mining area and area in the influence range of exploitation. The depth of seam and the rock mass parameter tan(β) (where β is the angle of main influences) should be known to compute the range of exploitation. With known values of maximal subsidence and the range of exploitation, one can compute the inclination in the distance from the edge of exploited seam. For standard geological conditions of Upper Silesia Coal Basin, the assumption of tan(β) = 2 is usually made [14]. The Budryk and Knothe [13] subsidence scheme is a classical one. Similar subsidence schemes are used in different coal regions of the world. In particular, they form the basis of current regulatory documents of Ukraine [15].
Based on the aforementioned hypotheses, many modern researchers study the mechanism of water inrush resulting from overburden fracture [16,17,18]. The primary research method in these studies is one of numerical simulation or its combination with other approaches.
Xiaowei Lu et al. [19] predicted the height of the water-conducting fracture zone using empirical formulas, a BP neural network, and CDEM numerical simulation. The predicted height of the two zones in the overlying strata of the working face was verified by the underground water-conducting fracture zone height observation method and the borehole peeping method. Donghai Jiang et al. [20] calculated the height of the water-conducting fracture zone in the working face through theoretical analysis, FLAC3D numerical simulation, and field measurements.
Feng Wu et al. [21] proposed a method for determining the height of the fracture zone based on thin-plate theory, utilizing theoretical analysis, numerical simulation, and field measurements. A mechanical model of the key layer as a thin plate was established. Jianghui He et al. [22] proposed, applied, and validated a method for predicting the height of the water-flowing fractured zone, explaining the reasons for differences between coalfields in Northwest and East China. Discrete element software (3DEC) was used to simulate the progressive failure and collapse of the overlying strata. Lulin Zheng et al. [23] calculated the maximum height of the failure zone by assuming it to be equal to the height of the plastic zone obtained from FLAC3D simulation. Additionally, they analyzed the vertical displacement, vertical stress, and the evolution of the plastic zone in the overburden rock under different working face advancing distances.
In the aforementioned studies, depending on geological conditions, the height of the water-conducting fracture zone ranged from 22 to 84 m, once again confirming that the parameters of the fractured zone depend on numerous factors. Moreover, the research results were predominantly validated through field monitoring. Thus, there is currently no unified methodology for predicting the height of the fracture zone and, consequently, for assessing the water inrush hazard.
To control the water inrush in mining operations, both passive and active control methods can be employed. Passive measures include water table reduction and dewatering, whereas active strategies involve the construction of anti-filtration barriers. Unlike dewatering techniques, anti-filtration barriers do not contribute to the generation of contaminated wastewater or the depletion of groundwater resources. Furthermore, they prevent the additional deformation of geological formations and surface subsidence.
The presence of water in coal deposits presents significant challenges for mining and resource recovery. The average water inflow into mining faces typically does not exceed 4–5 m3 per hour. However, even such volumes lead to a decreased labor productivity, compromised occupational safety, and reduced operational efficiency in coal extraction.
Therefore, the identification of effective strategies for mitigating excessive water inflows into mine roadways remains a critical research challenge. The implementation of advanced technological solutions for preventing water inrush necessitates a precise understanding of hazardous zones where preventive measures must be applied.
An analysis of recent studies has revealed that the variety of forms of folds and overburden rock structures cannot be taken into account in theoretical calculation methods of the height of the fractured zone, which is their significant weakness. At the same time, numerical simulation allows to predict more accurately the fractured zone parameters in a wide variety of conditions, for example, in the case of a non-monoclinal structure and the complex lithology of overburden rock. Previous articles are mainly focused on assessing the height of fractured zones in monocline without taking into account specific geological conditions.
The main novelty of this paper is the development of the algorithm for assessing the risk of water inrush from aquifers based on an ANSYS simulation in complex anticline coal seam bedding. The proposed algorithm has been tested for the conditions of the number 817 longwall panel of the Xinhu Coal Mine. Based on the conducted research, the risk of water inrush is evaluated. The water inrush control method by grouting through multiple directional wells is described in this paper. The successful implementation of this method is presented based on the experience of the Xinhu Coal Mine.

2. Engineering Background

Xinhu Coal Mine is located in Woyang County, Anhui Province, China, approximately 14 km from Woyang County (Figure 2a). The coal mine has a designed capacity of 3 million tons per year and an expected service life of 63.4 years.
Mining area 81 is situated in the central-western part of Xinhu Coal Mine. This is the first extraction panel in the mine. The designed length of the number 815 longwall panel is 1770 m (horizontal distance), with a longwall length (inclination distance) of 239 m. A fully mechanized cave mining of the coal seam was used.
Based on drilling data and three-dimensional seismic exploration, 195 combined faults have been identified in the mining area, including 3 faults with H ≥ 100 m, 3 faults with 50 m ≤ H < 100 m, 4 faults with 20 m ≤ H < 50 m, 21 faults with 10 m ≤ H < 20 m, 77 faults with 5 m ≤ H < 10 m, and 87 faults with H < 5 m. Among them, fault 815F16 is a high-angled fault with a displacement of 7.5 m. It is activated by factors such as ground stress, abutment pressure, overburden deformation, and resulted in active water inflow.
Through a statistical analysis of exploration well data in the number 81 mining area, the predominant lithology has been identified as fine sand and clayey sand. Additionally, the bottom layer contains gravel, clay, or loam.
The upper part of the number 81 mining area is weakly water-bearing (−450 m) and consists of gray-green, brown-red, gray-white, clayey sandstones, and limestone clays, with localized occurrences of marl. The thickness of the impermeable layer remains relatively stable, which prevents surface water and atmospheric precipitation from establishing a hydraulic connection with the 81 mining area and the coal-bearing underground water.
During the mining of the 815 longwall, a filtration window formed due to a fracture in the sandstone in overburden rock. The longwall mining began in March 2023, and, when 314 m had been extracted, water inflow occurred (Figure 2b). At the time of the incident, the volumetric water inflow rate was approximately 200 m3/h, reaching a peak of 300 m3/h. The water contained a high concentration of sediment, which led to the blockage of the water pumps.
Figure 2b illustrates the layout of four longwall panels with the location of the water window. In addition, Figure 2b shows the location of monitoring wells. A total of 11 wells were drilled to identify aquifers and monitor water levels.
The primary hazard is posed by the aquifer, as shown in Figure 3a. The aquifer water inrushes in the underground mine roadways through a water-conducting fracture zone.
Two-level horizontal anti-filtration barriers were constructed to control water inrush in the mine. As part of the project, two groups of wells, D1 and D2, were drilled, with a total length of 4447 m (Figure 3).
The concept of the water inrush control method was based on sealing the water inflow channels [24]. This method involved constructing a double horizontal water-protection barrier with two groups of multiple wells in a crosswise pattern. The creation of two interstratal horizontal anti-filtration barriers was carried out by horizontal drilling.
A system of multiple injection wells was established and filled with a cementing mixture. Initially, grouting was applied to seal exposed rock fractures to prevent the loss of drilling fluid. Subsequently, large water-conducting channels were filled, followed by the injection of cement under pressure to seal the remaining rock fractures.
Dense cement slurry with a density of 1.5 g/cm3 was used for water blocking. The cement slurry consisted of cement and aggregates, including fine sand, coarse sand, and granulated slag. In total, 20,926 tons of cement and 655 tons of aggregates were injected as part of this project.
The principal scheme of the drilling of horizontal wells for the creation of anti-filtration barriers is presented in Figure 3b. The barrier layers were located at 70 m and 100 m above the roof of the 8 coal seam in 81 area. The wells were positioned 20–50 m apart.
As a result of segmented and sequential cementation, fractures were sealed, effectively blocking the water channels through which water entered the mine roadways. This process eliminates the issue of roof damage caused by water infiltration.
The project consists of two groups of wells with 11 branches, positioned across the 815F16 fault (339°∠78°, H = 7.5 m) and 815F15 fault (344°∠40°, H = 1.3 m). Well D1 is located approximately 70 m above the roof of the number 8 coal seam, while well D2 is positioned at a depth of 100 m above the roof of the number 8 coal seam.
Figure 4 presents the principal scheme of cementation through well D2-1, which was the largest and reached 11,895 tons. This well primarily sealed the water inflow and 815F16 fault. After the preliminary filling of fractures, a large volume of cement slurry was used to form the so-called “cap”, effectively sealing the aquifer.
The water pathways were effectively sealed by creating a horizontal anti-filtration barrier and cementing the water-conducting channels through which water enters the mine roadway of the number 815 longwall panel. This significantly reduces the volume of water inflow, achieving a 100% water-blocking effect.

3. Materials and Methods

3.1. Geological and Engineering Conditions

Number 81 mining area is located on the eastern limb of the Xinhu syncline, south of the number 14 exploration line. North of the 14 line, the structural orientation gradually transitions into a monoclinal structure near NW40° and dips toward NE50°. Most of the coal seam dip angles vary from 10° to 25°, with an average dip angle of 12°.
The average coal seam thickness is 2.6 m. The fully mechanized caving mining of the coal seam with shearer technology was adopted. The number 815 ventilation and conveyor roadways had a rectangular cross-sectional shape, with arched roof profile. The length of the number 815 longwall was 230 m.
This study examines an area of the mine field located near the 815 accident longwall (Figure 5). As seen from the cross-section, which illustrates the situational overview along with geological and mining-technical components, during the excavation of the 815 longwall panel, the distance to the aquifer is the shortest. Consequently, the risk of establishing a hydraulic connection with the aquifer is maximal.
The location of the stop mining line of the number 815 longwall allows to make an assessment of the spatial relationship between the working face, fault, and aquifer at the moment of water inrush and the identification of its primary causes. The first cause is that the water-conducting fracture zone above the goaf reaches the aquifer. The second cause is the influence of 815F16 fault (the predicted position of this fault is marked in red dashed line in Figure 5). The steep inclination of the fault at 78 degrees and its large displacement (7.5 m) leads to the formation of a downward water migration path, even in the absence of hydraulic pressure. Practical evidence suggests that a synergistic effect of both causes was likely present.
Analysis of the geological cross-section indicates that the distance to the aquifer in the unmined part of the field will gradually increase due to the coal seam’s dip angle. This reduces the risk of water inflow from the aquifer through the water-conducting fracture zone above the goaf. At the same time, an analysis of fault parameters suggests that, in the unmined part of the mine field, the water inflow through faults is unlikely, since faults with steep inclination and large displacement (like the 815F16 fault) are not detected by the geological forecast.
Thus, during the extraction of future longwall panels, the highest risks of water inrush are associated with extraction of the number 817 longwall. At the same time, the most hazardous thing is inflow through the water-conducting fracture zone. This conclusion is based on the geological assessment and the adoption of the mechanistic concept of hazardous sections as a risk criterion. Consequently, the target-studied area of potential hazards is shown in Figure 5. This area allows to define the model’s dimensions for the numerical simulation. The study of the stress–strain state of the rock mass should be conducted in the direction of the unmined area, which is located to the right of the stop line of the number 815 longwall.

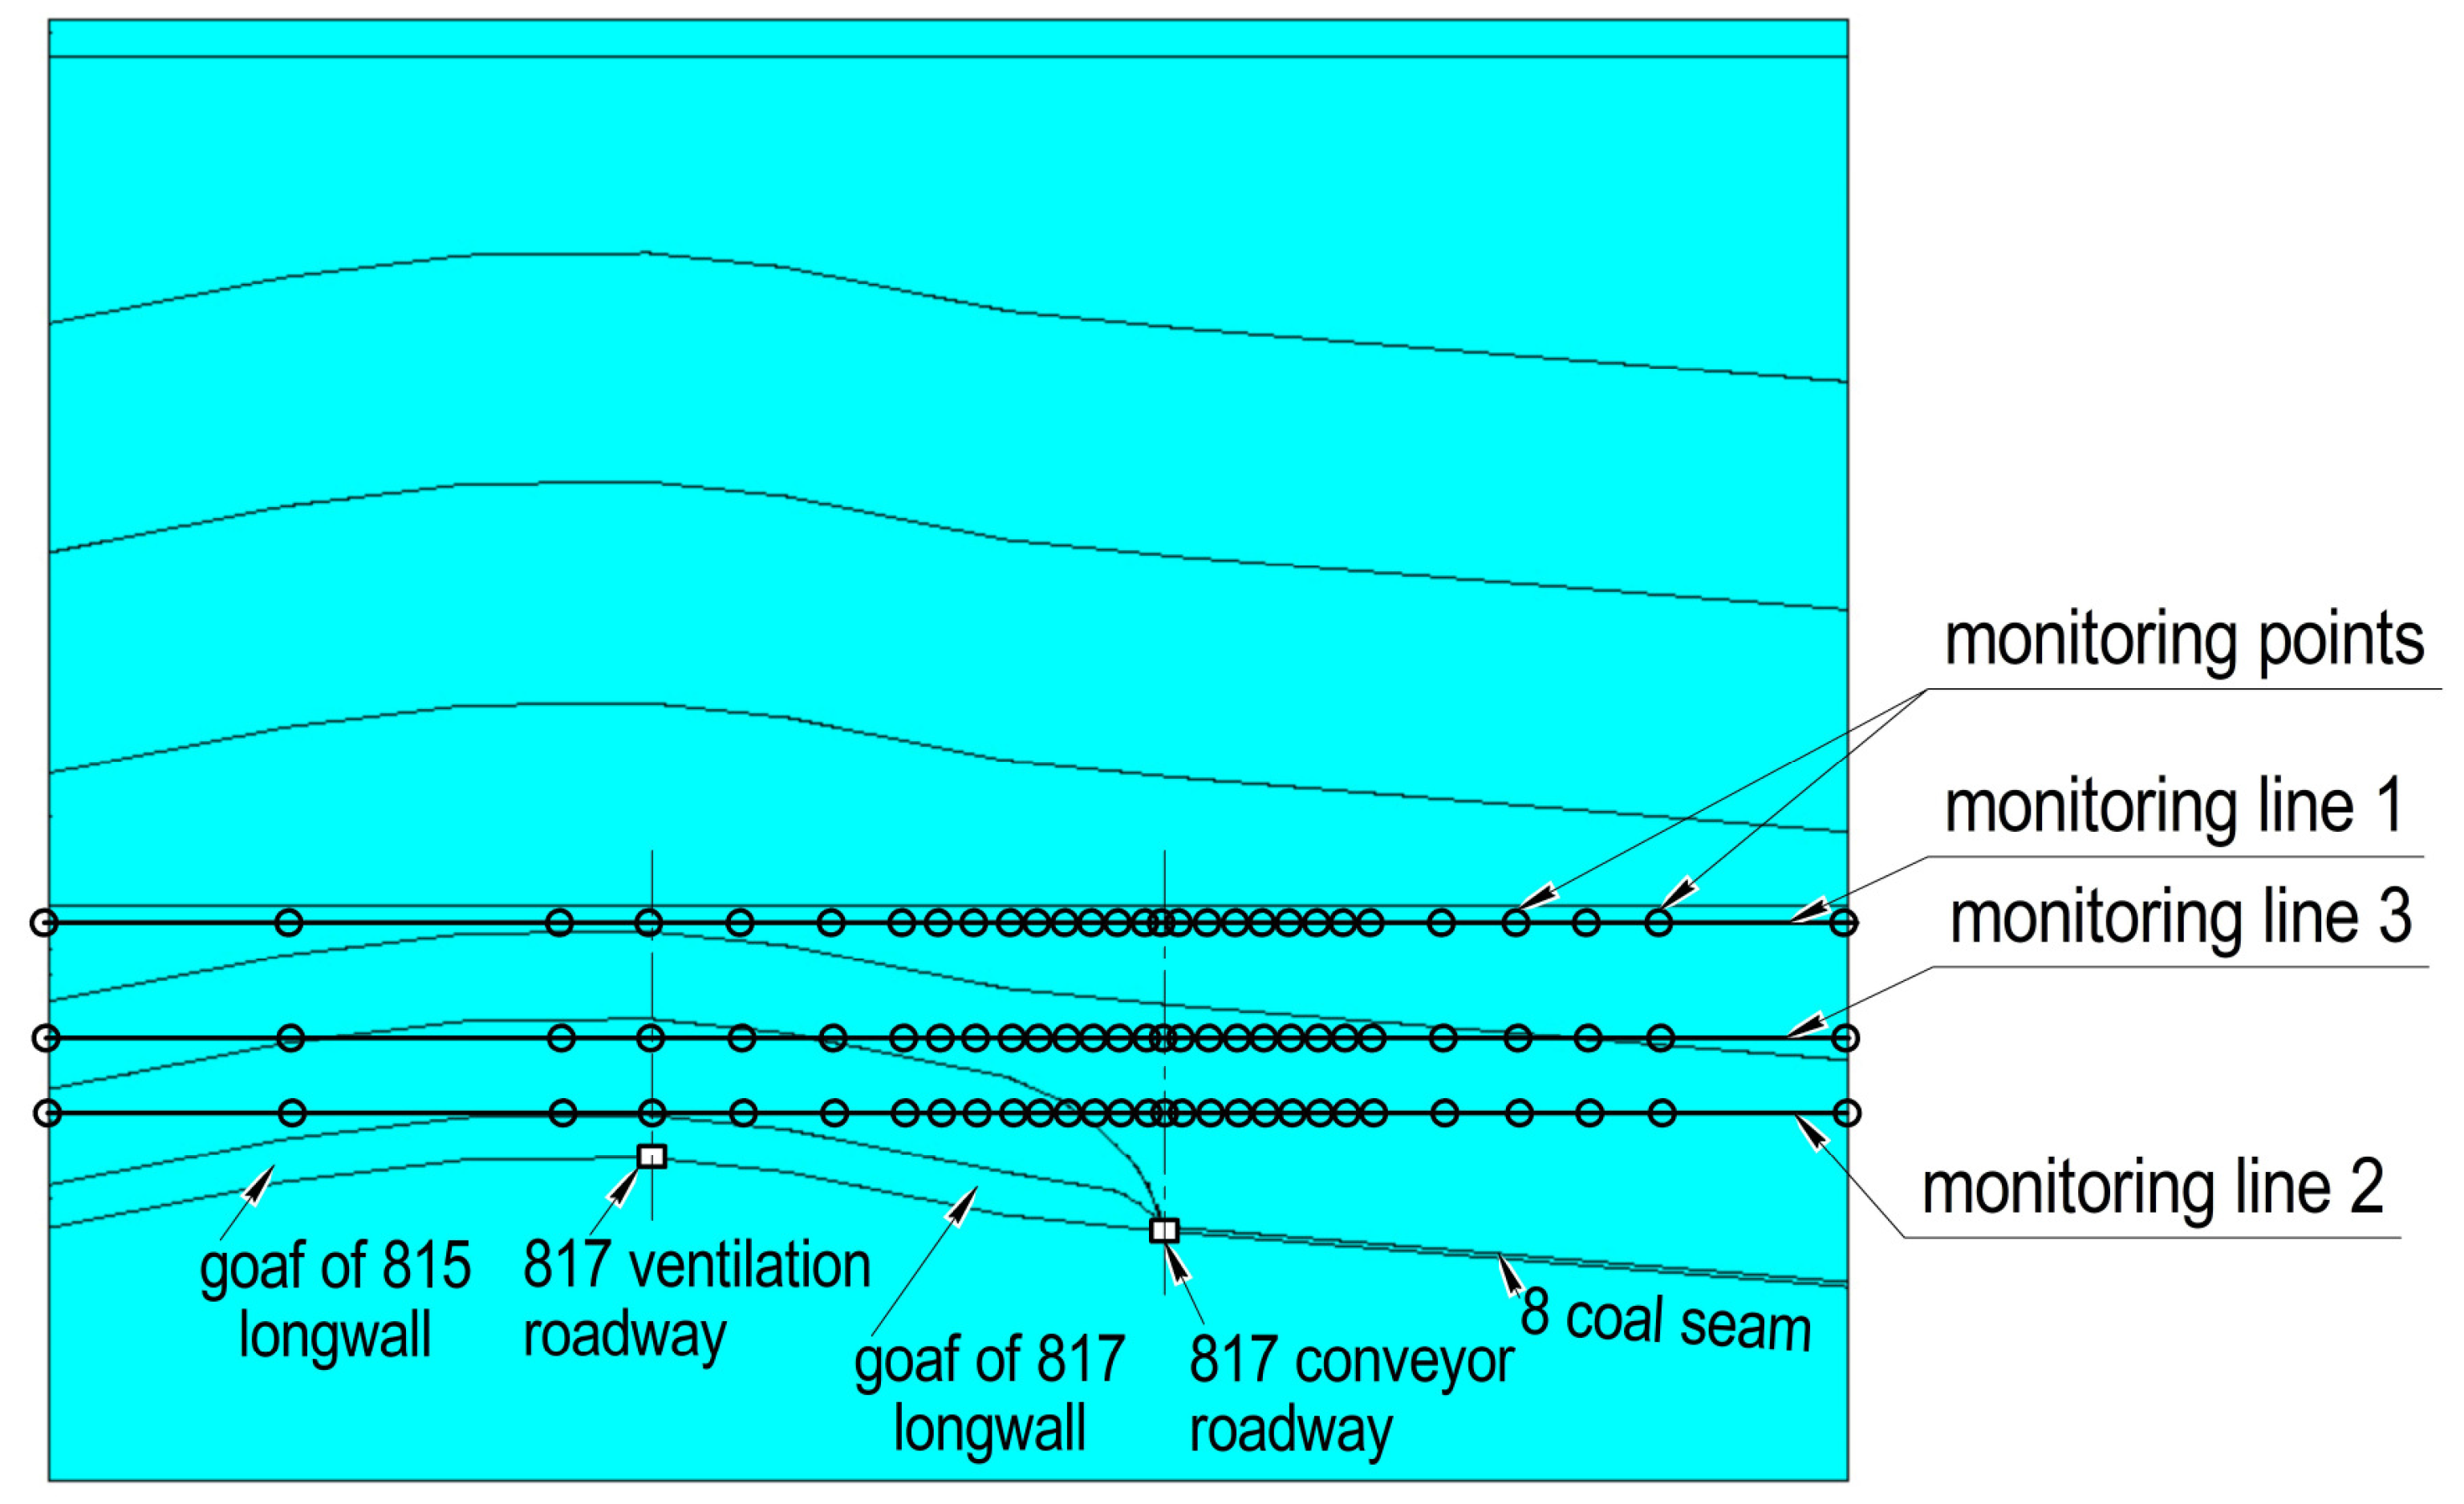
3.2. Numerical Model

Figure 6a shows a schematic representation of the geomechanical conditions after the excavation of the 817 longwall. The numerical model, which was used in this study (Figure 6b), was based on this scheme.
The coal-bearing strata are Permian multi-strength rock mass represented mainly by sandstone, mudstones, and limestones. For the numerical simulation in this study, the lithological column was simplified. The rock strata were combined into groups. Each rock strata group had a thickness of 125 m. The choice of such thickness was determined by the distance from the number 8 coal seam to the aquifer. The Cenozoic strata, which cover the Permian, were also divided into 125 m groups. The rock properties in each group were calculated as a weighted average and were specified during model calibration. The calibration procedure is given below.
The aquifers are divided into the Quaternary loose-layer pore aquifer group, the Permian main coal-bearing sandstone fracture aquifer sections, and the Taiyuan Group and Ordovician limestone karst fracture aquifer sections [25]. Number 8 coal seam belongs to the Permian coal-bearing strata. The Permian strata contain three groups of the fractured sandstone aquifers. The main recharge water source for mine water is the Cenozoic bottom aquifer, which covers the Permian coal-bearing strata. This aquifer directly overlays the coal-bearing strata, with a thickness ranging from 0 to 20.65 m, averaging 6.53 m. The floor depth ranges from 425.40 to 516.60 m, with an average of 487.57 m. The aquifer thickness varies greatly and consists of silty yellow, deep yellow, and variegated fine to medium sand, gravel, claystone, and silty gravel (Figure 6a).
The right boundary of the model was positioned at a distance exceeding 40% of the length of the 817 longwall goaf along the dip direction. The lateral boundaries did not affect the stress–strain state near the longwall panel. Thus, the boundary conditions in the model were satisfied.
The finite element method in the Ansys Mechanical 17.2 software for three-dimensional solid modeling was used for numerical simulation. The numerical model’s dimensions were set to 1000 m in width, 814 m in height, and 200 m in length (Figure 6b). The model width was pre-optimized by testing the sensitivity of the model by the stress factor.
The horizontal displacements of the lateral boundaries of the model were constrained in a normal direction, while the bottom boundary was fixed vertically. The upper boundary of the model was not fixed. Vertical gravity was the only applied force in the model.
A meshing of the prismatic elements was used in the model. The numerical model was automatically divided into finite elements by the built-in meshing module. The optimal shape and size of the finite elements were selected based on its geometry. After mesh generation, the model was checked for geometric errors (such as zero-length elements, degenerate elements, and duplicate node numbers). Subsequently, a manual mesh optimization was performed.
An orthotropic model was used to simulate the behavior of the rock mass. The behavior of anisotropic material, such as sedimentary rocks, is accurately simulated by this model [26,27,28]. The variation in the physical and mechanical properties of rock mass along and across the bedding planes was determined by the calibration of the numerical model, as described in the study of [29].
Since the model represented a scenario after excavation of the number 815 longwall and the number 817 longwall, a fractured zone and caved zone were simulated in goaf, according to three-zone theory [9,10,11,12]. The height of caved zone was equivalent to eight coal seam thicknesses, and the height of fractured zone was equivalent to twenty seam thicknesses. The basis for such an assumption was the research of Borisov S.S., Kuznetsov G. N., and Ogloblin D. M. In addition, such a model was validated with the results of field measurements, which was shown in previous studies [12,30].
The properties of the rock mass are presented in Table 2. The directions of E1, E2, and E3 in the anisotropic model corresponded to the direction of the axes OX (horizontal), OY (vertical), and OZ (horizontal). To simulate the behavior of rock mass in caved zone and in fractured zone, a pseudo-elastic model was applied, with a Poisson’s ratio of 0.45 and a deformation modulus of 0.6 GPa in caved zone and 0.9 GPa in fractured zone.
The modeling was carried out step-by-step. The geometry and the finite element mesh were not changed, which excluded the accumulation of errors in the solving process.

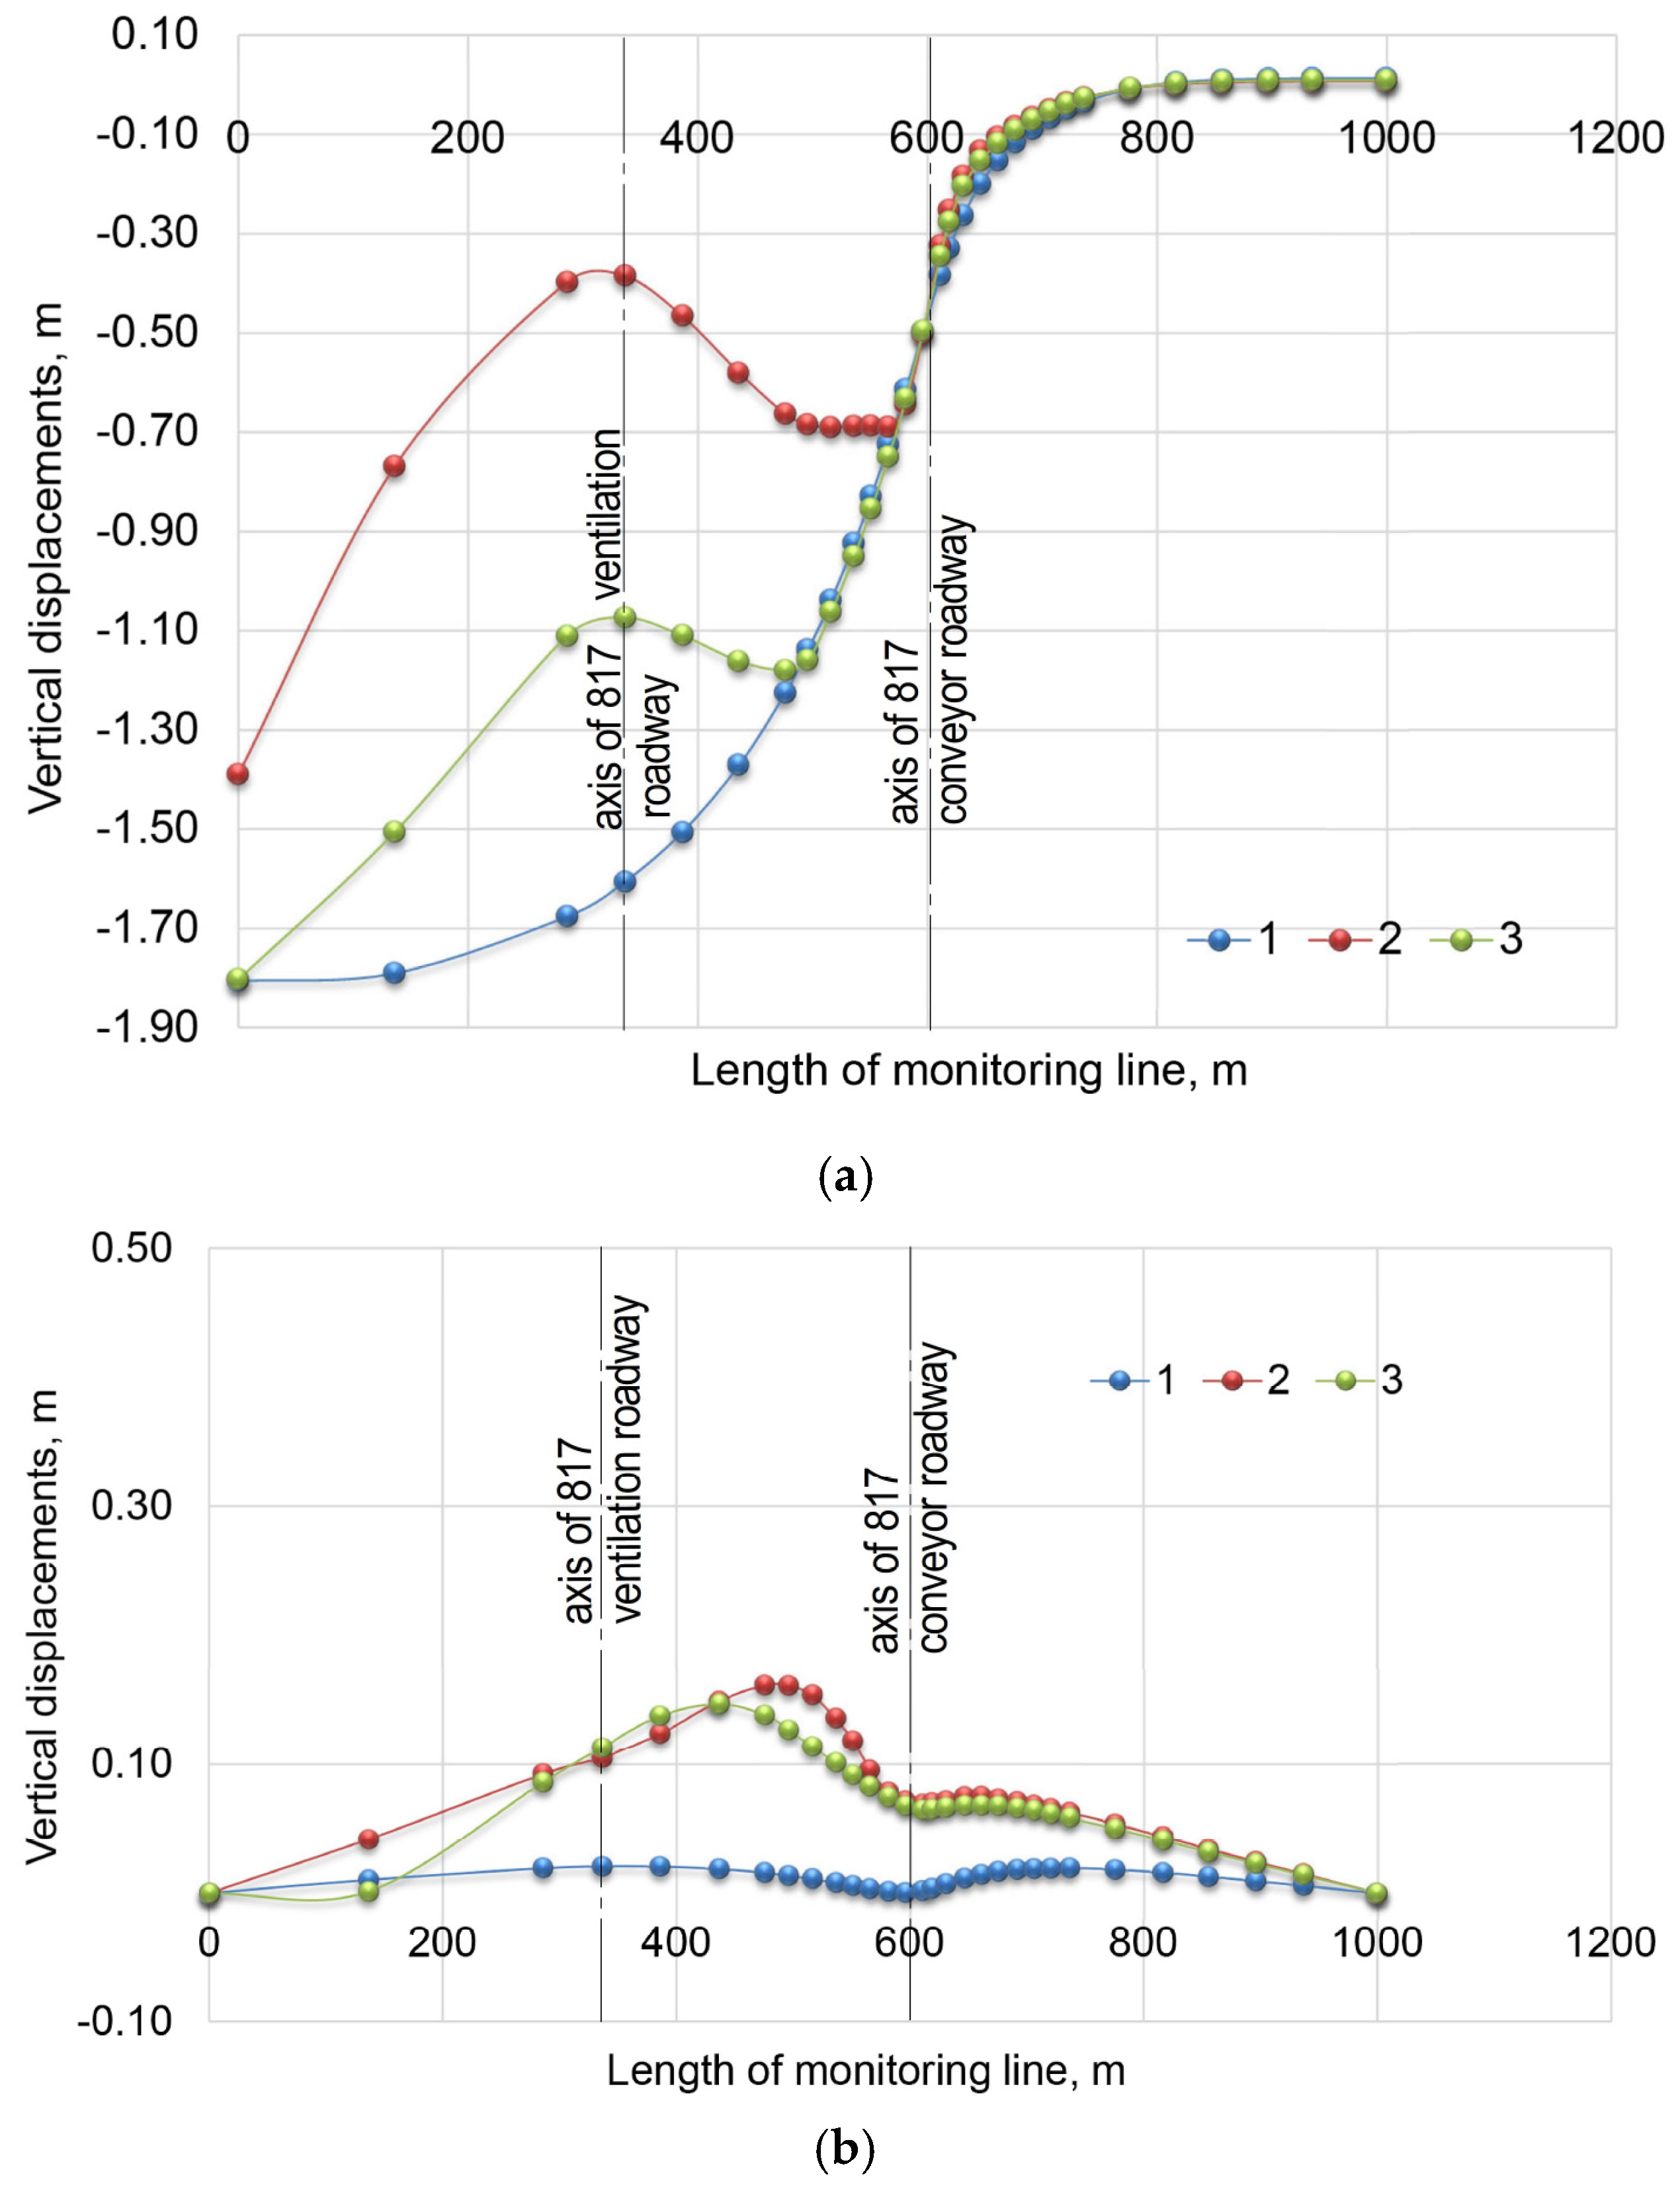
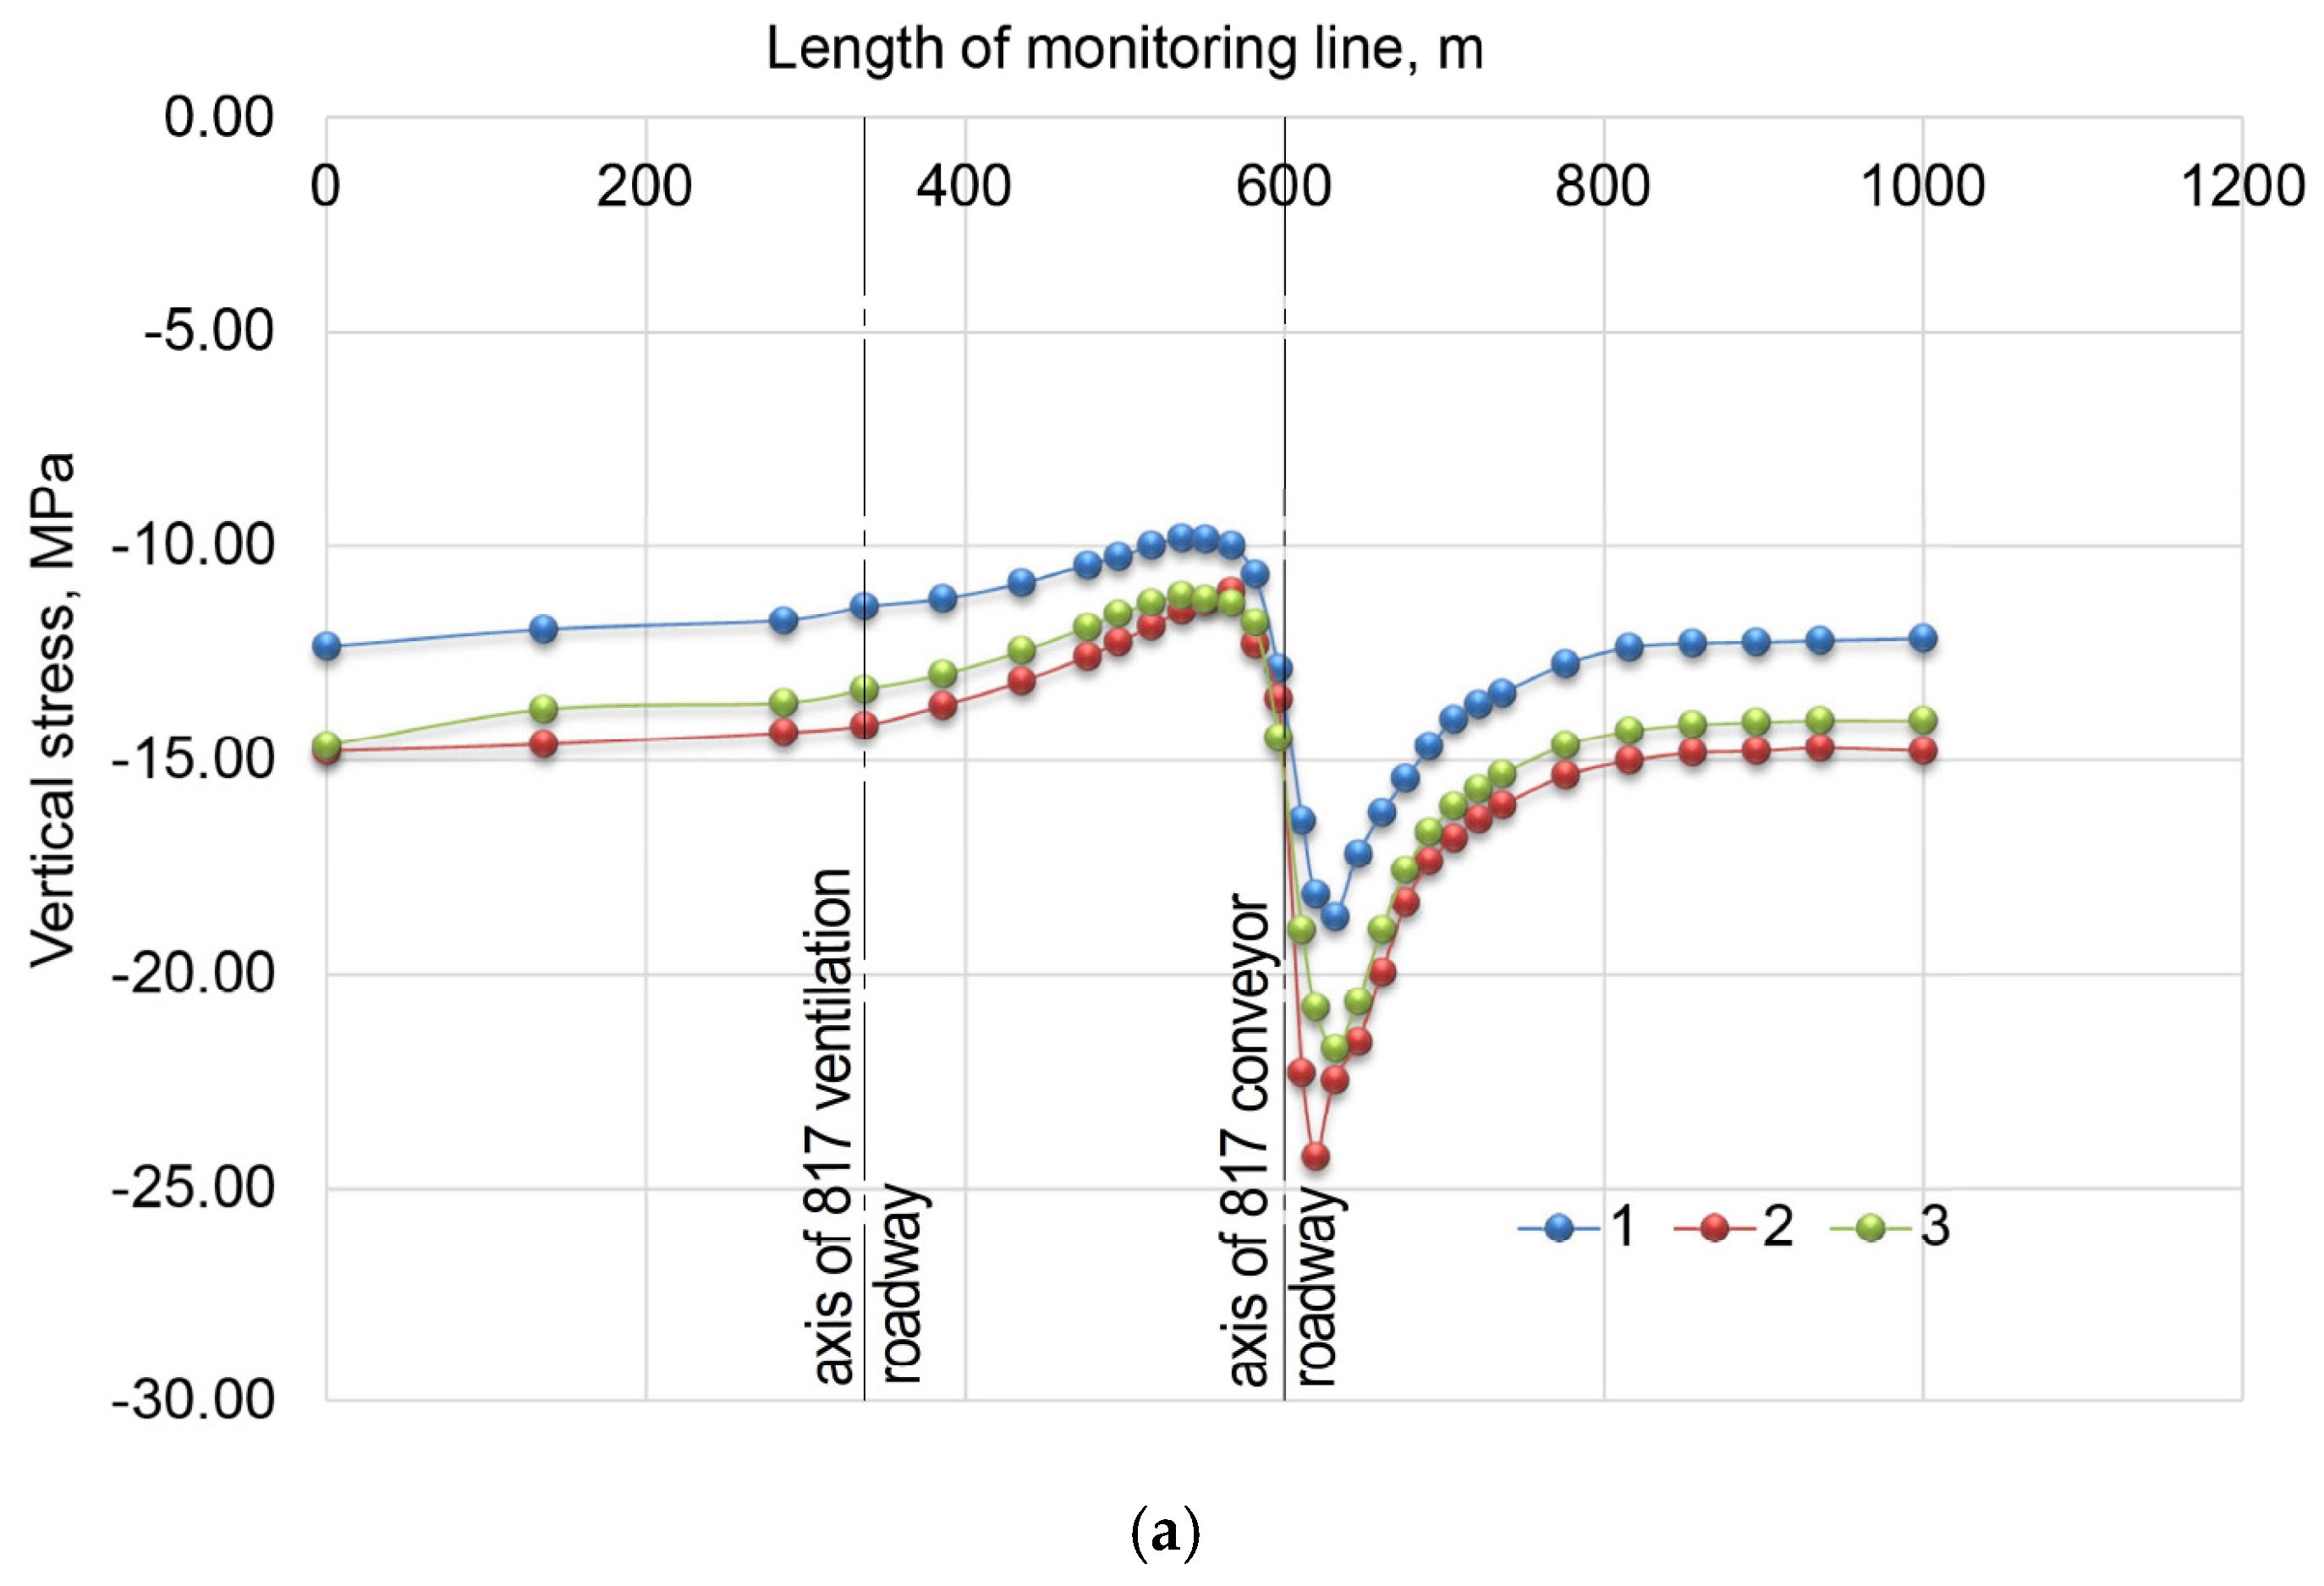
3.3. Simulation Results

The evolution of vertical displacements and vertical stresses in the model during step-by-step simulation is shown in Figure 7 and Figure 8, respectively. The vertical displacement (subsidence) scale is 1:10.
Step 1: Loading the model with gravity, followed by writing the values of stresses and displacements at all nodes of the model into a file using the “Inistate” command in the ADPL programming language (Figure 7a).
Step 2: Reading the created file with stored values and recalculating the numerical model to reset displacements. This step establishes the initial stress–strain state of the rock mass (Figure 7b and Figure 8a).
Step 3: Simulating coal extraction with the formation of the fractured zone and caved zone (Figure 7c and Figure 8b).
Before coal seam excavation, the stress field in the model (as well as in situ) corresponds to the gravitational stress component and can be calculated by multiplying the rock mass density by its depth. Thus, in Figure 8a, the uniform increase in stress with depth can be observed. This stress pattern characterizes the natural stress–strain state of the rock mass before mining. The corresponding vertical displacement distribution is shown in Figure 7b, where displacements are zero, indicating the undisturbed state of the rock mass.
As a result of coal seam extraction in the number 815 and 817 longwalls (left part of the model), a fractured zone and a caved zone formed in the goaf. The roof strata sag, failure, and fall filled the void that was left after coal extraction. During this process, the rock mass expanded and provided support to the overlying strata. This led to the rock mass movement and surface subsidence.
According to the simulation results, the surface subsidence above the goaf of the 815 and 817 longwalls is equal to 1.81 m. Increased stresses were formed over the edge of the number 817 longwall. The vertical stress concentration factor is as follows:
S t r e s s c o n c e n t r a t i o n = σ m a x σ 0 = 63.7 16.8 = 3.79 ,
where σ m a x —maximum vertical stress, MPa; σ 0 —lithological stress, MPa.
A zone of reduced stress occurred above the 817 longwall, while, above the 815 longwall, after the compression of rocks in the goaf, stress gradually recovered. This stress distribution aligns with the modern understanding of the geomechanical processes that occur above the longwall goaf.
The adequacy of numerical models was evaluated by the deviation value of the simulation results from actual field-measured parameters. Since in situ subsidence monitoring was not conducted within this study, the model validation and calibration were performed using predicted subsidence values, as calculated according to the regulation MFEU 101.00159226.001-2003 [31]. Table 3 presents the calculated results of the subsidence trough according to the regulation MFEU [31].
The surface subsidence graphs, used in this study as a criterion for validation of numerical model, are presented in Figure 9.
The accuracy of the numerical model was assessed based on the percentage error calculation. The percentage error for subsidence was calculated as follows:
μ s = S m o n S s i m S m o n 100 %
where S m o n –Subsidence according to MFEU, mm; S s i m –Subsidence based on numerical simulation results, mm.
To assess the error across the entire subsidence curve, the cumulative error was used. For the calculation of this error, the subsidence data were read from graphs along the length of the subsidence trough with a 50 m step. The scheme explaining this process is presented in Figure 10.
The uniform step of data reading from graphs aided to eliminate an error accumulation. The results of the analysis are presented in Table 4. This table also includes the step-by-step calculation of percentage error.
The percentage error calculated according to (2):
μ s = 18948 20046.1 18948 100 % = 5.79 %
The cumulative error is 5.79%, a result that indicates sufficient model accuracy. Based on this, it can be concluded that the numerical model is adequate and can be used in this study.
Three horizontal monitoring lines were used for the stress–strain analysis of the rock mass above the goaf, the edge of the 817 longwall, and the coal seam (Figure 11).
Monitoring line 1 was located along the lower boundary of the aquifer (elevation mark −487.0 m).
Monitoring line 2 was located along the lower boundary of the fractured zone (upper boundary of the caved zone), which is also at the most hazardous intersection (where the seam depth is minimal, at the crest of the anticline) (elevation mark −587.0 m).
Monitoring line 3 was located between two previous lines along the upper boundary of the fractured zone at the most hazardous intersection (elevation mark −557.0 m).
The distribution of vertical and horizontal displacements along the monitoring lines is shown in Figure 12. These graphs indicate that, within the goaf, across the fractured zone and caved zone, irregular vertical displacements are observed. The maximum vertical displacements occurred in the goaf of the number 817 longwall panel (Figure 12a). Above the ventilation roadway of the number 817 longwall, vertical displacements decreased. After that, they increased again in the goaf of the number 815 longwall. The maximum inflection of the vertical displacements curve was observed along monitoring line 2. Along monitoring line 3, the inflection of the vertical displacement curve decreased, reflecting a general stabilization trend. At the aquifer level (monitoring line 1), vertical displacements stabilized, and no inflection of the curve was observed.
Above the goaf of the 817 longwall panel, horizontal displacements reached their maximum values (Figure 12b). Horizontal displacements represent tensile deformations, as they have a positive sign. The maximum horizontal displacement reaches 16 cm along the monitoring line 2. Along the monitoring line 3, horizontal displacements decrease, and, at the aquifer level, they stabilize, aligning in magnitude with the horizontal displacements over the coal seam near the edge of the 817 longwall.
Thus, the vertical and horizontal displacement analysis highlights two potentially hazardous zones:
-
The center of the goaf of the 817 longwall panel, where maximum vertical and horizontal displacements are observed;
-
The edge of the 817 longwall panel, where significant horizontal deformations occur.
However, the analysis also indicates that, at the aquifer level, vertical and horizontal deformations vary smoothly and without any abrupt changes.
The stress distribution analysis along the monitoring lines is shown in Figure 13. At the conveyor roadway level, the vertical stresses in the rock mass are equal to the lithological ones (Figure 13a). To the right of the conveyor roadway (toward the seam), vertical stresses increase within the abutment pressure zone and stabilize at a distance of 150–200 m.
The maximum vertical stress concentration factor was observed along monitoring line 2, with a peak stress value of 24.3 MPa.
The maximum stress zone was shifted toward the coal seam. Vertical stresses at the aquifer level reached 18.6 MPa. The safety factor (SF) by stress at the aquifer level is
S a f e t y F a c t o r ( S t r e s s ) = σ σ m a x = 21.5 18.6 = 1.15
where σ m a x —Maximum stress, MPa; σ —Uniaxial Compressive Strength (UCS) of rock mass, MPa.
The safety factor 1.15, based on the stress parameter, indicates a conditionally stable state (SF = 1.1–1.3) of rock mass near the aquifer zone, according to Hubble [32].
In the goaf of the 817 longwall panel, a stress relief zone was observed, with a minimum stress of −10 MPa. Stresses stabilized in the goaf of the 815 longwall panel as a result of compaction.
Horizontal stresses are maximal along monitoring line 3 (Figure 13b). In the goaf of the 817 longwall panel, the same stress variation pattern was observed as in the case of vertical stress distribution. However, at the aquifer level (monitoring line 1), horizontal stress fluctuations are insignificant, unlike the vertical stress fluctuations.
From a risk assessment perspective, the most hazardous zone is in the surrounding rock of the conveyor roadway of the 817 longwall panel at the coal seam side, where the stress peak was observed.
The distribution of strain along the monitoring lines is shown in Figure 14.
According to the results of testing soft rock samples in a volumetric field [33,34] and under uniaxial compression [35,36] it was found that, for mudstone, siltstone, argillite, shale, and sandstone with a strength of 25–40 MPa, the failure limit for strain is about 0.02–0.03. At the same time, for most soft mudstone, siltstone, and argillite, the limit for strain is about 0.02.
Vertical strains (Figure 14a) at the aquifer level are two orders of magnitude less than the peak strains for sedimentary rocks. In the fractured zone, vertical strains exceed peak values, but this zone does not extend to the aquifer.
Horizontal strain (Figure 14b) at the aquifer level reached maximum positive value (tensile strain) above the conveyor roadway of the 817 longwall panel, i.e., at the edge of the 817 longwall. The magnitude of this strain is 0.0003.
The safety factor by strain at the aquifer level is as follows:
S a f e t y F a c t o r ( S t r a i n ) = ε ε m a x = 0.02 0.0003 = 666.7
where ε m a x —Maximum strain; ε —Peak strain.
Thus, the risk of rock mass failure near the aquifer zone based on the safety factor by strain is extremely low. According to Hubble [32], the rock mass situated near the aquifer zone is normally found to be in a stable state.
The horizontal strains above the goaf were maximal along monitoring line 2. These strains are associated with the bending zone of the rock mass in the “intact rock—goaf” conversion area.

4. Discussion

The result of numerical simulation indicates that the risk of aquifer rock failure, based on the safety factor by strain, is extremely low. The most hazardous zone, according to the simulation results, is the longwall edge zone (to the right of the number 817 conveyor roadway). At the same time, the safety factor by stress indicates conditionally a stable state (SF = 1.1–1.3) [32] of the rock mass near the aquifer area.
Unfortunately, at this present moment in time, there are no generally accepted laws linking safety factors and probabilities of rock mass failure. Figure 15 shows the relationship between safety factors and probabilities of rock failure based on some current geotechnical engineering studies. Although it is accepted that they may only be applied within the constraints of the studies undertaken, it is proposed to use their results to assess the probability of failure in this study.
The probabilities of rock failure near the aquifer were assessed in accordance with the graphs shown in Figure 15. The safety factor of 1.15 corresponds to probabilities of failure of 0.12–0.25 according to the studies of Lambe et al. and Gover [32]. Thus, it is proposed to use probability of rock failure based on safety factors as criteria for the risk of water inrush.
Based on statistical data, Sakhno et al. [37] proposed to implement a four-score system to estimate inrush risk in terms of the levels: “low” level (16.0–36.9); “average” level (37.0–57.9); “high” level (58.0–78.9); and “critical” one (79.0–100.0) (Table 5). According to this classification, the risk of water inrush in the number 817 longwall panel is assessed as being “low” (16.0–36.9).
The integration of simulation results with the geological condition analysis indicates that the flooding incident in the 815 longwall occurred within the influence zone of the 815F16 geological fault, with a steep inclination (78 degrees) and a large displacement (7.5 m). This geological fault led to the rock failure, creating a water migration channel from the aquifer.
Thus, the highest risk of future water inrush from the aquifer can be expected in zones influenced by faults with steep dip angles. Specifically, in the 817 longwall panel, two faults have been identified, with inclinations of less than 50 degrees and displacement of about one meter. Therefore, available geological data do not allow to predict the occurrence of any additional risk of water inrush in the 817 longwall panel.
Based on the conducted research, the following algorithm for determining the risk of any water inflow from aquifer is proposed:
  • Construction of a numerical model based on geological exploration data.
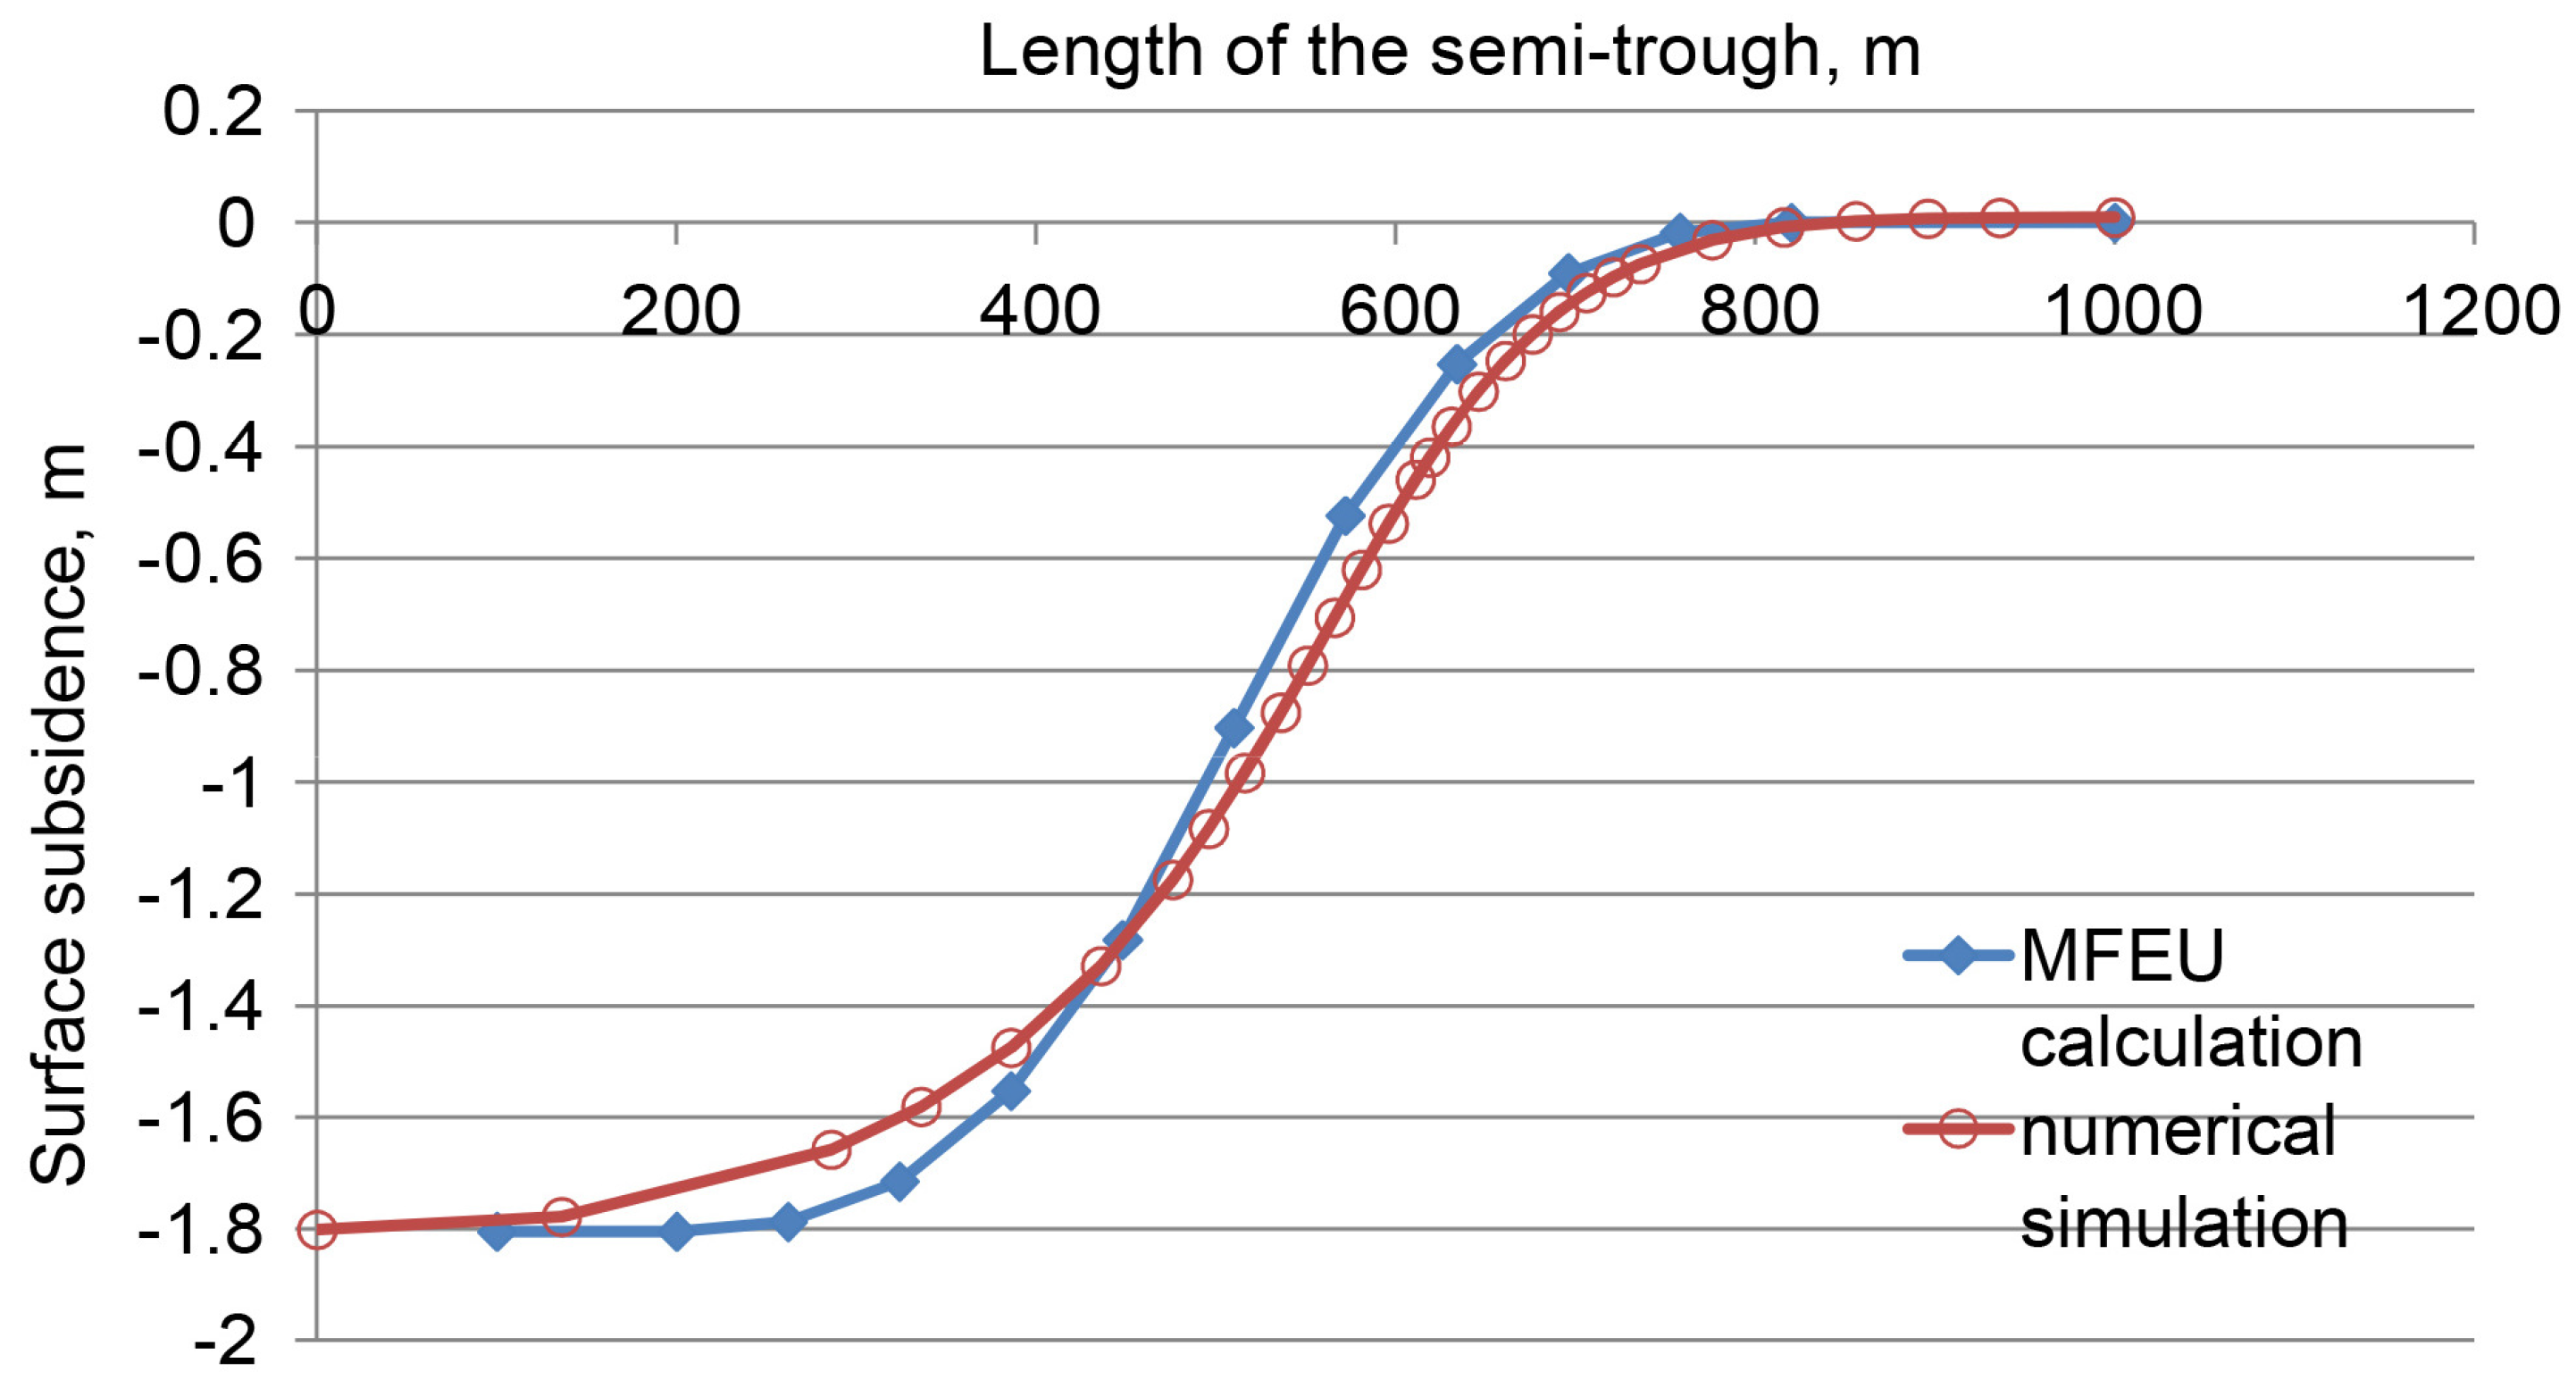
  • Calibration of the model and verification of its adequacy.
  • Calculation of the stress–strain state of the rock mass.
  • Analysis of the stresses and strains at the lower boundary of the aquifer.
  • Calculation of safety factor (Stress) and safety factor (Strain) by mathematical expressions (4), (5).
  • Determination of the probabilities of rock mass failure (Figure 15).
  • Estimating inrush risk (Table 4).
  • Additional assessment of the influence of faults with steep dip angles and large displacement.
The proposed algorithm has been tested for the conditions of the 817 and 815 longwall panel of the Xinhu Coal Mine. Fulfillment of 1–7 points of the proposed algorithm does not show the risk of water breakthrough over the 815 longwall panel. However, such a risk can be predicted based on point 8. The lack of a reliable forecast of the spatial orientation of the fault does not allow to enter it into the model for a more accurate analysis. The geometry of the model can be adjusted when spatial orientation of the fault is known.
As a preventive measure against water inrushes in fault-influenced zones, it is recommended to preemptively create local anti-filtration barriers from underground mine roadways by the application of grouting. This method helps to prevent water inflows by the grouting of fractured rocks in fault zones. Additionally, the total drilling costs would be significantly lower than those associated with the surface-based method, which was implemented at the Xinhu Coal Mine to control the flooding incident.
For real-time monitoring and timely decision making, it is recommended to establish a water inflow monitoring system (monitoring wells) in potentially high-risk zones, particularly those near the faults.
Alongside the water monitoring system, an emergency response protocol for increased water inflows should be incorporated into the mine’s emergency response plan. This protocol should include rapid-response measures, such as the mobile injection of fast-setting cement mixtures into potential water inrush hazardous zones within the mine. The comprehensive implementation of these measures will enhance the safety of mining operations.

5. Conclusions

This study was focused on the challenge of coal mining under aquifers. In this paper, we have described a water inrush control method by grouting through multiple directional wells, which was implemented in the Xinhu Coal Mine. The numerical simulation by ANSYS software was used to analyze the stress–strain state of surrounding rock near the aquifer. As a result, the locations of maximum stress and strain zones in surrounding rock near aquifer over the goaf of the longwall panel were found. Based on this analysis, an algorithm for determining the risk of water inrush from aquifer was proposed, and its testing for the conditions of the 817 longwall panel was conducted. Based on the results of this investigation, the following conclusions can be drawn:
(1)
The stress–strain analysis highlights where two potentially hazardous zones of rock mass failure near the aquifer may be found:
-
Above the goaf of the longwall panel, where maximum vertical and horizontal displacements and strain are observed;
-
Above the edge of the longwall panel, where maximum vertical stress occurs.
At the same time, concentrations of compressive stresses in the abutment zone above the edge of the longwall panel are the most likely cause of rock failure.
(2)
Safety factors, based on the stress and strain parameters, can be used as criteria for the risk of rock failure in the aquifer zone. The result of numerical simulation indicates that the risk of failure of surrounding rock near the aquifer based on the calculation of the strain safety factor is extremely low. The safety factor by stress indicates a conditionally stable state of rock mass near the aquifer zone. Based on current geotechnical engineering studies, it is possible to recalculate safety factors to probabilities of rock failure. For example, for the edge of the 817 longwall panel, a safety factor of 1.15 corresponds to probabilities of rock failure of 0.12–0.25.
(3)
The algorithm for determining the risk of water inflow from aquifer is proposed. The proposed algorithm has been tested for the conditions of 817 longwall panel of the Xinhu Coal Mine.

Author Contributions

Conceptualization, I.S. and S.S.; methodology, I.S. and N.Z.; software, I.S., Y.Z. and N.Z.; validation, S.S., R.S. and L.X.; formal analysis, S.S., R.S. and L.X.; investigation, I.S. and S.S.; resources, N.Z. and L.X.; writing—original draft preparation, I.S.; writing—review and editing, N.Z., S.S. and L.X.; visualization, Y.Z. and L.X.; supervision, I.S.; project administration, I.S. and N.Z.; funding acquisition, N.Z. and Y.Z. All authors have read and agreed to the published version of the manuscript.

Funding

This research received no external funding.

Institutional Review Board Statement

Not applicable.

Informed Consent Statement

Not applicable.

Data Availability Statement

The original contributions presented in this study are included in this article, and further inquiries can be directed to the corresponding author.

Acknowledgments

The authors are grateful to the administration of Technical University “Metinvest Polytechnic” LLC, and National Technical University of Ukraine “Igor Sikorsky Kyiv Polytechnic Institute” for supporting this research.

Conflicts of Interest

The authors declare no conflicts of interest.

References

  1. Wang, D.; Sui, W.; Ranville, J.F. Hazard identification and risk assessment of groundwater inrush from a coal mine: A review. Bull. Eng. Geol. Environ. 2022, 81, 421. [Google Scholar] [CrossRef]
  2. Liang, S.; Zhang, X.; Ke, F.; Liu, J.; Yao, Q.; Luo, H.; Li, X.; Xu, Y. Evolution of Overlying Strata Bed Separation and Water Inrush Hazard Assessment in Fully Mechanized Longwall Top-Coal Caving of an Ultra-Thick Coal Seam. Water 2025, 17, 850. [Google Scholar] [CrossRef]
  3. Zhang, J.; He, M.; Yang, G.; Wang, Y.; Hou, S. N00 Method with Double-Sided Roof Cutting for Protecting Roadways and Surface Strata. Rock Mech. Rock Eng. 2024, 57, 1629–1651. [Google Scholar] [CrossRef]
  4. Kuznetsov, G.N. Investigation of Deformations and Pressures Arising in a Multistratified Roof Cantilever, and Its Interaction with the Supports; USSR: Saint Petersburg, Russia, 1960; pp. 3–34. (In Russian) [Google Scholar]
  5. Qian, M.G.; Li, H.C. The law of overlying strata movement and its influence on the pressure of mine. Coal 1982, 2, 1–8. [Google Scholar]
  6. Song, Z. Rules for the stope bearing pressure and its application. J. Shandong Inst. Min. Technol. 1982, 1, 1–25. (In Chinese) [Google Scholar]
  7. Qian, M.; Miao, X.; Xu, J. Key Stratum Theory in Ground Control; China University of Mining and Technology Press: Xuzhou, China, 2003; p. 120. (In Chinese) [Google Scholar]
  8. Xu, J.L.; Qian, M.G. Study and application of dominant stratum theory for control of strata movement. China Min. Mag. 2001, 10, 54–56. [Google Scholar]
  9. Gao, Y. Four-zone model of rockmass movement and back analysis of dynamic displacement. J. China Coal Soc. 1996, 21, 51–56. (In Chinese) [Google Scholar]
  10. Xuan, D.; Xu, J.; Wang, B.; Teng, H. Borehole investigation of the effectiveness of grout injection technology on coal mine subsidence control. Rock Mech. Rock Eng. 2015, 48, 2435–2445. [Google Scholar] [CrossRef]
  11. Zhang, D.L. Strata control in fully-Mechanized sub-level caving face. Shandong Univ. Sci. Technol. 2000, 19, 8–11. [Google Scholar]
  12. Sakhno, I.; Sakhno, S.; Petrenko, A.; Barkova, O.; Kobylianskyi, B. Numerical simulation of the surface subsidence evolutioncaused by the flooding of the longwall goaf during excavation of thin coal seams. IOP Conf. Ser. Earth Environ. Sci. 2023, 1254, 012057. [Google Scholar] [CrossRef]
  13. Budryk, W.; Knothe, S. The influence of the underground coals excavation for the surface. Przeglqd Gorniczy 1950, 11. (In Polish) [Google Scholar]
  14. Buczek, M.; Nguyen, Q.L.; Bui, X.N.; Nguyen, H. Application of Knothe-Budryk Theory and Rigid Body Condition forAssesment of Subsidence. Sustain. Dev. Mt. Territ. 2018, 10, 595–603. [Google Scholar] [CrossRef]
  15. Bazaluk, O.; Kuchyn, O.; Saik, P.; Soltabayeva, S.; Brui, H.; Lozynskyi, V.; Cherniaiev, O. Impact of ground surface subsidence caused by underground coal mining on natural gas pipeline. Sci. Rep. 2023, 13, 19327. [Google Scholar] [CrossRef]
  16. Fan, K.; Li, W.; Wang, Q.; Liu, S.; Xue, S.; Xie, C.; Wang, Z. Formation mechanism and prediction method of water inrush from separated layers within coal seam mining: A case study in the Shilawusu mining area, China. Eng. Fail. Anal. 2019, 103, 158–172. [Google Scholar] [CrossRef]
  17. Anisimova, L.; Babyi, K.; Pihulevskyi, P. Some Hydrochemical Features of Water Filtration Sources from under the Left-bank Dumps. In Proceedings of the 16th International Conference Monitoring of Geological Processes and Ecological Condition of the Environment, Kyiv, Ukraine, 15–18 November 2022; pp. 1–5. [Google Scholar] [CrossRef]
  18. Zhang, S.; Shen, B.; Li, Y.; Zhou, S. Modeling rock fracture propagation and water inrush mechanisms in underground coal mine. Geofluids 2019, 2019, 1796965. [Google Scholar] [CrossRef]
  19. Lu, X.; Jiang, J.; Wang, W.; Cao, H. Study on the “Two-Zone” Heights in Lower Slice Mining Under Thick Alluvium and Thin Bedrock. Appl. Sci. 2024, 14, 10128. [Google Scholar] [CrossRef]
  20. Jiang, D.; Tang, Y.; Huang, W.; Hou, K.; Luo, Y.; Liu, J. Research on the Height of the Water-Conducting Fracture Zone in Fully Mechanized Top Coal Caving Face under Combined-Strata Structure. Sustainability 2022, 14, 13781. [Google Scholar] [CrossRef]
  21. Wu, F.; Gao, Z.; Liu, H.; Yu, X.; Gu, H. Theoretical Discrimination Method of Water-Flowing Fractured Zone Development Height Based on Thin Plate Theory. Appl. Sci. 2024, 14, 6284. [Google Scholar] [CrossRef]
  22. He, J.; Li, W.; Fan, K.; Qiao, W.; Wang, Q.; Li, L. A method for predicting the water-flowing fractured zone height based on an improved key stratum theory. Int. J. Min.Sci. Technol. 2023, 33, 61–71. [Google Scholar] [CrossRef]
  23. Zheng, L.; Liu, X.; Qiu, Q.; Tian, Y.; Ren, W.; Xu, J.; Wang, X. Failure and development height of overlying rock of a water flowing fracture in goaf under a karst aquifer. Sci. Rep. 2025, 15, 2473. [Google Scholar] [CrossRef]
  24. Li, C.; Lu, C.; Xu, J.; Zhang, K.; Liu, S.; Zhao, H. Diffusion Mechanism of Variable-Rate Grouting in Water Prevention and Control of Coal Mine. Water 2024, 16, 2814. [Google Scholar] [CrossRef]
  25. Xing, M.; Wang, Q.; Xu, J.; Li, W. Application of NIPOS-SVM Model for Evaluation of Water Richness of Coal Seam Roof Aquifer—A Case Study of the Xinhu Coal Mine in Huaibei, China. Water 2024, 16, 3670. [Google Scholar] [CrossRef]
  26. Cazacu, O.; Cristescu, N.D.; Shao, J.F.; Henry, J.P. A new anisotropic failure criterion for transversely isotropic solids. Mech. Cohesive-Frict. Mater. 1998, 3, 89–103. [Google Scholar] [CrossRef]
  27. Oka, F.; Kimoto, S.; Kobayashi, H.; Adachi, T. Anisotropic behaviorof soft sedimentary rock and a constitutive model. Soils Found. 2002, 42, 59–70. [Google Scholar] [CrossRef] [PubMed]
  28. Khanlari, G.; Rafiei, B.; Abdilor, Y. Evaluation of strength anisotropy and failure modes of laminated sandstones. Arab. J. Geosci. 2015, 8, 3089–3102. [Google Scholar] [CrossRef]
  29. Sakhno, I.G.; Molodetskyi, A.V.; Sakhno, S.V. Identification of material parameters for numerical simulation of the behavior ofrocks under true triaxial conditions. Nauk. Visnyk NHU 2018, 5, 48–53. [Google Scholar] [CrossRef]
  30. Sakhno, I.; Sakhno, S.; Vovna, O. Surface Subsidence Response to Safety Pillar Width Between Reactor Cavities in the Underground Gasification of Thin Coal Seams. Sustainability 2025, 17, 2533. [Google Scholar] [CrossRef]
  31. MFEU 2004 Pravyla Pidrobky Budivel’, Sporud i Pryrodnyx Objektiv pry Vydobuvanni Vuhillja Pidzemnym Sposobom MFEU 101.00159226.001-2003. Available online: https://zakon.isu.net.ua/sites/default/files/normdocs/pravila_pidrobki_budivel_sporud_i_prirodnikh_obektiv_pri_vido.pdf (accessed on 10 April 2025). (In Ukrainian).
  32. MacRobert, C.J. Factors of safety and probabilities of failure in geotechnical engineering: What do we mean? Civ. Eng. 2018, 26, 45–50. [Google Scholar]
  33. Zhou, H.; Zhang, C.; Li, Z.; Hu, D.; Hou, J. Analysis of mechanical behavior of soft rocks and stability control in deep tunnels. J. Rock Mech. Geotech. Eng. 2014, 6, 219–226. [Google Scholar] [CrossRef]
  34. Josh, M.; Esteban, L.; Delle Piane, C.; Sarout, J.; Dewhurst, D.N.; Clennell, M.B. Laboratory characterisation of shale properties. J. Pet. Sci. Eng. 2019, 88, 107–124. [Google Scholar] [CrossRef]
  35. Almisned, O.A.; Alqahtani, N. Rock analysis to characterize Saudi soft sandstone rock. J. Pet. Explor. Prod. Technol. 2021, 11, 2381–2387. [Google Scholar] [CrossRef]
  36. Liu, Q.; Liang, B.; Sun, W.; Zhao, H. Experimental Study on the Difference of Shale Mechanical Properties. Adv. Civ. Eng. 2021, 2021, 6677992. [Google Scholar] [CrossRef]
  37. Sakhno, I.; Sakhno, S.; Vovna, O. Assesing a risk of roof fall in the development mine workings in the process of longwall coal mining in terms of Ukrainian mines. Min. Miner. Depos. 2020, 14, 72–80. [Google Scholar] [CrossRef]
Figure 1. Scheme of water inrush from aquifers in the result of overlying strata failure.
Applsci 15 04302 g001
Figure 2. Geographical location of Xinhu Coal Mine (a), layout of longwall at the time of an accident (b).
Applsci 15 04302 g002
Figure 3. Vertical section (a) and plan (b) of the water inrush control method by horizontal regional grouting through multiple directional wells. The red lines it is faults, blue area it is flooded area.
Applsci 15 04302 g003
Figure 4. The principal scheme of the section’s cementation through D2-1 well.
Applsci 15 04302 g004
Figure 5. Vertical cross-section of the studied area.
Applsci 15 04302 g005
Figure 6. Principal scheme of the model after the excavation of 817 longwall (a), numerical model in Ansys software (b).
Applsci 15 04302 g006
Figure 7. Evolution of vertical displacements (m) during step-by-step simulation: (a) loading with gravity (Step 1), (b) resetting displacements (Step 2), and (c) coal extraction in 815 and 817 longwall panels (Step 3).
Applsci 15 04302 g007
Figure 8. Evolution of vertical stresses (Pa) during step-by-step simulation: (a) loading with gravity (Step 1), and resetting displacements (Step 2), (b) coal extraction in 815 and 817 longwall panels (Step 3).
Applsci 15 04302 g008
Figure 9. Surface subsidence calculated according to MFEU 101.00159226.001-2003 [31] and the finite element method.
Applsci 15 04302 g009
Figure 10. The scheme of reading data from graphs.
Applsci 15 04302 g010
Figure 11. Position of monitoring lines in model.
Applsci 15 04302 g011
Figure 12. Vertical (a) and horizontal (b) displacements along the monitoring lines: 1—monitoring line 1; 2—monitoring line 2; and 3—monitoring line 3.
Applsci 15 04302 g012
Figure 13. Vertical (a) and horizontal (b) stresses along the monitoring lines: 1—monitoring line 1; 2—monitoring line 2; 3—monitoring line 3.
Applsci 15 04302 g013aApplsci 15 04302 g013b
Figure 14. Vertical (a) and horizontal (b) strains along the monitoring lines: 1—monitoring line 1; 2—monitoring line 2; and 3—monitoring line 3.
Applsci 15 04302 g014
Figure 15. Relationship between safety factors and probabilities of rock failure [32].
Applsci 15 04302 g015
Table 1. Summary of major water inrush incidents [2].
Coal Mine NameSudden Water TimeMaximum Surge Capacity (m3/h)Hydrogeological FeaturesImpact
Cuimu Mine20131300Water in the Yijun formation sandstone and Luohe formation sandstone aquifersDiscontinued
Guojiahe Coal Mine20162300Water in the Yijun formation sandstone and Luohe formation sandstone aquifersDiscontinued
Yuanzigou Coal Mine2019570Water in the Yijun formation sandstone and Luohe formation sandstone aquifersDiscontinued
Gaojiabao Coal Mine20153000Low river formation sandstone aquiferDiscontinued
Zhaojin Coal Mine2013 2016-Rock river formation sandstone fissure aquifer11 deaths
Yangliu Coal Mine2017-Water in the sandstone aquifer of the stone box formationPotential threats
Fangezhuang Coal Mine201660Hydraulic fracture zones, sandstone fracture-bearing aquifersNo impact
Daliu Coal Mine2013430Water-conducting fracture
zones, geological for-mations
Discontinued
Wanglou Coal Mine20131345.7Jurassic sand and conglomerate fissure aquiferDiscontinued
Lijialou Coal Mine20163158Water-conductive rift zoneDiscontinued
Shajihai Coal Mine2016-Water from the Headunhe formation aquifer, water from the Xishangyao formation medium-coarse sandstone aquiferDiscontinued
Shilawusu Coal Mine2018921.4Cretaceous Luohe formation sandstone aquiferDiscontinued
Table 2. Rock mass properties for numerical simulation.
E 1 , (GPa) E 2 , (GPa) E 3 , (GPa) ν 12 ν 23 ν 31 G 12 , (GPa) G 23 , (GPa) G 31 , (GPa)Density, kg/m3
Quaternary sediments
1.46.31.40.270.10.250.552.860.562000
Rock strata group #1
2.119.22.10.230.120.220.858.570.862350
Rock strata group #2
2.9242.90.230.120.221.1810.711.192550
Rock strata group #3
2.4519.22.450.230.120.221.008.571.002450
Rock strata group #4
2.622.82.60.230.120.221.0610.181.072500
Rock strata group #5
2.119.22.10.230.120.220.858.570.862350
Rock strata group #6
2.4519.22.450.230.120.221.008.571.002450
Table 3. Results of the calculation of semi-trough parameters [31].
Length of the Semi-Trough, mSubsidence, m
0.00−1.80524
62.00−1.78719
124.00−1.71498
186.00−1.55251
248.00−1.28172
310.00−0.90262
372.00−0.52352
434.00−0.25273
496.00−0.09026
558.00−0.01805
620.000
Table 4. Results of percentage error calculation.
Length of the Semi-Trough, mSubsidence According toAbsolute Error, mmPercentage Error, %
MFEU, mmFEM (Finite Element Method), mm
018001810−10−0.5556
5018001810−10−0.5556
1001792.51810−17.5−0.9763
1501772.51810−37.5−2.1157
2001742.21810−67.8−3.8916
25016991797.5−98.5−5.7975
3001639.21755.7−116.5−7.1071
3501557.61671.5−113.9−7.3125
4001443.81523.6−79.8−5.5271
4501280128000.0000
500991.91066−74.1−7.4705
550665.8809.1−143.3−21.5230
600403.5532.5−129−31.9703
650218.4305.3−86.9−39.7894
70098.6158.9−60.3−61.1562
75036.669.9−33.3−90.9836
8006.726.1−19.4−289.5522
Total18,948.320,046.1−1097.8
Table 5. Qualification of the inrush risk levels.
Inrush Risk LevelProbability of Failure, %Probability of Failure LevelAccident Risk Caused by Rock Failure
Low16.0–36.9Very lowAcceptable
Average37.0–57.9PossibleAcceptable in case of supervision and repetitive monitoring
High58.0–78.9ExpectableNonacceptable without regular control measures
Critical79.0–100.0Very expectableNonacceptable
Disclaimer/Publisher’s Note: The statements, opinions and data contained in all publications are solely those of the individual author(s) and contributor(s) and not of MDPI and/or the editor(s). MDPI and/or the editor(s) disclaim responsibility for any injury to people or property resulting from any ideas, methods, instructions or products referred to in the content.

