Article

A Multi-Scale Investigation of Sandy Red Clay Degradation Mechanisms During Wet–Dry Cycles and Their Implications for Slope Stability

1
Faculty of Land Resources Engineering, Kunming University of Science and Technology, Kunming 650093, China
2
Key Laboratory of Geohazard Forecast and Geoecological Restoration in Plateau Mountainous Area, Ministry of Natural Resources of China (MNR), Kunming 650093, China
3
Key Laboratory of Geohazard Forecast and Geoecological Restoration in Plateau Mountainous Area in Yunnan Province, Kunming 650093, China
4
Sinohydro Foundation Engineering Co., Ltd., Tianjin 301700, China
*
Authors to whom correspondence should be addressed.
Appl. Sci. 2025, 15(8), 4085; https://doi.org/10.3390/app15084085
Submission received: 4 March 2025 / Revised: 24 March 2025 / Accepted: 4 April 2025 / Published: 8 April 2025

Abstract

:
Sandy red clay, abundant in clay minerals, exhibits a marked sensitivity to variations in water content. Several of its properties are highly prone to deterioration due to wet–dry cycling, potentially leading to slope instability. To investigate the multi-scale deterioration patterns and the underlying chain mechanism of sandy red clay subjected to wet–dry cycles, this study conducted systematic tests on remolded sandy red clay specimens through 0 to 5 wet–dry cycles, with the number of cycles (N) as the variable. The study’s results indicated the following, under wet–dry cycling: (1) Regarding the expansion and shrinking properties, the absolute expansion rate (δa) progressively increased, whereas the absolute shrinkage rate (ηa) gradually decreased. Concurrently, the relative expansion rate (δr) and relative shrinkage rate (ηr) gradually declined. (2) At the microscale, wet–dry cycles induced significant changes in the microstructure, characterized by increased particle rounding, disrupted stacked aggregates, altered inter-particle contacts, enlarged and interconnected pores, increased number of pores, and a reduction in clay mineral content. (3) At the mesoscale, cracks initiated and propagated. The evolution of cracks undergoes stages of initiation stage, propagation stage, and stable stage, and with the crack rate increasing to 2.0% after five cycles. (4) At the macroscale, the shear strength exhibited a continuous decline. After five cycles, cohesion decreased by as much as 49.6%, whereas the internal friction angle only decreased by 4.3%. This indicates that the loss of cohesion was the primary factor contributing to the strength deterioration. (5) A 19.4% decrease in the slope factor of safety (Fv) occurred after five cycles. This reduction was primarily attributed to the decrease in material cohesion and the upward shift in the potential sliding surface. Under the influence of wet–dry cycles, slope failures typically transitioned from overall or deep sliding to localized or shallow sliding.

1. Introduction

Sandy red clay is mostly formed by the coupling of weathering and slope deposition processes, and exhibits widespread distribution across mountain slopes and intermontane basin systems. This type of soil has unique characteristics of particle grading and mineral components, and its mechanical strength and water-holding properties are relatively weak, while the permeability coefficient is relatively large compared with that of ordinary clay [1]. In the process of rainfall, sandy rad clay areas show more significant advantages of rapid infiltration, and at the same time, due to the smaller specific heat capacity of its sand component, water is more likely to evaporate quickly under the action of solar radiation. This coupled mechanism of rapid wet–dry cycle driven by rainfall evaporation leads to the rapid development of cracks. As a result, the characteristics of sandy red clay are particularly degraded under wet–dry cycling conditions and are highly susceptible to geologic hazards such as landslides.
Sandy red clay is extensively distributed across Asia, South America, and Africa, and finds significant application in diverse engineering projects, including foundation works, roadbed construction, and reservoir development [2,3]. Yunnan Province serves as the core distribution region of sandy red clay in Asia, establishing itself as the benchmark sampling source for global red clay investigations and exhibiting representative properties. Simultaneously, Yunnan is characterized by a typical tropical–subtropical monsoon climate, featuring distinct dry and rainy seasons with concurrent intense rainfall and high temperatures. Under these climatic conditions, geological hazards induced by wet–dry cycles in Yunnan exhibit notably high frequencies and significant destructive potentials [4,5]. Consequently, selecting Yunnan’s sandy red clay as the research focus not only encapsulates typical geological-climatic coupling dynamics but also offers a critical lens for elucidating soil deterioration mechanisms under wet–dry cycle stresses, with substantial practical implications for engineering design and maintenance in comparable regions.
The deterioration of engineering materials caused by wet–dry cycles has become a significant research focus in recent years. Numerous studies have systematically investigated the degradation characteristics of engineering materials under wet–dry cycles across different scales, yielding valuable insights and results. As a crucial characteristic of geotechnical materials, the expansion and contraction behavior has been extensively studied by numerous scholars. It is generally acknowledged that the deformation resulting from expansion and contraction tends to stabilize after numerous wet–dry cycles. However, prior to reaching this stable state, the specific pattern of deformation variation with respect to N remains inconsistent or even contradictory. For example, Pejon et al. [6] and Estabragh et al. [7] reported that the deformation due to expansion and contraction increases with an increase in N. Conversely, Basma et al. [8] and Guo et al. [9] argued that this deformation decreases with an increase in N. Furthermore, Tang et al. [10] observed a trend of initial increase followed by a decrease in deformation due to expansions and contractions, as N escalated. The primary factors contributing to these discrepancies include variations in the loading conditions of the tests, methodologies employed for wet–dry cycling, mineralogical compositions of the specimens, and degrees of compaction.
The microscale characteristics of soil primarily pertain to the microstructure and chemical components, encompassing physical attributes such as pore shape, pore abundance, particle morphology, arrangement, and contact mode, alongside chemical attributes such as mineral composition and content. In fact, there is a comprehensive study on the impact of wet–dry cycles on soil microstructure. Soil microstructure is defined as the spatial arrangement of soil particles and pores [11]. Xu et al. [12] used scanning electron microscopy (SEM) images to observe the microstructure and reported that the particle skeleton became progressively looser with N increasing. They also quantified pore characteristics from the images, revealing a greater development of pores in both number and diameter. In addition, Chen et al. [13], Niu et al. [14], Zhang et al. [15], and Ni et al. [16] employed comparable methods and reached similar conclusions. These studies validate the feasibility of using SEM for qualitative observation of microstructure. However, in fact, the cleavage effect of wet–dry cycling at the micro level is not only confined to the microstructure but also extends to the mineral composition. Surprisingly, the impact on the mineral composition has rarely been investigated under wet–dry cycles in this context.
Wet–dry cycles not only induce changes in the soil microstructure, but also lead to the formation of numerous mesoscale cracks that are visible to the naked eye. The initiation and propagation of these cracks progressively compromise the overall structural integrity of the soil. Investigating the formation and evolution of soil cracks is therefore essential. Currently, numerous studies have also investigated the crack propagation mechanisms under cyclic wetting and drying conditions. Xie et al. [17] used digital photography and image processing to extract surface crack parameters under varying N and analyzed the patterns of crack development. The results indicate that cyclic wetting and drying induce the formation and propagation of cracks, with the mid-term stage of the cycle exerting a greater influence on crack propagation. In addition, Liu et al. [18] and Zai [19] utilized computed tomography (CT) to extract crack parameters and provided a new method for crack analysis. Currently, the mainstream approach for extracting crack characteristics involves acquiring crack images using digital photography, followed by the extraction of characteristic parameters through image processing [20,21].
At the macroscale, shear strength indices represent critical parameters in slope stability analysis. Yun et al. [22] and Gu et al. [23] employed different testing methods to investigate the mechanical properties of engineering materials, and the results demonstrated that mechanical strength deteriorates progressively with an increasing N. In addition, numerous scholars have discovered that wet–dry cycles exert an influence on compressive strength [24], fracture toughness [25], and permeability [26].
In summary, the following methods have been used to study the deterioration characteristics of soils under wet–dry cycles: (i) damage assessment at the expansion and contraction properties, based on axial strain; (ii) damage assessment at the microscale, based on microstructural characteristics and pore properties; (iii) damage assessment at the mesoscale, based on the analysis of crack parameters; (iv) damage assessment at the macroscale, based on experimentally derived physical parameters. On the one hand, numerous scholars tend to concentrate exclusively on one or two aspects in their research, resulting in a limited research perspective, a dearth of multi-scale investigations, and inadequate attention to the degradation mechanisms influenced by alterations in mineral composition. On the other hand, weak correlations exist among the test results acquired at different scales, and a direct linkage mechanism to bridge test results across scales is absent. Although the above studies have enhanced and advanced methods for evaluating the deterioration characteristics of engineering materials, most studies continue to focus on common clay specimens, and the research on the deterioration characteristics and mechanisms of sandy red clay under wet–dry cycle conditions remains limited and lacks comprehensiveness. The majority of research remains at the theoretical level, failing to translate the research results into engineering applications. Therefore, finding how to determine the evolution characteristics of sandy red clay across micro-, meso-, and macro-scales and elucidate the structural damage mechanisms influenced by environmental effects is critical to understanding and addressing the frequent engineering challenges posed by wet–dry cycles.
Against this background, the underlying mechanistic chain of sandy red clay exposed to wet–dry cycles, this study carried out systematic tests on remolded sandy red clay specimens over 0 to 5 wet–dry cycles, with the N serving as the variable and utilizing the typical sandy red clay from Yunnan, China, as the research subject. The microstructure and mineralogical evolution were analyzed using scanning electron microscopy and X-ray diffraction (XRD) analyses. Crack development was quantitatively assessed with the aid of image processing technology. Mechanical parameters were measured via direct shear tests, and the stability evolution of typical slopes was evaluated based on the strength reduction method (SRM). This study reveals the multi-scale degradation law and chain mechanism of induced by wet–dry cycles in sandy red clay, which can provide the theoretical tools and practical technologies needed for the precise diagnosis, dynamic prevention, and control of long-term maintenance of slope engineering.

2. Experimental Materials and Methods

2.1. Experimental Materials and Preparation

The sandy red clay used in the experiments was sourced from Yunnan Province, China. The samples, collected from a depth of 4 to 6 m below the surface, exhibited a brownish-red appearance and a high degree of weathering. Immediately after sampling, the samples were wrapped in cling film and transported to the laboratory. Subsequently, the collected soil samples were then subjected to laboratory geotechnical tests to analyze their physical properties. The physical properties of the soil, as determined from the tests, are presented in Table 1.
An appropriate amount of the soil was placed on a tray and then dried in a drying oven at a constant temperature of 105 ± 5 °C for 24 h under forced-air drying conditions. After drying, it was passed through a 2 mm sieve to remove plant roots, gravel, and other impurities. To ensure that the remolded sample aligned with the actual project conditions, we decided to remold it according to a natural water content of 18.1% and a natural density of 2.03 g/cm3. After preparation, the samples were tightly wrapped in plastic wrap and statically cured for 24 h to ensure adequate moisture distribution. Based on the calibrated dry density, we used the layered static pressure method to layer compaction samples of ring knife specimens with an inner diameter of 61.8 mm and a height of 20.0 mm. The specimens were considered to meet the experimental requirements when the actual water content and dry density of the remolded samples deviated by no more than 5% from the predetermined values. After measuring the actual sample, we found that the sample had a water content of 17.9%, an average density of 2.00 g/cm3, and a dry density of 1.70 g/cm3, which met the experimental requirements.

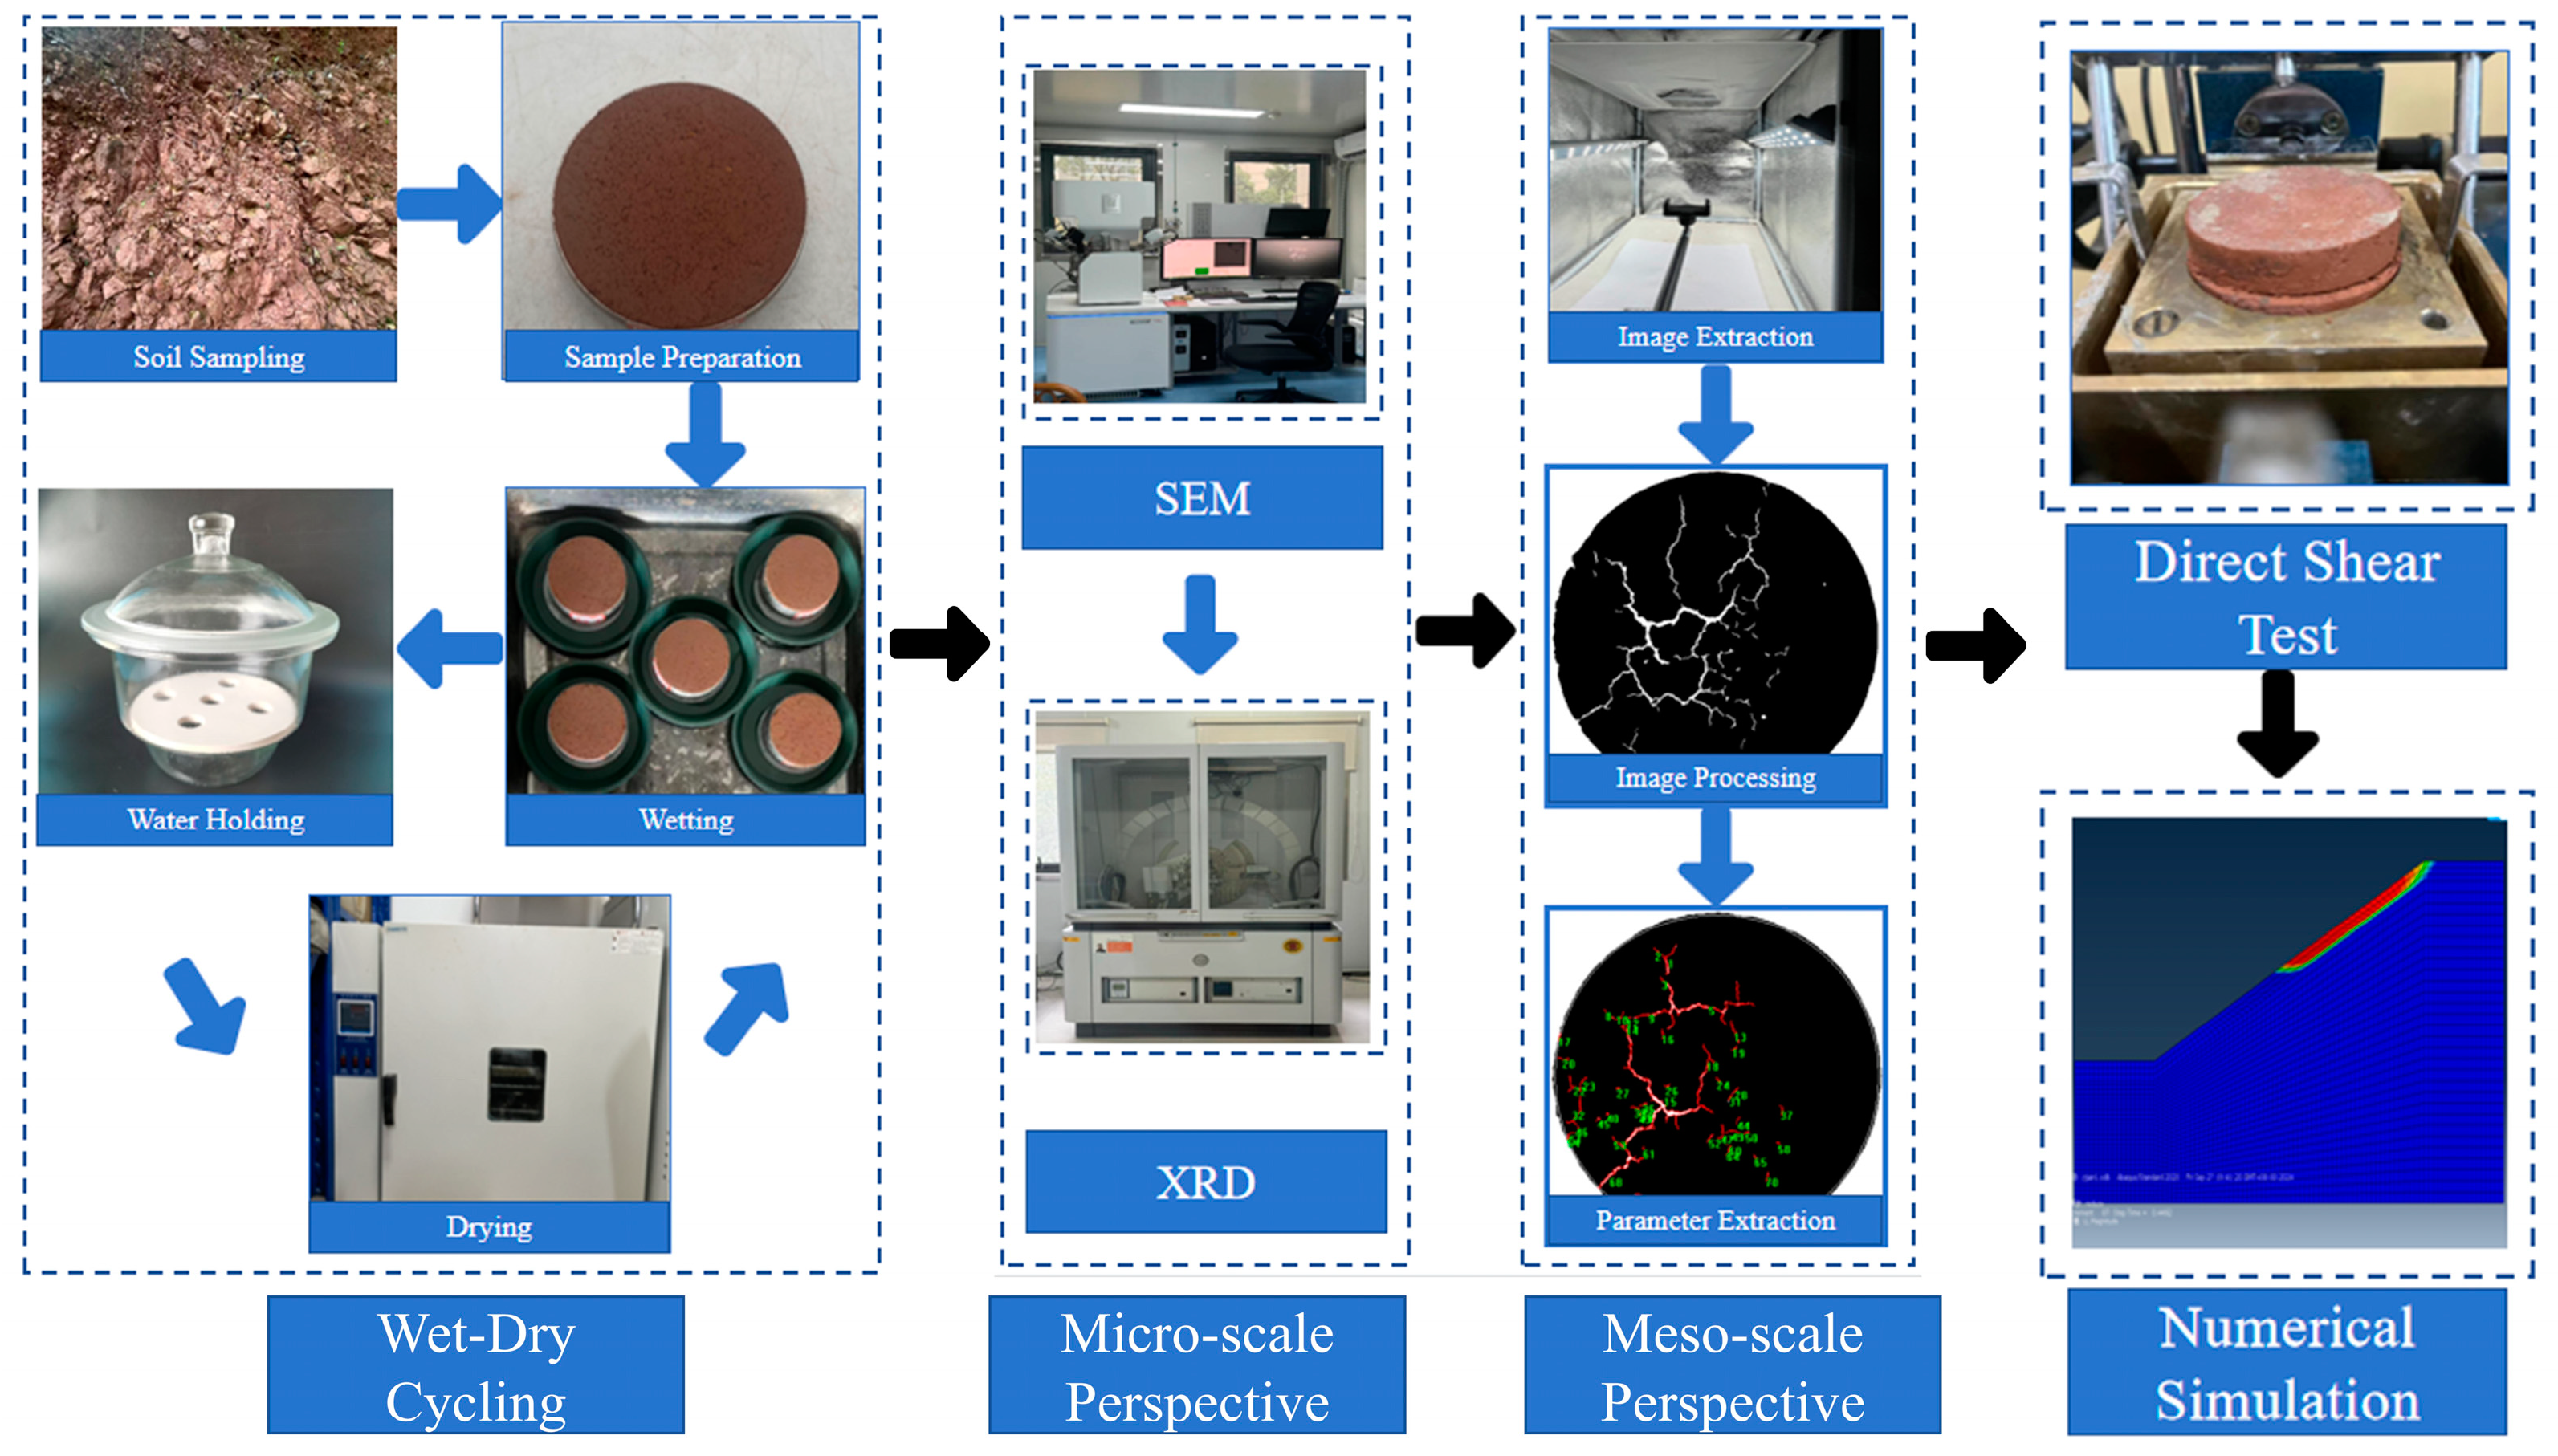
2.2. Experimental Methods and Procedures

Building on our foundational investigations of geotechnical properties, this study extends its scope to include a series of advanced experiments under wet–dry cycling conditions. These include pore characteristic tests, crack development tests, direct shear tests, SEMs, and XRDs. By integrating fundamental theoretical knowledge with advanced image processing and analysis techniques, a hierarchical analysis was performed to elucidate the changes in expansion and contraction performance, micro-mineralogical and structural evolution, microscale crack development, and macro-mechanical property degradation of remolded sandy red clay samples subjected to wet–dry cycles. Furthermore, a comprehensive, cross-scale analysis was performed to explore the degradation mechanisms at the micro-, meso-, and macro-scales under wet–dry cycling. To assess the practical implications, engineering case studies were incorporated to quantify the impact of multi-scale degradation induced by wet–dry cycling on slope stability. The experimental procedures and equipment used are outlined in Figure 1.

2.3. Wet–Dry Cycle Scheme

According to previous studies [27,28], certain properties of remolded soil stabilize after undergoing three wet–dry cycles. Therefore, the maximum number of cycles, N, was set at five. The experimental design comprised six groups, with each group consisting of five replicate specimens. Four specimens from each group underwent direct shear testing, while one was reserved for SEM and XRD analysis. All ring-shaped specimens were prepared simultaneously. The experiment employed a method of immersion saturation to a constant mass, followed by air-drying to a constant mass for the wet–dry cycles. Xie et al. [29] demonstrated that the wet–dry cycling path exerts a more pronounced influence on the strength properties of soil, specifically observing a significant deterioration in various mechanical properties when the clay was subjected to wetting followed by drying, compared to drying followed by wetting. Therefore, the sequence of wet–dry cycles in this study involved saturation, followed by water retention, and finally drying. The water content of the specimens and the duration of wet–dry cycles during the experiments are illustrated in Figure 2. At each wet–dry cycle stage, the mass and volume parameters of each specimen were meticulously measured and recorded. The water used in the experiments was distilled and had undergone vacuum treatment. According to the investigation, the 30-year average annual temperature in the study area is 19.6 °C, and the extreme high temperature in summer can exceed 40 °C. The average rainfall can be up to 2383.2 mm, and the average annual sunshine time is more than 2200 h. We have designed the following wet–dry cycle scheme based on climate conditions.
Wetting Process: The ring knife sample was placed in a container and maintained for 12 h. Afterward, the sample was removed hourly, and the surface water was blotted with absorbent paper prior to weighing. The wetting process was considered complete when the weight change between two consecutive weightings did not exceed 1.0%.
Water Holding Process: The water retention process was incorporated into the wet–dry cycling test to ensure complete water migration within the sample and to reduce any experimental biases resulting from uneven water distribution. The fully saturated ring knife sample was then placed in a heat-insulating and moisture-proof glass jar and allowed to stand for 12 h, thereby completing one water retention cycle.
Drying Process: Based on local historical meteorological data, a constant temperature of 40 °C was chosen to dry the samples. The ring knife sample, which had undergone water retention for 12 h, was removed from the heat-insulating and moisture-proof glass jar and placed in a blast-drying oven maintained at a constant temperature of 40 ± 5 °C. The sample was subsequently removed hourly for weighting after drying for 24 h. The drying process was considered complete when the weight change between two consecutive weightings did not exceed 1.0%.

3. Damage Characteristics

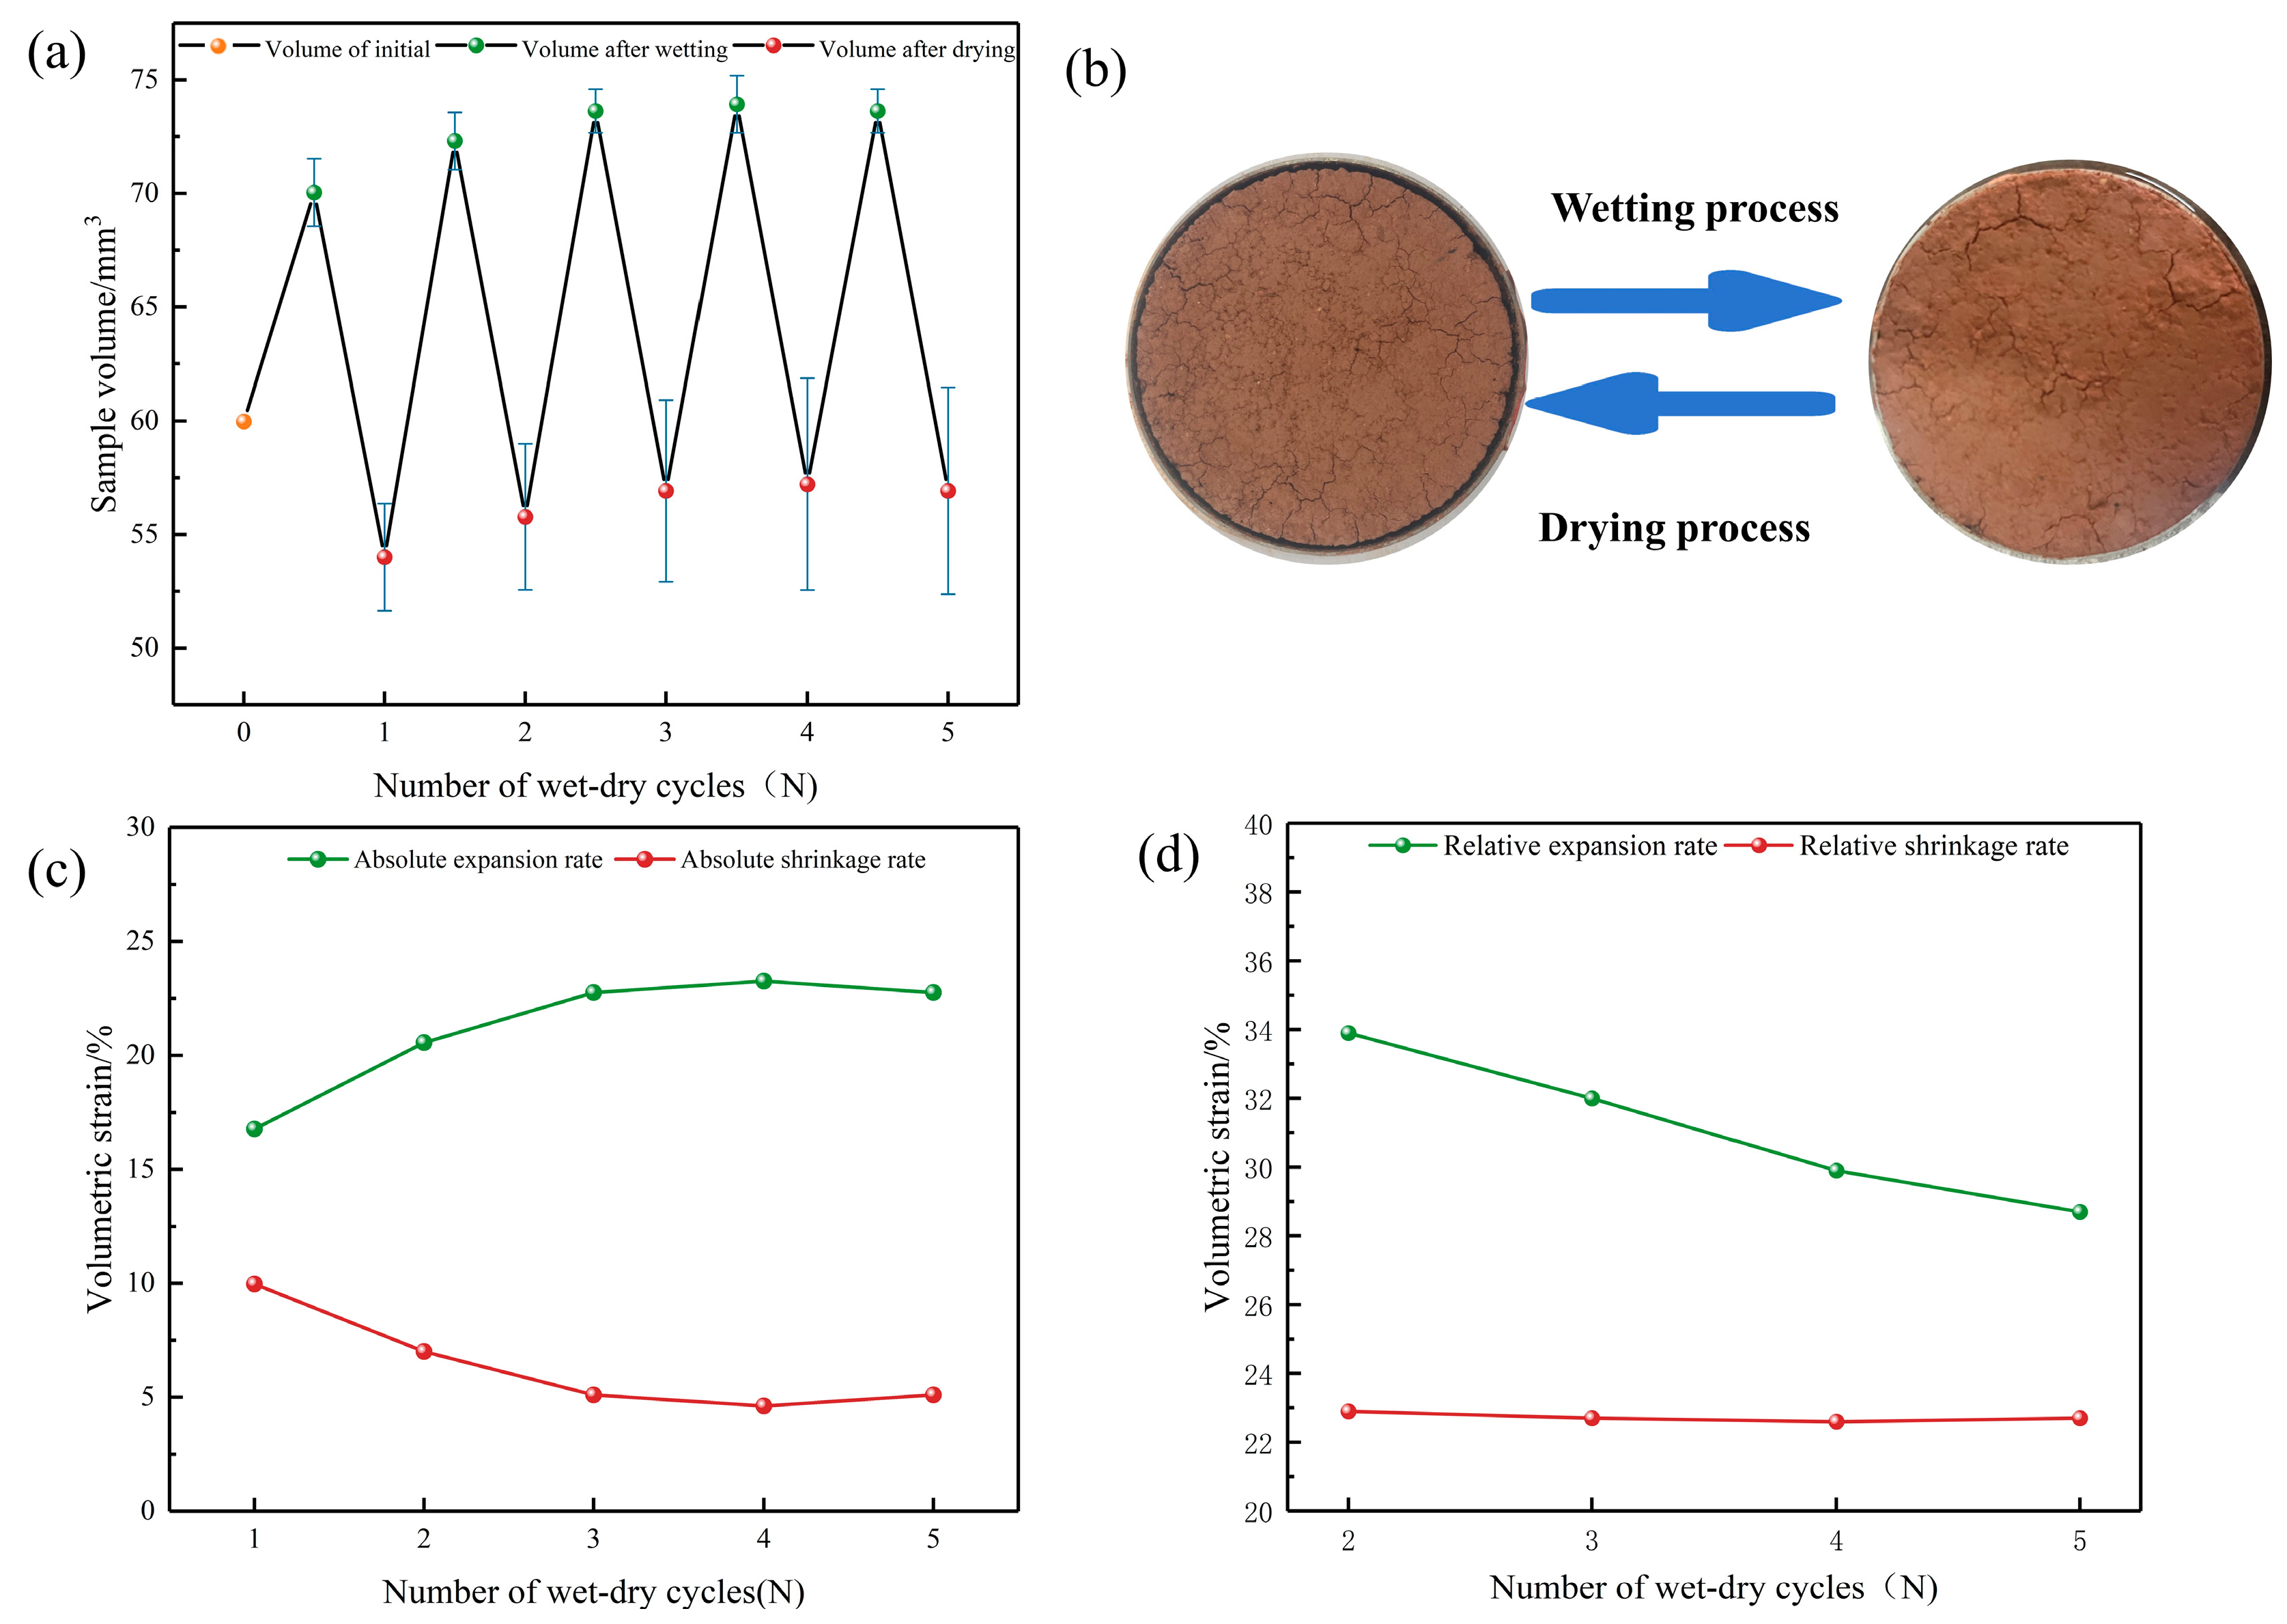
3.1. Expansion and Shrinkage Properties

The volumetric changes exhibited by specimens subjected to dry–wet cycling have been a central focus of research. As depicted in Figure 3a, there is some dispersion in the change in volume from one specimen to another. There are no exceptions that the specimen’s volume undergoes continuous alteration throughout the wet–dry cycles, wherein the expansion after wetting results in volumetric increments and the contraction after drying lead to volumetric decrement. The volumetric change in the specimen is pronounced during the initial wet–dry cycle, whereas the observed volumetric change becomes negligible after the third cycle. In previous studies, the volume change during wet–dry cycling has typically been expressed using axial strain [30,31]. However, a notable disadvantage of this approach is that axial strain solely describes the height change in the specimen. Figure 3b clearly demonstrates the presence of a significant annular gap between the specimen and the ring knife, indicating lateral expansion and contraction of the specimen during wet–dry cycling. Consequently, δa and ηa emerge as more suitable metrics to describe the specimen’s volume change behavior. They are used to represent the cumulative rate of change in sample volume relative to the initial, untreated sample volume (V0) during the testing process. The calculation formula is as follows:
δ a = V W ( i ) V 0 V 0 × 100 %
η a = V 0 V d ( i ) V 0 × 100 %
In the aforementioned formulae, δa represents the absolute expansion rate (%); ηa the absolute shrinkage rate (%); V0 the volume of the initial state specimen (mm3); Vw(i) the volume of the specimen after wetting in the ith cycle (mm3); Vd(i) the volume of the specimen after drying in the ith cycle (mm3). During the data calculation and processing, the following considerations were accounted for: ① The tool used in this study to measure the volumetric parameters was a vernier caliper with an accuracy of 0.02 mm. ② For the specimen after wetting, we assumed the diameter of the sample is consistent with the diameter of the ring cutter, which was 61.8 mm, and the height of the specimen was measured accurately using vernier calipers. ③ For the specimen after drying, their diameter and height are measured accurately with vernier calipers. ④ The accurate determination of the height and diameter of each sample necessitates performing at least three parallel measurements across diverse locations. Subsequently, the arithmetic mean of these measurements is utilized to count the volume of the sample. ⑤ The volume of the sample is taken as the average of all sample volumes, but those that deviate significantly from the others need to be excluded.
δa and ηa quantify the extent of cumulative expansion and cumulative contraction, as well as their patterns of change, across the wet–dry cycles. These indices serve as indicators of the volume change in the specimen throughout the wet–dry cycles. Figure 3c illustrates the variation trend of δa and ηa with respect to N. It is evident that during the wetting process, as N increases, δa gradually rises, with the rate of increase diminishing progressively, ultimately stabilizing after the third wet–dry cycle. During the drying process, as N increases, ηa gradually declines, with the rate of decrease diminishing progressively, ultimately reaching stabilization after the third wet–dry cycle. It is notable that the specimen undergoes significant expansion during the wetting phase, leading to a volume of the specimen after wetting (Vw) that consistently surpasses V0. The gradual increase in δa signifies a corresponding gradual increase in Vw. During the drying phase, the specimen undergoes contraction, leading to a volume of the specimen after drying (Vd) that is consistently smaller than V0. Consequently, despite the gradual decrease in ηa, it implies a gradual increase in Vd. Which aligns with the observations made by Pejon [5] and Estabragh [6].
On the one hand, the δa and ηa solely characterize the overall wet–dry cycling process in terms of the test’s expansion and contraction. It fails to specifically delineate the expansion and contraction degree, as well as its pattern of change, within a single cycle of the specimen. On the other hand, the amounts of expansion and contraction vary across each wet–dry cycle, suggesting that the deformation of the specimen after each cycle is not fully reversible. Consequently, assessing the deformation due to expansion and contraction during wet and dry cycling cannot solely rely on the specimen’s initial volume. Therefore, the introduction of δr and ηr is necessary to provide a more nuanced understanding of the specimen’s deformation behavior. δr represents the rate of change in volume after expansion during the ith wet–dry cycle, relative to the volume before expansion. ηr represents the rate of change in volume after contraction during the ith wet–dry cycle, relative to the volume before contraction. The calculation formula is as follows:
δ r = V w ( i ) V d ( i 1 ) V d ( i 1 ) × 100 %
η r = V w ( i ) V d ( i ) V w ( i ) × 100 %
In the aforementioned formulae, δr represents the relative expansion rate (%); ηr the relative shrinkage rate (%). δr and ηr of the first wet–dry cycle cannot be calculated.
δr and ηr quantify the degree of expansion and contraction, as well as their changing patterns, of the specimen during a specific wet–dry cycle. These indices reflect the differences in the expansion and contraction properties of the specimens after different numbers of wet–dry cycles. As illustrated in Figure 3d, as N increases, the δr and ηr values of the specimens exhibit an overall decreasing trend. This indicates that the expansion and contraction properties of the specimens degrade over successive wet–dry cycles. However, the responses of δr and ηr to wet–dry cycling differ. Specifically, δr is more sensitive to wet–dry cycling, whereas the impact on ηr is less pronounced. This suggests that dry and wet cycling has a greater influence on expansion deformation than on shrinkage deformation. This finding aligns somewhat with the results reported in Tang’s study [9].

3.2. Microscale Damage

The microscale characteristics of soil primarily pertain to the fundamental properties of pores and particles, encompassing physical attributes such as pore shape, pore abundance, particle morphology, arrangement, and contact mode, alongside chemical attributes such as mineral composition and content.

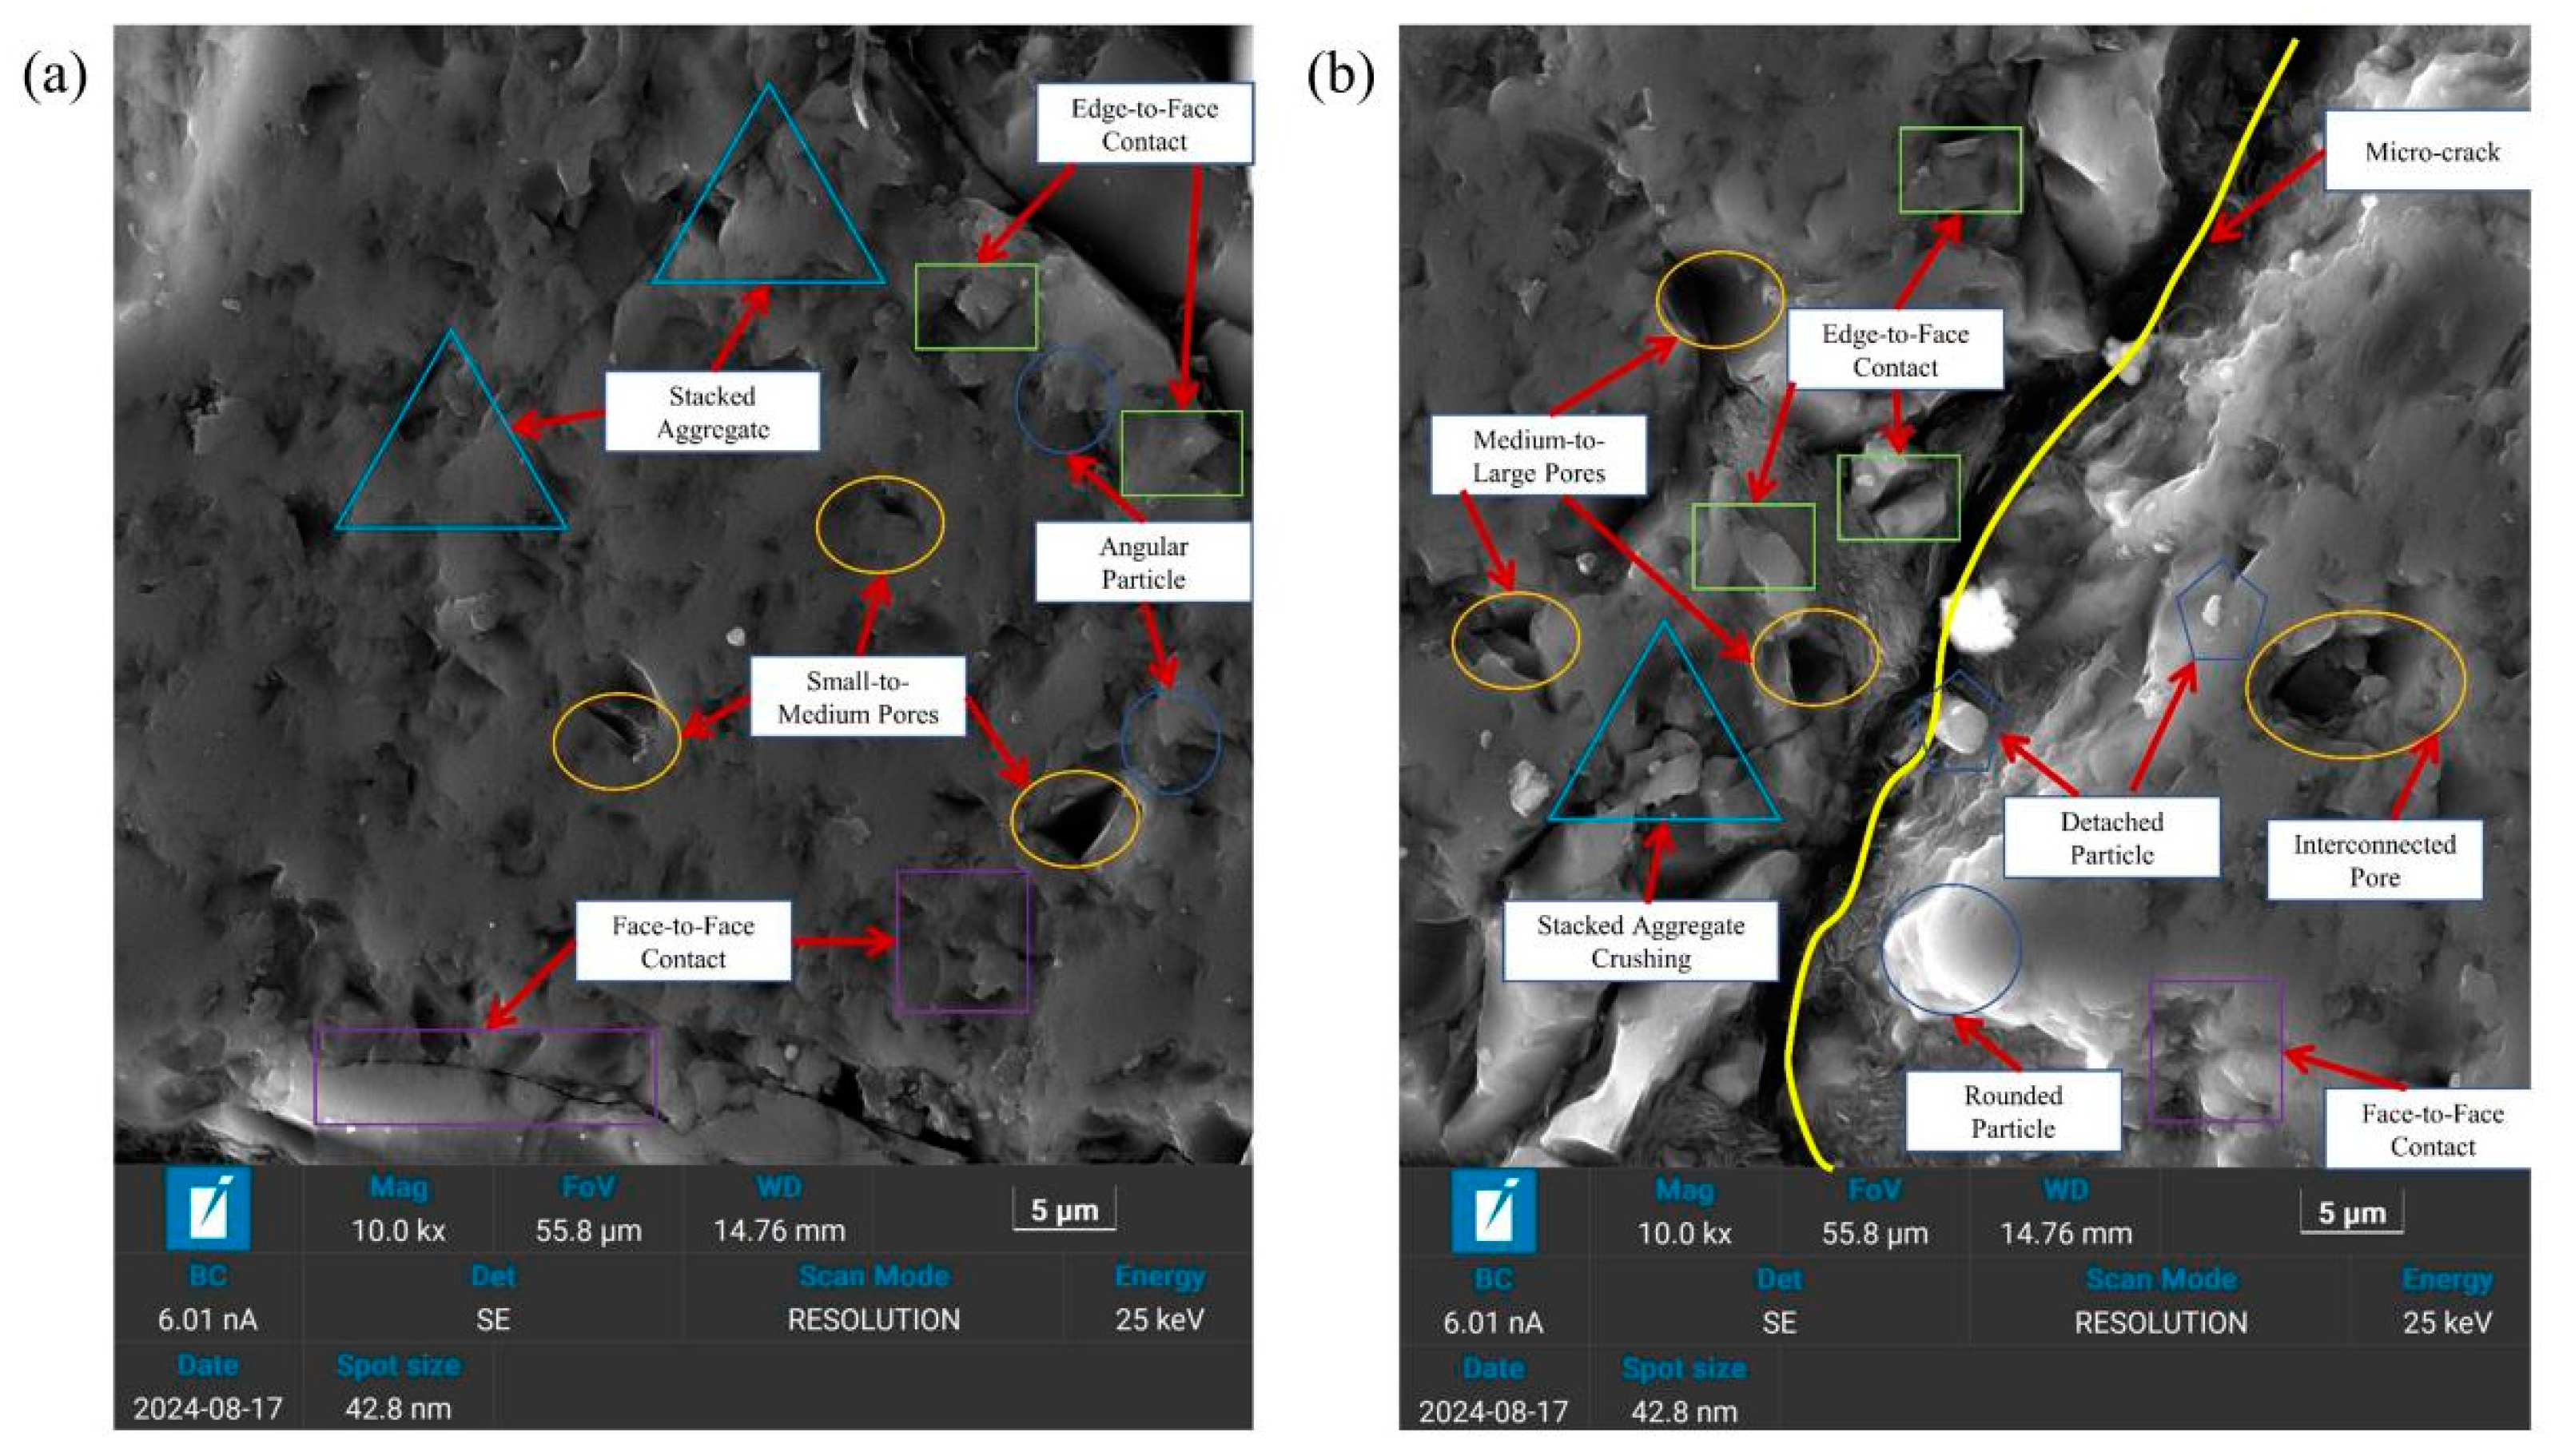
3.2.1. Microscale Physical Damage

SEM technology stands as one of the most widely used and practical approaches for investigating the microscale characteristics of geomaterials. The fundamental principle of SEM is acquiring surface morphology images at the microscale by employing electronic signal imaging techniques. SEM experiments were performed on both untreated samples (N = 0) and samples subjected to wet–dry cycling (N = 5) for the acquisition of SEM images. Figure 4 presents the SEM images, where Figure 4a corresponds to the image at N = 0 and Figure 4b represents the image at N = 5. The qualitative analysis of representative SEM images reveals that prior to wet–dry cycling, the microstructure of the samples predominantly existed as stacked aggregates, accompanied by a minor quantity of slightly elevated mineral particles adhering to the surface. The particles are tightly bound, primarily through face-to-face and edge-to-face contacts, with a limited number of pores, mostly small- to medium-sized, and fewer large pores. The pore connectivity is poor, exhibiting minimal development of microscale crack. The edges and corners of the particles exhibit relative sharpness, with low roundness. The structure within the field of view is relatively compact and sturdy.
However, following five cycles of wet–dry cycling, the microstructure of the soil changed significantly. These changes include, among others, the following: the original dense structure of the soil is disrupted, and the particles undergo severe damage, including fragmentation and detachment. The morphology of the aggregates undergoes alteration. Stacked aggregate breakage is accompanied by an increase in edge-to-face contacts and a decrease in face-to-face contacts between particles. The pore size within the samples increases, with enhanced pore connectivity and the formation of microscale crack. The edges and corners of the particles transition to a relatively rounded state, improving roundness. The structure within the visual field transitions to a looser configuration.

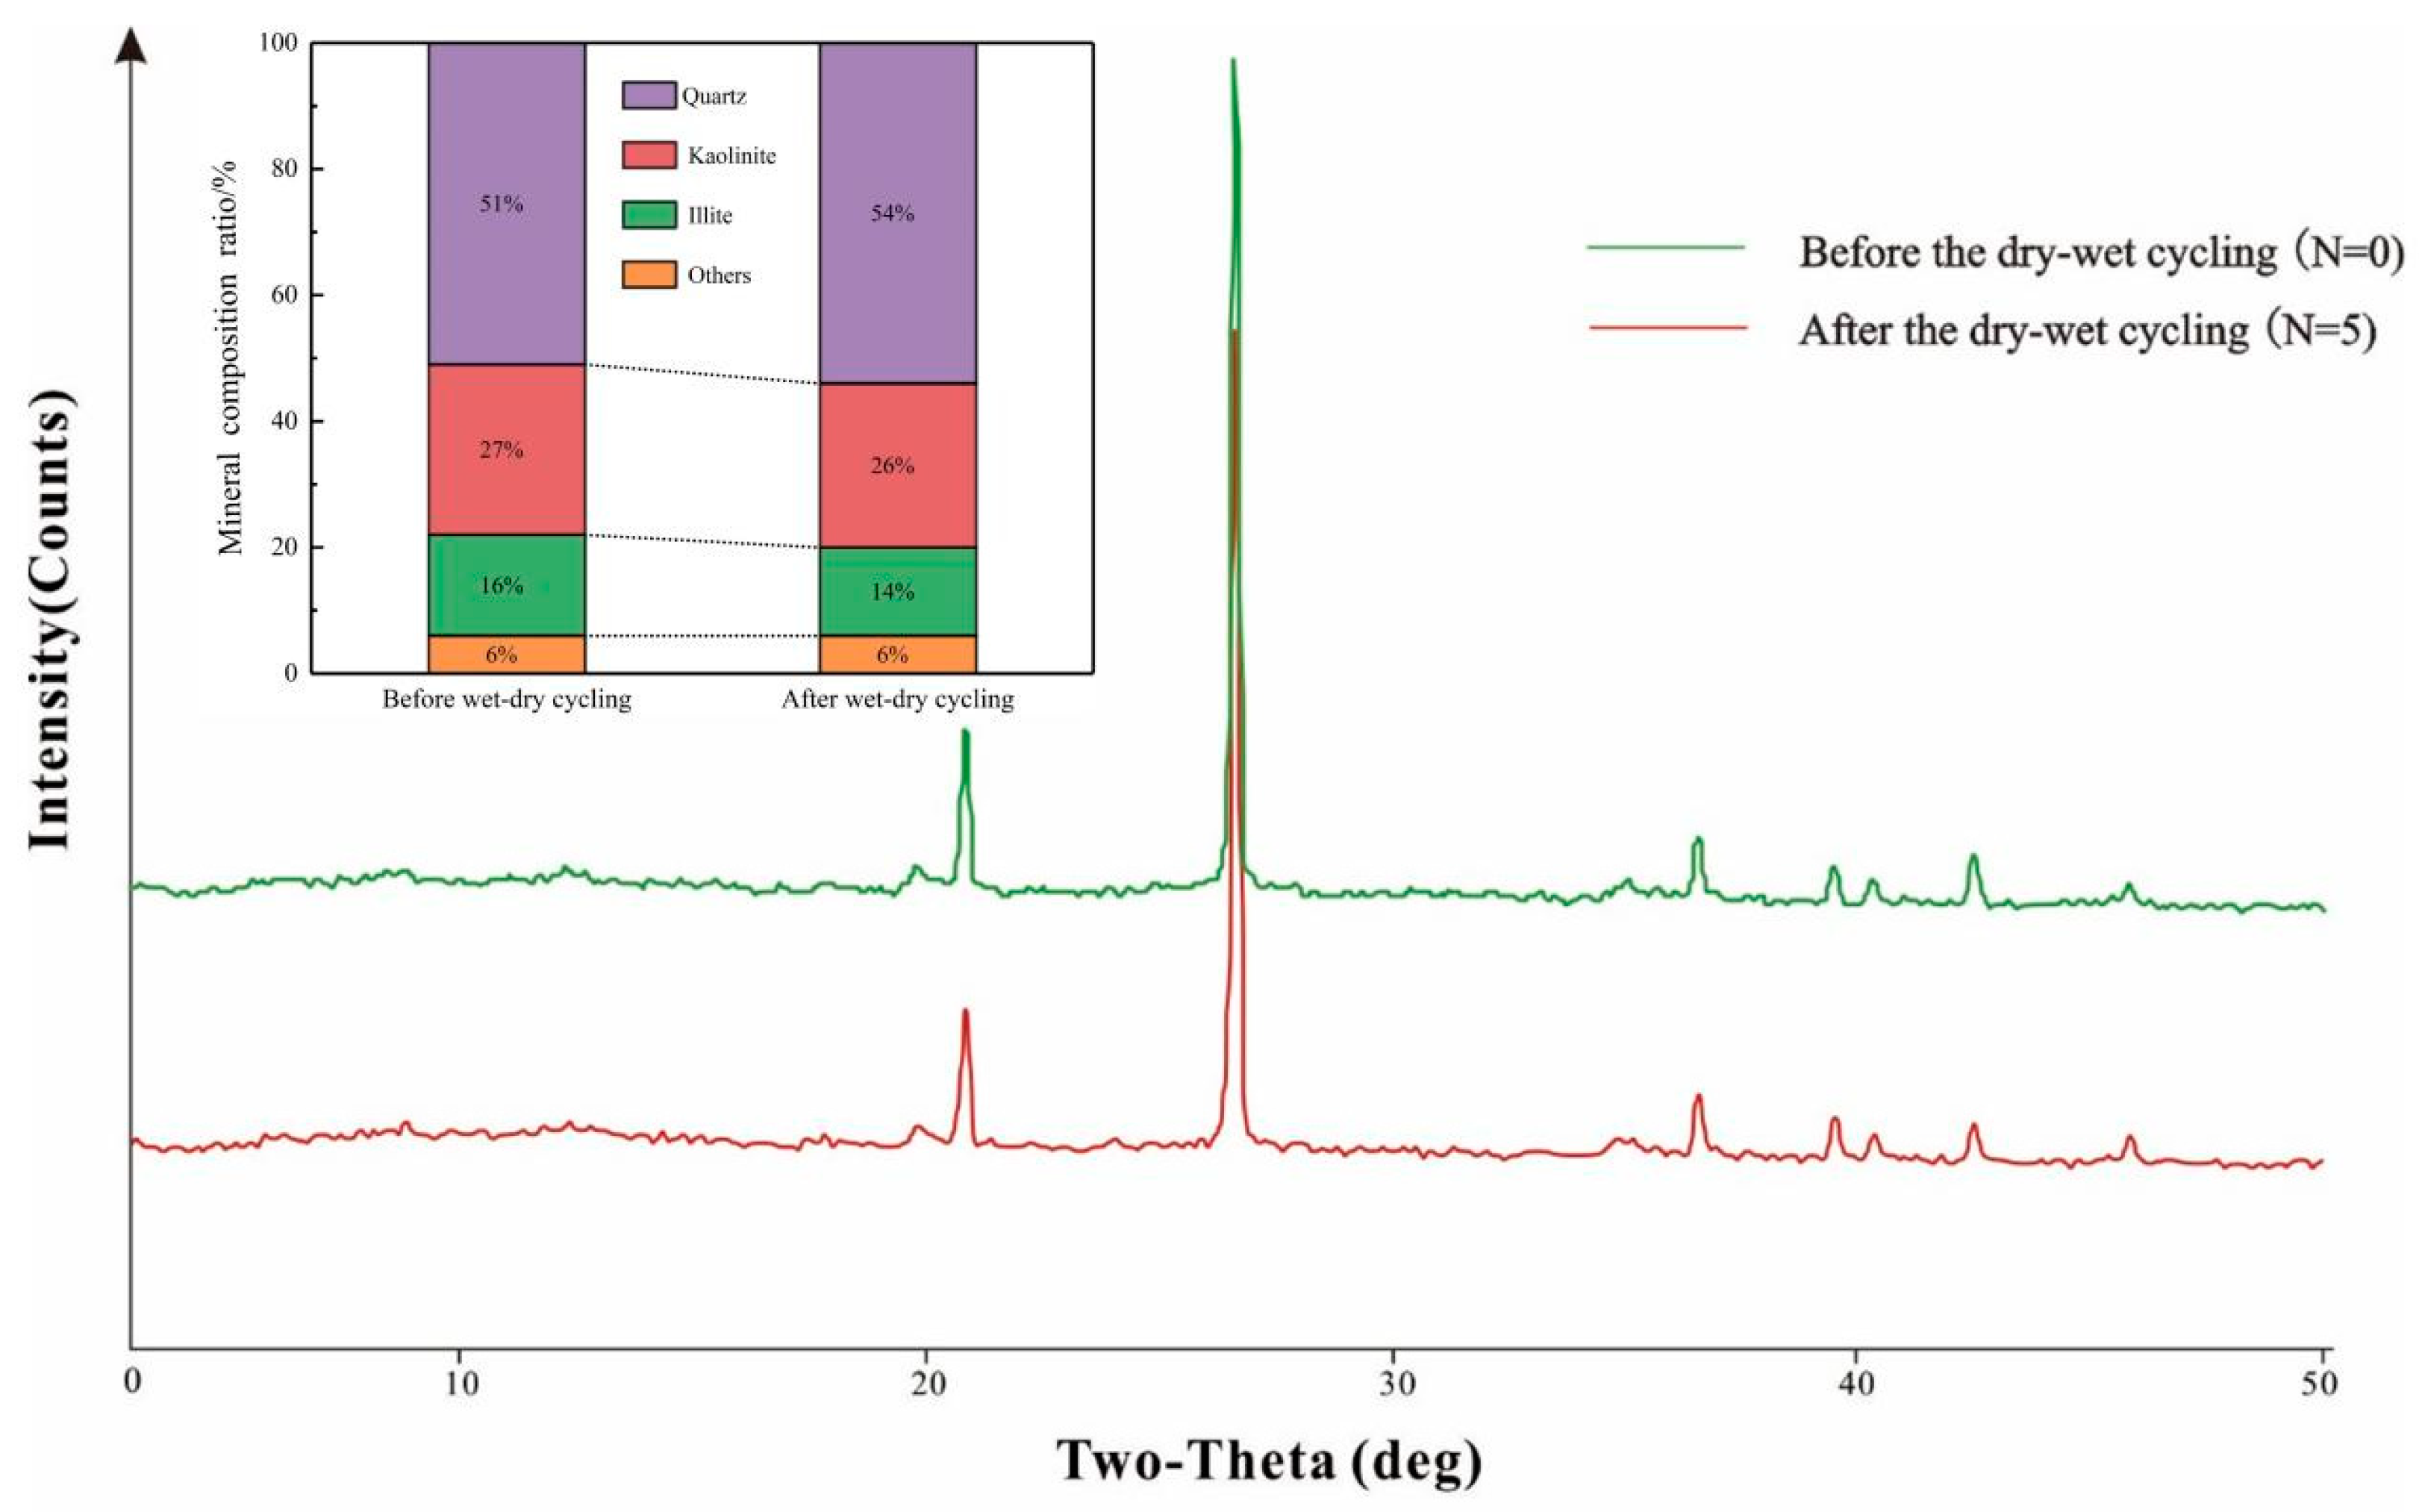
3.2.2. Microscale Chemical Damage

An analysis of the XRD and XRF patterns was conducted on sandy red clay samples, both before and after wet–dry cycling, reveals that the primary mineral components are quartz, kaolinite, illite, and hematite. As Figure 5 shows, the quartz content exceeds 50%. Clay minerals, predominantly kaolinite and illite, account for over 40% of the sample composition. The remaining minerals, primarily hematite, comprise less than 10% of the sample. No emergence of new diffraction peaks is observed in the XRD patterns throughout the wet–dry cycling process, indicating that wet–dry cycling does not induce the formation of new mineral components.
Wet-dry cycles lead to a reduction in the proportions of kaolinite and illite present in the samples, whereas the proportion of quartz increases, leaving the proportions of other minerals predominantly unaltered. This suggests a pronounced hydration-weakening effect on the clay minerals, resulting in their continual depletion upon interaction with water, causing their content to diminish from 43% to 40%. The rate of mineral depletion in the samples reveals that illite (12.5%) undergoes a more significant reduction compared to kaolinite (3.7%), indicating that despite kaolinite’s greater abundance in sandy red clay relative to illite, illite undergoes a more pronounced hydration weakening during water–rock interactions. Quartz and hematite demonstrate robust resistance to hydrolysis, consequently exhibiting negligible alterations in their content throughout the wet–dry cycling process. However, the depletion of clay minerals leads to an increase in the proportion of quartz, causing its content to escalate from 51% to 54%. Other minerals, predominantly hematite, remain predominantly unaltered in proportion owing to their low content.

3.3. Mesoscale Damage

The characteristics of cracks in the soil are one of the main manifestations of the mesoscale properties of the soil. They represent a type of characteristic that lies between the macro- and micro- scales. Utilizing high-definition photographs to extract crack data is economically advantageous. The processing steps for this method are shown in Figure 6.
(i) Image Extraction: Due to the tendency of sandy red clay to swell upon water absorption and shrink during dehydration, cracks gradually close during the humidification process [32]. Therefore, crack images are extracted only after the sample has been completely desiccated. Following each complete dehydration cycle, the upper surface of the sample is photographed, recorded, and analyzed. During the photographic process, the sample is positioned within an lightbox. A digital camera, securely mounted on an iron stand, is positioned approximately 10 cm above the center of the ring sample. All ambient light sources are excluded, and the upper surface of the sample is captured solely under light illumination within the light-box. The pixel resolution and focal length are maintained consistently across all photographs.
(ii) Image Processing: The detailed procedure is outlined as follows: The original image was first imported into Adobe Photoshop 2020 (PS) for initial processing, the goal of this step was to crop the image along its borders to extract the sample section. The cropped image was then imported into Matlab, where it was converted to grayscale. Subsequently, the grayscale image underwent several processes, including grayscale correction, initial denoising, image sharpening, and grayscale inversion. The processed grayscale image was binarized, and filtering methods were applied to remove small noise points, resulting in a cleaner image. Finally, the cracks within the image were connected, and image closing and deburring operations were performed.
(iii) Signal Conversion: The image signals were converted into a digital format. Image-Pro-Plus 6.0 (IPP) software demonstrated advantages such as a high accuracy in edge detection and the ability to concurrently and precisely quantify multiple parameters of irregular shapes, which enabled the precise extraction of image features. After the images processed by Matlab were imported into IPP software and its measure function was employed, the desired parameters were specified, which facilitated the extraction of crack characteristics.
In order to quantitatively analyze the development law of the crack using wet–dry cyclic action, the following basic indexes are proposed: (i) Maximum crack width (wmax), defined as the maximum value of the distance between the curves on both sides of the crack along the width direction, generally located near the intersection of the main crack. (ii) The mean crack width (wavg), defined as the ratio of the total cleft area to the longitudinal cleft length. The crack length was calculated from the ossified crack images. (iii) The crack ratio (rc), defined as the ratio of the area of the crack to the surface area of the specimen. In this study, the white area represents the crack, so the ratio of the number of white pixel points to the total number of pixel points was used to represent the crack rate. Note that the scale was calibrated by the average diameter of the specimen measured by vernier calipers.
It is noteworthy that, upon analyzing the crack evolution patterns of each specimen, all specimens exhibited a common three-stage law of crack evolution: initiation stage (N ≤ 1), propagation stage (1 < N ≤ 4), and stable stage (N > 4), despite the discrete nature of the absolute fracture parameters among the specimens. During the initiation stage, the cracks are minute, with a sparse distribution of a few tiny cracks, and the crack network has not yet developed. In the propagation stage, the main cracks emerge and rapidly propagate, leading to a substantial increase in the number of cracks. In the stable stage, crack development reaches a plateau, and the crack system attains a dynamic equilibrium. The extent of crack development first increases and then stabilizes, and the rate of crack development initially accelerates and then slows down. Due to space constraints, this study focuses solely on analyzing the crack evolution pattern of a representative specimen. This case unequivocally illustrates the response relationship between the number of wet–dry cycles (N) and the extent of crack development, thereby providing a crucial foundation for the development of a universal damage evolution model.
Cracks serve as prominent indicators of geotechnical material degradation. Figure 7a illustrates the crack propagation process in a representative sample subjected to wet–dry cycling. Before wet–dry cycling (N = 0), the sample exhibited a dense structure, a smooth exterior, and high structural integrity, with no cracks visible on the surface. After the initial wet–dry cycle (N = 1), significant annular pores emerged between the sample and the confining ring, accompanied by particle loss from the sample’s base, resulting in a decrease in its structural integrity and concurrent mass loss. The sample’s dimensions and shape underwent significant changes, with relatively narrow and limited in scale cracks manifesting on the surface. The second wet–dry cycle had the most pronounced influence on crack development, with peak growth rates observed for both crack density and crack width during this phase. Subsequently, as N increased, the rate of crack propagation diminished. The cracks on the sample surface progressively widened and coalesced into an extensive crack network, featuring several prominent wide cracks interspersed with finer cracks distributed irregularly around them. After four wet–dry cycles, crack propagation nearly ceased, but constant physical fissure creation as well as smaller crack healing.
The rc, wmax, and wavg are effective indicators for quantitatively assessing the mesoscale response characteristics of cracks during wet–dry cycles. Figure 7b,c illustrate the relationship curves between the rc, wmax, wavg, and N for the specimens. Significant changes in the rc, wmax and wavg of the specimens are observed throughout the wet–dry cycle process. However, the response of crack development to each wet–dry cycle exhibits variability, and the sensitivity of crack indicators to the wet–dry cycles differs accordingly.
The initial wet–dry cycle has a relatively minor influence on the cracks, with both the scale and size of the cracks being relatively small. The rc is only 0.30%, and the maximum and mean crack widths are 0.515 mm and 0.184 mm, respectively. Subsequently, the specimens undergo a phase of rapid crack propagation. After the second wet–dry cycle, the main crack begins to emerge. Cracks continue to propagate along these primary cracks, and the growth rates of the rc, wmax and wavg all reach their peaks, with increases of 300%, 298%, and 160%, respectively. During the third wet–dry cycle, while the growth rates of the rc and wmax decline slightly, they remain significant. Cracks continue propagating along the established primary crack; however, the growth rate of the wavg diminishes significantly, with subsequent wet–dry cycling exerting a reduced impact. As N increases, the growth rates of the rc, wmax and wavg gradually decrease. When N reaches four, crack development enters a stable phase, and crack propagation reaches the bottleneck period. The crack density, crack length, and average crack width of the specimens all approach their respective limits, with the rc stabilizing at approximately 1.96%, the wmax at 3.05 mm, and the wavg at 0.562 mm.

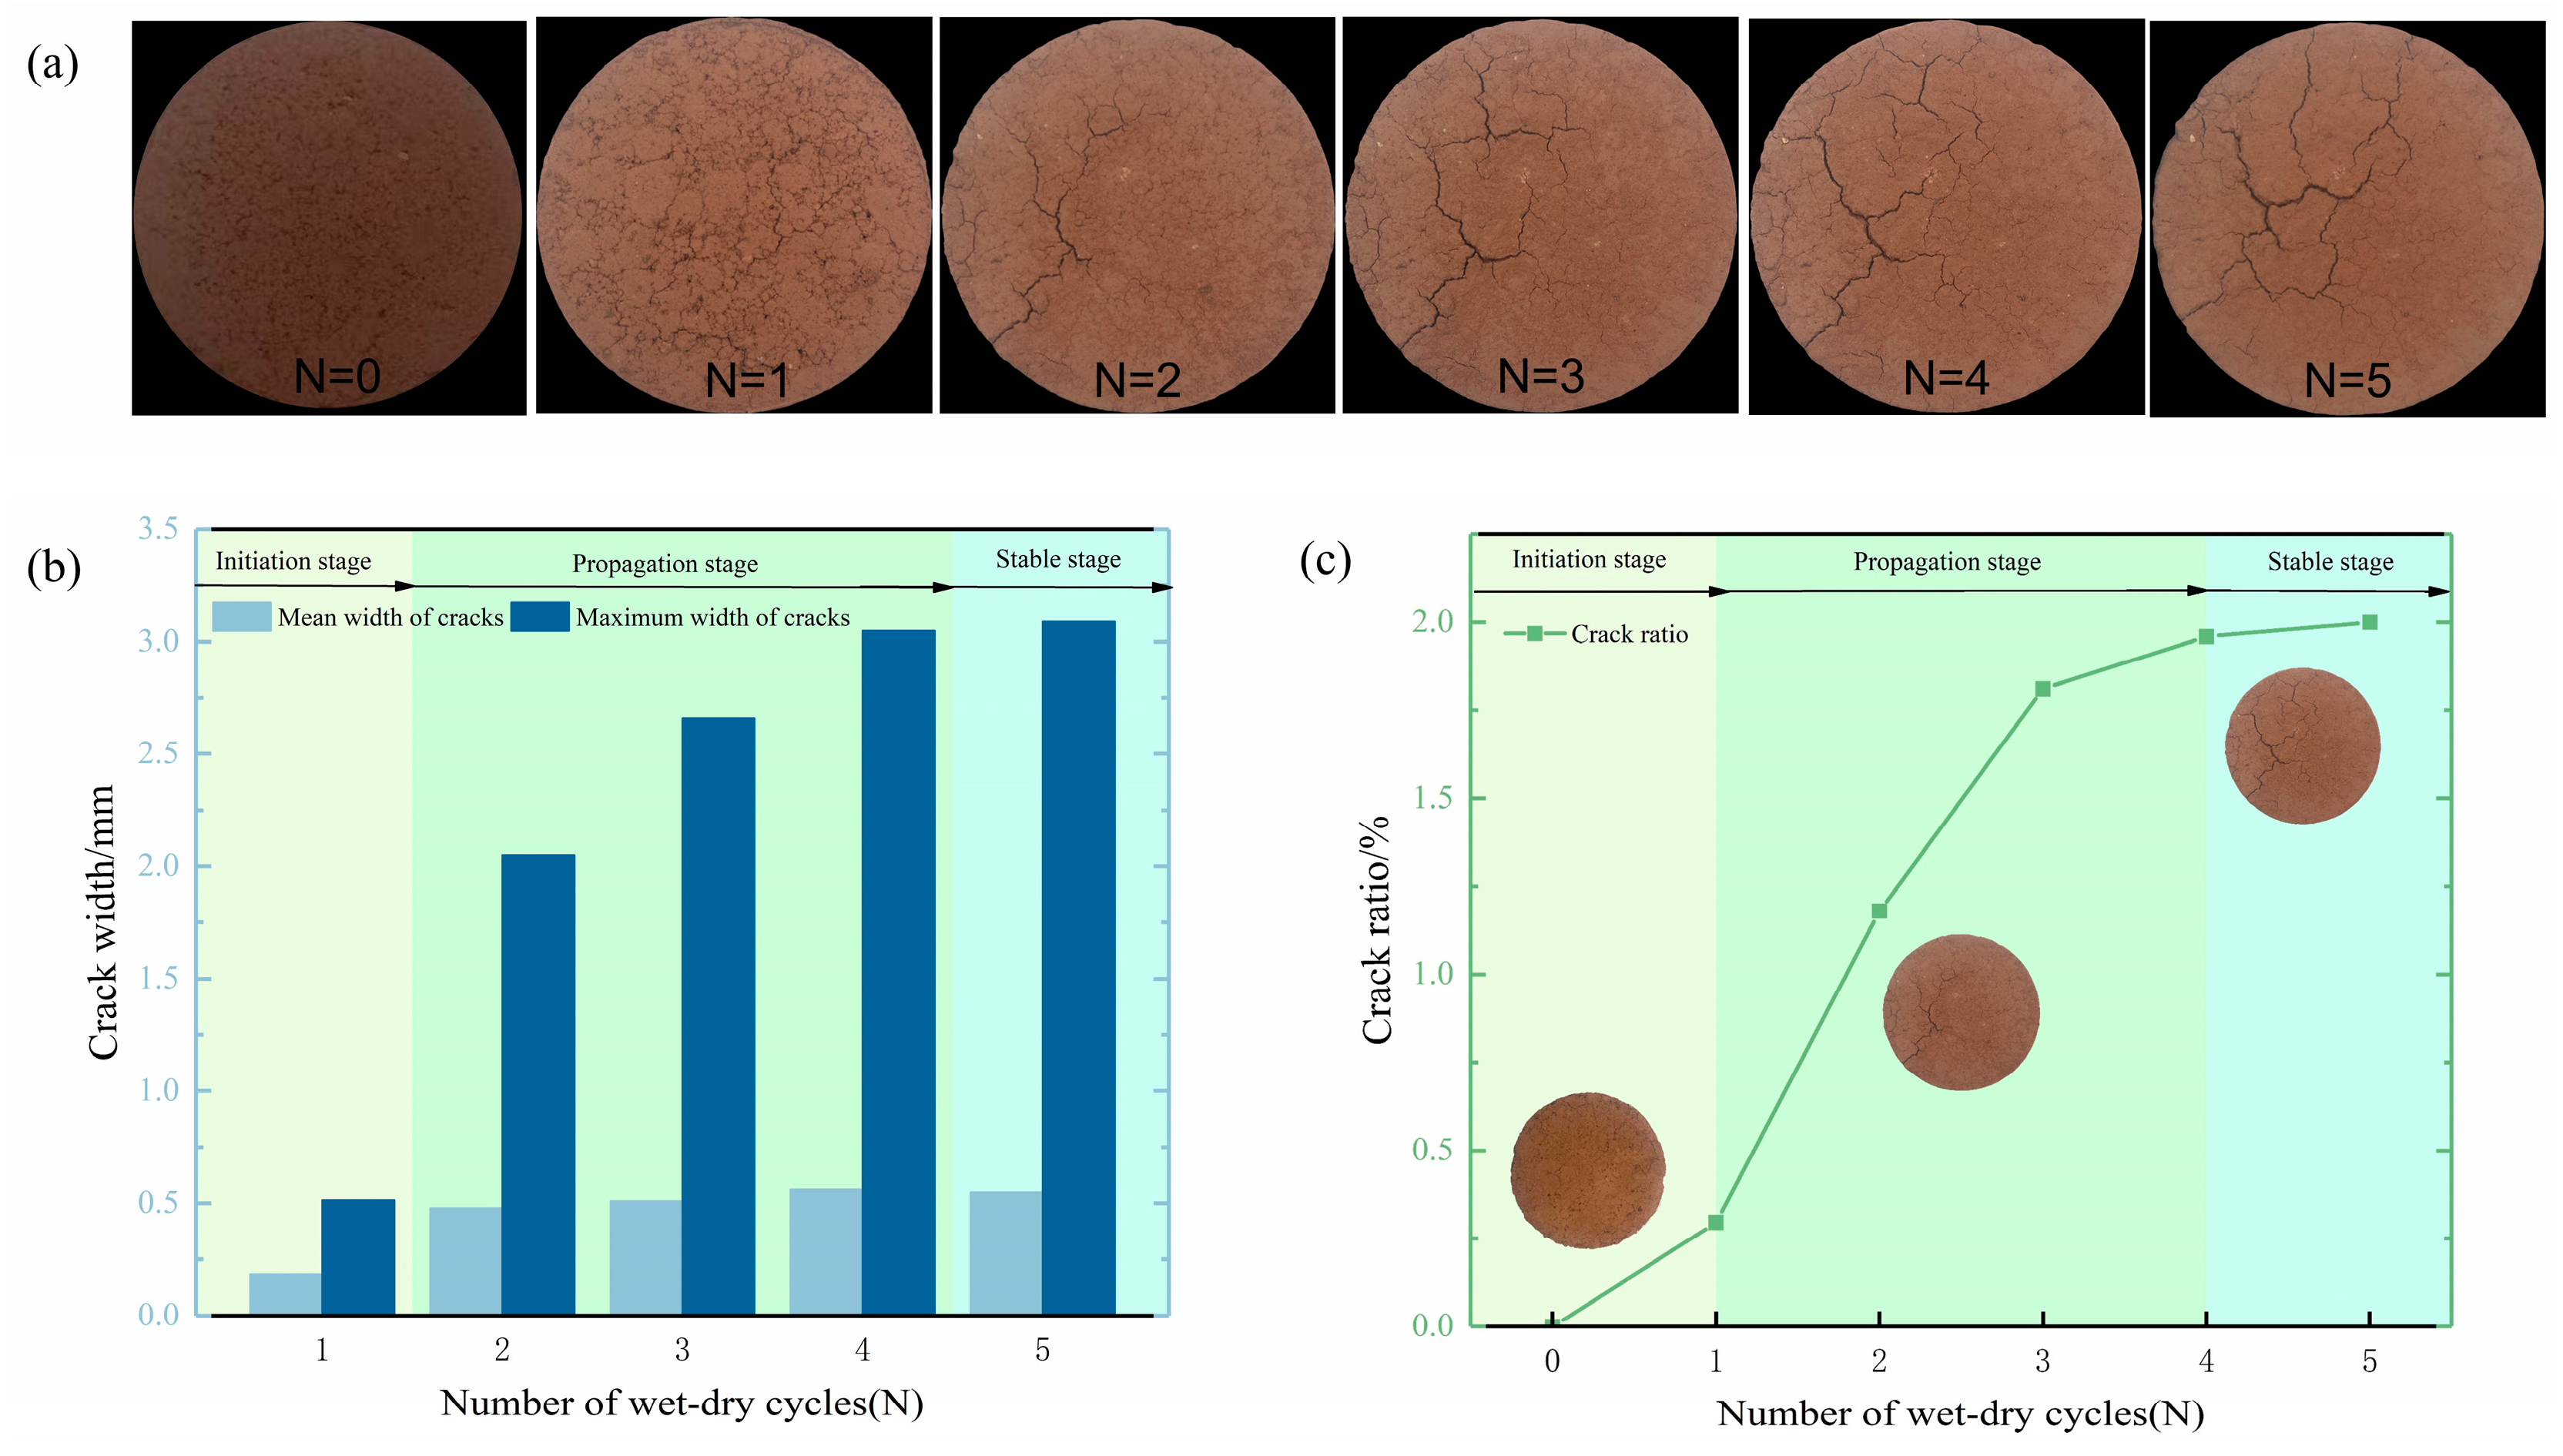
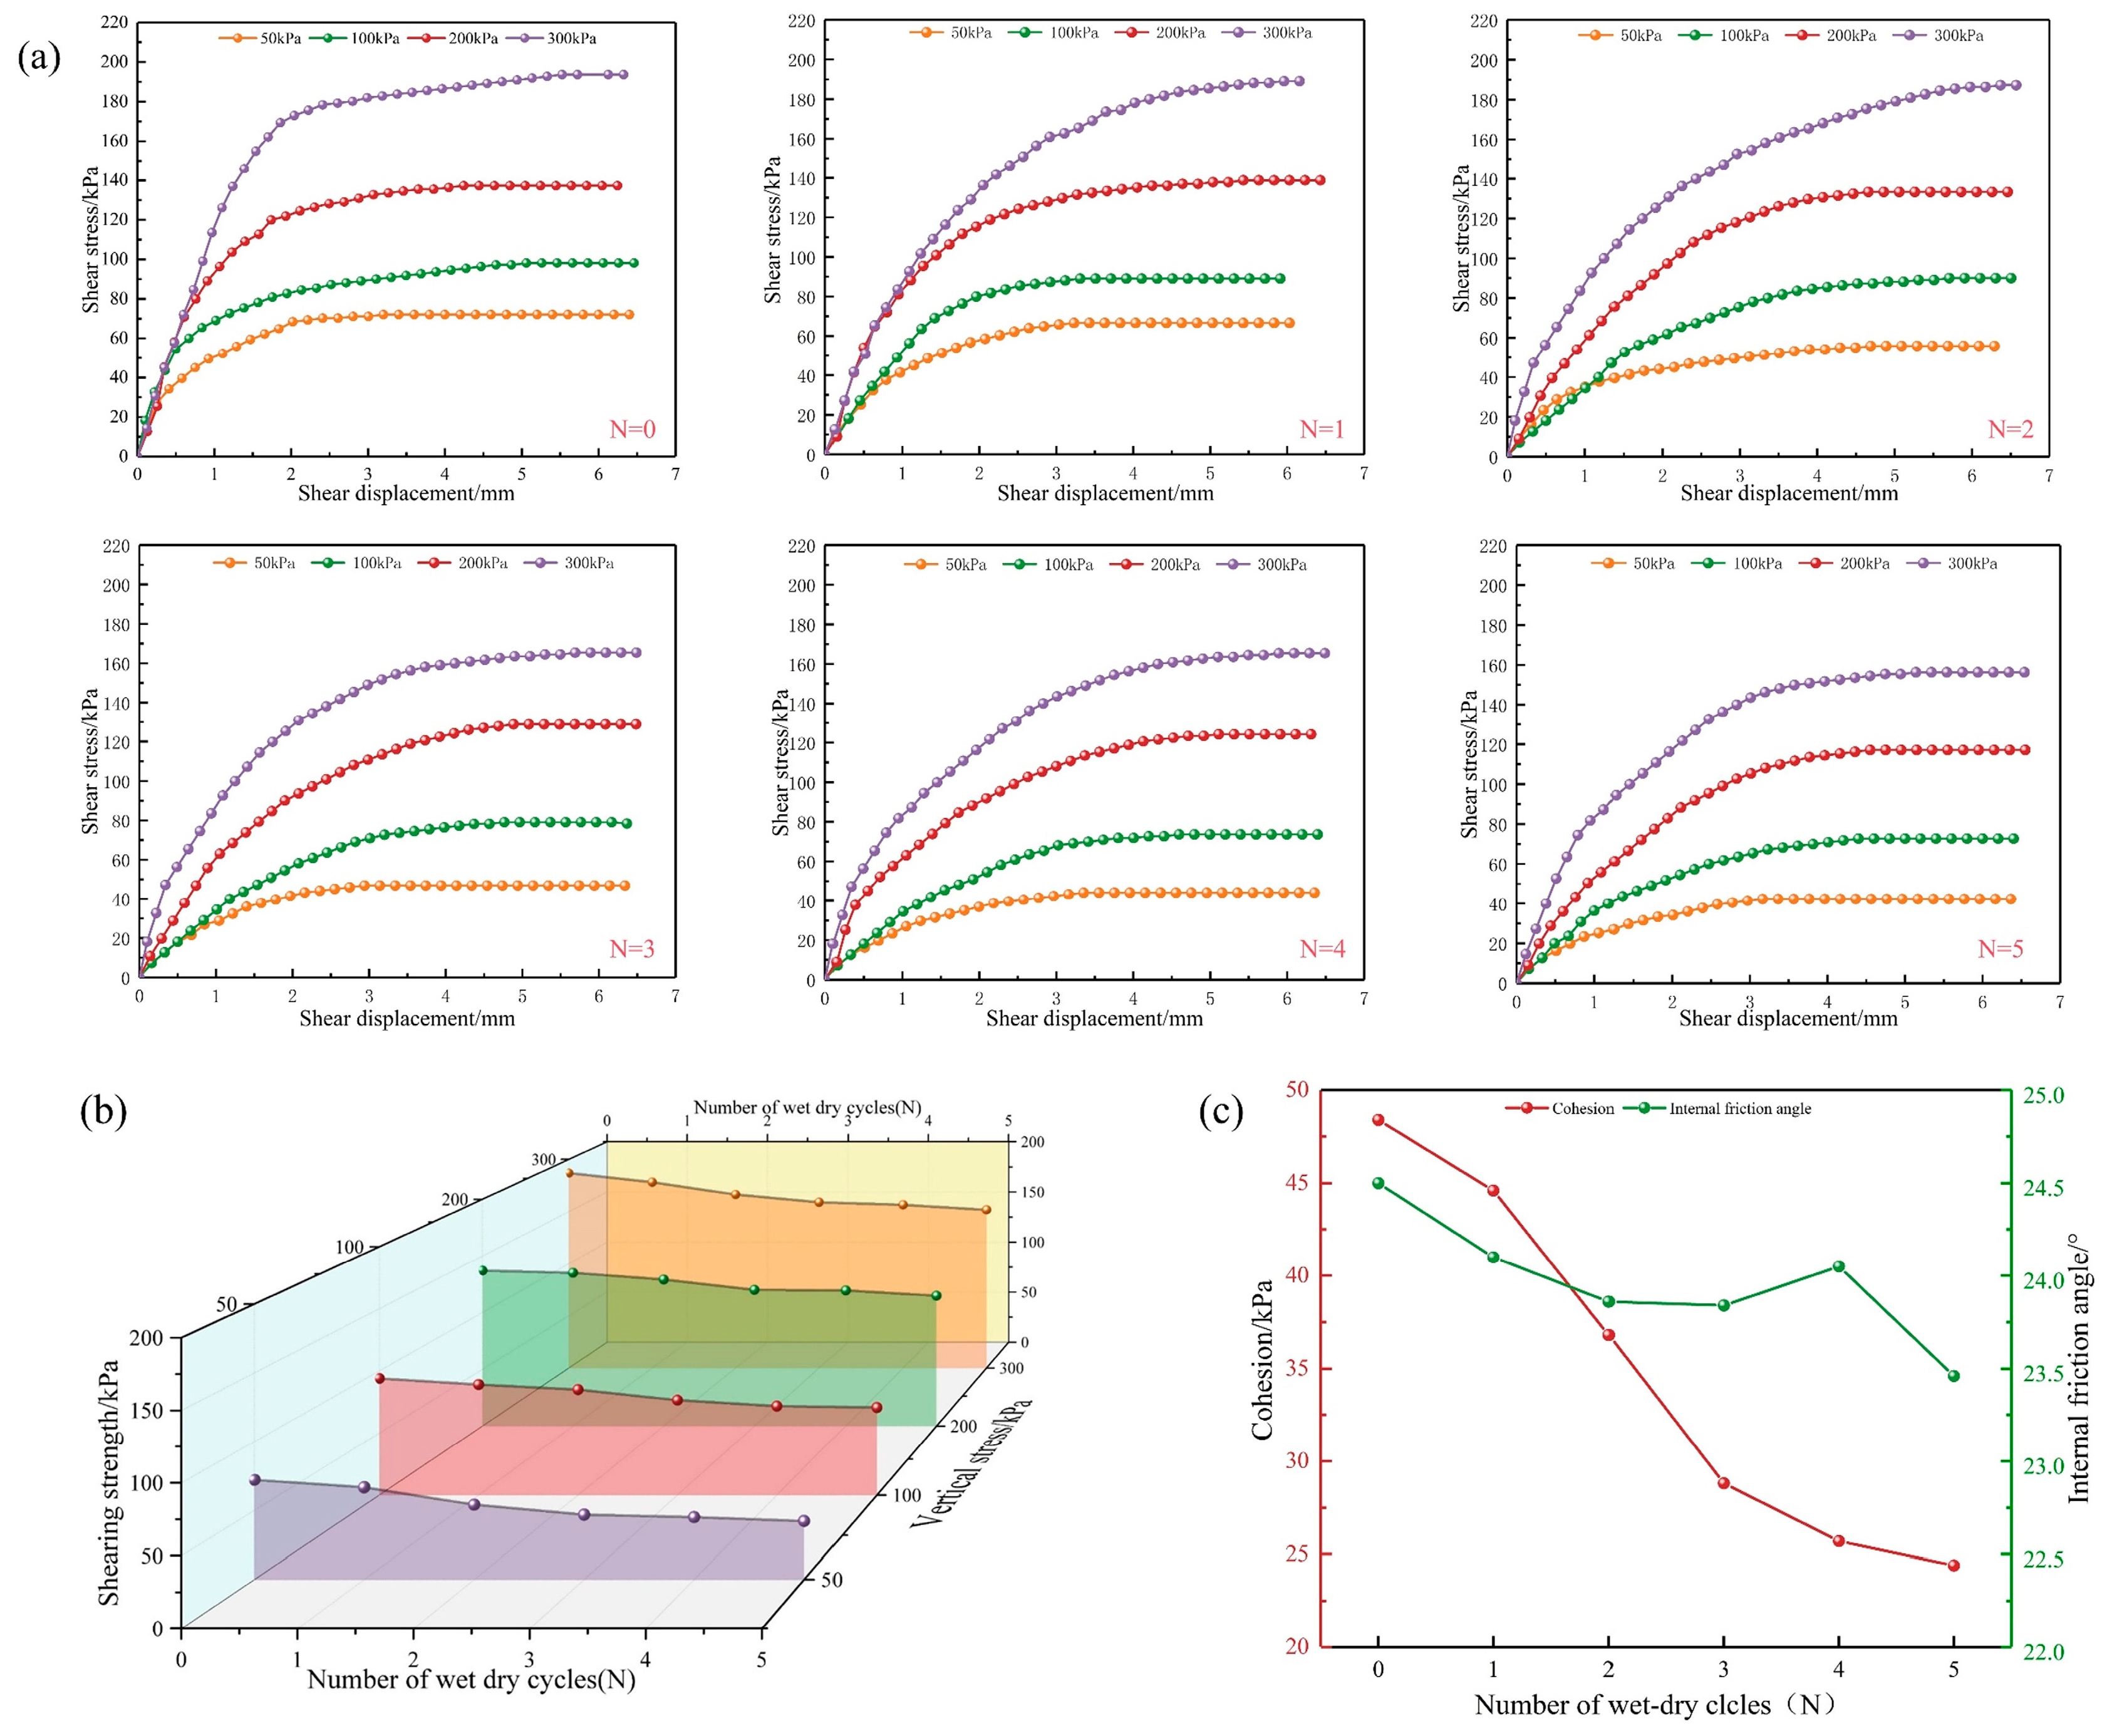
3.4. Macroscale Damage

Previous research has shown [33,34] that water content significantly influences the results of direct shear tests. Therefore, consistent control of water content is essential prior to conducting direct shear tests to minimize experimental errors caused by variations in water content. The samples, after undergoing the prescribed N, were humidified to achieve a water content of 18.1% (natural water content) and then placed in a thermostatically controlled and humidifying glass jar for 12 h to ensure sufficient water migration. In this study, the direct shear test was conducted according to the indoor rapid shear test method at a constant shear rate of 0.8 mm/min. The tests were performed on samples subjected to different N under varying vertical pressures of 50, 100, 200, and 300 kPa. Shearing was terminated upon observing a significant decrease in the pressure gauge reading or when the shear displacement exceeded 6 mm.
As depicted in Figure 8a,b, with increasing N, the shear strength of sandy red clay undergoes significant alterations. After five wet–dry cycles, the shear strength under varying vertical stress exhibits varying degrees of attenuation. The shear strength shows the most notable variation at a vertical stress of 50 kPa, with a peak reduction of 41.3%. Taking a vertical stress of 50 kPa as an example for analysis, after the first wet–dry cycle, the shear strength of the sample exhibited a modest decrease, with reductions of 7.5%, accounting for 18.1% of the overall reduction. During the second and third wet–dry cycles, the shear strength of the sample experienced the most substantial decreases. After these two cycles, the reductions in shear strength amounted to 18.9% and 13.3%, respectively, making up 66.4% of the total reduction. That is to say, during the first three wet–dry cycles, the decrease in shear strength accounted for 85% of the total decrease. The subsequent wet–dry cycling has a comparatively minor impact on shear strength. The effects of the fourth and fifth wet–dry cycles had a lesser influence on shear strength, resulting in a decrease in within 10%. The amplitude of shear strength variation differs under various vertical stresses, yet the overall trend of variation remains consistent.
Overall, it is evident that the effect of wet–dry cycling on shear strength. However, additional analysis is required to identify the main cause of the reduction in shear strength. Figure 8c shows the cohesion and angle of internal friction at different values of N calculated from the shear strength at different vertical stresses. It is evident that the repetitive wet–dry cycling leads to alterations in both cohesion and the angle of internal friction. The cohesion was assessed across various N values. Five wet–dry cycles led to a 49.6% reduction in cohesion. Following the initial wet–dry cycle, cohesion diminished by 7.9%, constituting 15.6% of the overall decrease. The second and third wet–dry cycles exhibited the most pronounced decrease in specimen cohesion, with reductions of 17.5% and 21.7%, respectively, accounting for 65.8% of the total decrease. Subsequent wet–dry cycling had a diminished impact on cohesion, with the cohesion beginning to stabilize after the fourth wet–dry cycle. The internal friction angle of the samples exhibits minor influence from N throughout the entire process. Over the five cycles, the internal friction angle remains relatively stable, ranging from 23.46° to 24.51°. While it shows a slight decreasing trend with minor fluctuations, the change is not significant, and the variation is substantially smaller compared to that of cohesion. Consequently, it can be inferred that the reduction in cohesion is the principal factor contributing to strength degradation.

4. Discussion on the Mechanism of Damage

Subjected to wet–dry cycling, a complex and dynamic interplay occurs across the micro-, meso-, and macro-scales within the soil sample, resulting from the repetitive infiltration and evaporation of pore water. Such interplay arises from a cross-scale interaction mechanism, whereby repeated expansion and contraction of mineral particles induce fatigue damage to the soil’s microstructure, manifesting as enlarged pore spaces, depleted clay minerals, and altered structural configurations. Accumulation of initial microscale damage, induced by repeated wet–dry cycles, precipitates the formation and propagation of mesocracks within the soil. Consequently, this results in a degradation of the soil’s macroscale shear strength. This chapter integrates experimental findings with insights derived from prior research to elucidate the degradation mechanisms of geomaterials undergoing wet–dry cycling across the micro-, meso-, and macro-scales.

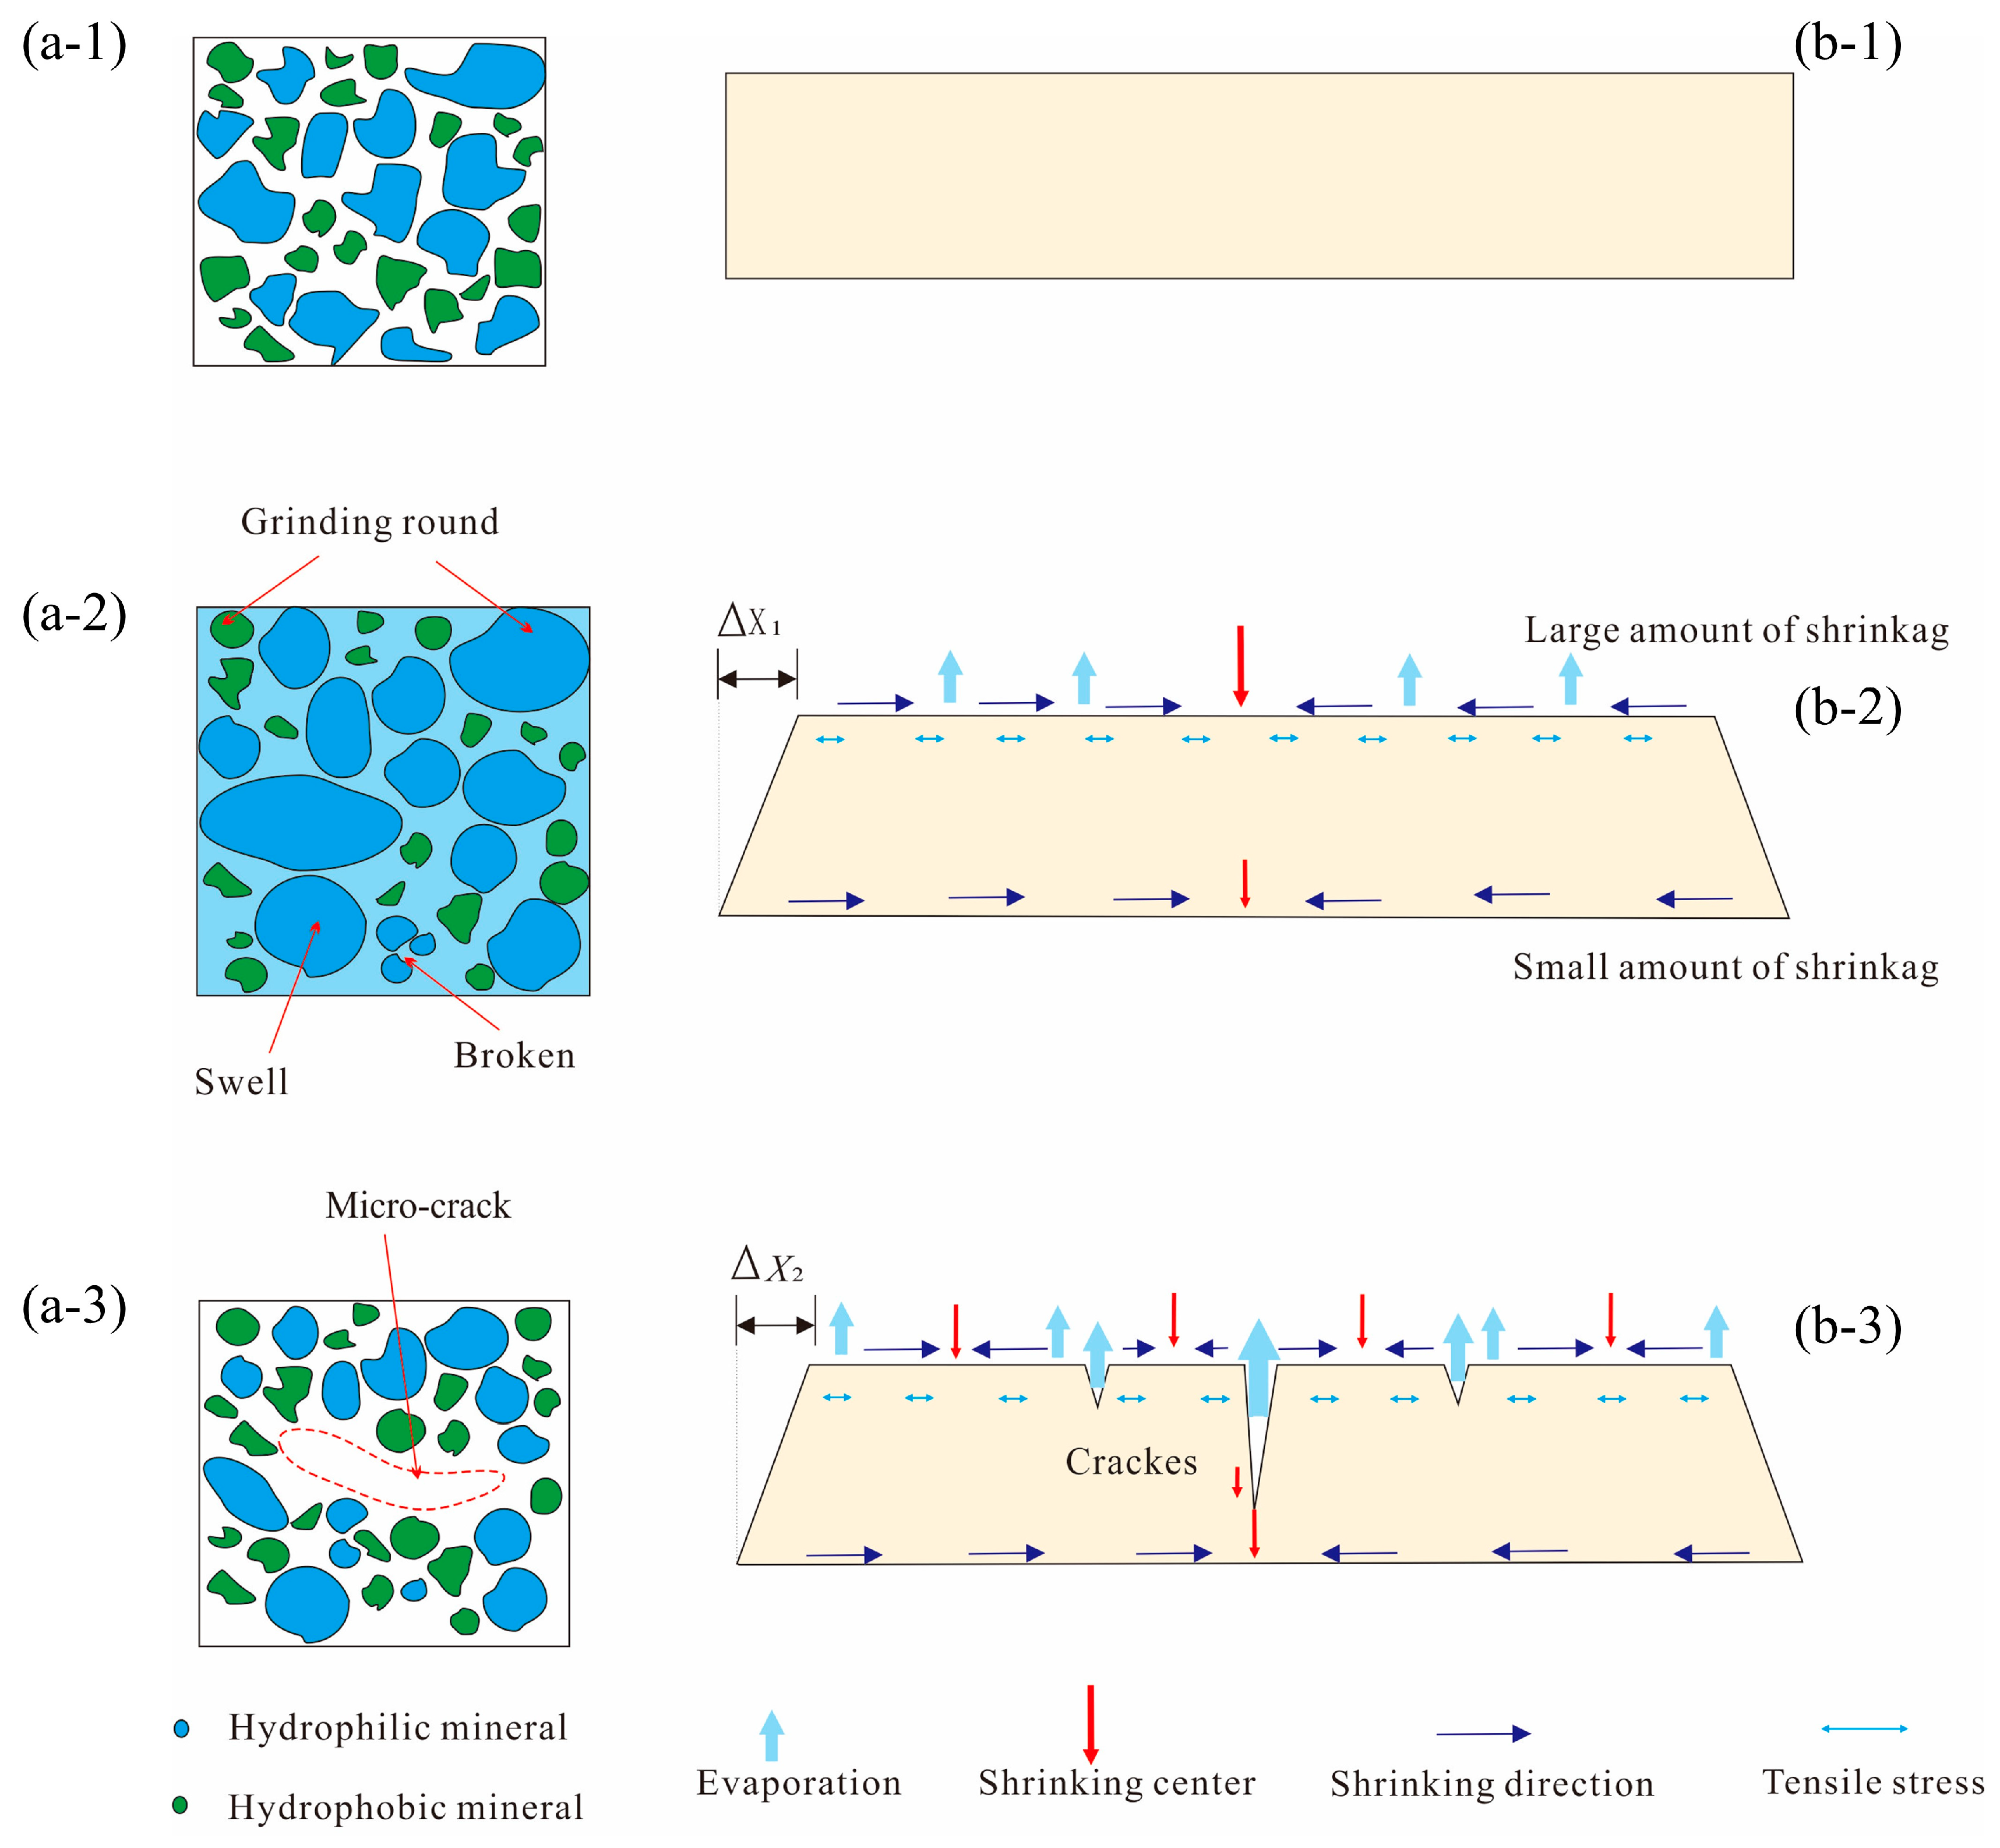
4.1. Mechanism of Microscale Damage

The capacity of sandy red clay to exhibit expansion and contraction is fundamentally attributed to its distinctive mineralogical composition, characterized by a substantial abundance of clay minerals, serving as a pivotal determinant in the occurrence of expansion and contraction phenomena [35]. Water serves as a crucial external stimulus that induces expansion and contraction in the soil. Put simply, if the water content of the soil specimen remains constant, no expansion or contraction will occur. During the wetting phase, water molecules infiltrate the interior of the soil sample through existing pores and fissures under the influence of osmotic pressure. The hydrophilicity of the clay mineral particle surfaces, coupled with the polar structural features of water molecules, facilitates the adsorption of water molecules around the clay minerals under the influence of electrostatic forces, leading to the expansion of the particles. Simultaneously, the bilayer repulsive force that arises between the mineral particles augments the inter-particle spacing. Consequently, this not only results in an increase in the original pore size but may also generate new pores, ultimately leading to enhanced porosity and soil volume expansion (Figure 9(a-2)) [36]. During the drying phase, water molecules within the pores migrate to the atmosphere via the soil surface, leading to evaporation. As evaporation persists, the water film surrounding the mineral particles diminishes, forming a curved liquid surface between the particles and generating capillary water pressure. Under the synergistic effect of capillary water pressure and surface tension, the mineral particles are drawn closer together, resulting in a reduction in pore aperture, porosity, and soil volume contraction (Figure 9(a-3)) [37].
Although the specimen undergoes expansion during the wetting phase and contractions during the drying phase, the reversibility of these dimensional changes during wet–dry cycles is incomplete, attributable to irreversible alterations within the microstructure. The directionality of mineral particle expansion and contraction exhibits disorderliness [38], with variability in the magnitude of these changes among diverse mineral constituents. Clay minerals, predominantly composed of illite, exhibit heightened sensitivity to variations in water content, with particularly pronounced expansion and contraction effects observed during wet–dry cycling [39]. These effects induce alterations in particle structure and arrangement, as well as modifications in the stress regimes of particles and pore structures. Consequently, the microstructure is unable to revert to its initial state. Simultaneously, water migration during dry-wet cycling results in the rounding, dissolution, destabilization, or detachment of certain minerals, thereby augmenting the size and number of pores within the specimen (Figure 9(a-2)). Furthermore, the interconnection and coalescence of these pores ultimately culminate in the formation of microscopic cracks (Figure 9(a-3)). Hence, the cumulative phase of microstructural deterioration in the soil corresponds to the initiating stage of mesoscopic cracking.

4.2. Mechanism of Mesoscale Damage

During wet–dry cycling, various microstructural changes promote the formation of potential microscale cracks. As cycling continues, these microscale cracks connect and merge with internal pores, leading to their progressive development [40] and ultimately culminating in the formation of visible mesoscale cracks. This also elucidates why the first wet–dry cycling exerted a substantial impact on the microstructure, yet did not give rise to numerous mesoscale cracks. From a mechanical perspective, mesoscale cracks belong to tensile cracks. The emergence and propagation of mesoscale cracks predominantly occur during the dehydration stage. In this process, The decrease in moisture content leads to an increase in soil matrix suction, resulting in the formation of tensile stress between particles. However, the specimen develops an internal water content gradient, as water loss from the surface exceeds that from the bottom [41]. Meanwhile, the extent of shrinkage among different mineral particles varies considerably, leading to uneven shrinkage of the soil, thereby inducing stress concentration (Figure 9(b-2)). When the tensile stress exceeds the soil’s tensile strength, internal cracks emerge and progressively develop [42].
After the second wet–dry cycle, the main crack begins to emerge. These cracks serve as the crack framework and primary seepage paths throughout the entire wet–dry cycling process, resulting in an accelerated rate of crack development. With the process of wet–dry cycling, the main crack will progressively widen and deepen, while numerous smaller cracks will emerge in the vicinity of the main crack. The presence of these smaller cracks reduces the overall average crack width, leading to the stabilization of the average crack width when N equals three, although the maximum crack width and crack rate continue to increase. However, following repeated wet–dry cycles, the cracks will progressively widen and coalesce into an interconnected network, thereby facilitating increased water escape pathways and reducing discrepancies in volumetric deformation, leading to a decrease in tensile stress. Concurrently, crack formation leads to the relaxation of tensile stress (Figure 9(b-3)). When the tensile stress falls below the tensile strength, the propagation of microscale cracks within the soil mass will halt. This explains the restriction of crack development in the later stages of wet–dry cycles.

4.3. Mechanism of Macroscale Damage

The changes in shear strength result from the combined effects of cohesion and the internal friction angle. The cohesive strength between soil particles is primarily determined by mineral composition and pore structure, while the internal friction angle is influenced by the roughness of particles and their arrangement [43]. Mineral composition plays a crucial role in determining cementation strength, while pore structure is key to determining intergranular attraction strength. A decrease in the abundance of clay minerals leads to a significant reduction in cementing force; an increase in pore size and number results in a marked reduction in intergranular attraction, while the presence of cracks can severely hinder stress propagation. Collectively, these factors lead to a significant reduction in soil cohesion. Although water flow smooths soil particles, reduces granule surface roughness, and alters the arrangement of particles, the impact of short-term water-rock interactions on particle roughness is relatively limited. Consequently, during the wet–dry cycling process, while the internal friction angle generally decreases, the overall change is relatively modest.
After the initial dry–wet cycle, the enlargement of pore size and the hydrolysis of certain clay minerals contribute to a decrease in cohesion. However, at this stage, the degree of hydrolysis of clay minerals is still relatively limited. As the wet–dry cycles progress, cracks emerge as the primary pathways for water infiltration into the soil, accelerating the hydrolysis and subsequent loss of clay minerals. Concurrently, the presence of cracks disrupts the material’s continuity, impeding the transmission of stresses. This results in a significant reduction in cohesion, making cracks the primary factor influencing its magnitude. In the later stages of the wet–dry cycles, the crack rate, pore structure, and mineral composition stabilize, and consequently, cohesion also stabilizes during this period.

5. Wet–Dry Cycling Effects on Slope Stability

In this chapter, the stability of sandy red clay slopes under varying N was analyzed using the finite element software ABAQUS CAE 2020, employing SRM, based on the test results previously discussed

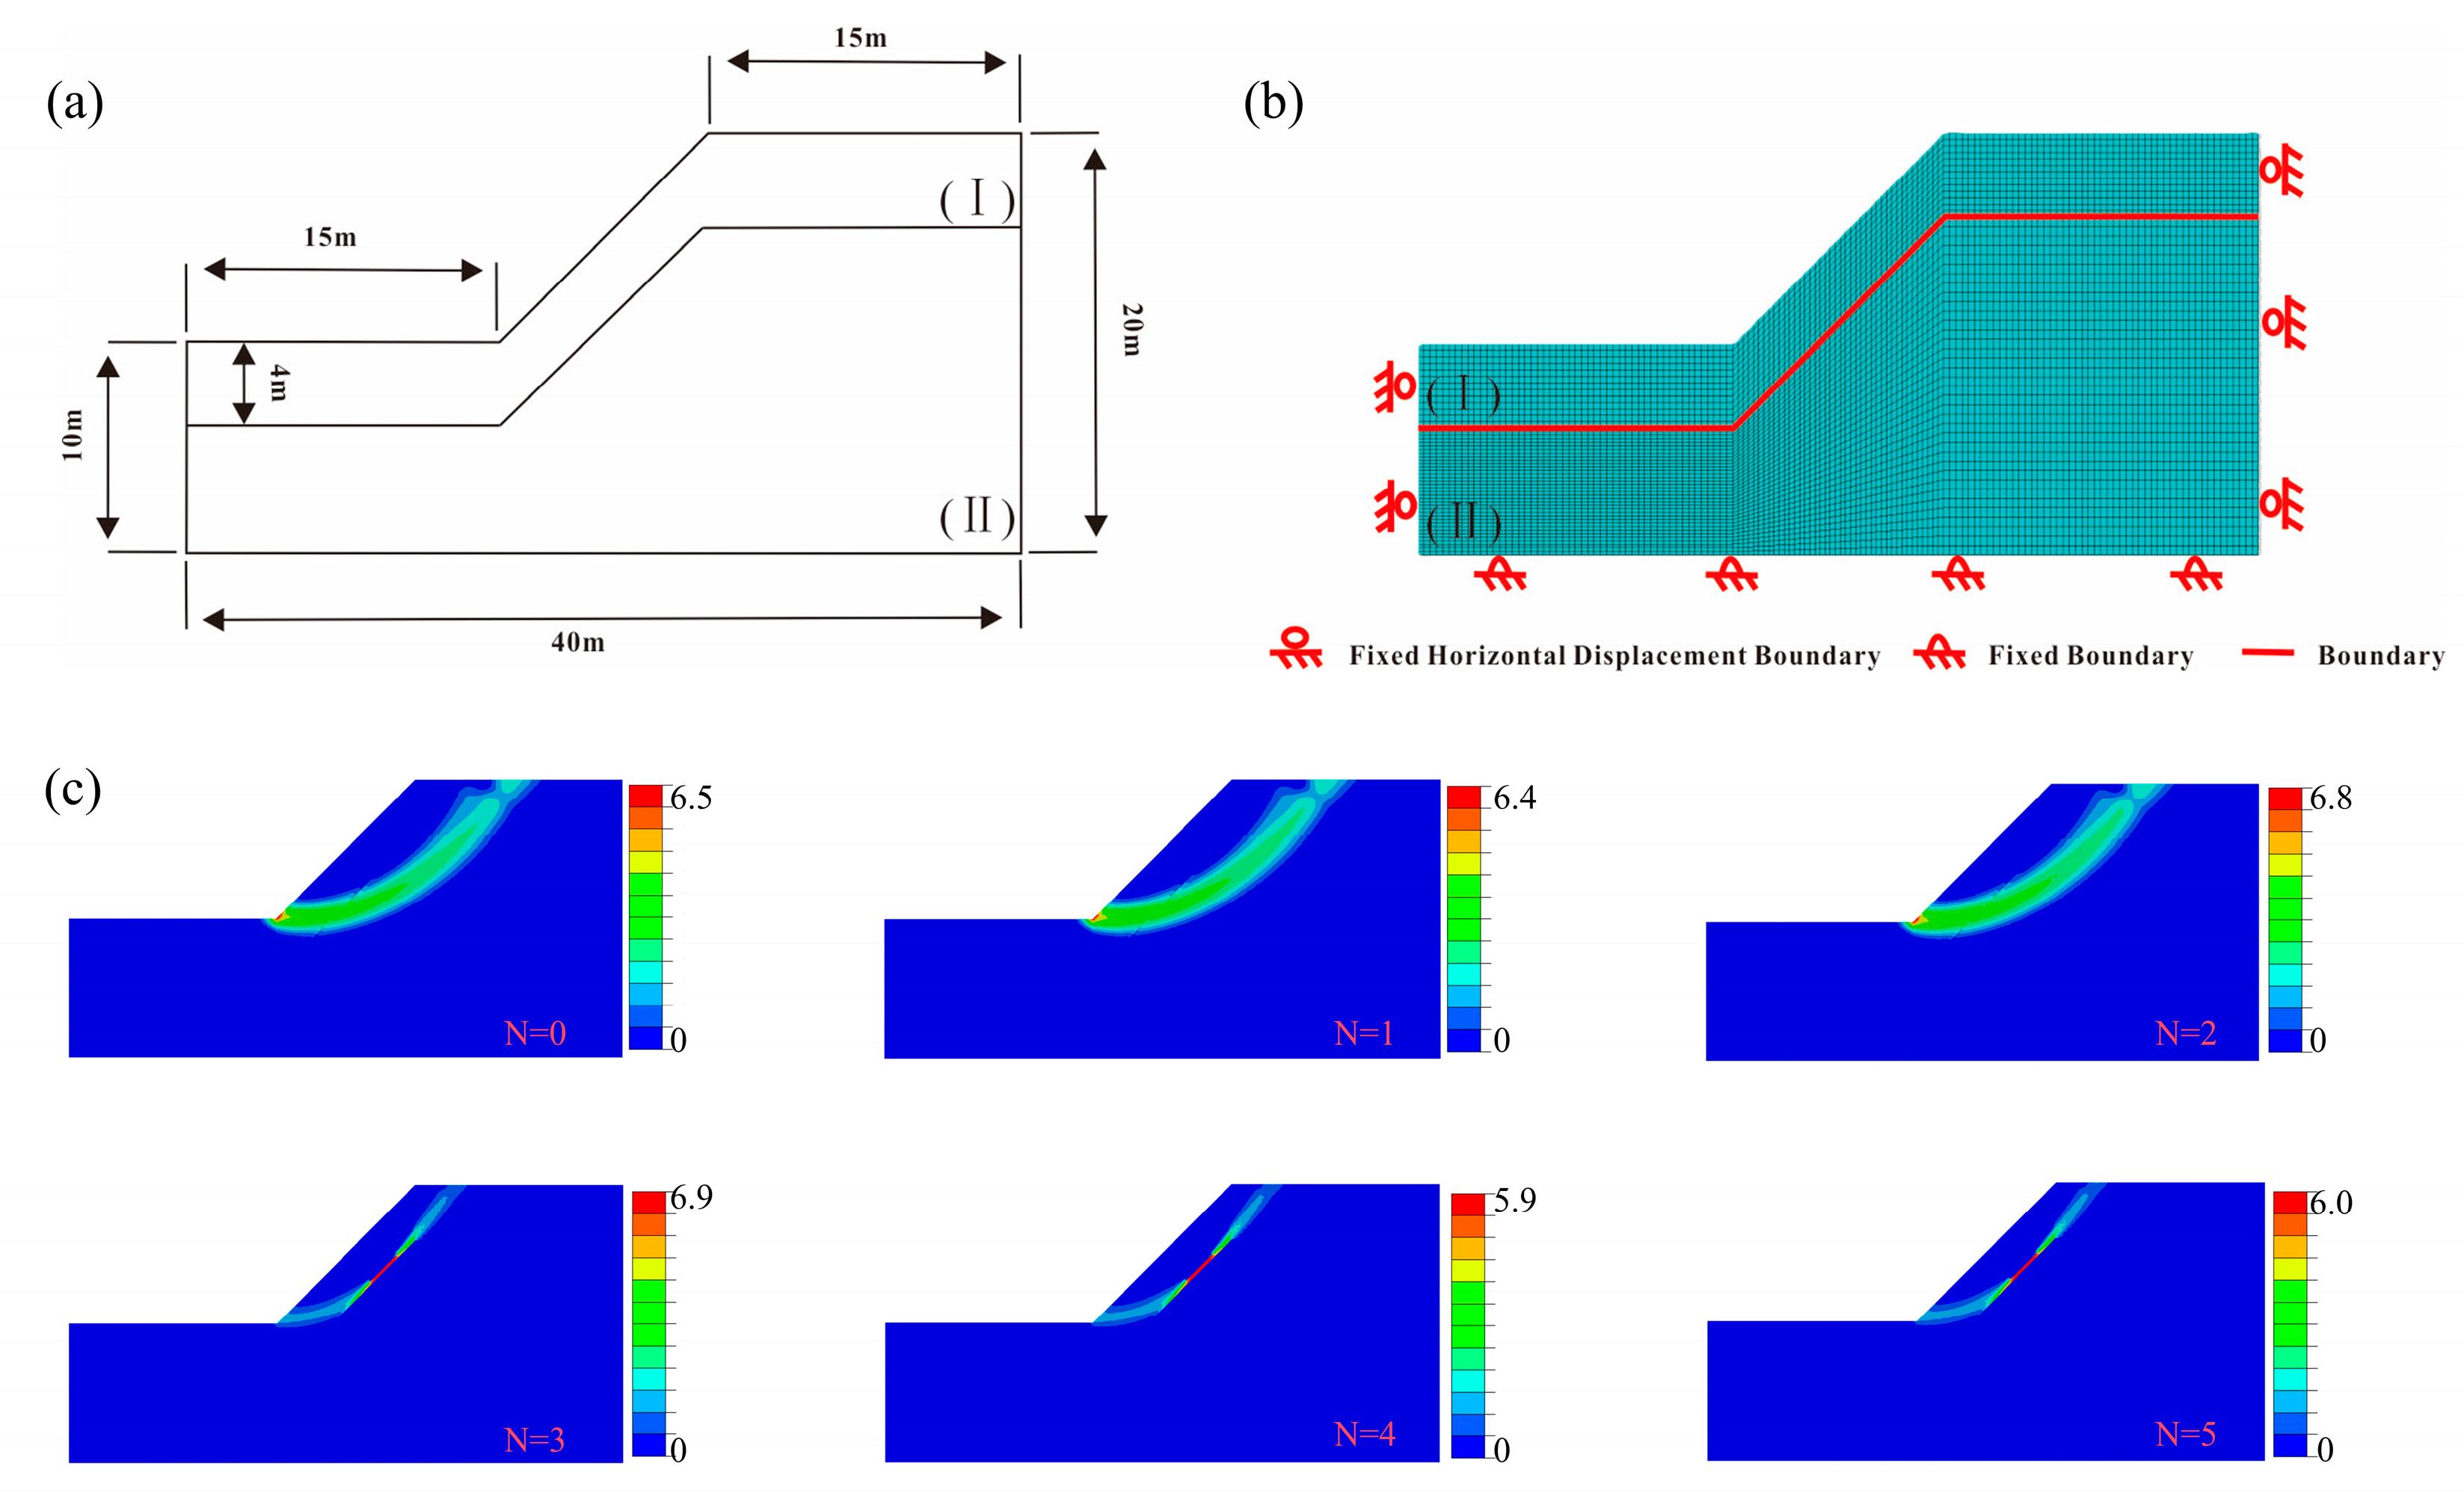
5.1. Model Construction

SRM was first proposed by Zienkiewicz et al. in 1975 [44]. Its basic principle involves gradually reducing the cohesion and internal friction angle of the material through a strength reduction coefficient. When the stress and strength of a given soil unit are no longer in equilibrium, the excessive stress is transferred to the surrounding units of the soil mass. Once the large yield points connect to form a continuous failure surface, the soil mass becomes destabilized. The expression for strength reduction is as follows:
c m = c F r
φ m = arctan ( tan φ F r )
where c and φ are the soil cohesion and angle of internal friction determined through the direct shear test; while cm and φm denote the corresponding values of cohesion and angle of internal friction after accounting for strength discounting; Fr is the discount factor, defined as the ratio of the strength before and after discounting; Fv is the slope safety factor, whose value is equal to that of the Fr in the ultimate equilibrium state of the slope. The three common methods used to assess slope failure are as follows: (i) if the calculation results show no convergence, it can be concluded that the slope has failed [45]; (ii) if a distinct inflection point appears in the displacement of a characteristic point on the slope, it can be concluded that the slope has failed [46]; and (iii) if a continuous plastic zone emerges, it can be interpreted as an indication that the slope has failed [47]. The SRM can automatically identify the most critical sliding surfaces and calculate the corresponding safety factors without the need for a priori assumptions regarding the size, shape, or location of the failure surfaces. Based on the strength parameters obtained from the tests, the SRM is applied within numerical simulation software to investigate the stability of the slope model, and this method has been widely used by numerous researchers [48,49].
A typical homogeneous soil slope is used as a case study to investigate the impact of multiple dry and wet cyclic actions on slope stability, with the model geometry illustrated in Figure 10a. In a slope stability analysis, the influence of external environmental factors on soil strength is limited to a certain depth [50,51]. Consequently, the model is divided into two zones: the upper zone (Zone I), representing the affected area, and the lower zone (Zone II), representing the unaffected area. Zone I and Zone II constitute distinct regions within the same homogeneous soil body, delineated solely by the “Partition” function of the software. The disparity between these two zones manifests solely in the variation in material parameters, specifically cohesion (c) and angle of internal friction (φ), as a function of the number of N. No contact interface is established between the two zones. This approach circumvents the computational complexity associated with the contact algorithm, thereby reducing the computational workload, and precisely captures the progressive degradation effect of wet–dry cycles on the topsoil. The physical parameters of the soil used in the model are provided in Table 2. In Zone I, which is subjected to wet and dry cyclic actions, the shear strength is reduced, and the cohesion and angle of internal friction under varying cyclic conditions are determined based on the experimental results detailed in Section 3.4 of this study. In contrast, Zone II is not subjected to wet and dry cyclic actions, and its cohesion and angle of internal friction are taken as the values obtained from tests under natural moisture content, prior to any cyclic exposure.
The boundary conditions include constrained horizontal displacement on both the left and right sides, a fixed bottom edge, and free boundaries on all other sides. The mesh consists of CPE4 four-node plane strain elements, it can effectively balance calculation accuracy and efficiency. A Full Integration scheme is used to avoid the hourglass effect that may be induced by reduced integration. With the Mohr–Coulomb criterion applied for damage, the meshing of the established slope model is shown in Figure 10b.

5.2. Model Computation

The calculated relationship between the slope’s top displacement (U) and Fr for varying N is shown in Figure 11a. In this study, the method proposed by Peng et al. [52] for assessing slope instability is employed, using the convergence of finite element calculations as the basis for determining instability. The final factor of Fv for the slope under varying N is presented in Figure 11b. From the figure, it is evident that, considering the deterioration of the geotechnical structure due to wet and dry cyclic actions, the factor of safety for the slope significantly decreases, from an initial value of 2.41 to 1.95 after five wet–dry cycles, representing a total reduction of 19.1%. It can be observed that in the first two cycles, there is a slight decrease in the slope’s safety factor, primarily attributed to the reduction in the cohesive force of the soil. Despite the notable reduction in cohesion observed during the initial two wet–dry cycles, the extent to which the external environment influences soil strength is constrained. This, in turn, leads to a lesser decrement in Fv and an elevated overall safety factor for the slope.
Figure 10c presents the plastic equivalent strain for magnitude (PEMAG) of the slope after different N. The plastic deformation zone of the slope forms a circular arc from the base to the top, which is commonly regarded as the potential sliding surface. This sliding surface tends to gradually migrate toward the surface layer as wet–dry cycling progresses. After the third wet–dry cycle, the plastic strain cloud diagram underwent significant changes. The potential sliding surface shifted from the interior to a shallower position, with a noticeable reduction in the sliding surface. The plastic zone near the foot of the slope became circular, and the region the boundary along the slope became linear.
It is notable that the decrease in cohesion during the first two wet–dry cycles reaches 24.0%, accounting for 49.2% of the total decrease. In contrast, the reduction in the slope’s Fv is only 3.3%, representing 17.4% of the overall decrease. This suggests that changes in the Fv are not directly correlated with changes in shear strength, and that in layered soil slopes, differences in cohesion and internal friction angle between different materials significantly influence the location of the sliding surface. Prior to the third wet–dry cycle, the slope exhibited deep sliding. During this period, the plastic deformation zone is distributed across both Zones I and II. It is primarily situated in Zone II, which exhibits superior mechanical properties, resulting in a higher Fv. However, after the third cycle, the slope damage type transitioned from deep sliding to shallow sliding, the potential sliding surfaces are all located in Zone I with poor mechanical properties, leading to a drastic reduction in the Fv. The subsequent slope damage is primarily characterized by shallow sliding, with the Fv being largely influenced by cohesive force and internal friction angle. After the fourth wet–dry cycle, the cohesive force and internal friction angle stabilize, and subsequent cycles have less impact on slope stability. In fact, numerous studies and case histories demonstrate that slope failures under wet–dry cycling conditions typically evolve from overall or deep sliding to localized or shallow sliding [53,54], which aligns well with the simulation results presented in this chapter.

5.3. Preventive and Curative Measures

Numerous techniques exist for slope stabilization, with the utilization of anti-slip piles [55], geogrids [56], and other measures being amongst the most prevalent to enhance slip resistance. In the case of sandy red clay and other expansive soils, the application of the soil replacement method is employed to control crack development, thereby achieving slope stabilization. Soil replacement involves excavating the surface layer of soil prone to cracking during expansion, and substituting it with improved soil or non-expansive soil. The utilization of improved soil can more effectively address actual engineering requirements, minimize resource wastage, and reduce transportation costs. Evidently, the application of improved soil in soil slope reinforcement holds a greater practical significance. Over the years, extensive research on the improvement of expansive soil has yielded numerous results, including the incorporation of lime [57], lignin [58], and other additives to enhance the properties of the target expansive soil. Although the improvement mechanisms vary, they have collectively achieved a more effective improvement outcome.
The underlying principle of employing soil replacement to stabilize sandy red clay slopes resides in limiting the development of cracks. The sandy red clay beneath the cover will not be directly impacted by precipitation, thereby significantly reducing infiltration. Furthermore, with no direct sun exposure, evaporation is substantially diminished. Consequently, the intensity of the dry–wet cycle effect is diminished. Additionally, due to the protection offered by the improved soil, the effects of rainfall infiltration and evaporation are mitigated, thereby limiting the expansion and contraction of sandy red clay. Moreover, the contraction becomes nearly uniform. Based on the aforementioned mechanism of fissure formation, the generation of fissures becomes challenging. Hence, soil replacement can effectively restrict the development of fissures in the sandy red clay layer situated beneath the improved soil layer, thereby enhancing slope stability.

6. Conclusions and Prospect

6.1. Conclusions

(1) The wet–dry cycling process induced alterations in the expansion and contraction characteristics. As N increases, δa progressively increased, whereas ηa gradually decreased, and the specimen’s volume expanded. δr and ηr diminished, and the specimen’s expansion and shrinkage capabilities declined. The volumetric changes induced by wet–dry cycling are not entirely reversible, and these cycles exert a more significant impact on the expansion properties.
(2) The wet–dry cycling process induced substantial alterations to the microstructure. Particle rounding increased, stacked aggregate were disrupted, some inter-particle contacts were altered, pores enlarged and interconnected, porosity augmented, and clay mineral content decreased.
(3) The wet–dry cycling process induced the formation and progression of cracks. The evolution of cracks undergoes stages of initiation stage (N ≤ 1), propagation stage (1 < N ≤ 4), and stable stage (N > 4). As N increases, the cracks gradually expand, with the cracks developing the fastest in the propagation stage and basically stopping in the stable stage.
(4) The wet–dry cycling process caused a significant reduction in shear strength, primarily attributed to a substantial diminution of cohesion, with a negligible impact on the angle of internal friction.
(5) The wet–dry cycling process significantly reduced slope stability, and Fv of the slope decreased with an increasing N. Under the influence of wet–dry cycles, slope failures typically evolved from overall or deep sliding to localized or shallow sliding. Measures should be taken to limit the effects of wet–dry cycling on slopes.

6.2. Prospect

(1) The slope stability analysis conducted in this study employs a simplified homogeneous model. Although this approach is adequate for illustrating the general impacts of the wet–dry cycle, it may fail to fully encompass the intricacies of real-world slopes, which typically exhibit non–homogeneous soil characteristics and diverse hydrological conditions. In subsequent targeted research endeavors, the precision of single-slope, single-model analyses can be emphasized to inform the practice of one-slope, one-model approaches.
(2) Throughout the study, we investigated the multi-scale degradation effects of sandy red clay under wet–dry cycles and their influence on slope stability. To highlight the dominant role of wet–dry cycles in the process of property degradation, the effects of climatic conditions (e.g., rainfall intensity, temperature, etc.) were not considered. The role of environmental factors can be comprehensively discussed at a subsequent stage to quantify the interactions among temperature, rainfall intensity, chemical dissolution, and other factors.
(3) Although the research data presented in this study are centered on soils from specific regions, the developed experimental methodologies and theoretical frameworks are applicable to other soil types in different regions. Moreover, regional adaptation can be achieved by modifying specific parameters in subsequent studies.

Author Contributions

Conceptualization, W.X., Z.K. and Z.L.; methodology, W.X., Z.K. and L.J.; software, W.X. and L.J.; validation, Z.L.; formal analysis, W.X. and R.X.; investigation, L.J. and R.X.; resources, Z.L. and Z.K.; data curation, W.X. and L.J.; writing—original draft preparation, W.X.; writing—review and editing, Z.K., L.J. and R.X.; visualization, W.X., L.J. and R.X.; supervision, Z.K. and Z.L.; project administration, Z.L. and Z.K.; funding acquisition, Z.L. All authors have read and agreed to the published version of the manuscript.

Funding

This research was funded by the science and technology development project of Sinohydro Foundation Engineering Co., Ltd. (Tianjin, China), evaluation of rapid excavation of slope cut-off wall in complex geological background area and treatment technology of mud and water inrush in tunnel engineering (Grant No. 2022530103001936), the science and technology development project of Southwest Pipeline Co., Ltd. (Chengdu, China), research on hydraulic protection and soil and water conservation of oil and gas pipelines passing through fully weathered granite areas (Grant No. KKK0201921153), the Key Research and Development Plan of Yunnan Province (Kunming, China), and the technology of the comprehensive risk assessment of the earthquake catastrophe and the disaster chains in Yunnan and its application (Grant No. 202203AC100003).

Institutional Review Board Statement

Not applicable.

Informed Consent Statement

Not applicable.

Data Availability Statement

The experimental data presented in this paper are available upon request from the corresponding author.

Acknowledgments

We are sincerely thankful to the editors and reviewers for reviewing papers. We are also very grateful to our colleagues on the team who supported the implementation of this project.

Conflicts of Interest

Author Zhenguo Liu, Lu Jing and Rui Xiao were employed by the company Sinohydro Foundation Engineering Co., Ltd. The remaining authors declare that the research was conducted in the absence of any commercial or financial relationships that could be construed as a potential conflict of interest.

References

  1. Gao, M.Y.; Ji, F.; Hong, Z.-S.; Shi, X.S. Changing law of permeability coefficient during compression for reconstituted sandy clays. Mar. Georesour. Geotechnol. 2024, 42, 1651–1659. [Google Scholar] [CrossRef]
  2. Shi, X.S.; Zhao, J.; Gao, Y. A homogenization-based state-dependent model for gap-graded granular materials with fine-dominated structure. Int. J. Numer. Anal. Methods Geomech. 2021, 45, 1007–1028. [Google Scholar] [CrossRef]
  3. Zeng, Y.; Shi, X.; Xiong, H.; Chen, W.; Bian, X. Elastoplastic modeling of sandy clays based on equivalent void ratio concept. Int. J. Geomech. 2023, 23, 04023123. [Google Scholar] [CrossRef]
  4. He, F.; Tan, S.; Liu, H. Mechanism of rainfall induced landslides in Yunnan Province using multi-scale spatiotemporal analysis and remote sensing interpretation. Microprocess. Microsyst. 2022, 90, 104502. [Google Scholar] [CrossRef]
  5. Zhao, X.; Li, G.; Zhao, Z.-F.; Li, C.-X.; Chen, Q.; Ye, X. Identifying the spatiotemporal characteristics of individual red bed landslides: A case study in Western Yunnan, China. J. Mt. Sci. 2022, 19, 1748–1766. [Google Scholar] [CrossRef]
  6. Pejon, O.J.; Zuquette, L.V. Analysis of cyclic swelling of mudrocks. Eng. Geol. 2002, 67, 97–108. [Google Scholar] [CrossRef]
  7. Estabragh, A.R.; Moghadas, M.; Javadi, A.A. Effect of different types of wetting fluids on the behaviour of expansive soil during wetting and drying. Soils Found. 2013, 53, 617–627. [Google Scholar] [CrossRef]
  8. Basma, A.A.; Al-Homoud, A.S.; Malkawi, A.I.H.; Al-Bashabsheh, M.A. Swelling-shrinkage behavior of natural expansive clays. Appl. Clay Sci. 1996, 11, 211–227. [Google Scholar] [CrossRef]
  9. Guo, P.; Wang, Y.; Zhang, X.; Ma, X.; Deng, S.; Qiu, Y. Investigation on elastic–plastic deformation and mechanical failure of varied-moisture expansive soil subjected to dry–wet cycles. Environ. Earth Sci. 2024, 83, 433. [Google Scholar] [CrossRef]
  10. Chaosheng, T.; Bin, S. Swelling and shrinkage behaviour of expansive soil during wetting-drying cycles. Chin. J. Geotech. Eng. 2011, 33, 1376–1384. [Google Scholar]
  11. Jury, W.A.; Horton, R. Soil Physics; John Wiley & Sons: Hoboken, NJ, USA, 2004. [Google Scholar]
  12. Xu, J.; Li, Y.; Ren, C.; Lan, W. Damage of saline intact loess after dry-wet and its interpretation based on SEM and NMR. Soils Found. 2020, 60, 911–928. [Google Scholar]
  13. Chen, X.; He, P.; Qin, Z. Damage to the microstructure and strength of altered granite under wet–dry cycles. Symmetry 2018, 10, 716. [Google Scholar]
  14. Niu, Z.-L.; Xu, J.; Li, Y.-F.; Wang, Z.-F.; Wang, B. Strength deterioration mechanism of bentonite modified loess after wetting–drying cycles. Sci. Rep. 2022, 12, 3130. [Google Scholar] [CrossRef] [PubMed]
  15. Zhang, Z.; Bao, W.; Tian, L.; Huang, Z.; Chen, R. Study on the effect of pore structure changes induced by freeze-thaw-wetting-drying cycles on water retention characteristics of compacted loess. Constr. Build. Mater. 2024, 455, 139213. [Google Scholar]
  16. Ni, W.-K.; Yuan, K.-Z.; Lü, X.-F.; Yuan, Z.-H. Comparison and quantitative analysis of microstructure parameters between original loess and remoulded loess under different wetting-drying cycles. Sci. Rep. 2020, 10, 5547. [Google Scholar]
  17. Xie, Y.; Zhang, B.; Liu, B.; Zeng, Z.; Zhang, Y.; Zheng, Y. Shrinkage cracking and strength deterioration of red clay under cyclic drying and wetting. Alex. Eng. J. 2022, 61, 2574–2588. [Google Scholar] [CrossRef]
  18. Liu, Y.; Dai, F. A review of experimental and theoretical research on the deformation and failure behavior of rocks subjected to cyclic loading. J. Rock Mech. Geotech. Eng. 2021, 13, 1203–1230. [Google Scholar]
  19. Zaidi, M.; Ahfir, N.-D.; Alem, A.; Taibi, S.; El Mansouri, B.; Zhang, Y.; Wang, H. Use of X-ray computed tomography for studying the desiccation cracking and self-healing of fine soil during drying–wetting paths. Eng. Geol. 2021, 292, 106255. [Google Scholar] [CrossRef]
  20. Tang, C.-S.; Cui, Y.-J.; Shi, B.; Tang, A.-M.; Liu, C. Desiccation and cracking behaviour of clay layer from slurry state under wetting–drying cycles. Geoderma 2011, 166, 111–118. [Google Scholar]
  21. Zhou, R.; Wang, B.-T.; Han, S.-Y.; Wang, D.-Y.; Zhang, F.-H. Mechanisms of crack development and strength deterioration in compacted expansive soils under controlled wetting-drying conditions. Eng. Fail. Anal. 2024, 159, 108133. [Google Scholar]
  22. Yun, C.; Chan-fu, W.; Geng, N. Effect of wetting and drying cycles on shear strength of karst red clay. Rock Soil Mech. 2017, 38, 191–196. [Google Scholar]
  23. Gu, D.; Liu, H.; Gao, X.; Huang, D.; Zhang, W. Influence of cyclic wetting–drying on the shear strength of limestone with a soft interlayer. Rock Mech. Rock Eng. 2021, 54, 4369–4378. [Google Scholar]
  24. Noor-E-Khuda, S. Influence of wetting–drying cycles on compressive and flexural strength of cement mortar and CFRP-mortar bond strength. Constr. Build. Mater. 2021, 271, 121513. [Google Scholar] [CrossRef]
  25. Hua, W.; Dong, S.; Li, Y.; Xu, J.; Wang, Q. The influence of cyclic wetting and drying on the fracture toughness of sandstone. Int. J. Rock Mech. Min. Sci. 2015, 78, 331–335. [Google Scholar]
  26. Zhang, J.J.; Guang, Z. Study of the Fissures, Volume Change and Permeability of Expansive Soil Under Wetting and Drying Cycles. Ph.D. Thesis, South China University of Technology, Guangzhou, China, 2010. [Google Scholar]
  27. Bai, Y.; Ye, W.; Wu, Y.; Chen, Y. Multiscale analysis of the strength deterioration of loess under the action of drying and wetting cycles. Adv. Mater. Sci. Eng. 2021, 2021, 6654815. [Google Scholar]
  28. Qin, Y.; Li, G.; Chen, X.; Fan, K. Study on shear strength and structure of Malan loess under wetting–drying cycles. Arab. J. Geosci. 2021, 14, 2854. [Google Scholar]
  29. Huihui, X.; Zhenhao, X.; Qingbing, L.; Guiyang, H. Evolution of peak and residual strengths of weakly expansive soils under wet-dry cyclic paths. Geotechnical 2019, 40 (Suppl. S1), 245–252. [Google Scholar]
  30. Estabragh, A.; Parsaei, B.; Javadi, A. Laboratory investigation of the effect of cyclic wetting and drying on the behaviour of an expansive soil. Soils Found. 2015, 55, 304–314. [Google Scholar]
  31. Chai, Z.Y.; Zhang, P.; Guo, J.Q.; Kang, T.H. Swelling anisotropy and cyclic swelling-shrinkage of argillaceous rock. Rock Soil Mech. 2014, 35, 347–350. [Google Scholar]
  32. Tian, B.G.; Cheng, Q.; Tang, C.S.; Shi, B. Healing behaviour of desiccation cracks in a clayey soil subjected to different wetting rates. Eng. Geol. 2022, 313, 106973. [Google Scholar]
  33. Zhang, Y.; Lu, J.; Han, W.; Xiong, Y.; Qian, J. Effects of moisture and stone content on the shear strength characteristics of soil-rock mixture. Materials 2023, 16, 567. [Google Scholar] [CrossRef] [PubMed]
  34. Kang, Q.; Xia, Y.; Li, X.; Zhang, W.; Feng, C. Study on the effect of moisture content and dry density on shear strength of silty clay based on direct shear test. Adv. Civ. Eng. 2022, 2022, 2213363. [Google Scholar] [CrossRef]
  35. Wang, Q.; Zhou, Y.; Su, W.; Xie, J.; Xu, Y.; Liu, Y.; Ye, W. Study on the disintegration characteristics of expansive stiff clay: With consideration of expansion-disintegration interaction. Bull. Eng. Geol. Environ. 2024, 83, 446. [Google Scholar] [CrossRef]
  36. Chen, L.; Lu, L. Investigation on the characteristics of volumetric change during the wet-dry cycle of the soil. Chin. J. Undergr. Space Eng. 2013, 9, 229–235. [Google Scholar]
  37. Chaosheng, T.; Cui, Y.; Tang, A.M.; Shi, B. Volumetric shrinkage characteristics of soil during drying. Chin. J. Geotech. Eng. 2011, 33, 1271–1279. [Google Scholar]
  38. Leng, T.; Tang, C.; Xu, D.; Li, Y.; Zhang, Y.; Wang, K.; Shi, B. Advance on the engineering geological characteristics of expansive soil. J. Eng. Geol. 2018, 26, 112–128. [Google Scholar]
  39. Akgün, H.; Türkmenoğlu, A.G.; Kelam, A.A.; Yousefi-Bavil, K.; Öner, G.; Koçkar, M.K. Assessment of the effect of mineralogy on the geotechnical parameters of clayey soils: A case study for the Orta County, Çankırı, Turkey. Appl. Clay Sci. 2018, 164, 44–53. [Google Scholar] [CrossRef]
  40. Zhu, H.; Zhang, Y.; Li, Z.; Xue, X. Study on crack development and micro-pore mechanism of expansive soil improved by coal gangue under drying–wetting cycles. Materials 2021, 14, 6546. [Google Scholar] [CrossRef]
  41. Zhou, Z.; Cai, X.; Cao, W.; Li, X.; Xiong, C. Influence of water content on mechanical properties of rock in both saturation and drying processes. Rock Mech. Rock Eng. 2016, 49, 3009–3025. [Google Scholar] [CrossRef]
  42. Wu, K.; Zhao, C.; Zhang, W.; Wu, H.; Wang, Y.; Yu, Y. Swelling-shrinking characteristics and irreversible deformation of expansive soil during wetting-drying cycles. J. Harbin Inst. Technol. 2016, 48, 121–127. [Google Scholar]
  43. Qi, J.; Vermeer, P.A.; Cheng, G. A review of the influence of freeze-thaw cycles on soil geotechnical properties. Permafr. Periglac. Process. 2006, 17, 245–252. [Google Scholar] [CrossRef]
  44. Zienkiewicz, O.C.; Humpheson, C.; Lewis, R.W. Associated and non-associated visco-plasticity and plasticity in soil mechanics. Geotechnique 1975, 25, 671–689. [Google Scholar]
  45. Lin, P.; Liu, X.; Hu, S.; Li, P. Large deformation analysis of a high steep slope relating to the Laxiwa Reservoir, China. Rock Mech. Rock Eng. 2016, 49, 2253–2276. [Google Scholar]
  46. Griffiths, D.V.; Fenton, G.A. Probabilistic slope stability analysis by finite elements. J. Geotech. Geoenviron. Eng. 2004, 130, 507–518. [Google Scholar]
  47. Matsui, T.; San, K.C. Finite element slope stability analysis by shear strength reduction technique. Soils Found. 1992, 32, 59–70. [Google Scholar]
  48. Gupta, V.; Bhasin, R.K.; Kaynia, A.M.; Kumar, V.; Saini, A.S.; Tandon, R.S.; Pabst, T. Finite element analysis of failed slope by shear strength reduction technique: A case study for Surabhi Resort Landslide, Mussoorie township, Garhwal Himalaya. Geomat. Nat. Hazards Risk 2016, 7, 1677–1690. [Google Scholar]
  49. Dong, Y.; Liao, Z.; Wang, J.; Liu, Q.; Cui, L. Potential failure patterns of a large landslide complex in the Three Gorges Reservoir area. Bull. Eng. Geol. Environ. 2023, 82, 41. [Google Scholar] [CrossRef]
  50. Yin, Z.; Yuan, J.; Wei, J.; Cao, X.; Liu, H.; Xu, B. Influences of fissures on slope stability of expansive soil. Chin. J. Geotech. Eng. 2012, 34, 2155–2161. [Google Scholar]
  51. Zhou, J.; Xu, H.-Z.; Hu, W.-J. Impact of wetting-drying cycle effects on stability of expansive soil slopes. Chin. J. Geotech. Eng. 2013, 35, 152–156. [Google Scholar]
  52. Peng, X.; Li, J.; Li, Y.; Jiang, J. Slope instability judgment criteria in FEM based on strength reduction method. In Proceedings of the 2020 5th International Conference on Materials Science, Energy Technology and Environmental Engineering, Shanghai, China, 7–9 August 2020; IOP Publishing: Bristol, UK, 2020; Volume 571, p. 012104. [Google Scholar]
  53. Zhang, H.; Yang, J.; Wang, L.; Xu, Y.; Lan, S.; Luo, J.; Chang, Z. Experimental and numerical investigation on failure mechanism of expansive soil subgrade slope. Sci. Rep. 2023, 13, 19795. [Google Scholar]
  54. Wang, H.; Wang, Y.; Jin, F. Stability of Expansive Soil Slopes under Wetting–Drying Cycles Based on the Discrete Element Method. Water 2024, 16, 861. [Google Scholar] [CrossRef]
  55. Li, T.; Chen, G. Analysis of factors influencing anti-slip pile support in tunnel landslide systems for tunnels with different burial depths. Transp. Geotech. 2023, 42, 101079. [Google Scholar] [CrossRef]
  56. Gao, J.; Zhang, H.; Xie, X.; Zhang, Y. Study on the mechanical properties and microstructure of geogrid under different materials and temperatures. Fibers Polym. 2023, 23, 1753–1762. [Google Scholar]
  57. Ma, J.; Liu, X.; Yuan, S.; Xu, J.; Chen, F.; Yang, X. Multi-scale investigation on curing time effect of lime stabilized red mudstone as fill material for high-speed railway subgrade. Constr. Build. Mater. 2024, 443, 137749. [Google Scholar] [CrossRef]
  58. Lin, G.; Liu, W.; Zhao, J.; Fu, P. Experimental investigation into effects of lignin on sandy loess. Soils Found. 2023, 63, 101359. [Google Scholar]
Figure 1. Experimental process and associated equipment.
Applsci 15 04085 g001
Figure 2. (a) Water content of sample in wet–dry cycles; (b) time of wet–dry cycles.
Applsci 15 04085 g002
Figure 3. (a) Sample volume change; (b) sample image; (c) absolute expansion rate and absolute shrinkage rate; (d) relative expansion rate and relative shrinkage rate.
Applsci 15 04085 g003
Figure 4. SEM images: (a) N = 0; (b) N = 5.
Applsci 15 04085 g004
Figure 5. XRD test results of sandy red clay under cycles.
Applsci 15 04085 g005
Figure 6. Flowchart of crack image processing.
Applsci 15 04085 g006
Figure 7. (a) Crack image; (b) relationship between crack width and N; (c) relationship between crack ratio and N.
Applsci 15 04085 g007
Figure 8. (a) Stress–strain curves of sandy red clay; (b) relationship between shearing strength and N; (c) relationship between shear strength index and N.
Applsci 15 04085 g008
Figure 9. Degradation mechanism: (a-1, a-2, a-3) microscale; (b-1, b-2, b-3) mesoscale.
Applsci 15 04085 g009
Figure 10. (a) Geometric model of slope; (b) numerical model of slope; (c) PEMAG of slope.
Applsci 15 04085 g010
Figure 11. (a) Relationship between U and Fr; (b) relationship between Fv and N.
Applsci 15 04085 g011
Table 1. Essential physical properties of sandy red clay.
Sampling Depth/mNatural Density/g·cm−3Natural Water ContentNatural Dry Density/g·cm−3
4–62.0318.1%1.72
Table 2. Physical parameters of soil in the model.
ZoneModulus of Deformation
/(kpa)
Internal Friction Angle/(°)Cohesion
/(kpa)
Volume Weight
/(kN/m3)
Poisson’s Ratio
Zone I010524.5048.420.30.30
110524.1044.620.30.30
210523.8636.820.30.30
310523.8428.820.30.30
410524.0525.720.30.30
510523.4624.420.30.30
Zone II10524.5048.420.30.30
Disclaimer/Publisher’s Note: The statements, opinions and data contained in all publications are solely those of the individual author(s) and contributor(s) and not of MDPI and/or the editor(s). MDPI and/or the editor(s) disclaim responsibility for any injury to people or property resulting from any ideas, methods, instructions or products referred to in the content.

