Abstract
In shield tunnel engineering, longitudinal slopes and other complex alignments are commonly encountered. Given the uneven stress distribution in the soil ahead of the tunnel face during excavation, studying and understanding the instability mechanisms of the excavation face is particularly crucial. In this study, a visualized transparent soil test was designed to investigate shield tunneling along a longitudinal slope. The displacement patterns of the soil in front of the excavation face were analyzed in detail. Furthermore, FLAC3D numerical simulations were employed to examine the variations in the ultimate support ratio and vertical stress of the soil under different slope conditions. The reliability of the results was also validated. The research findings reveal the stability characteristics of the excavation face and its influencing factors during shield tunneling at different slope angles. These findings provide a scientific basis for the design of shield tunnels with longitudinal slopes. The results of the study indicate that (1) the maximum destabilization width of the soil with slope i = 15% is increased by 18.2% and 36.8% compared to that with slope i = 0% and −15%, respectively; (2) the ultimate support force, as well as the horizontal and vertical displacements of the excavation face, increase significantly under an upward slope condition (i > 0) compared to those in a horizontal tunnel (i = 0) and a downward slope (i < 0); and (3) the longitudinal slope gradient i is negatively correlated with the inflection point depth, meaning that steeper slopes result in shallower loosening zone depths.
1. Introduction
As urbanization continues to accelerate, major infrastructure projects such as urban rail transit and road tunnels are being constructed at an increasingly rapid pace. In densely developed urban core areas, subway tunnel networks are highly concentrated, and the shallow underground space has been largely occupied by various existing underground structures, imposing significant constraints on underground construction. To avoid existing tunnels, pile foundations, and other underground structures, many shield tunnels must be excavated under challenging conditions, including large longitudinal slopes [1]. For instance, the section between Sanyuan Station and Wuxi Railway Station features a maximum longitudinal slope of 2.8% on Wuxi Metro Line 3, and The Rogfast Tunnel, currently under construction in Rogaland County, southwestern Norway, features a maximum longitudinal slope of approximately 5%. During shield tunneling in longitudinally sloped tunnels, the soil in front of the excavation face is subjected to uneven stress distributions and other destabilizing factors. Therefore, studying the instability and deformation mechanisms of the excavation face in shield tunnels with longitudinal slopes is of critical importance [2,3,4].
Both Chinese and international researchers have conducted extensive studies on the instability and deformation of soil at the excavation face of shield tunnels using various methodologies, including theoretical analysis, numerical simulations, and physical experiments. These studies have yielded significant insights, contributing to a deeper understanding of excavation face stability.
Qarmout et al. [5] introduced the Kinematical Element Method (KEM) as an analytical tool for tunnel face stability assessment. Compared to traditional limit analysis, KEM offers improved flexibility in representing 3D failure mechanisms and allows for automatic optimization of collapse surfaces. De Buhan et al. [6] proposed an effective coupling of seepage force estimation and upper bound limit analysis, enabling realistic stability evaluation for tunnels driven under the water table. Zou et al. [7] proposed an improved wedge prism model based on the limit equilibrium approach, along with an enhanced three-dimensional rotational failure model derived from the limit analysis method. Han et al. [8] proposed a novel instability mechanism for the shield excavation face based on the limit analysis method, considering the complete tunnel surface. Their approach enhanced the optimal available solution for collapse pressure.
Dias et al. [9] conducted three-dimensional finite element simulations to analyze tunnel face stability, demonstrating that numerical approaches can accurately capture progressive failure mechanisms and provide realistic estimates of minimum support pressures. Li et al. [10] employed the finite difference software FLAC3D to investigate the stability of the excavation face in deep-buried sandy tunnels, obtaining the ultimate support pressure under different internal friction angles and burial depths. Fernández et al. [11] investigated tunnel face collapse using Numerical Limit Analysis (NLA) and the Material Point Method (MPM), showing both methods accurately predict failure mechanisms and minimum support pressures, with MPM enabling detailed simulation of the post-collapse run-out process. Chen et al. [12] applied the discrete element software PFC3D to analyze the instability and failure process of tunnel excavation faces. Their findings revealed that as the burial depth ratio (C/D) increased, the ultimate support pressure initially increased and then gradually stabilized.
Wang et al. [13] conducted large-scale model tests to investigate the stability of the excavation face in Earth Pressure Balance (EPB) shield tunneling within multi-layered foundations. The results indicate that interlayer interactions in multi-layered foundations influence the extent of the disturbed zone, particularly at soft–hard interfaces, where the disturbance mode becomes more complex, leading to localized shear failure. Idinger et al. [14] conducted centrifuge model tests to investigate tunnel face stability in dry sand under different overburden-to-diameter ratios. Using DIC-based measurement, the failure mechanism was characterized by a double slip surface and chimney-shaped collapse. Ahmed and Iskander [15] conducted transparent soil model tests to investigate tunnel face stability in saturated sand, and the observed failure developed as a chimney-shaped zone extending from the tunnel face to the surface under shallow cover conditions. Senent Domínguez et al. [16] conducted small-scale physical model tests to study the stability of tunnel faces in dry sand. Their results showed that dense sand exhibited abrupt, localized settlements after a delay, while loose sand experienced gradual settlement from the beginning of face retraction, highlighting the influence of soil density on collapse mechanisms. Kirsch [17] conducted a series of small-scale physical model tests to investigate the face stability of shallow tunnels in dry sand. The study revealed that the initial sand density significantly influences failure mechanisms, while support pressures showed limited sensitivity to overburden depth.
Huo et al. [18] employed an EPB shield model to simulate the shield tunneling process and ground collapse. Their findings revealed that low-moisture-content sandy soil is prone to stepwise collapse under shield-induced disturbances.
Transparent soil materials, due to their similar physical and mechanical properties to natural sand and clay [15], provide an ideal experimental approach for visualizing internal soil deformation in model tests. By integrating Digital Image Correlation (DIC) and Particle Image Velocimetry (PIV), transparent soil enables high-resolution tracking and analysis of soil displacement and strain evolution [19,20,21,22]. Ma et al. [20] conducted a systematic study on the stability of the excavation face in shield tunneling within clay and composite clay–gravel strata using a three-dimensional transparent soil model test. By employing Computed Tomography (CT) scanning technology and a three-dimensional reconstruction program, they accurately captured the three-dimensional soil deformation in the excavation face instability region. Zhang et al. [21] conducted instability model tests of shield tunnel excavation faces using transparent clay, combined with Particle Image Velocimetry (PIV) techniques. Their analysis revealed that the soil slippage in front of the excavation face exhibits a ‘basin-shaped’ failure pattern, which differs from the traditional wedge or prism-shaped failure modes described in conventional models.
The current research on tunnel excavation face stability, both in China and internationally, has primarily focused on the instability mechanisms of excavation faces in horizontal tunnels. However, studies specifically addressing shield tunnel excavation faces under longitudinal slope conditions remain relatively limited. Mollon et al. [23] investigated the pitch angle of shield tunneling in steep slope construction, analyzing the interaction forces between the shield machine and the surrounding soil. They proposed a three-dimensional limit equilibrium analysis method specifically for longitudinal slopes. Cheng et al. [24], through a combination of experimental studies and theoretical analysis, concluded that as the longitudinal slope angle increases, the risk of soil instability ahead of the excavation face rises, accompanied by changes in the failure mode. Weng et al. [25] focused on the impact of groundwater seepage on excavation face stability. Their analysis revealed that a high groundwater level reduces excavation face stability, and seepage effects may exacerbate soil instability.
Although previous studies have extensively examined excavation face stability in horizontal shield tunnels, the effects of longitudinal slope variations remain insufficiently explored. This study aims to bridge this gap by employing transparent soil modeling and FLAC3D numerical simulations to quantify the destabilization process under varying slope conditions. Specifically, a series of longitudinal slope gradients were introduced to simulate realistic tunnel inclinations encountered in engineering practice. In the transparent soil tests, three slope configurations were adopted: i = −15%, 0%, and 15%. The numerical simulations further expanded the range by including i = −7.5% and 7.5%, resulting in a total of five slope scenarios.
Through transparent soil tests, the displacement characteristics of the soil in front of the excavation face were captured using the PIV method. Numerical simulations were further employed to analyze the ultimate support force of the excavation face, ground surface displacement, and stress variations in the soil ahead of the excavation. This research aims to elucidate the influence mechanism of slope variations on excavation face stability, providing experimental insights and data support for the design and construction of longitudinal slope shield tunnels.
2. Materials and Methods for Longitudinal Slope Shield Tunneling
This section introduces the experimental and numerical methods employed to investigate excavation face stability in longitudinal slope shield tunnels. Both transparent soil model tests and 3D numerical simulations were conducted to analyze displacement patterns and support requirements under varying slope conditions.
2.1. Transparent Soil Model Test for Longitudinal Slope Shield Tunneling
2.1.1. Transparent Soil Materials
The transparent soil model test was designed to visualize soil deformation and failure mechanisms in front of the excavation face. Details of the test setup, materials, and loading procedures are presented below.
In this study, transparent soil was prepared using fused silica sand mixed with a pore solution. Fused silica sand with a particle size distribution ranging from 0.5 to 1.0 mm was used to simulate sandy soil [21,22]. The pore solution consisted of a mixture of No. 15 white oil and n-dodecane. Different mass ratios of No. 15 white oil and n-dodecane were prepared in a beaker with a thickness of 10 cm to determine the optimal visibility. The results showed that at a room temperature of 25 °C [20], the optimal visual transparency was achieved when the mass ratio of n-dodecane to No. 15 white oil was 1:5.2. These values were obtained from prior laboratory tests conducted by our research team using the same transparent soil material. The physical properties of the transparent soil material, obtained from previous experiments, are summarized in Table 1.

Table 1.
Physical properties of the transparent soil material.
2.1.2. Test Equipment
The core components of the test system include (1) the model box system and (2) the optical observation and post-processing system. The test setup is illustrated in Figure 1. The model box system consists of a model box, a platform, and a shield model. The model box has overall dimensions of 300 mm (length) × 240 mm (width) × 400 mm (height) and is constructed from 5 mm thick acrylic glass. A hole is reserved on the central axis of the front face of the model box, positioned 160 mm above the bottom. A four-hole flange is used to secure the model shield, allowing the metal pusher to move freely forward and backward through the center of the isolation plate. The tunnel is externally connected to the platform’s power equipment, with a lubricating oil seal ensuring proper sealing during the slow advancement of the pusher. The platform serves to secure both the model box and the power unit. The power equipment consists of a turbine reducer driven by a servomotor, providing stable propulsion at different speed levels with a displacement accuracy of 0.1 mm.
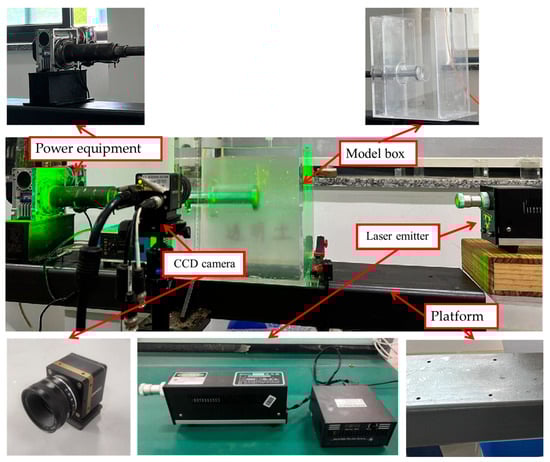
Figure 1.
Schematic diagram of the model test.
The shield model features a nested two-layer casing design, where the inner tube represents the shield tunnel lining and the outer tube represents the shield machine shell. The outer diameter of the inner tube is 65 mm, while that of the outer tube is 75 mm. In the experiment, the backward movement of the inner tube is used to simulate the active failure of the soil at the excavation face. The puller provides horizontal backward displacement, and with the restriction of the outer tube and the design of the slide rail, the inner tube can be restricted to carry out the ideal up and down displacement, and finally realize the inclined displacement with a specific slope; the schematic diagram of the shield model is shown in Figure 2. To facilitate a clearer analysis of the excavation face stability under different slope conditions, the slopes were set to i = −15%, 0%, and 15%. Here, i represents the longitudinal slope gradient of the tunnel excavation face, where i > 0 denotes an upward (elevated) slope and i < 0 denotes a downward (pitched) slope.
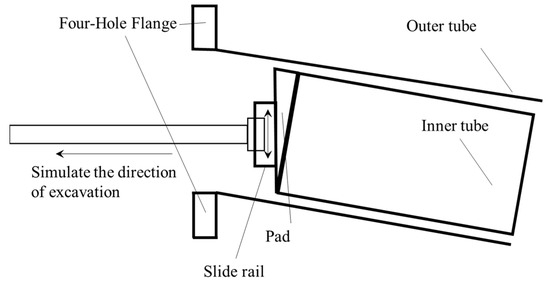
Figure 2.
Schematic diagram of the shield machine model.
The optical observation and post-processing system consists of a laser emitter, a CCD industrial camera, and the Particle Image Velocimetry (PIV) software MicroVec V3. A speckle field is generated by irradiating the transparent soil with the laser beam emitted from the laser emitter. The CCD industrial camera continuously captures the speckle field images during the test to monitor soil displacement.
A CCD camera (model: ICL-B2520M-SC000) was used in this experiment for image acquisition. The camera features a resolution of 2448 × 2050 pixels and a maximum frame rate of 16 frames per second (fps), and is equipped with a lens with a focal length of 25 mm and a maximum aperture of f/1.4. The laser emitter used in this experiment was a model EP532-3W, as shown in Figure 1. It emits a laser beam with a wavelength of 535 nm. The laser features a spectral linewidth of less than 0.1 nm, and the thickness of the laser sheet generated for the test ranged from 0.5 mm to 1 mm.
MicroVec V3 software was employed to perform post-processing on the speckle images. The system captures particle images at two time steps (t0 and t0 + Δt) and performs cross-correlation analysis to calculate the average displacement of particles within predefined subregions of the images. This enables the derivation of the 2D displacement field of the soil in the observed section. The analysis principle is illustrated in Figure 3.
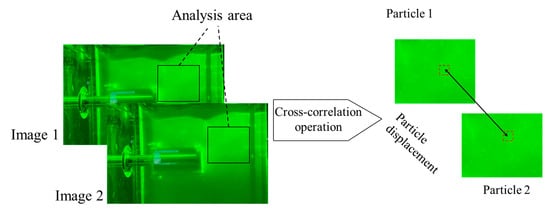
Figure 3.
Schematic diagram of MicroVec V3 software calculation principle.
2.1.3. Test Procedure and Working Conditions
During the test, the servo motor drives the piston at the excavation face to gradually retract, simulating the reduction in support force and inducing soil instability. The optical observation and post-processing system is used to compute soil displacement variations, generating a displacement contour map.
The experimental procedure is as follows: (1) The pore solution was prepared by mixing n-dodecane and white oil in the ratio specified in Section 2.1. This solution was then poured into the model container. Subsequently, washed fused silica sand was gradually added into the liquid while gently stirring with a glass rod to minimize air bubble formation. The prepared transparent soil was then placed in a dark, temperature-controlled environment and left undisturbed for 24 h to ensure the mixture reached a stable and uniform state, suitable for subsequent experimental observation. (2) After the transparent soil had settled, the camera and laser system were installed and securely fixed. Prior to image acquisition, the camera aperture, focal length, and laser intensity were fine-tuned to ensure a clear and complete speckle field. (3) The power equipment was set to retract at a rate of 1 mm/min, while the camera was simultaneously activated to capture the deformation process. As the primary objective of this study is to investigate the influence of longitudinal slope gradients on excavation face stability, the displacement rate was kept constant across all tests to isolate the effect of slope. While displacement rate may influence strain rate-sensitive soils, the transparent soil used in this experiment has relatively low rate sensitivity, and the slow rate of 1 mm/min is consistent with quasi-static testing conditions commonly used in similar studies. Therefore, the influence of displacement speed on the results is considered negligible in this context. (4) The captured laser speckle images were processed by selecting the pixel range to extract the target region. The extracted images were then analyzed using MicroVec V3 software for further image processing.
In this experiment, a case with C/D = 1 was selected to investigate the displacement variation of cross-sections under different slopes and support plate positions. A bivariate control method was employed. The slope conditions were set to i = −15%, 0%, and 15%, while the setback amounts were set to S = 3 mm, 6 mm, and 9 mm. Using an orthogonal combination test design, the three slope conditions were paired with the three setback conditions, resulting in a total of nine test scenarios. The complete test matrix is summarized in Table 2, and the experimental layout is illustrated in Figure 4. (C represents the tunnel burial depth, D represents the tunnel outer diameter, and S represents the setback amount.)
Table 2.
Summary of test conditions.
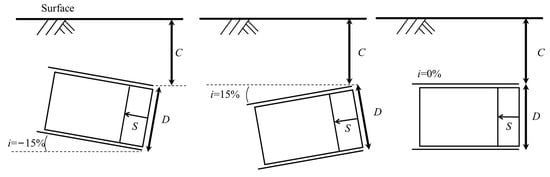
Figure 4.
Schematic of conditions.
2.2. Numerical Simulation Analysis of Longitudinal Tunnel
This section describes the construction of a three-dimensional FLAC3D model used to simulate the excavation process in shield tunnels with different longitudinal slopes. The numerical parameters and boundary conditions are based on the experimental configuration to ensure consistency.
2.2.1. Numerical Simulation Modeling
FLAC3D 7.0 (Fast Lagrangian Analysis of Continua in 3 Dimensions) is an explicit finite difference program widely used for geotechnical analysis of soil and rock mechanics problems. It solves the full set of governing equations of motion in a Lagrangian framework, allowing for simulation of a large strain, non-linear material behavior, and progressive failure. Compared to traditional FEM-based software, FLAC3D is more suitable for problems involving localized failure, shear band formation, and material nonlinearity. However, as an explicit solver, its time-stepping scheme requires small time increments for stability, which can limit computational efficiency for very large or stiff models. In this study, FLAC3D was selected due to its robustness in capturing the complex three-dimensional failure mechanisms associated with tunnel face instability.
To clarify the destabilization failure mode of the soil under the limit state of a longitudinal slope shield tunnel, a 3D finite element model with dimensions of 100 m (length) × 100 m (width) × 80 m (height) was established using FLAC3D software, based on the transparent soil test, as shown in Figure 5. The front, back, left, and right boundaries of the soil model were constrained in the X and Y directions, while the bottom surface was fully constrained in all three directions. The upper surface was set as a free surface at the ground level to ensure that the vertical deformation of the model was not restricted by boundary conditions.
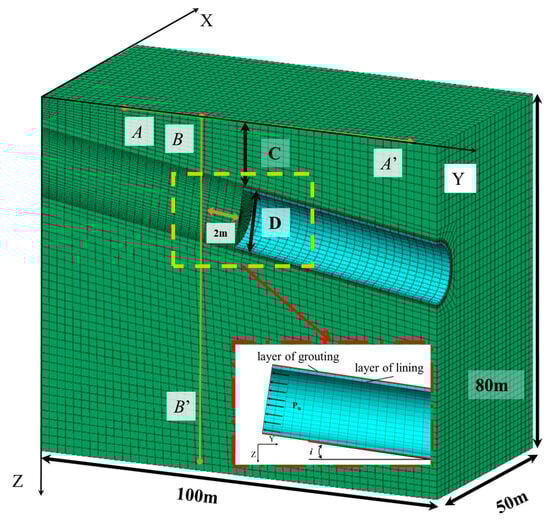
Figure 5.
Numerical simulation profile of a longitudinal tunnel.
2.2.2. Numerical Simulation Methods and Numerical Simulation Parameters
To investigate the variation of soil behavior with slope at the excavation face of a longitudinal slope tunnel, the excavation process was simplified as a full-section excavation. A lining structure was applied immediately after excavation to provide support. The soil was modeled using the Mohr–Coulomb model, with a shield radius of 6700 mm. The physical properties of each material in the model are presented in Table 3.
Table 3.
Numerical simulation parameters.
3. Results and Discussion
This section presents and discusses the results obtained from the transparent soil experiments and numerical simulations. Key observations regarding failure patterns, displacement behavior, and support pressure requirements are summarized and interpreted.
3.1. Results and Discussion of Transparent Soil Experiment
Longitudinal section displacement contour maps for slopes of i = −15%, 0%, and 15% with a setback of S = 3 were obtained from the transparent soil experiment and are presented in Figure 6a–c. Figure 6d–f present the displacement contour maps of the soil in front of the excavation face for three slope conditions at S = 6 mm. Furthermore, Figure 6g–i present the displacement contour maps of the soil in front of the excavation face for three slope conditions when S = 9 mm.
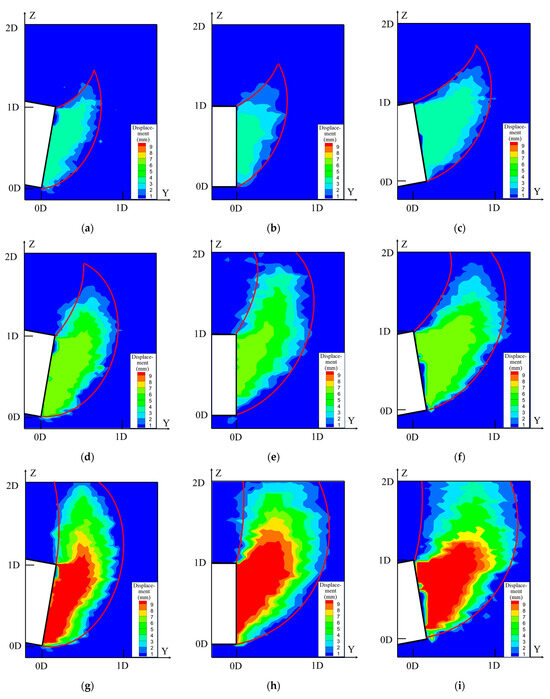
Figure 6.
Displacement nephogram diagraph of face instability process in the longitudinal section. (a) S = 3 mm i = −15%; (b) S = 3 mm i = 0%; (c) S = 3 mm i = 15%; (d) S = 6 mm i = −15%; (e) S = 6 mm i = 0%; (f) S = 6 mm i = 15%; (g) S = 9 mm i = −15%; (h) S = 9 mm i = 0%; (i) S = 9 mm i = 15%.
By analyzing the shape, direction, and extent of the displacement of the destabilized soil in front of the excavation face, it can be concluded that the destabilization process follows a consistent pattern under different slope conditions. As the inner tube retreats, the localized soil in front of and above the excavation face displaces inward. First, the localized soil in front of and above the longitudinal section of the shield tunnel is displaced inward, forming a ‘bull’s-horn’ instability pattern. This is consistent with the logarithmic helix instability model proposed by Mollon et al. [23].
As the setback S increases, the instability region of the excavation face gradually expands. As shown in Figure 6d–f, when S = 6 mm, the destabilization region of the soil maintains its shape, while the instability range in front of and above the excavation face expands. The destabilization process of the shield tunnel excavation face is essentially driven by the reduction in support force, which leads to the loosening of the soil in front of the tunnel. This, in turn, induces the upward soil to move inward toward the tunnel, continuously expanding and evolving.
As shown in Figure 6g–i, when S = 9 mm, the destabilization region extends to the ground surface, while the development rate of the destabilized soil in front of the excavation decreases. At this stage, the destabilization process is primarily characterized by a vertically upward extension of the failure zone. The destabilized zone undergoes slight horizontal expansion, but its overall shape predominantly exhibits vertical growth. Under the condition of slope i = −15%, the destabilized soil is more prone to forward sliding, exhibiting a clockwise sliding trend. In contrast, excavation at i = 15% leads to a further expansion of the destabilization region. Compared to other longitudinal slope conditions with the same setback (S), the displacement range of the soil in front of and above the excavation face increases significantly.
To facilitate a more rigorous analysis of the factors affecting excavation face stability, the evaluation method of maximum destabilization width B [24] was employed to examine the evolution of face destabilization along the longitudinal section. When the slope is i = 15% and S = 9 mm, the maximum destabilization width of the soil reaches B = 1.3D. In comparison, at i = 0% and i = −15% with S = 9 mm, the maximum width of the breakout zone is approximately 1.1D and 0.95D, respectively, indicating increases of 18.2% and 36.8% compared to the i = 0% and i = −15% conditions. For upward slope excavation, the excavation face is subjected to additional loading from the overlying soil, which exacerbates the risk of destabilization. In contrast, downward slope excavation increases the risk of passive destabilization due to the enhanced extrusion effect caused by the shield machine’s self-weight component acting on the excavation face.
3.2. Validation and Comparison of Numerical Simulation Results
The surface displacements obtained from the numerical simulation for C/D = 1, i = 0% were compared with the surface displacements extracted along line A–A′ under the corresponding conditions from the transparent soil model test, as shown in Figure 7. The experimental data were extracted along the ground surface section A–A′ under corresponding conditions using the PIV technique implemented via MicroVec V3 software. To allow comparison across different model scales, all relevant displacement and distance parameters were normalized using the tunnel diameter (D) as the reference length. The maximum surface settlement occurs within the range of 0.33D to 0.66D in front of the tunnel cross-section, while the influence range of surface settlement extends from −0.5D to 1D. Moreover, the error between the two results remains within the acceptable range. Therefore, the numerical simulation results presented in this study are considered reliable.
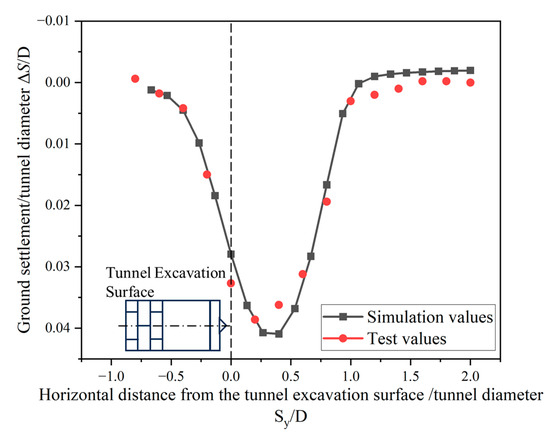
Figure 7.
Comparison of surface displacements.
3.3. Results and Discussion of Ultimate Support Ratio in Numerical Simulation Results
The changes observed in the development process of the transparent soil tests indicate that the magnitude of the support force is a critical factor in triggering the transition from local to global instability. To facilitate the description of the relationship between support pressure and excavation face stability, the support ratio is defined as λ = Pu/Pu0 [24]. In the numerical simulation, a uniformly distributed support force is applied. The support ratio is gradually reduced in a stepwise manner during each calculation cycle. After each reduction, the corresponding limit support ratio of the excavation face is determined based on the control method of the numerical simulation by detecting and recording the results. Figure 8 illustrates the relationship between the horizontal displacement (y) at the center of the excavation face and the support ratio (λ) for different burial depth ratios.
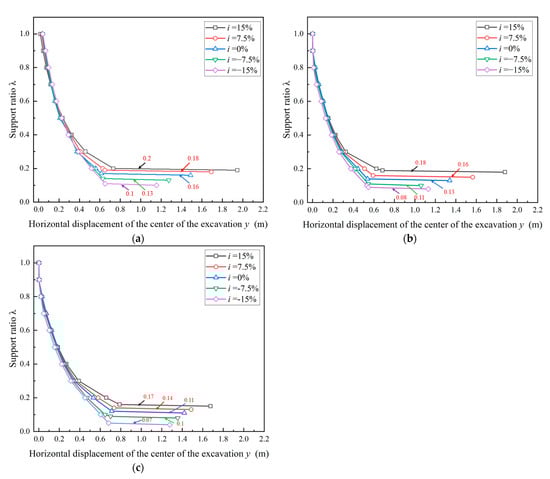
Figure 8.
Relationship between horizontal displacement y of the center of the excavation face and support ratio λ. (a) C/D = 1; (b) C/D = 2; (c) C/D = 3.
As shown in Figure 9, when the support ratio λ ranges from 1 to 0.6, the influence of slope on horizontal displacement is relatively weak, and the center displacement for different slopes tends to converge. However, as the support ratio further decreases, the effect of slope on horizontal displacement becomes more significant, specifically manifesting as an increase in the horizontal displacement at the center of the excavation face with larger slope values. Furthermore, when C/D = 3, an increase in the depth-to-diameter ratio leads to a greater magnitude of stress release, resulting in a more pronounced increase in the horizontal displacement (y) at the center of the excavation face during soil destabilization. This occurs because the reduction in the support ratio directly weakens the ability of the support structure to restrain the surrounding rock, thereby expanding the range of stress redistribution in the surrounding rock and exacerbating the deformation of the excavation face.
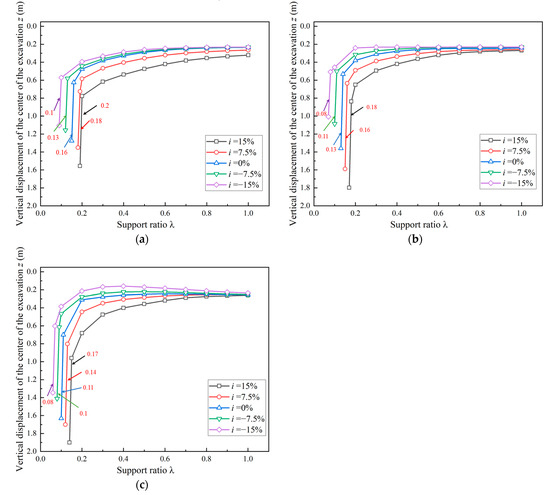
Figure 9.
Relationship between vertical displacement z of the center of the excavation face and support ratio λ. (a) C/D = 1; (b) C/D = 2; (c) C/D = 3.
Figure 9 illustrates the relationship between the vertical displacement (z) and the support ratio (λ) at the excavation face under different burial depth ratios. The study reveals that under varying burial depths, as the support ratio decreases, the slope has a significant impact on the vertical displacement at the center of the excavation face. Specifically, a larger slope results in greater vertical displacement in the soil at the excavation center, a pattern consistent with the variation of horizontal displacement at the same location. Under an upward (elevated) slope condition (i > 0), the soil at the excavation face is more prone to increased vertical displacement. This phenomenon can be attributed to the direct stress exerted by the overlying soil on the excavation face, which facilitates the downward sliding of the soil in front of the excavation.
Figure 10 illustrates the relationship between the ultimate support ratio (λlim) and the slope (i) for different burial depth ratios. For varying burial depth ratios (C/D), a clear positive correlation is observed between λlim and i. As the longitudinal slope increases, the ratio rises significantly, while the rate of increase remains approximately constant. This indicates that an increase in slope exacerbates the sliding tendency of the soil in front of the excavation, thereby reducing the stability of the surrounding soil. Consequently, greater support strength is required to counteract this sliding tendency. Furthermore, as the burial depth increases, the Mohr–Coulomb strength criterion suggests that the confining pressure effect enhances the shear strength of the soil. Additionally, the arching effect facilitates stress redistribution, thereby improving the stability of the surrounding rock.
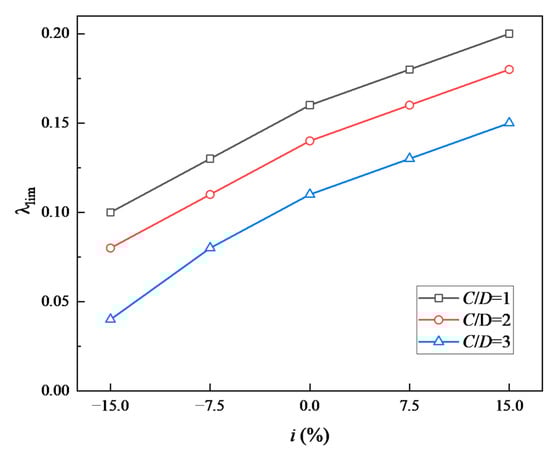
Figure 10.
Relationship between ultimate support ratio λlim and slope i.
3.4. Results and Discussion of Vertical Stresses in Numerical Simulation Results
Excavation of a shield tunnel results in stress redistribution within the surrounding soil. The vertical, horizontal, and shear stresses initially carried by the surrounding soil are released due to tunnel excavation. This sudden stress release may lead to ground subsidence or lateral deformation [26]. To better analyze the stress variations induced by shield tunnel excavation, the B–B′ line, located 2 m in front of the excavation face center, was selected to extract vertical stresses in the soil. The vertical stress distribution in the soil 2 m ahead of the tunnel excavation was then analyzed under different slope conditions, as shown in Figure 11.
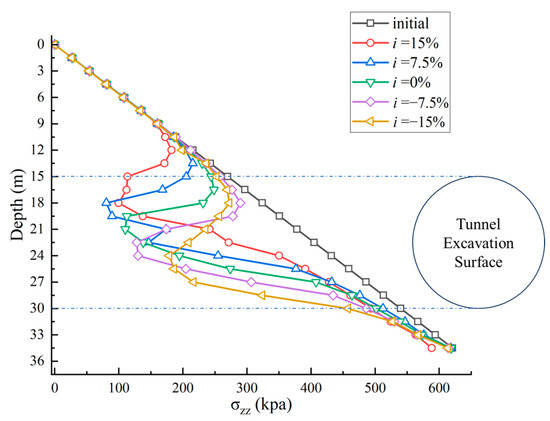
Figure 11.
Vertical stress versus depth for C/D = 1.
Under all working conditions, the variation of vertical stress exhibits a double-inflection-point characteristic: the vertical stress–depth curve demonstrates significant nonlinearity. The first inflection point occurs at a depth similar to the top of the excavation face. Below this point, vertical stress decreases sharply with increasing depth, whereas below the second inflection point, vertical stress increases as depth increases. The region between these two inflection points corresponds to the soil loosening zone. As the tunnel longitudinal slope gradient increases, the positions of both the first and second inflection points in the soil vertical stress distribution shift upward. Under an upward (elevated) slope condition (i > 0), the loosening zone of the soil, located 2 m ahead of the tunnel excavation, is positioned above the center of the excavation face. Moreover, with a larger slope gradient, the loosening zone is situated at a higher position. This observed soil displacement pattern is consistent with the results from the transparent soil test.
4. Conclusions and Future Work
The final section summarizes the key findings of the study and outlines future research directions. Practical implications for shield tunnel design in sloped conditions are also discussed.
4.1. Conclusions
In this study, a transparent soil laboratory model test of a longitudinal tunnel was conducted, combined with a three-dimensional finite element model of a longitudinal tunnel established using FLAC3D software. This work contributes to bridging the research gap in excavation face stability under longitudinal slope conditions by integrating transparent soil testing and calibrated 3D numerical modeling.
The stability of the excavation face under different slope conditions was analyzed, leading to the following conclusions:
(1) Failure Mechanism: The transparent soil test clearly illustrates the destabilization process of the soil under different slope conditions. The excavation face destabilization primarily occurs in two stages: ① The destabilized soil region in front of the excavation forms a ‘bull’s-horn-shaped’ failure zone, which expands as the excavation retreat increases. ② The destabilized region extends toward the surface, forming a failure mode dominated by vertical development. Additionally, larger longitudinal slopes (i = 15%) induce wider and more vertically developed failure zones, increasing the risk of surface disturbance.
(2) Displacement Trends: Both horizontal and vertical displacements at the excavation face increase as the support pressure decreases. Under upward slopes, these displacements are significantly higher due to additional stress from overburden soil.
(3) Support Requirements: For different burial depth ratios (C/D), the ultimate support ratio (λlim) increases significantly with increasing longitudinal slope, while the rate of increase remains approximately constant.
(4) Stress Redistribution: The variation of vertical stress exhibits a double-inflection-point characteristic. As i increases, both inflection points shift upward, leading to an elevation of the soil loosening zone in the excavation face.
4.2. Future Work
The results provide quantitative guidelines for estimating face support pressures in sloped shield tunnels, which can inform preliminary design and risk control measures in longitudinally inclined alignments. However, further in-depth analysis is still required to strengthen the theoretical understanding and to provide more robust guidance for practical engineering applications.
The validated experimental–numerical approach offers a useful framework for other practitioners studying tunnel stability under non-horizontal geometries.
As part of future work, the following aspects will be further investigated:
(1) Incorporation of theoretical analyses to better understand the influence of longitudinal slope on tunnel face stability from a mechanistic perspective;
(2) Extension of the current study to multi-layered ground conditions, examining how stratigraphic variability affects the stability of excavation faces in sloped tunnels;
(3) Detailed analysis of the soil behavior during the excavation process, including how stress redistribution and deformation evolve as the tunnel advances under inclined alignment soil interaction to better reflect complex in situ conditions in urban tunneling projects.
Author Contributions
Methodology, M.Z.; Software, S.G.; Data curation, S.G.; Writing—original draft, S.G.; Writing—review & editing, M.Z. All authors have read and agreed to the published version of the manuscript.
Funding
This research received no external funding.
Institutional Review Board Statement
Not applicable.
Informed Consent Statement
Not applicable.
Data Availability Statement
Data is contained within the article.
Conflicts of Interest
The authors declare no conflict of interest.
References
- Han, J.; Wang, J.; Cheng, C.; Zhang, C.; Liang, E.; Wang, Z.; Song, J.-J.; Leem, J. Mechanical Response and Parametric Analysis of a Deep Excavation Structure Overlying an Existing Subway Station: A Case Study of the Beijing Subway Station Expansion. Front. Earth Sci. 2023, 10, 1079837. [Google Scholar] [CrossRef]
- Jia, P.; Zhao, W.; Khoshghalb, A.; Ni, P.; Jiang, B.; Chen, Y.; Li, S. A New Model to Predict Ground Surface Settlement Induced by Jacked Pipes with Flanges. Tunn. Undergr. Space Technol. 2020, 98, 103330. [Google Scholar] [CrossRef]
- Zhang, X.; Wang, M.; Li, J.; Wang, Z.; Tong, J.; Liu, D. Safety Factor Analysis of a Tunnel Face with an Unsupported Span in Cohesive-Frictional Soils. Comput. Geotech. 2020, 117, 103221. [Google Scholar] [CrossRef]
- Chen, Y.; Tan, L.; Xiao, N.; Liu, K.; Jia, P.; Zhang, W. The Hydro-Mechanical Characteristics and Micro-Structure of Loess Enhanced by Microbially Induced Carbonate Precipitation. Geomech. Energy Environ. 2023, 34, 100469. [Google Scholar] [CrossRef]
- Qarmout, M.; König, D.; Gussmann, P.; Thewes, M.; Schanz, T. Tunnel Face Stability Analysis Using Kinematical Element Method. Tunn. Undergr. Space Technol. 2019, 85, 354–367. [Google Scholar] [CrossRef]
- De Buhan, P.; Cuvillier, A.; Dormieux, L.; Maghous, S. Face Stability of Shallow Circular Tunnels Driven under the Water Table: A Numerical Analysis. Int. J. Numer. Anal. Methods Geomech. 1999, 23, 79–95. [Google Scholar] [CrossRef]
- Zou, J.; Chen, G.; Qian, Z. Tunnel Face Stability in Cohesion-Frictional Soils Considering the Soil Arching Effect by Improved Failure Models. Comput. Geotech. 2019, 106, 1–17. [Google Scholar] [CrossRef]
- Han, K.; Wang, L.; Su, D.; Hong, C.; Chen, X.; Lin, X.-T. An Analytical Model for Face Stability of Tunnels Traversing the Fault Fracture Zone with High Hydraulic Pressure. Comput. Geotech. 2021, 140, 104467. [Google Scholar] [CrossRef]
- Dias, D.; Janin, J.-P.; Soubra, A.-H.; Kastner, R. Three-Dimensional Face Stability Analysis of Circular Tunnels by Numerical Simulations. In GeoCongress 2008: Characterization, Monitoring, and Modeling of GeoSystems; American Society of Civil Engineers: Reston, VI, USA, 2012; pp. 886–893. [Google Scholar] [CrossRef]
- Li, P.; Zou, H.; Wang, F.; Xiong, H. An Analytical Mechanism of Limit Support Pressure on Cutting Face for Deep Tunnels in the Sand. Comput. Geotech. 2020, 119, 103372. [Google Scholar] [CrossRef]
- Fernández, F.; Rojas, J.E.G.; Vargas, E.A.; Velloso, R.Q.; Dias, D. Three-Dimensional Face Stability Analysis of Shallow Tunnels Using Numerical Limit Analysis and Material Point Method. Tunn. Undergr. Space Technol. 2021, 112, 103904. [Google Scholar] [CrossRef]
- Chen, R.P.; Tang, L.J.; Ling, D.S.; Chen, Y.M. Face Stability Analysis of Shallow Shield Tunnels in Dry Sandy Ground Using the Discrete Element Method. Comput. Geotech. 2011, 38, 187–195. [Google Scholar] [CrossRef]
- Wang, J.; Feng, K.; Wang, Y.; Lin, G.; He, C. Soil Disturbance Induced by EPB Shield Tunnelling in Multilayered Ground with Soft Sand Lying on Hard Rock: A Model Test and DEM Study. Tunn. Undergr. Space Technol. 2022, 130, 104738. [Google Scholar] [CrossRef]
- Idinger, G.; Aklik, P.; Wu, W.; Borja, R.I. Centrifuge Model Test on the Face Stability of Shallow Tunnel. Acta Geotech. 2011, 6, 105–117. [Google Scholar] [CrossRef]
- Ahmed, M.; Iskander, M. Evaluation of Tunnel Face Stability by Transparent Soil Models. Tunn. Undergr. Space Technol. 2012, 27, 101–110. [Google Scholar] [CrossRef]
- Senent Domínguez, S.; García Luna, R.; Sánchez Lázaro, M.; Jiménez Rodriguez, R. Tunnel Face Stability Laboratory Tests in Sand Considering Surface Settlements. In Proceedings of the XVII European Conference on Soil Mechanics and Geotechnical Engineering|XVII European Conference on Soil Mechanics and Geotechnical Engineering, Reykjavík, Iceland, 1–6 of September 2019; E.T.S.I. Caminos, Canales y Puertos (UPM): Reykjavík, Iceland, 2019. [Google Scholar]
- Kirsch, A. Experimental Investigation of the Face Stability of Shallow Tunnels in Sand. Acta Geotech. 2010, 5, 43–62. [Google Scholar] [CrossRef]
- Huo, M.; Chen, W.; Yuan, J.; Wu, G.; Li, Y.; Liu, Y. Experimental Investigation and Limit Analysis of Shield Tunnel Face Failure Mechanism in Sand. Undergr. Space 2025, 22, 137–152. [Google Scholar] [CrossRef]
- Xiang, Y.; Liu, H.; Zhang, W.; Chu, J.; Zhou, D.; Xiao, Y. Application of Transparent Soil Model Test and DEM Simulation in Study of Tunnel Failure Mechanism. Tunn. Undergr. Space Technol. 2018, 74, 178–184. [Google Scholar] [CrossRef]
- Ma, S.; Duan, Z.; Huang, Z.; Liu, Y.; Shao, Y. Study on the Stability of Shield Tunnel Face in Clay and Clay-Gravel Stratum through Large-Scale Physical Model Tests with Transparent Soil. Tunn. Undergr. Space Technol. 2022, 119, 104199. [Google Scholar] [CrossRef]
- Zhang, W.; Zhong, H.; Xiang, Y.; Wu, D.; Zeng, Z.; Zhang, Y. Visualization and Digitization of Model Tunnel Deformation via Transparent Soil Testing Technique. Undergr. Space 2022, 7, 564–576. [Google Scholar] [CrossRef]
- Ads, A.; Iskander, M.; Bless, S.; Omidvar, M. Visualizing the Effect of Fin Length on Torpedo Anchor Penetration and Pullout Using a Transparent Soil. Ocean. Eng. 2020, 216, 108021. [Google Scholar] [CrossRef]
- Mollon, G.; Dias, D.; Soubra, A.H. Rotational failure mechanism for the face stability analysis of tunnels driven by a pressurized shield. Int. J. Numer. Anal. MethodsGeomech. 2011, 35, 1363–1388. [Google Scholar]
- Cheng, C.; Jia, P.; Zhao, W.; Ni, P.; Bai, Q.; Wang, Z.; Lu, B. Experimental and Analytical Study of Shield Tunnel Face in Dense Sand Strata Considering Different Longitudinal Inclination. Tunn. Undergr. Space Technol. 2021, 113, 103950. [Google Scholar] [CrossRef]
- Weng, X.; Sun, Y.; Yan, B.; Niu, H.; Lin, R.; Zhou, S. Centrifuge Testing and Numerical Modeling of Tunnel Face Stability Considering Longitudinal Slope Angle and Steady State Seepage in Soft Clay. Tunn. Undergr. Space Technol. 2020, 101, 103406. [Google Scholar] [CrossRef]
- Chen, C.N.; Huang, W.-Y.; Tseng, C.-T. Stress Redistribution and Ground Arch Development during Tunneling. Tunn. Undergr. Space Technol. 2011, 26, 228–235. [Google Scholar] [CrossRef]
Disclaimer/Publisher’s Note: The statements, opinions and data contained in all publications are solely those of the individual author(s) and contributor(s) and not of MDPI and/or the editor(s). MDPI and/or the editor(s) disclaim responsibility for any injury to people or property resulting from any ideas, methods, instructions or products referred to in the content. |
© 2025 by the authors. Licensee MDPI, Basel, Switzerland. This article is an open access article distributed under the terms and conditions of the Creative Commons Attribution (CC BY) license (https://creativecommons.org/licenses/by/4.0/).