Article

Precision and Reliability of a Dynamometer for Trunk Extension Strength and Steadiness Assessment

1
Center for Rehabilitation Research (CIR), ESS, Polytechnic of Porto, Rua Dr. António Bernardino de Almeida, 4249-015 Porto, Portugal
2
Porto Biomechanics Laboratory, University of Porto, 4200-450 Porto, Portugal
3
Center of Research, Education, Innovation and Intervention in Sport, Faculty of Sport, University of Porto, 4200-450 Porto, Portugal
4
Laboratory of Physical Activity Sciences, School of Arts, Sciences and Humanities, University of São Paulo, Butantã, São Paulo 05508-220, Brazil
*
Author to whom correspondence should be addressed.
Appl. Sci. 2025, 15(8), 4081; https://doi.org/10.3390/app15084081
Submission received: 11 March 2025 / Revised: 1 April 2025 / Accepted: 6 April 2025 / Published: 8 April 2025
(This article belongs to the Special Issue Advanced Technologies in Physical Therapy and Rehabilitation)

Abstract

:
Low back pain is a major cause of disability worldwide, often associated with deficits in trunk extensor strength control. Accurate assessment of trunk extension strength control is crucial for diagnosing impairments and monitoring interventions. This study evaluated the reliability of a dynamometry-based protocol for isometric trunk extension strength control assessment. Twenty-eight healthy volunteers (9 females, 19 males) completed two sessions, seven days apart. A single-point load cell system, encapsulated within a 3D-printed structure and connected to a Delsys system® at a sampling frequency of 2000 Hz, was used for data acquisition. Participants performed maximal voluntary contractions (MVC) and submaximal isometric contractions (SMVC) guided by trapezoidal visual feedback. Key outcome variables included peak force, mean force, and force steadiness. Calibration demonstrated high accuracy (R2 = 1) with a low root mean square error (0.55 N). Test–retest analysis showed excellent reliability for peak force (ICC = 0.81, SEM = 0.50, MDC = 1.39), mean force (ICC = 0.93, SEM = 0.17, MDC = 1.08), and steadiness (ICC = 0.87, SEM = 0.85, MDC = 2.36), with no significant intersession differences (p > 0.05). This study demonstrates the high reliability of using dynamometry to assess trunk extension strength during MVC and SMVC, endorsing the dynamometer as a tool for functional assessment and the development of personalized rehabilitation and training strategies.

1. Introduction

Low back pain (LBP) remains one of the leading causes of disability worldwide, with approximately 85% of cases lacking a specific peripheral etiology [1]. Despite the uncertainty surrounding its origin, recurrence rates of 60% to 80% are observed after the initial episode [2]. It has been hypothesized that weakness and poor endurance of the paravertebral muscles lead to increased loading on passive spinal structures, such as intervertebral disks and ligaments, thus contributing to the persistence and chronicity of pain [3,4,5,6,7]. Among the muscles involved, trunk extensors play a particularly critical role in both locomotion and postural control. Dysfunction in these muscles not only impairs motor capacity but also significantly impacts quality of life, with profound physical and psychological implications [8,9,10].
Motor function impairment, characterized by reduced strength and muscle performance, can substantially limit autonomy in activities of daily living [11,12,13,14]. As such, the accurate assessment of trunk extensor strength becomes vital across various populations, including older adults [15,16], individuals with LBP [14,17], and healthy subjects [18,19], as a means of preventing further musculoskeletal dysfunctions [20,21]. Understanding key variables such as maximal force production capacity, mean force, and steadiness during muscle contraction is essential for effectively monitoring therapeutic responses and ensuring accurate interpretation of observable functional changes [22,23]. These assessments provide invaluable insight into the factors driving the persistence of LBP and the functional limitations that accompany it [24,25].
Different methods have been employed to assess trunk extensor strength, though their reliability remains variable [26,27,28,29,30,31]. The isometric handheld dynamometer (HHD) is widely regarded as the gold standard for isometric muscle strength evaluation [14,32,33]. However, previous studies have reported intraclass correlation coefficients (ICC) for different HHD models ranging from 0.67 to 0.93, with considerable variability attributed to factors such as participant posture and differing measurement protocols [14,34,35,36]. Despite its widespread use, for example, the Lafayette HHD has notable limitations, including high cost, the requirement for specialized personnel, and stringent control conditions, which can hinder its broader clinical application [15]. Moreover, the HHD’s inability to synchronize with other data acquisition systems limits its utility for real-time feedback during assessments, particularly when evaluating submaximal isometric voluntary contractions (SMVC). In such cases, sustaining a steady force is essential for evaluating variables like steadiness.
In contrast, load cell systems offer higher sampling frequencies, which are essential for detecting immediate variations in force output and improving the precision of strength assessments. However, questions remain about the test–retest reliability of these methods, as results may be influenced by factors like subject posture during evaluation (prone, seated, or standing), the type of equipment used, and the fixation methodology of the dynamometer, which can complicate cross-study comparisons [14,34,36,37,38]. The lack of standardization in measurement protocols, along with the influence of gravitational force, can also introduce biases in the obtained values, further complicating result interpretation. Despite recent advancements in the reliability of portable dynamometers, uncertainties remain regarding the impact of posture and testing conditions on the assessment of maximal and submaximal isometric strength, as well as muscle steadiness during trunk extension [14,28,32,34,35,39].
Given these challenges, the implementation of fixation structures designed to minimize inertial effects could significantly enhance the accuracy and reliability of measurements, addressing a critical gap in current strength assessment practices. Therefore, the aim of the present study is to evaluate the reliability and precision of a dynamometer system in measuring both maximal and submaximal isometric strength, as well as muscle steadiness, during trunk extension. Our hypothesis is that the implementation of these fixation structures will demonstrate high reliability in the measurements of maximal voluntary isometrical contraction (MVC) and SMVC, as well as muscle steadiness during trunk extension.

2. Materials and Methods

2.1. Force Measurement System

A single-point load cell (Figure 1A) with a maximum reading capacity of 1000 N was used, measuring trunk extension force along a single axis aligned with the direction of movement. Its signal was amplified using an AD620 amplifier and transmitted to the analog input of the Delsys system (Delsys, Natick, MA, USA), enabling real-time data visualization and recording at a sampling frequency of 2000 Hz. The load cell was encapsulated within a 3D-printed structure (Figure 1A) and secured with a screw to ensure unidirectional force transmission. The system operated through a probe with a metal rod that efficiently conveyed the applied force to the load cell. After encapsulation, the load cell was fixed within a rigid structure (Figure 1B), designed to ensure proper participant positioning within the force measurement system, providing stability during the test.

2.2. Calibration

The calibration of the described dynamometer was conducted using a universal testing machine for compression, INSTRON® model 4507 (Instron, Norwood, MA, USA), yielding a calibration equation (volts-newtons) and ensuring compliance with the ASTM E8/E8M-09 (2010) standard [40].
During the calibration procedure, the INSTRON® system was programmed to apply a gradually increasing load up to 1000 N, maintain it for a brief period, and then systematically release it. A total of 14 calibration trials were performed: five in the 0–100 N range with 20 N increments and nine in the 100–1000 N range with 100 N increments. Each trial was repeated ten times to establish a robust correlation between the voltage readings and the applied mechanical load.

2.3. Reliability of Experimental Procedures

The study involved two laboratory visits, separated by a seven-day interval. All procedures were conducted in accordance with the guidelines of the Declaration of Helsinki, and all participants provided written informed consent before enrollment. During the first visit, anthropometric measurements, including height with a Seca 213 portable stadiometer (Seca GmbH & Co. KG, Hamburg, Germany) and body mass using a bioimpedance system (InBody 230, InBody Co., Ltd., Seoul, Republic of Korea), were obtained following manufacturers guidelines. Subsequently, participants underwent a familiarization session, followed by the evaluation protocol. The evaluation consisted of a MVC assessment, followed by an SMVC for further familiarization and data collection.
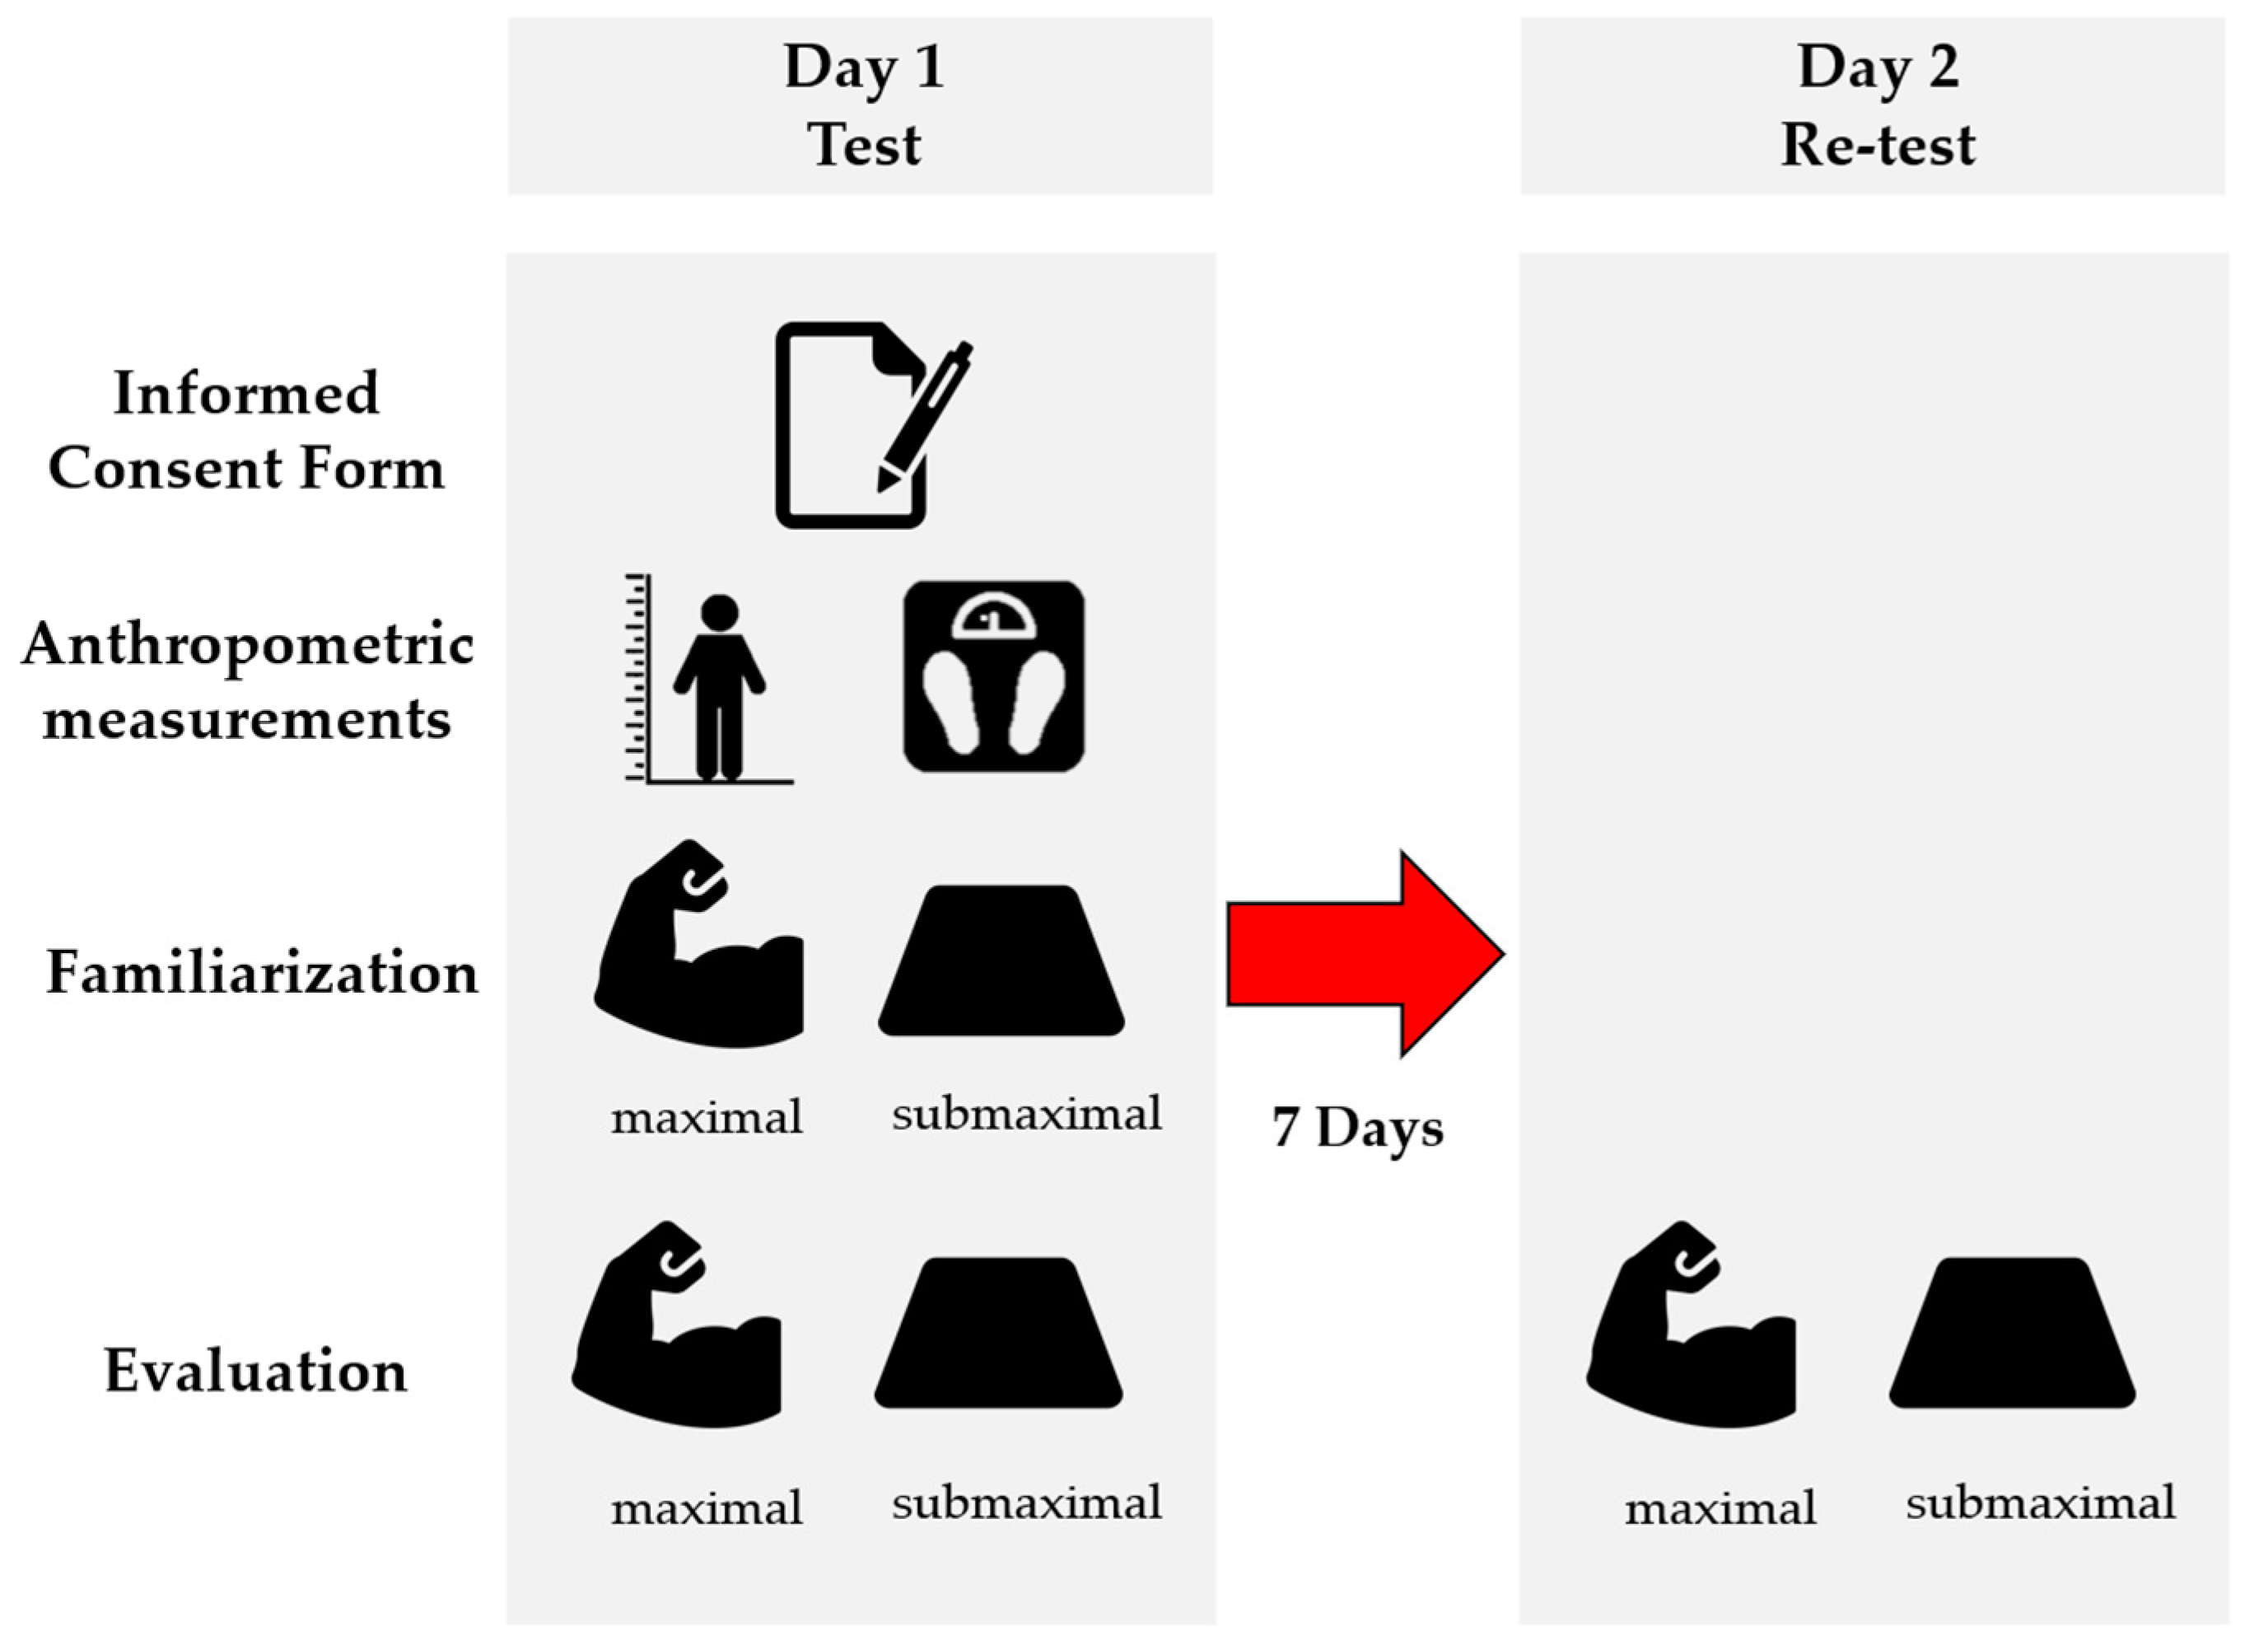
The second visit replicated the procedures performed during the first session to ensure consistency and reliability of the measurements, as shown in Figure 2. All participants underwent a structured familiarization process before testing. The assessments were carried out by a physiotherapist with expertise in the field. The study was approved by the Ethics Committee of the Faculty of Sport, University of Porto (CEFADE 28-2023).

2.4. Sample

The study sample comprised 28 healthy volunteers (9 females, 19 males) with a mean age of 29.50 ± 6.50 years. Their anthropometric characteristics included a mean height of 171.13 ± 7.47 cm, body mass of 74.93 ± 11.44 kg, and body fat percentage of 23.06 ± 8.01% (normal). Inclusion criteria required healthy individuals aged 18 to 40 years with no history of musculoskeletal disorders or recurrent pain in the past six months. Participants were also required to abstain from anti-inflammatory drugs or analgesics in the 24 h prior to testing. Exclusion criteria encompassed a history of lumbar injury or surgery, chronic conditions such as disk degeneration, lumbar osteoarthritis, herniated disk, ankylosing spondylitis, or any other pathology affecting muscle function, as well as pregnancy. All participants were regular physical activity practitioners, ensuring a homogeneous and clinically healthy sample, which minimized confounding factors in the study outcomes.

2.5. Familiarization and Evaluation

The load cell was positioned between the medial border of the scapulae, at the level of the T7 vertebra, to ensure consistent and accurate measurements. The vertical post for the load cell was adjustable in height and along the vertical axis of the body, allowing for compensation of height differences between participants. Additionally, the wedge was positioned four fingers above the anterior superior iliac spine to ensure proper alignment and consistency across trials.

2.5.1. Participant Setup and Position

The volunteer was instructed to perform the spine extension, starting at a 20° extension angle, as shown in Figure 3B. This posture was necessary for executing the trunk extension task correctly. The trapezoidal reference signal presented on the screen in Figure 3C was used to guide the submaximal voluntary contractions (SMVC) during the experimental procedures.

2.5.2. Familiarization Protocol

During the familiarization phase, participants were instructed to perform five repetitions of trunk extension, maintaining a maximum voluntary contraction (MVC) for five seconds. After a one-minute rest period, three additional repetitions of a submaximal voluntary contraction (SMVC) were conducted, with a 30 s rest between them [28]. The SMVCs were guided by visual feedback from the trapezoidal reference signal, displayed on a monitor using Delsys® EMG Works 4.8.0 software (Delsys, Natick, MA, USA), which sampled data at 2000 Hz to accurately detect force variations, especially for assessing steadiness during submaximal contractions. The trapezoidal signal involved a progressive increase in force from zero to the target value over five seconds, followed by a sustained phase at 20% of the MVC for 20 s, and a gradual reduction to zero over the final five seconds [41].

2.5.3. Evaluation Protocol

Following the familiarization process and a one-minute rest, a repetition of the MVC test was performed. From this maximum peak force value, 20% was calculated to execute the SMVC, in accordance with the procedures established during the familiarization phase.

2.6. Data Processing

Data processing was performed using Matlab® software R2024b (The MathWorks Inc., Natick, MA, USA). During MVC, the peak force, considered the maximum force point during this evaluation, was manually extracted using the Delsys system and normalized to body mass. No additional signal processing, such as smoothing or filtering, was applied. Likewise, submaximal force values were derived directly from the raw data without further processing. During SMVC, the variables mean force and force steadiness were derived from a 20 s duration. For the analysis of mean force and steadiness, the central five seconds of the task were considered for data extraction. Mean force values were expressed as percentages relative to the MVC peak using the following formula: [(SMVC mean/MVC peak) × 100]. Force steadiness was calculated by determining the coefficient of variation (CV) using the formula: [(standard deviation of mean force/mean force) × 100].

2.7. Statistical Analysis

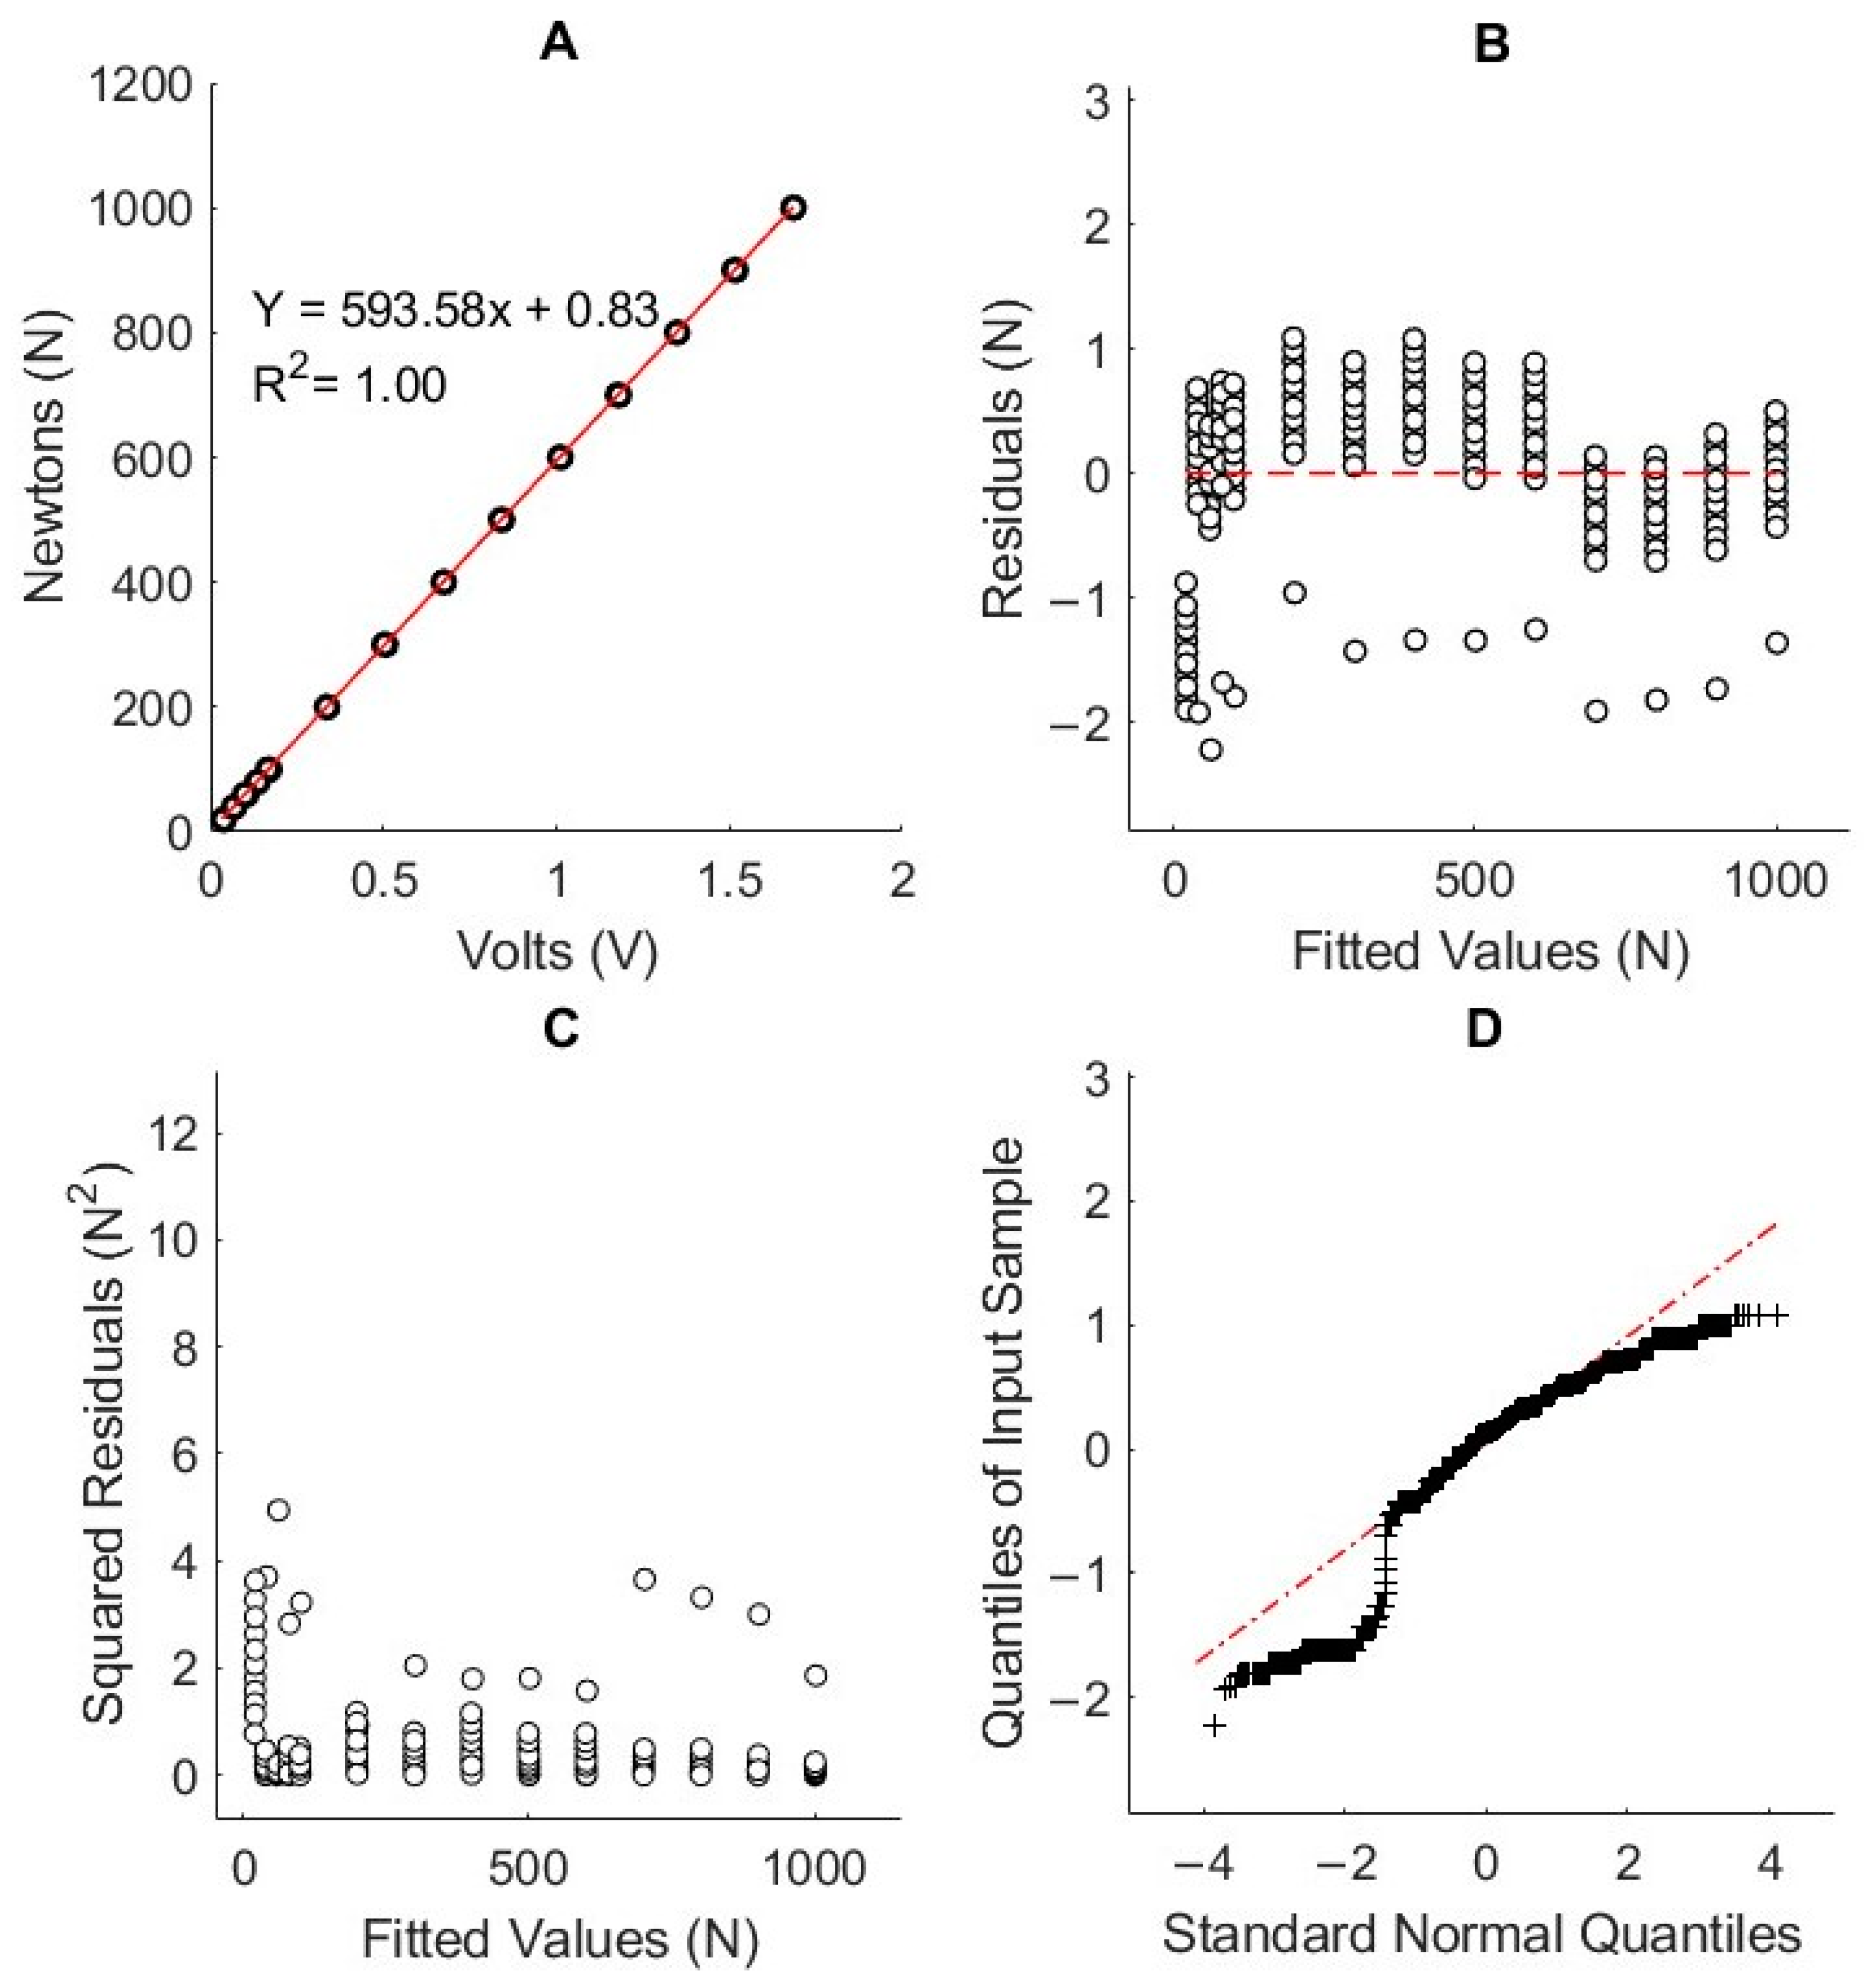
For the statistical analysis, descriptive statistics were computed for the force measurements obtained in each session. The Shapiro–Wilk test was performed to assess data normality. For the calibration data, normality was confirmed, and Pearson’s correlation was used to analyze the relationship between volts and newtons. Additionally, a residuals analysis was conducted, including residuals vs. fitted values, heteroscedasticity assessment, and Q–Q plot of residuals.
For the reliability experimental procedures, the data did not follow a normal distribution. Therefore, the non-parametric Wilcoxon signed-rank test for paired samples was applied to evaluate significant differences between mean measurements across the two sessions (test–retest). The standard error of measurement (SEM) was calculated to quantify random variation using the formula: SEM = SD × √ (1 − r). Furthermore, the minimal detectable change (MDC), representing the smallest change that exceeds random variation, was determined using the formula MDC = SEM × 1.96 × √2. The intra-class correlation coefficient (ICC model 3-K) was calculated to assess measurement consistency across both sessions, with values ranging from 0 (no agreement) to 1 (perfect agreement) [42]. Agreement between sessions was further examined using Bland–Altman plots to visualize potential bias or systematic trends. Additionally, linear regression analysis was conducted to identify trends in force measurements over the test sessions. The effect size of the analyses was determined using Cohen’s d criteria, with thresholds defined as small (d > 0.2), moderate (d > 0.50), and large (d > 0.80) [43]. All statistical analyses were performed using SPSS Statistics software (IBM Corporation, Armonk, NY, USA, Version 27), with the significance level set at α = 0.05.

3. Results

Figure 4 presents the calibration of the load cell, accompanied by residual analysis, which demonstrated linearity with a coefficient of determination (R2 = 1), and the applied linear regression yielded a mean square error of 0.55 N and a sum of squared errors of 7.3183 × 10³ N2. Furthermore, the integration of a High-Resolution Digital Extensometer (HRDE) ensured precise strain measurements, contributing to uniform load distribution and enhancing the overall reliability of the experimental setup. Minimal data variations over time indicated high stability, and the near-zero mean of residuals, alongside a variance of 0.30 N and a standard deviation of 0.55 N, suggests no significant bias in the model.
Table 1 presents the test–retest reliability results for MVC and SMVC of the trunk extensors.
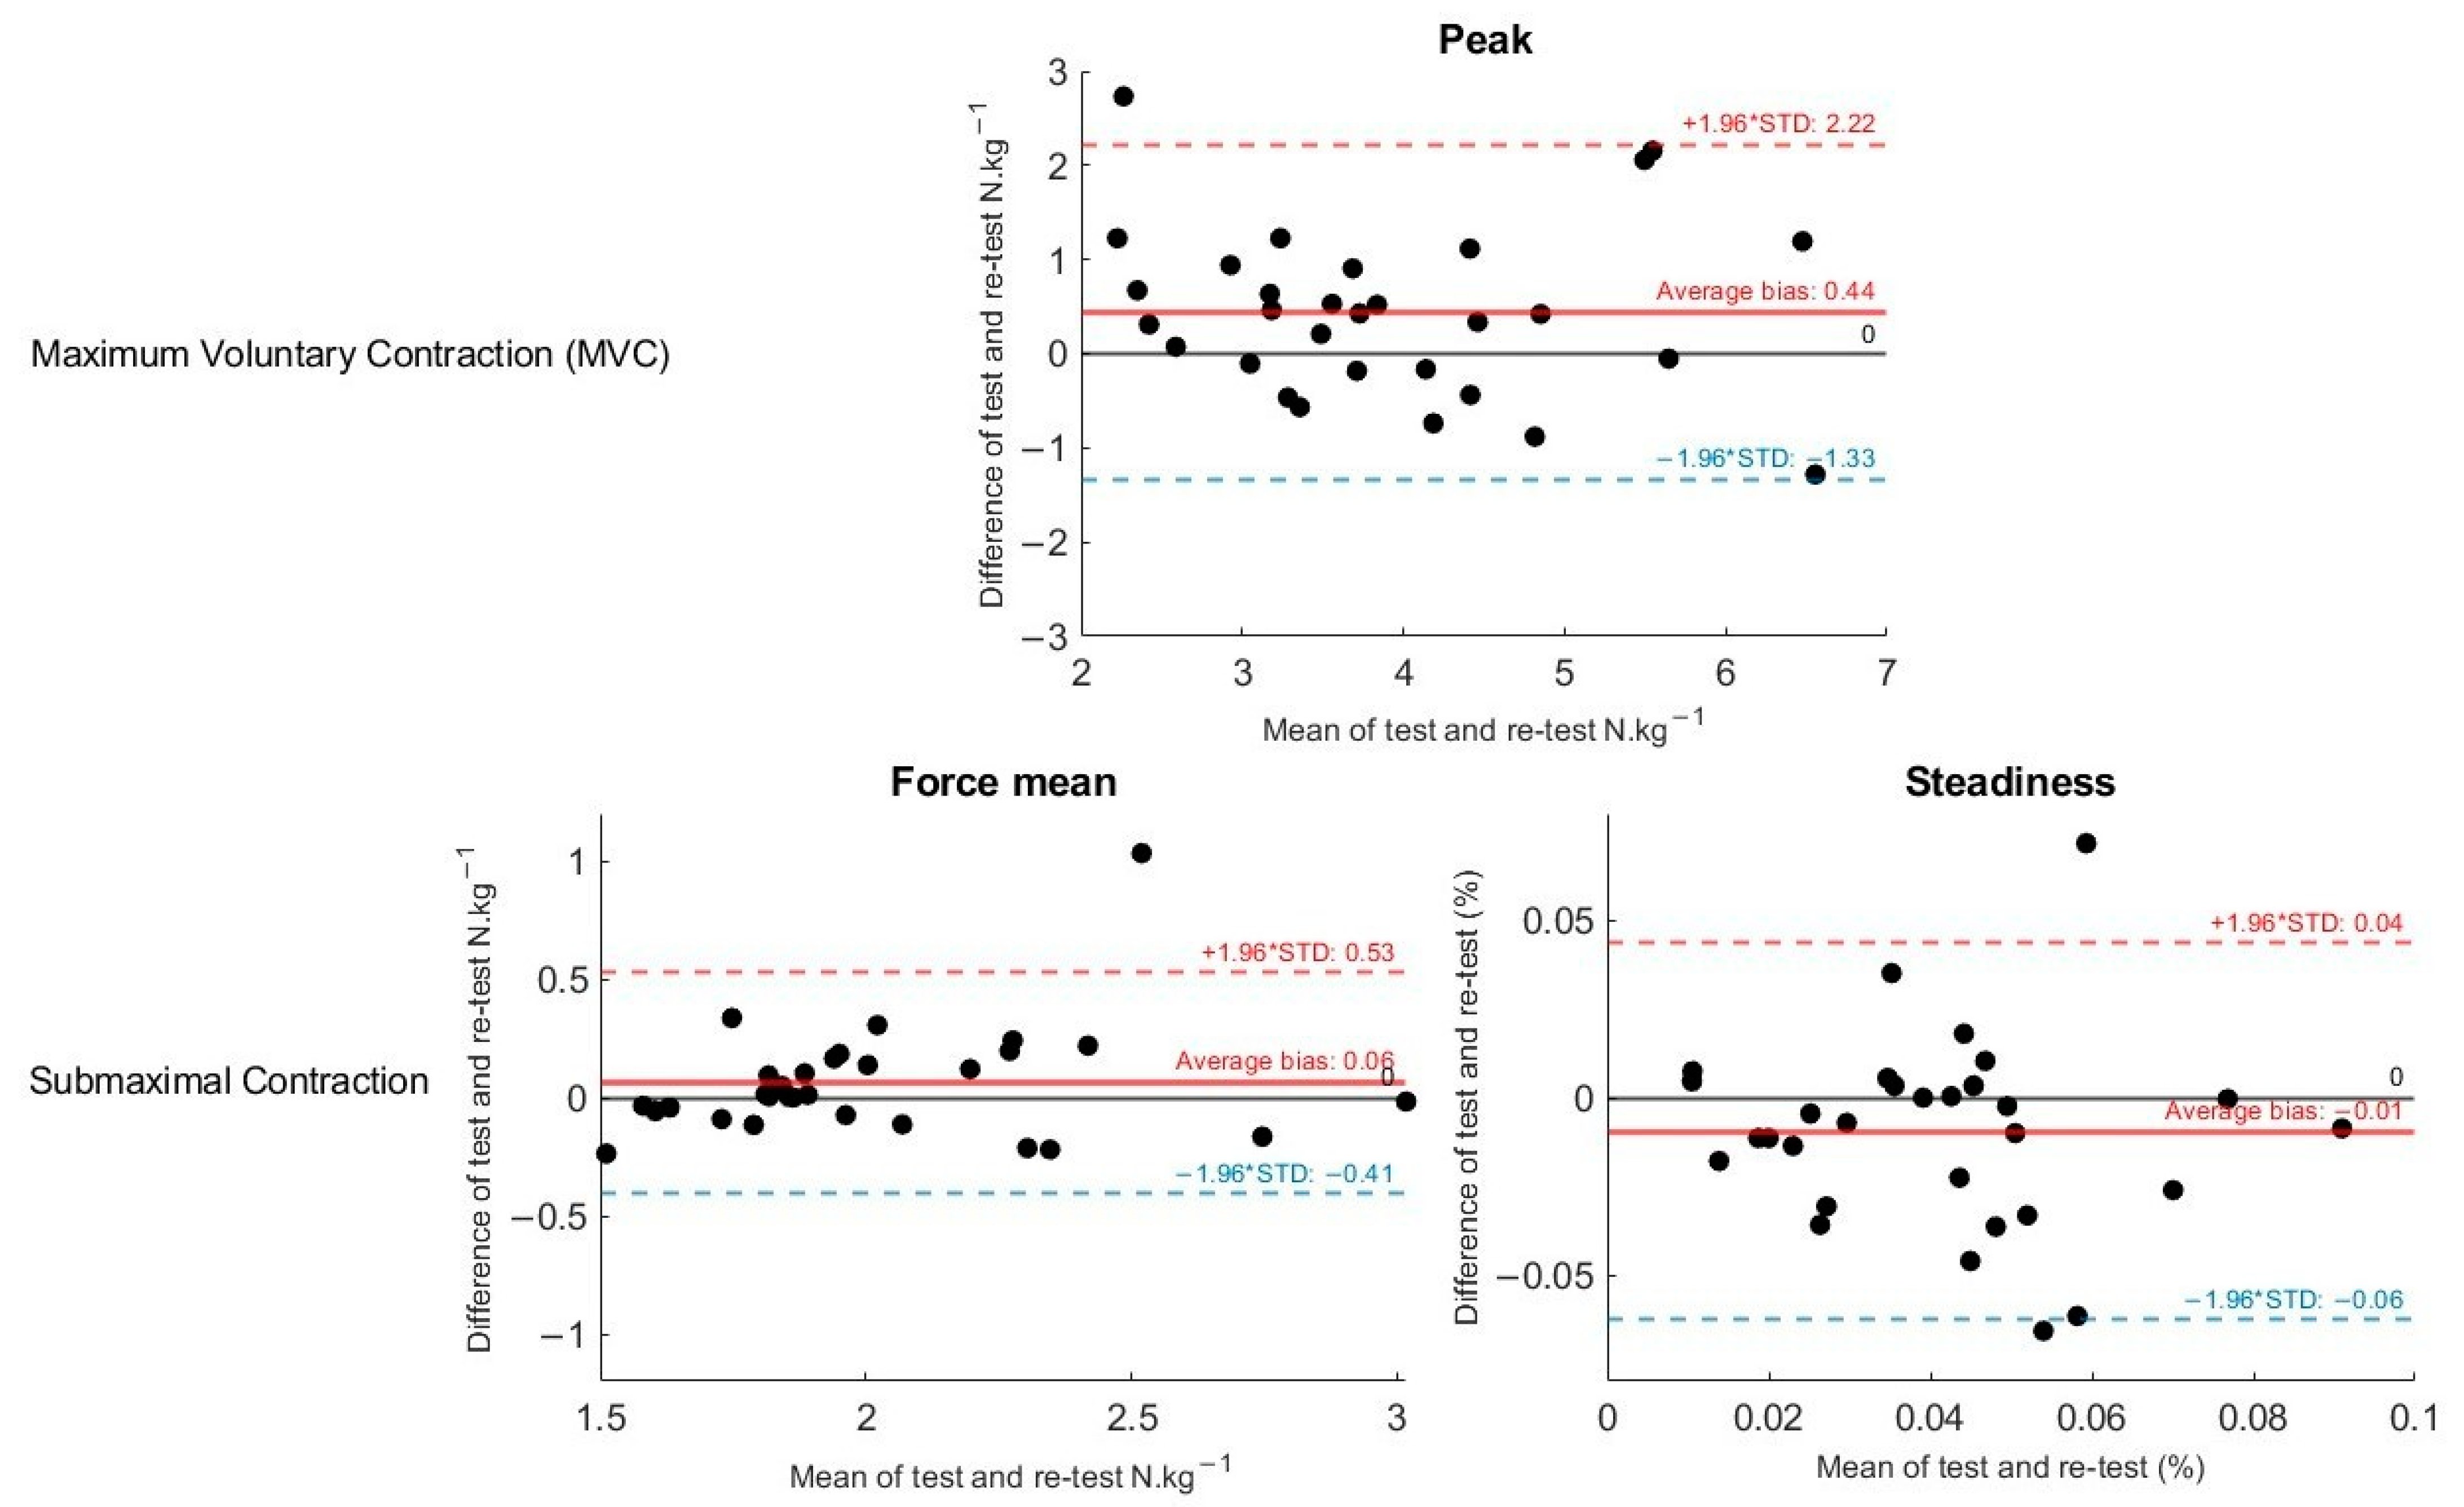
Figure 5 presents the Bland–Altman plots for MVC and SMVC, assessing agreement between test and retest conditions within a 95% confidence interval. For peak force, the results were t = 2.7, df = 29, p = 0.01, with 96.42% of samples within the limits of agreement. For mean force, the results were t = 1.4, df = 29, p = 0.20, with 96.42% of samples within the limits of agreement. For steadiness, the analysis reported t = −1.9, df = 29, p = 0.06, with 92.85% of samples within the limits of agreement.

4. Discussion

This study aimed to evaluate the reliability and precision of a customized dynamometer in measuring both maximal and submaximal isometric strength, as well as muscle steadiness, during trunk extension. The results demonstrated high reliability across all maximal and submaximal tests for peak force, mean force, and force steadiness under both test and retest conditions, thus confirming our initial hypothesis.
The calibration results validated that the single-point load cell meets research standards, ensuring that the sensor does not deform within our measurement range. This guarantees accuracy for both current and future studies involving loads up to 1000 N. The perfect fit of the linear regression model (R2 = 1) confirms precise calibration, while the low root mean square error (0.55 N) and sum of squared errors underscore data consistency. These findings indicate that the dynamometer operates within an acceptable margin of error, comparable to commercial reference devices with an accuracy of ±1% [44], as well as previous studies that have successfully employed similar devices [14,15,34,43,45,46]. Additionally, the low heteroscedasticity observed in the analysis suggests that when a constant mass is applied, the voltage readings from the device remain stable without significant variations, further supporting the device’s reliability. The Q–Q plot of the residuals confirmed that the errors are normally distributed, further validating the model’s assumptions. Consequently, this transducer can be considered a calibrated tool for assessing isometric trunk strength in practical and research settings.
The reliability analysis showed high agreement between sessions for maximum strength, average strength, and force steadiness, with no significant differences between the two assessment days (p > 0.05), indicating consistent performance across sessions. ICC values ranged from 0.81 to 0.93, reflecting good to excellent reliability, with SMVC showing the highest reliability (ICC = 0.93). This suggests that lower-intensity efforts produce more consistent results than maximal efforts. Compared to previous studies, our results demonstrate superior reliability in maximum trunk extension strength. For example, Moreland et al. (1997) [18] reported low reliability (ICC = 0.24), likely due to improper dynamometer placement, while Valentin et al. (2014) [28] achieved an ICC of 0.90 with a fixed dynamometer similar to our study. This confirms that fixing the dynamometer to a stable structure yields reliable and consistent results, consistent with previous findings.
The values of MDC, SEM, and R2 further confirm the system’s capability to detect differences that exceed random variability in peak and mean force variables, enhancing its sensitivity and utility in performance assessment. The reliability of the measurements, reflected by an SEM of 0.85% for force steadiness, indicates high precision with a reduced margin of error. However, the MDC value of 2.36% indicates some variability, suggesting the potential influence of external factors. This can be explained by the sample composition, which includes both men and women, whose natural differences in body composition and force production may affect effort reproducibility, fluctuations in muscle activation, and motor unit recruitment [32,47,48]. Bland–Altman analyses confirmed that most measurements fell within the limits of agreement between test and retest, indicating acceptable reproducibility without significant systematic bias. Nonetheless, factors such as neuromuscular noise, simultaneous execution of motor tasks, and variations in concentration could affect trunk force steadiness, emphasizing the importance of comprehensive evaluations of the system’s reliability [7,39,48,49].
In the literature, various protocols have been identified for evaluating the isometric strength of the trunk. For instance, utilized a protocol using a handheld dynamometer to measure maximal lumbar extensor strength at trunk flexion of 30° and prone extension at 0° [34]. This is similar to our choice of a 20° inclination, as increased gravitational force at 0° may create a mechanical disadvantage for force production [49,50]. Our findings align with previous research validating the use of dynamometers to assess trunk extensors. Unlike standing positions, which may introduce support-related variations, the 20° inclination accounts for biomechanical factors, for example, the stabilization of the pelvis, a reduction in compensations, and postural stability, and external variables [34]. Controlled inclinations during isometric strength evaluations have been shown to reduce gravitational effects and muscular discomfort, thereby improving measurement accuracy [36,51]. Standardization is particularly crucial for patients with chronic LBP, enabling safer and more precise spinal extensor assessments [14]. Adopting a reliable position such as the 20° inclination ensures reliable and clinically relevant outcomes, even for healthy individuals and with mobility restrictions [17,34].
The assessment of force steadiness is fundamental to understanding motor performance, especially in the muscles involved in postural control and affecting movement efficiency [39,52,53,54]. Clinically, trunk strength and force steadiness deficits impair quality of life. In individuals with LBP, muscle instability often contributes to persistent pain and functional limitations [2,7,27,55]. Dynamometer-based systems provide a precise evaluation of muscle force steadiness, identifying motor control deficits and supporting the development of more effective rehabilitation strategies. Additionally, the device’s ability to provide real-time force curve feedback can enhance neuromuscular re-education, minimizing compensatory patterns that exacerbate injuries or lead to new ones [22,29,56]. The reliability demonstrated by the developed device for trunk force steadiness assessment has significant implications for tracking functional progress and tailoring therapeutic interventions. It offers healthcare professionals, including physical therapists, physicians, and sports educators, a practical and reliable tool to optimize clinical decision-making.
This study acknowledges certain limitations, including the absence of a gold-standard device for validating variables such as steadiness across different testing protocols and postures. Although standardized instructions and consistent verbal encouragement were provided to minimize external influences, psychological factors like anxiety and stress may have impacted participants’ performance [57,58]. Additionally, variations in physical activity levels were not strictly controlled.
Future research should focus on longitudinal studies to assess the dynamometer’s effectiveness in tracking therapeutic progress and explore its application in diverse populations, including older adults, athletes, and individuals with specific musculoskeletal conditions, while validating its performance against reference methods. Additionally, studies could investigate the feasibility of using more portable and user-friendly versions of the dynamometer in clinical and field settings, ensuring that it can be easily incorporated into routine practice without compromising data accuracy. Exploring the impact of various environmental and participant factors on the device’s performance would also be critical to enhance its applicability in different real-world contexts.

5. Conclusions

This study demonstrates the precision and reliability of using dynamometry to assess trunk extension strength during both MVC and SMVC. Calibration results validate the device’s accuracy, showing high comparability to reference commercial equipment. Test–retest analysis confirms excellent reliability for both maximal and submaximal efforts across different days. Furthermore, the findings support the viability of evaluating muscular force steadiness using a dynamometer-based system. The standardization of the protocol minimizes gravitational effects and muscular discomfort, thereby enhancing measurement precision. These results endorse the developed dynamometer as a valuable tool for functional assessment and the development of personalized rehabilitation and training strategies.

Author Contributions

Conceptualization, F.P., M.G., J.R., K.B., M.S., B.C.P., U.F.E., J.P.V.-B. and R.S.; Methodology, F.P., J.R., K.B., M.S., B.C.P., U.F.E., J.P.V.-B. and R.S.; Software, F.P., M.G., J.R., K.B., B.C.P., U.F.E., J.P.V.-B. and R.S.; Validation, F.P., M.G., J.R., K.B., M.S., B.C.P., U.F.E., J.P.V.-B. and R.S.; Formal analysis, F.P., M.G., J.R., K.B., B.C.P., U.F.E., J.P.V.-B. and R.S.; Investigation, F.P., M.G., J.R., K.B., M.S., B.C.P., U.F.E., J.P.V.-B. and R.S.; Resources, F.P., M.G., B.C.P., U.F.E., J.P.V.-B. and R.S.; Data curation, F.P., M.G., J.R., K.B., B.C.P., U.F.E., J.P.V.-B. and R.S.; Writing—original draft, F.P., J.R., K.B., M.S., U.F.E. and J.P.V.-B.; Writing—review & editing, F.P., M.G., J.R., K.B., M.S., B.C.P., U.F.E., J.P.V.-B. and R.S.; Visualization, F.P., M.G., M.S., U.F.E., J.P.V.-B. and R.S.; Supervision, M.G., U.F.E., J.P.V.-B. and R.S.; Project administration, M.G., J.P.V.-B. and R.S.; Funding acquisition, R.S. All authors have read and agreed to the published version of the manuscript.

Funding

This research was funded by the Rehabilitation Research Center-Foundation for Science and Technology (FCT) through R&D Units funding UI/BD/151415/2021, https://doi.org/10.54499/UI/BD/151415/2021, and by the European Union (EU) under the Centre of Research, Education, Innovation and Intervention in Sport (CIFI2D), Faculty of Sport, University of Porto.

Institutional Review Board Statement

The study was conducted in accordance with the guidelines of the Declaration of Helsinki and approved by the Ethics Committee of the Faculty of Sport of the University of Porto (CEFADE 28-2023, 12 July 2023).

Informed Consent Statement

Informed consent was obtained from all the participants involved in the study.

Data Availability Statement

The data presented in this study are available on request from the corresponding author. The data are not publicly available due to privacy.

Conflicts of Interest

The authors declare no conflicts of interest.

References

  1. Vos, T.; Flaxman, A.D.; Naghavi, M.; Lozano, R.; Michaud, C.; Ezzati, M.; Shibuya, K.; Salomon, J.A.; Abdalla, S.; Aboyans, V.; et al. Years lived with disability (YLDs) for 1160 sequelae of 289 diseases and injuries 1990–2010: A systematic analysis for the Global Burden of Disease Study 2010. Lancet 2012, 380, 2163–2196. [Google Scholar] [CrossRef] [PubMed]
  2. Da Silva, T.; Mills, K.; Brown, B.T.; Herbert, R.D.; Maher, C.G.; Hancock, M.J. Risk of Recurrence of Low Back Pain: A Systematic Review. J. Orthop. Sports Phys. Ther. 2017, 47, 305–313. [Google Scholar] [CrossRef] [PubMed]
  3. McGill, S.M. Distribution of tissue loads in the low back during a variety of daily and rehabilitation tasks. J. Rehabil. Res. Dev. 1997, 34, 448–458. [Google Scholar] [PubMed]
  4. Arins, M.R.; Murara, N.; Bottamedi, X.; Ramos, J.d.S.; Woellner, S.S.; Soares, A.V. Physiotherapeutic treatment Schedule for chronic low back pain: Influence on pain, quality of life and functional capacity. Revista Dor 2016, 17, 192–196. [Google Scholar] [CrossRef]
  5. Alaranta, H.; Luoto, S.; Heliövaara, M.; Hurri, H. Static back endurance and the risk of low-back pain. Clin. Biomech. 1995, 10, 323–324. [Google Scholar] [CrossRef]
  6. Larsen, L.H.; Hirata, R.P.; Graven-Nielsen, T. Experimental Low Back Pain Decreased Trunk Muscle Activity in Currently Asymptomatic Recurrent Low Back Pain Patients During Step Tasks. J. Pain 2018, 19, 542–551. [Google Scholar] [CrossRef]
  7. van Dieën, J.H.; Reeves, N.P.; Kawchuk, G.; van Dillen, L.R.; Hodges, P.W. Motor Control Changes in Low Back Pain: Divergence in Presentations and Mechanisms. J. Orthop. Sports Phys. Ther. 2019, 49, 370–379. [Google Scholar] [CrossRef]
  8. Neufuss, J.; Hesse, B.; Thorpe, S.K.; Vereecke, E.E.; D′Aout, K.; Fischer, M.S.; Schilling, N. Fibre type composition in the lumbar perivertebral muscles of primates: Implications for the evolution of orthogrady in hominoids. J. Anat. 2014, 224, 113–131. [Google Scholar] [CrossRef]
  9. Cholewicki, J.; McGill, S.M. Mechanical stability of the in vivo lumbar spine: Implications for injury and chronic low back pain. Clin. Biomech. 1996, 11, 1–15. [Google Scholar] [CrossRef]
  10. Hicks, G.E.; Fritz, J.M.; Delitto, A.; McGill, S.M. Preliminary development of a clinical prediction rule for determining which patients with low back pain will respond to a stabilization exercise program. Arch. Phys. Med. Rehabil. 2005, 86, 1753–1762. [Google Scholar] [CrossRef]
  11. Ruiz, J.R.; Sui, X.; Lobelo, F.; Morrow, J.R., Jr.; Jackson, A.W.; Sjöström, M.; Blair, S.N. Association between muscular strength and mortality in men: Prospective cohort study. Bmj 2008, 337, a439. [Google Scholar] [CrossRef]
  12. Camposo, L.; Pereira, R. Correlação entre os testes de dinamometria de preensão manual, escapular e lombar com o desempenho no Special Judo Fitness Test. Rev. Educ. Física/J. Phys. Educ. 2015, 84, 65–72. [Google Scholar] [CrossRef]
  13. Brill, P.A.; Macera, C.A.; Davis, D.R.; Blair, S.N.; Gordon, N. Muscular strength and physical function. Med. Sci. Sports Exerc. 2000, 32, 412–416. [Google Scholar] [CrossRef]
  14. Althobaiti, S.; Falla, D. Reliability and criterion validity of handheld dynamometry for measuring trunk muscle strength in people with and without chronic non-specific low back pain. Musculoskelet. Sci. Pract. 2023, 66, 102799. [Google Scholar] [CrossRef]
  15. Yang, S.; Wu, W.; Zhang, C.; Wang, D.; Chen, C.; Tang, Y.; Li, K.; Xu, J.; Luo, F. Reliability and validity of three isometric back extensor strength assessments with different test postures. J. Int. Med. Res. 2020, 48, 0300060519885268. [Google Scholar] [CrossRef] [PubMed]
  16. Vlažná, D.; Krkoška, P.; Kuhn, M.; Dosbaba, F.; Baťalík, L.; Vlčková, E.; Voháňka, S.; Adamová, B. Assessment of Lumbar Extensor Muscles in the Context of Trunk Function, a Pilot Study in Healthy Individuals. Appl. Sci. 2021, 11, 9518. [Google Scholar] [CrossRef]
  17. Gruther, W.; Wick, F.; Paul, B.; Leitner, C.; Posch, M.; Matzner, M.; Crevenna, R.; Ebenbichler, G. Diagnostic accuracy and reliability of muscle strength and endurance measurements in patients with chronic low back pain. J. Rehabil. Med. 2009, 41, 613–619. [Google Scholar] [CrossRef]
  18. Moreland, J.; Finch, E.; Stratford, P.; Balsor, B.; Gill, C. Interrater reliability of six tests of trunk muscle function and endurance. J. Orthop. Sports Phys. Ther. 1997, 26, 200–208. [Google Scholar] [CrossRef]
  19. Essendrop, M.; Schibye, B.; Hansen, K. Reliability of isometric muscle strength tests for the trunk, hands and shoulders. Int. J. Ind. Ergon. 2001, 28, 379–387. [Google Scholar] [CrossRef]
  20. Larivière, C.; Gagnon, D.; Loisel, P. The effect of load on the coordination of the trunk for subjects with and without chronic low back pain during flexion-extension & lateral bending tasks. Clin. Biomech. 2000, 15, 407–416. [Google Scholar]
  21. Kell, R.T.; Bell, G.; Quinney, A. Musculoskeletal fitness, health outcomes and quality of life. Sports Med. 2001, 31, 863–873. [Google Scholar] [CrossRef]
  22. Steele, J.; Fisher, J.; Perrin, C.; Conway, R.; Bruce-Low, S.; Smith, D. Does change in isolated lumbar extensor muscle function correlate with good clinical outcome? A secondary analysis of data on change in isolated lumbar extension strength, pain, and disability in chronic low back pain. Disabil. Rehabil. 2019, 41, 1287–1295. [Google Scholar]
  23. De Vet, H.C.; Terwee, C.B.; Mokkink, L.B.; Knol, D.L. Measurement in Medicine: A Practical Guide; Cambridge University Press: Cambridge, UK, 2011. [Google Scholar]
  24. Chou, R.; Shekelle, P. Will this patient develop persistent disabling low back pain? JAMA 2010, 303, 1295–1302. [Google Scholar] [CrossRef]
  25. Pincus, T.; Burton, A.; Vogel, S.; Field, A. A Systematic Review of Psychological Factors as Predictors of Chronicity/Disability in Prospective Cohorts of Low Back Pain. Spine 2002, 27, E109–E120. [Google Scholar] [CrossRef]
  26. Gonçalves, M.; Barbosa, F.S.S. Análise de parâmetros de força e resistência dos músculos eretores da espinha lombar durante a realização de exercício isométrico em diferentes níveis de esforço. Rev. Bras. Med. Esporte 2005, 11, 109–114. [Google Scholar]
  27. Jain, S.; Shetty, G.; Munje, P.; Bhan, A.; Linjhara, S.; Ram, C.S. Gender-based Variations in Trunk Motion and Isometric Strength in Young Adults with Low Back Pain: A Prospective Case-control Study. Rev. Bras. Ortop. 2022, 57, 392–401. [Google Scholar]
  28. Valentin, G.; Maribo, T. Hand-held dynamometry fixated with a tripod is reliable for assessment of back extensor strength in women with osteoporosis. Osteoporos. Int. 2014, 25, 2143–2149. [Google Scholar] [CrossRef]
  29. Eichinger, F.; Soares, A.; Júnior, J.; Gevaerd, M.; Domenech, S.; Júnior, N. Dinamometria lombar: Um teste funcional para o tronco. Rev. Bras. Med. Trab. 2016, 14, 120–126. [Google Scholar] [CrossRef]
  30. Müller, I.; Machado de Brito, R.; Pereira, C.; Brusamarello, V. Load cells in force sensing analysis—Theory and a novel application. IEEE Instrum. Meas. Mag. 2010, 13, 15–19. [Google Scholar] [CrossRef]
  31. Freitas, C.D.D.; Greve, J.M.D.A. Estudo comparativo entre exercícios com dinamômetro isocinético e bola terapêutica na lombalgia crônica de origem mecânica. Fisioter. Pesqui. 2008, 15, 380–386. [Google Scholar]
  32. Guilhem, G.; Giroux, C.; Couturier, A.; Maffiuletti, N.A. Validity of trunk extensor and flexor torque measurements using isokinetic dynamometry. J. Electromyogr. Kinesiol. 2014, 24, 986–993. [Google Scholar]
  33. Althobaiti, S.; Rushton, A.; Aldahas, A.; Falla, D.; Heneghan, N.R. Practicable performance-based outcome measures of trunk muscle strength and their measurement properties: A systematic review and narrative synthesis. PLoS ONE 2022, 17, e0270101. [Google Scholar]
  34. De Blaiser, C.; De Ridder, R.; Willems, T.; Danneels, L.; Roosen, P. Reliability and validity of trunk flexor and trunk extensor strength measurements using handheld dynamometry in a healthy athletic population. Phys. Ther. Sport 2018, 34, 180–186. [Google Scholar]
  35. Bonhof-Jansen, E.D.J.; van Ham, A.; Kroon, G.J.; Winter, R.W.; Brink, S.M. Validity and reliability of a portable handheld dynamometer compared to a fixed isokinetic dynamometer to assess forearm torque strength. Hand Surg. Rehabil. 2023, 42, 147–153. [Google Scholar] [CrossRef]
  36. Barros, M.; Clemente, N.; Rezende, F.; Cardoso, T.; Thomaz, S.R.T.; Garcia, P.; Ribeiro, A.; Martins, W. Reliability of the handheld dynamometer in the evaluation of the muscle strength of trunk extensors in healthy adults. Motricidade 2021, 17, 235–241. [Google Scholar] [CrossRef]
  37. Jubany, J.; Busquets, A.; Marina, M.; Cos, F.; Angulo-Barroso, R. Reliability and validity of a custom-made instrument including a hand-held dynamometer for measuring trunk muscle strength. J. Back Musculoskelet. Rehabil. 2015, 28, 317–326. [Google Scholar]
  38. Martínez-Romero, M.T.; Ayala, F.; De Ste Croix, M.; Vera-Garcia, F.J.; Sainz de Baranda, P.; Santonja-Medina, F.; Sánchez-Meca, J. A Meta-Analysis of the Reliability of Four Field-Based Trunk Extension Endurance Tests. Int. J. Environ. Res. Public Health 2020, 17, 3088. [Google Scholar] [CrossRef]
  39. Arvanitidis, M.; Falla, D.; Sanderson, A.; Martinez-Valdes, E. Does pain influence control of muscle force? A systematic review and meta-analysis. Eur. J. Pain 2025, 29, e4716. [Google Scholar] [CrossRef]
  40. ASTM E8/E8M-09; Standard Test Methods for Tension Testing of Metallic Materials. ASTM International: West Conshohocken, PA, USA, 2010. [CrossRef]
  41. Nawab, S.H.; Chang, S.S.; De Luca, C.J. High-yield decomposition of surface EMG signals. Clin. Neurophysiol. 2010, 121, 1602–1615. [Google Scholar] [CrossRef]
  42. Koo, T.K.; Li, M.Y. A Guideline of Selecting and Reporting Intraclass Correlation Coefficients for Reliability Research. J. Chiropr. Med. 2016, 15, 155–163. [Google Scholar] [CrossRef]
  43. Lipovšek, T.; Kacin, A.; Puh, U. Reliability and validity of hand-held dynamometry for assessing lower limb muscle strength. Isokinet. Exerc. Sci. 2021, 30, 231–240. [Google Scholar] [CrossRef]
  44. Shrout, P.E.; Fleiss, J.L. Intraclass correlations: Uses in assessing rater reliability. Psychol. Bull. 1979, 86, 420–428. [Google Scholar] [CrossRef]
  45. Stark, T.; Walker, B.; Phillips, J.K.; Fejer, R.; Beck, R. Hand-held dynamometry correlation with the gold standard isokinetic dynamometry: A systematic review. PMR 2011, 3, 472–479. [Google Scholar] [CrossRef]
  46. Park, H.W.; Baek, S.; Kim, H.Y.; Park, J.G.; Kang, E.K. Reliability and Validity of a New Method for Isometric Back Extensor Strength Evaluation Using A Hand-Held Dynamometer. Ann. Rehabil. Med. 2017, 41, 793–800. [Google Scholar] [CrossRef]
  47. Silva, M.F.; Dias, J.M.; Pereira, L.M.; Mazuquin, B.F.; Lindley, S.; Richards, J.; Cardoso, J.R. Determination of the motor unit behavior of lumbar erector spinae muscles through surface EMG decomposition technology in healthy female subjects. Muscle Nerve 2017, 55, 28–34. [Google Scholar] [CrossRef]
  48. Hodges, P.W.; Tucker, K. Moving differently in pain: A new theory to explain the adaptation to pain. Pain 2011, 152, S90–S98. [Google Scholar] [CrossRef] [PubMed]
  49. Bouisset, S.; Zattara, M. Biomechanical study of the programming of anticipatory postural adjustments associated with voluntary movement. J. Biomech. 1987, 20, 735–742. [Google Scholar] [CrossRef] [PubMed]
  50. Hunt, A. A Guide to the Measurement of Force; Institute of Measurement and Control: London, UK, 1998. [Google Scholar]
  51. Juan-Recio, C.; Barbado, D.; Vaquero, M.P.; López-Plaza, D. Reliability assessment and correlation analysis of three protocols to measure trunk muscle strength and endurance. J. Sports Sci. 2017, 36, 357–364. [Google Scholar] [CrossRef]
  52. Zemková, E.; Zapletalová, L. The Role of Neuromuscular Control of Postural and Core Stability in Functional Movement and Athlete Performance. Front. Physiol. 2022, 13, 796097. [Google Scholar] [CrossRef]
  53. Hamed, A.; Hamed, A.; Bohm, S.; Mersmann, F.; Arampatzis, A. Exercises of dynamic stability under unstable conditions increase muscle strength and balance ability in the elderly. Scand. J. Med. Sci. Sports 2018, 28, 961–971. [Google Scholar] [CrossRef]
  54. Kollmitzer, J.; Ebenbichler, G.; Sabo, A.; Kerschan, K.; Bochdansky, T. Effects of back extensor strength training versus balance training on postural control. Med. Sci. Sports Exerc. 2000, 32, 1770–1776. [Google Scholar] [CrossRef] [PubMed]
  55. McGill, S.M. Low back stability: From formal description to issues for performance and rehabilitation. Exerc. Sport Sci. Rev. 2001, 29, 26–31. [Google Scholar] [CrossRef] [PubMed]
  56. Soares, A.; Júnior, J.; Silva, L.; Domenech, S.; Gomes, N. Valores Normativos Da Dinamometria Lombar: Um Teste Funcional Para O Tronco. In Proceedings of the IV Simpósio em Neuromecânica Aplicada, Florianópolis, Brasil, 28 November 2013. [Google Scholar]
  57. Parolini, F.; Goethel, M.; Becker, K.; Fernandes, C.; Fernandes, R.J.; Ervilha, U.F.; Santos, R.; Vilas-Boas, J.P. Breaking Barriers: Artificial Intelligence Interpreting the Interplay between Mental Illness and Pain as Defined by the International Association for the Study of Pain. Biomedicines 2023, 11, 2042. [Google Scholar] [CrossRef] [PubMed]
  58. Burton, N.W.; Turrell, G.; Oldenburg, B.; Sallis, J.F. The relative contributions of psychological, social, and environmental variables to explain participation in walking, moderate-, and vigorous-intensity leisure-time physical activity. J. Phys. Act. Health 2005, 2, 181–196. [Google Scholar]
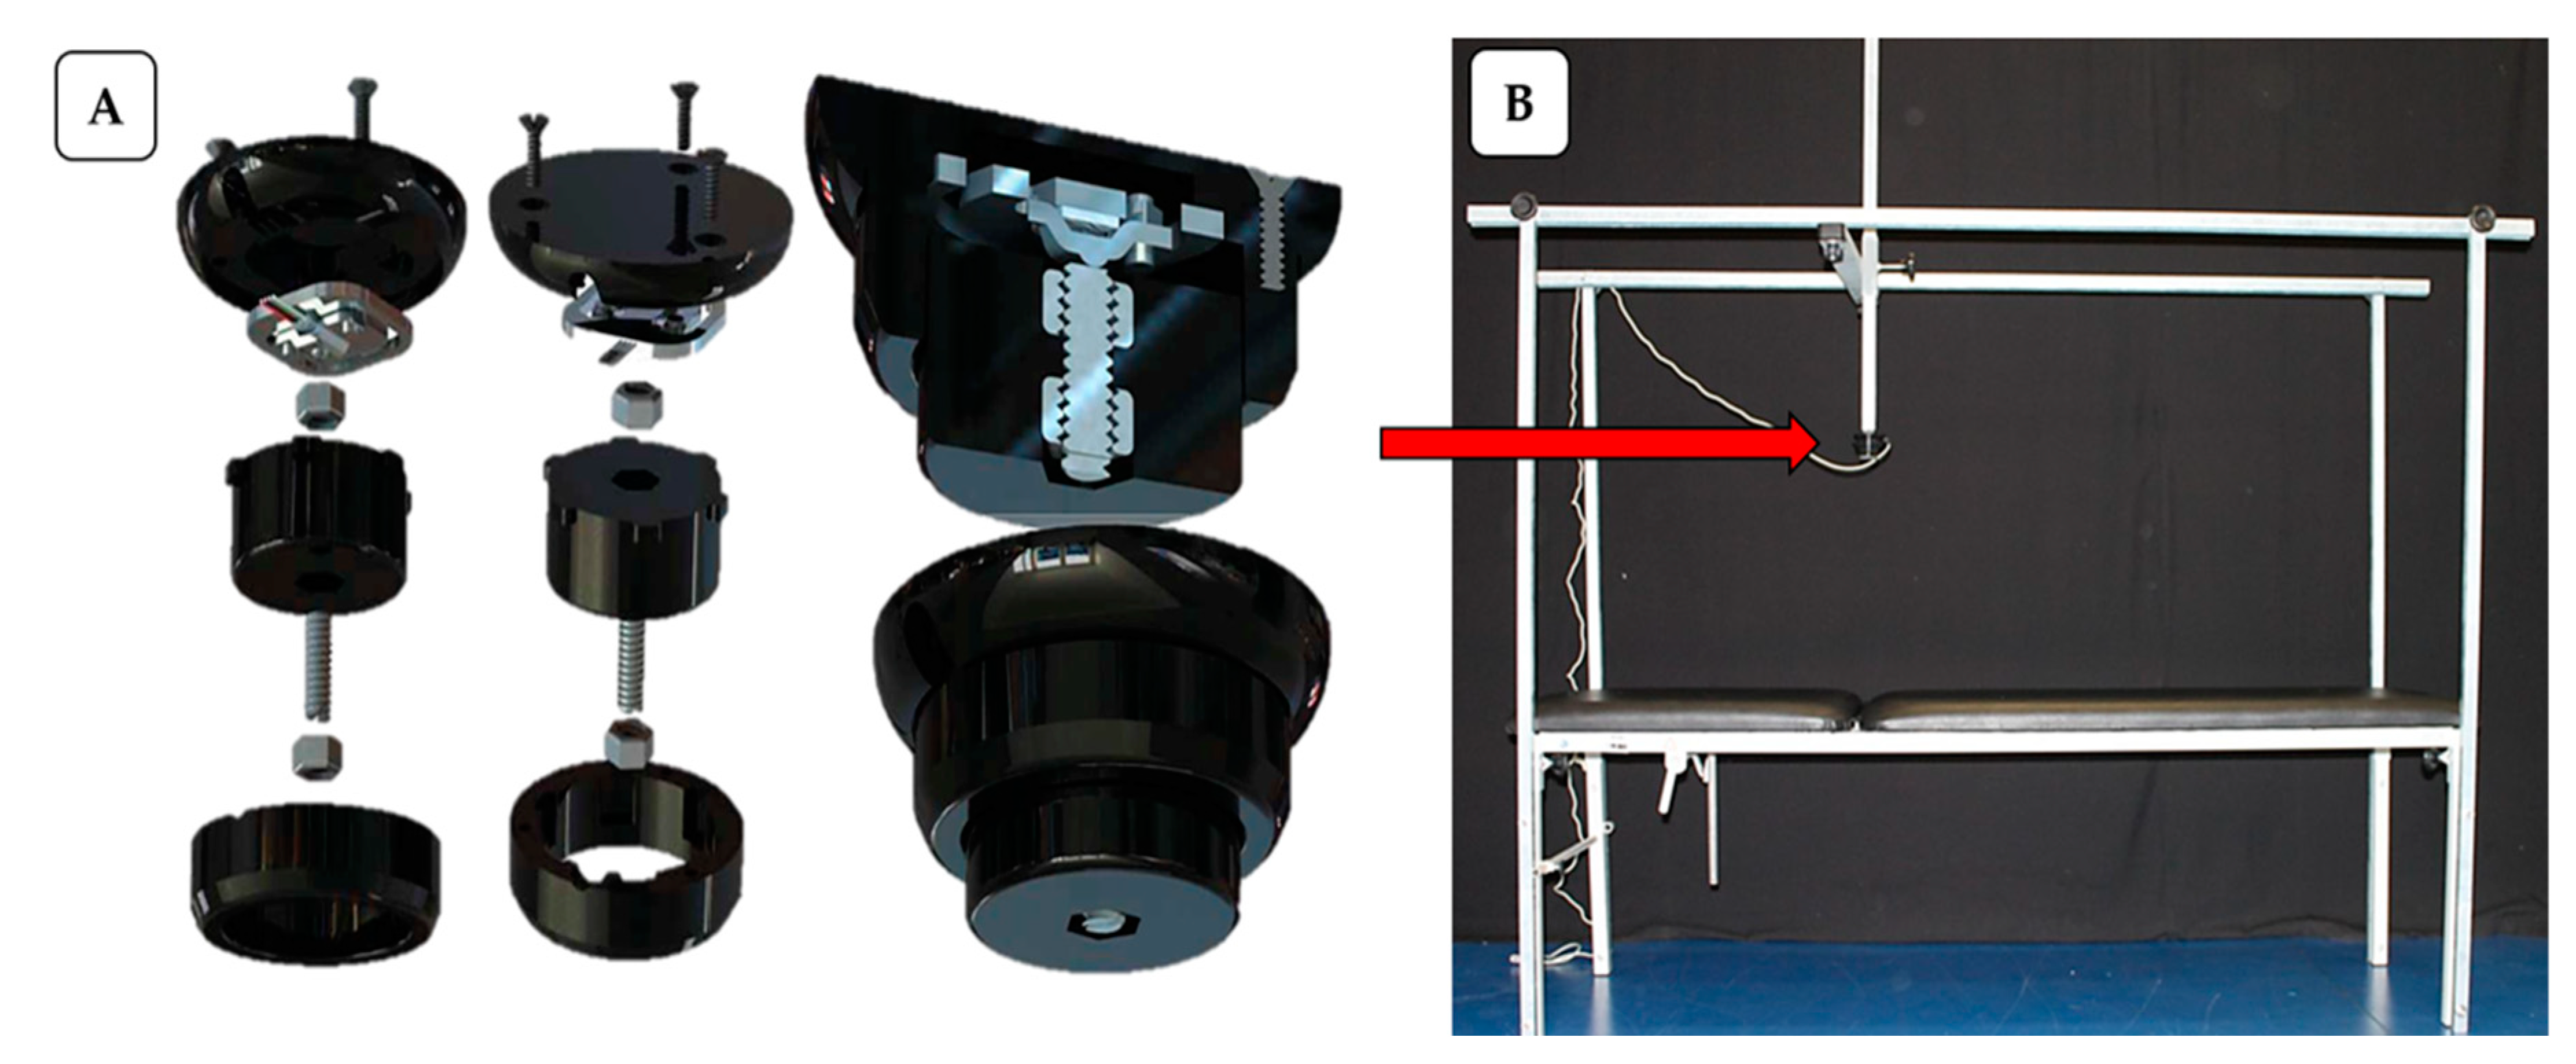
Figure 1. (A) Load cell encapsulation—detailed and expanded model of the assembly and encapsulation of the load cell in a cross-section; (B) final assembled structure—dynamometer fixed in the metal structure, present in a cushion table.
Applsci 15 04081 g001
Figure 2. Experimental procedures. The figure illustrates the test and retest protocol in two steps separated by an interval of 7 days. On the first day (test), participants complete an informed consent form, undergo anthropometric measurements, and perform a familiarization and assessment phase with maximal and submaximal strength exercises. On the second day (retest), only the evaluation of the same exercises takes place to compare the results with the first test.
Applsci 15 04081 g002
Figure 3. Experimental setup: (A) initial position of the volunteer in 20°, (B) volunteer performing trunk extension, and (C) screen display of the trapezoidal model using Delsys® EMG Works 4.8.0 software (Delsys, Natick, MA, USA).
Applsci 15 04081 g003
Figure 4. Correlation and residuals analysis: (A) correlation; (B) residuals vs. fitted values; (C) heteroscedasticity assessment; (D) Q–Q plot of residuals.
Applsci 15 04081 g004
Figure 5. Bland–Altman plots comparing test and retest conditions for peak force, mean force, and steadiness during maximum voluntary contraction (MVC) and submaximal contraction. Legend: * Multiplication between the critical value of the normal distribution (1.96) and the standard deviation of the differences between the measurements.
Applsci 15 04081 g005
Table 1. The test–retest reliability results for MVC and SMVC of the trunk extensors during spinal extension.
Test/RetestDay 1Day 2pCohen’s dMDCSEMICC (95% CI)R2
Maximal voluntary contractions (MVC)
Peak force
(N·kg−1)
4.07
(1.18)
3.88
(1.23)
0.220.581.390.50.81
(0.62, 0.91)
0.71
Submaximal voluntary contraction (SMVC)
Mean Force
(N·kg−1)
1.88
(0.39)
2.07
(0.34)
0.240.451.080.170.93
(0.84, 0.97)
0.88
Steadiness
(%)
1.88
(1.22)
2.46
(1.37)
0.830.442.360.850.87
(0.78, 0.90)
0.40
Legend: Data are presented as mean (SD), Day 1–Day 2 (test/retest), p-value, minimal detectable change (MDC), standard error of measurement (SEM), intraclass correlation coefficient (ICC model 3-K) with 95% confidence intervals (CI), and linear regression coefficient of determination (R2).
Disclaimer/Publisher’s Note: The statements, opinions and data contained in all publications are solely those of the individual author(s) and contributor(s) and not of MDPI and/or the editor(s). MDPI and/or the editor(s) disclaim responsibility for any injury to people or property resulting from any ideas, methods, instructions or products referred to in the content.