
Automated Detection and Biomarker Identification Associated with the Structural and Functional Progression of Glaucoma on Longitudinal Color Fundus Images

 , and
, and
Abstract
1. Introduction
2. Materials and Methods
2.1. Overview
2.2. Data Collection
2.3. Data Preparation
2.4. Data Augmentation
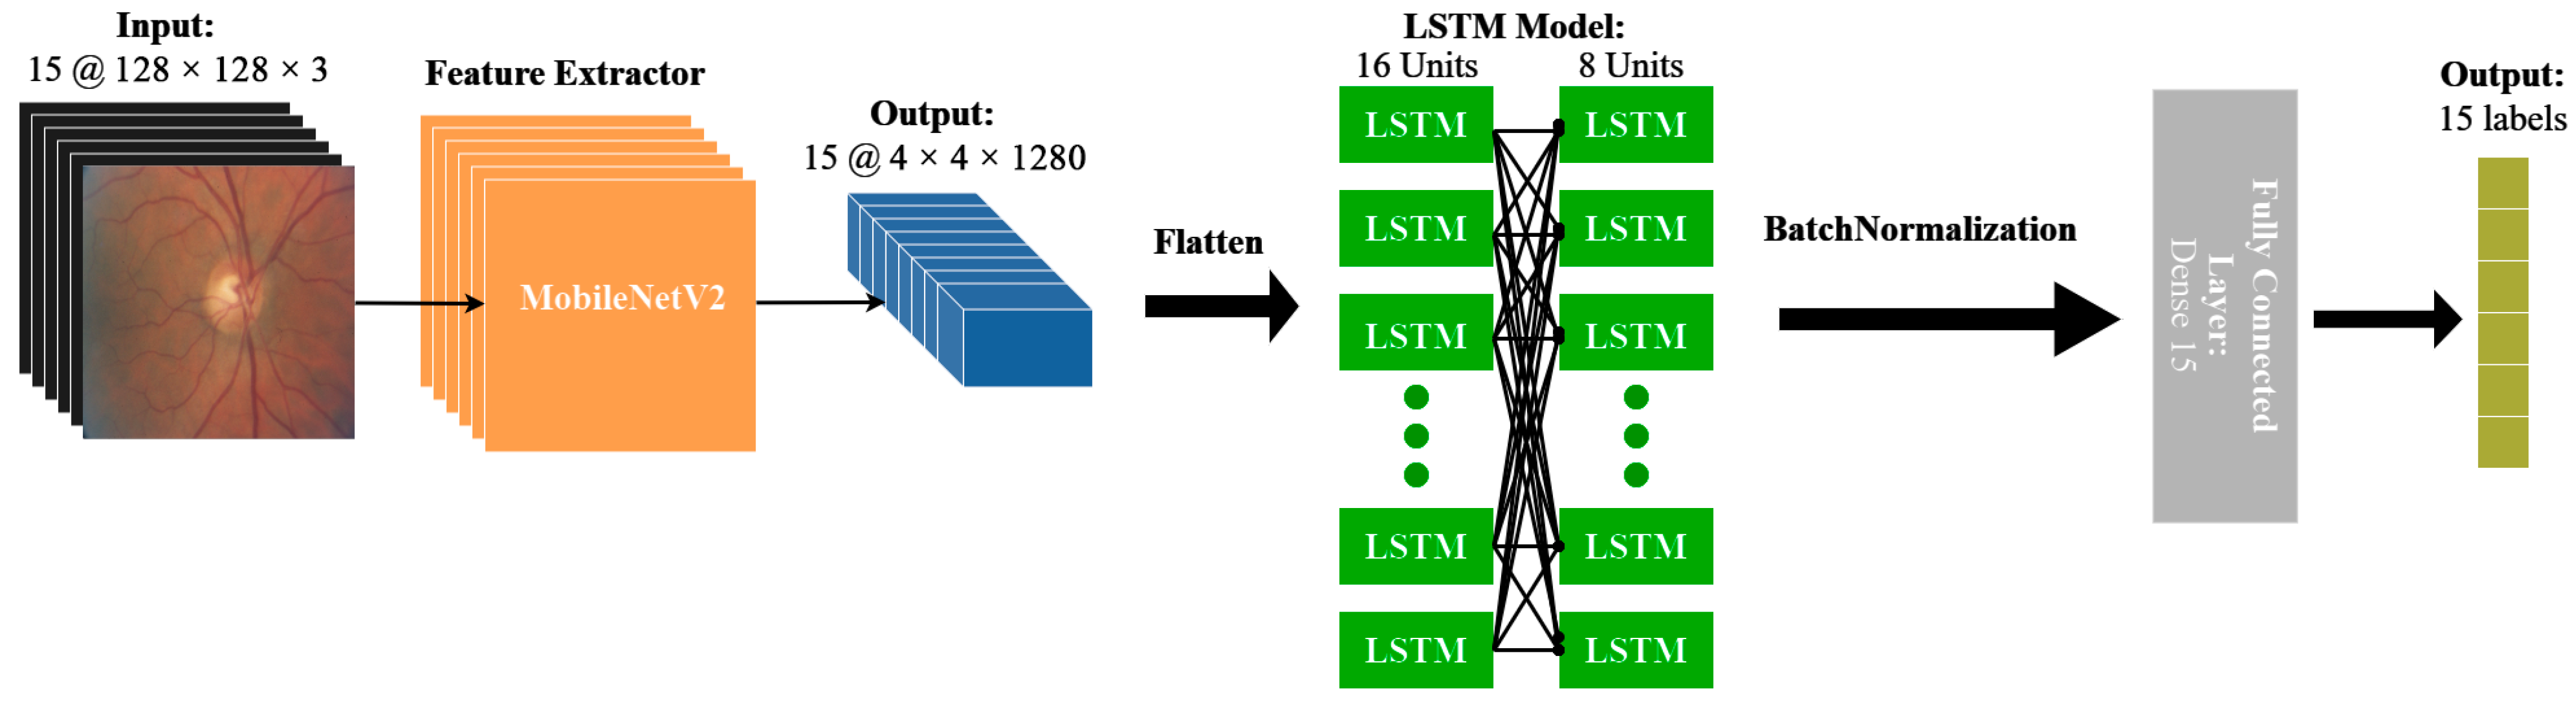
2.5. Model Architecture
2.6. Performance Evaluation
2.7. Statistical Analysis
2.8. Code Availability
3. Results
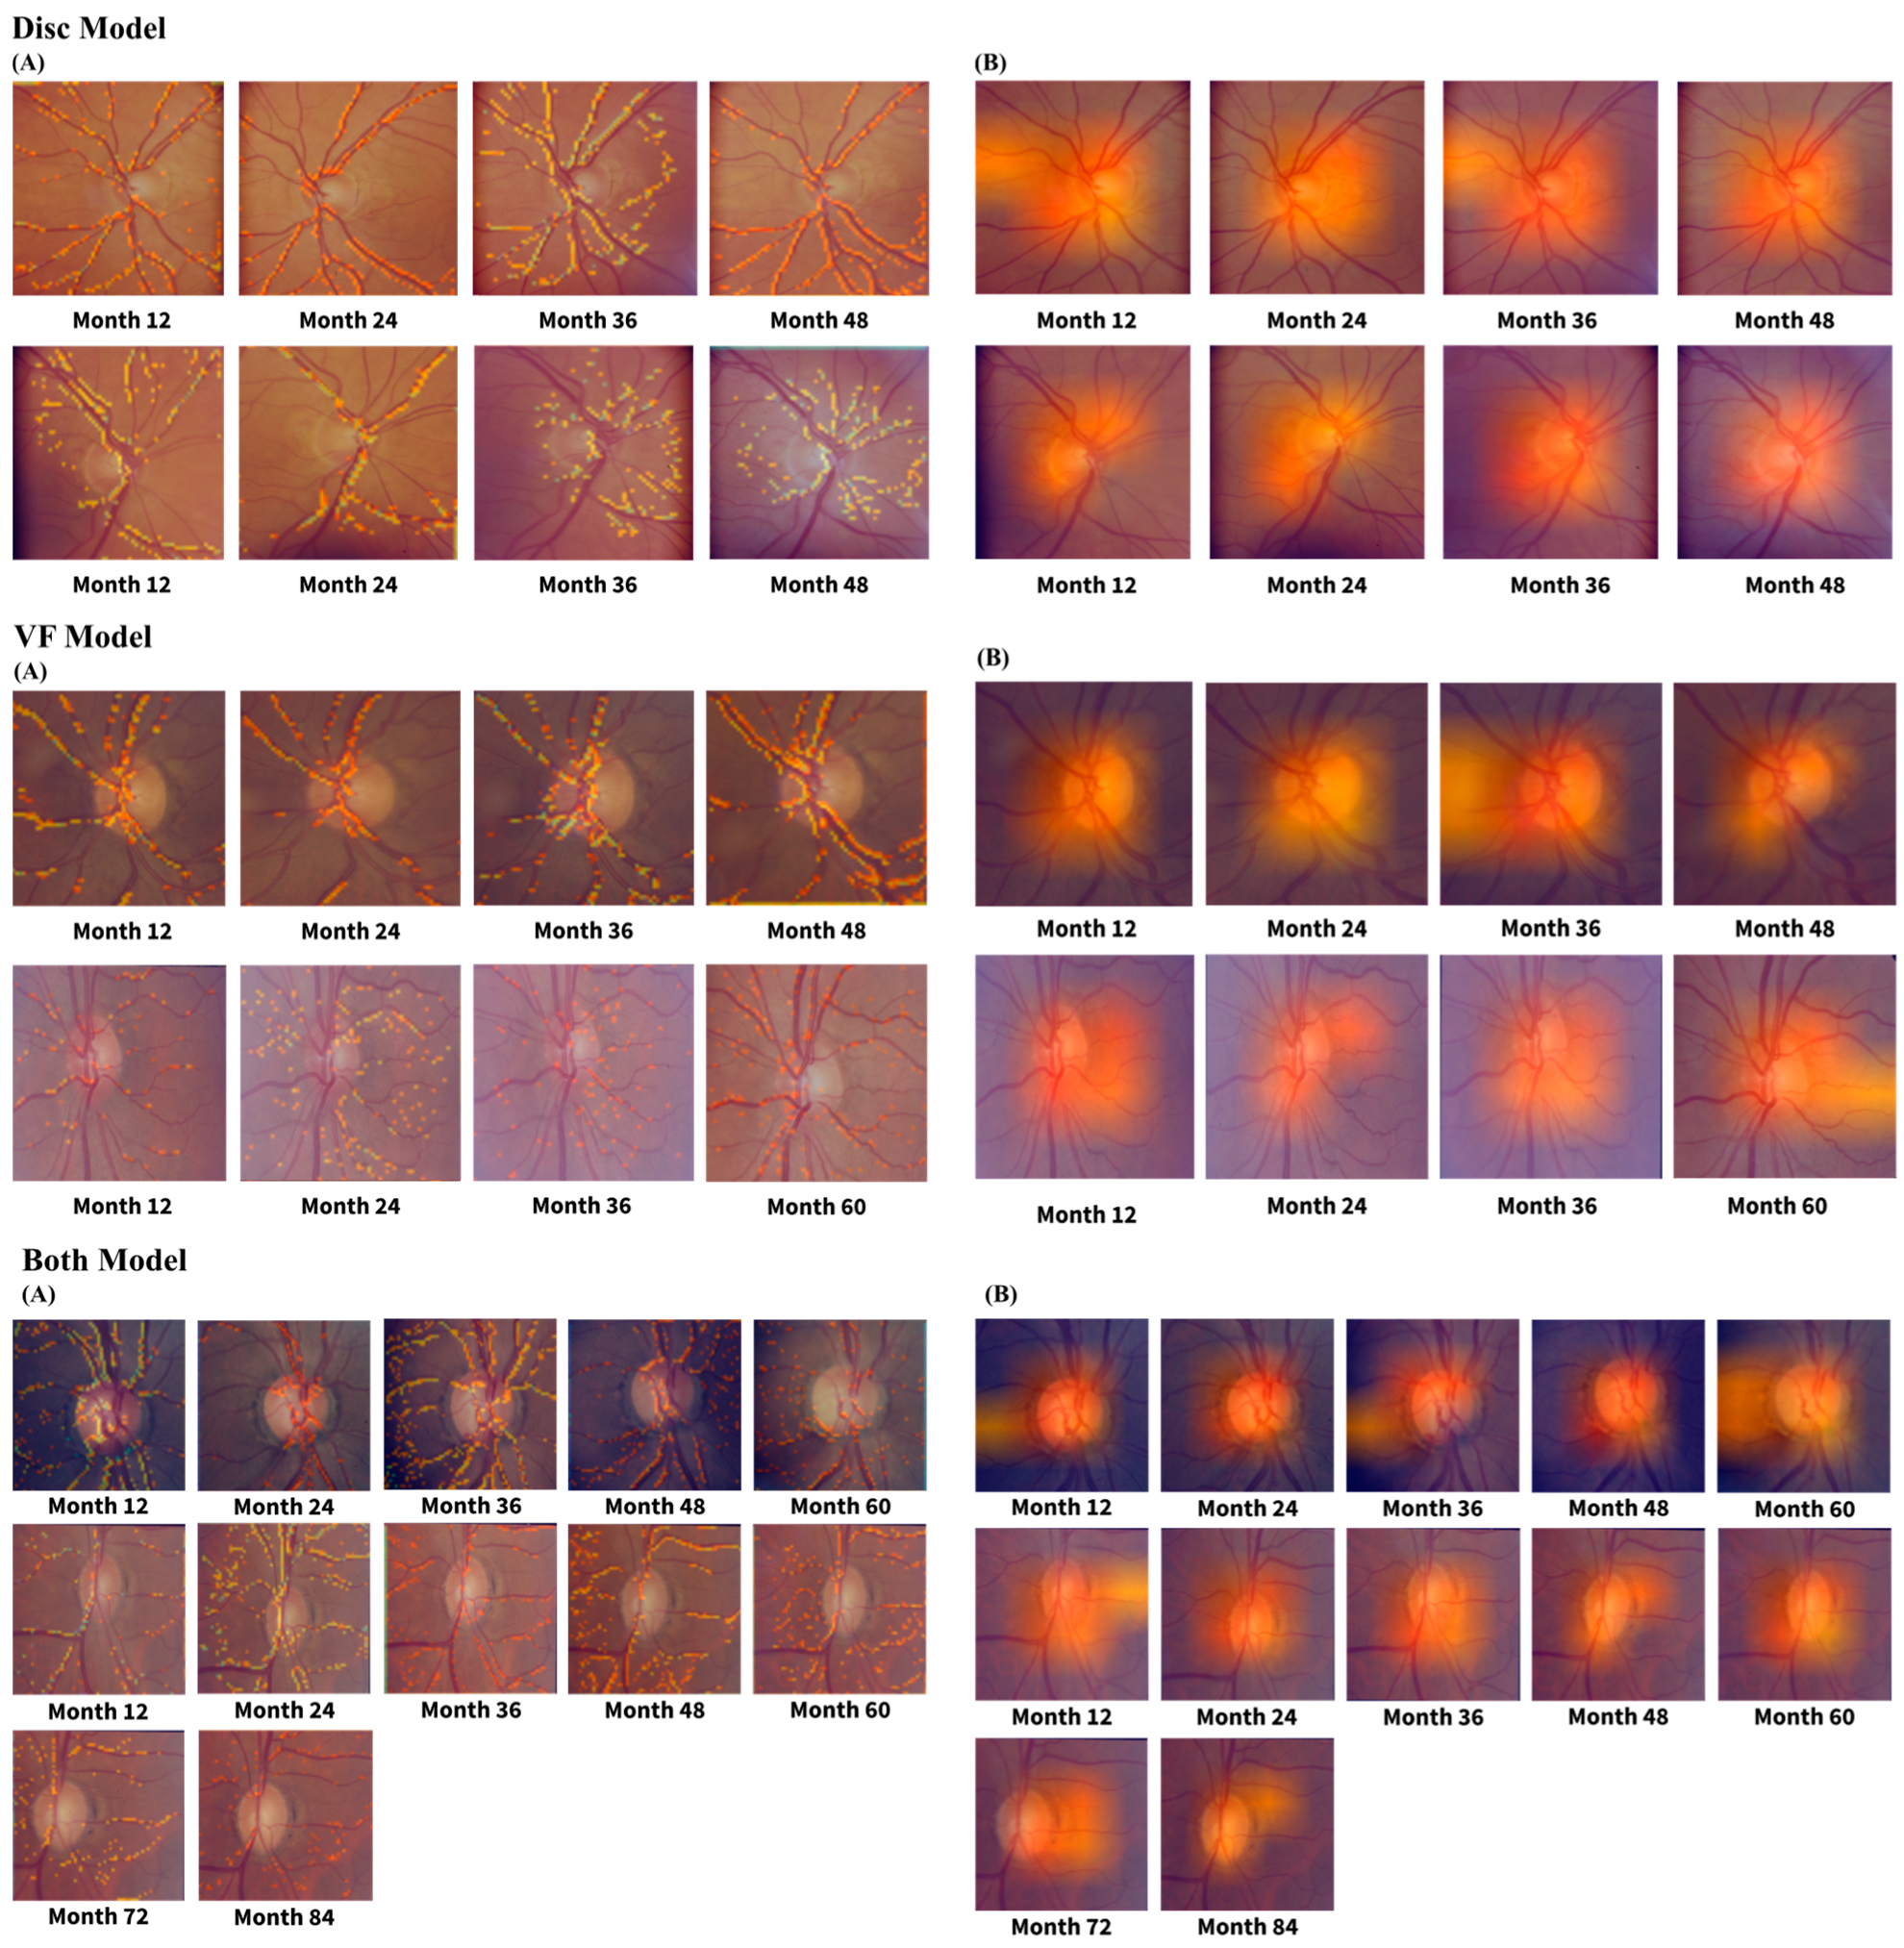
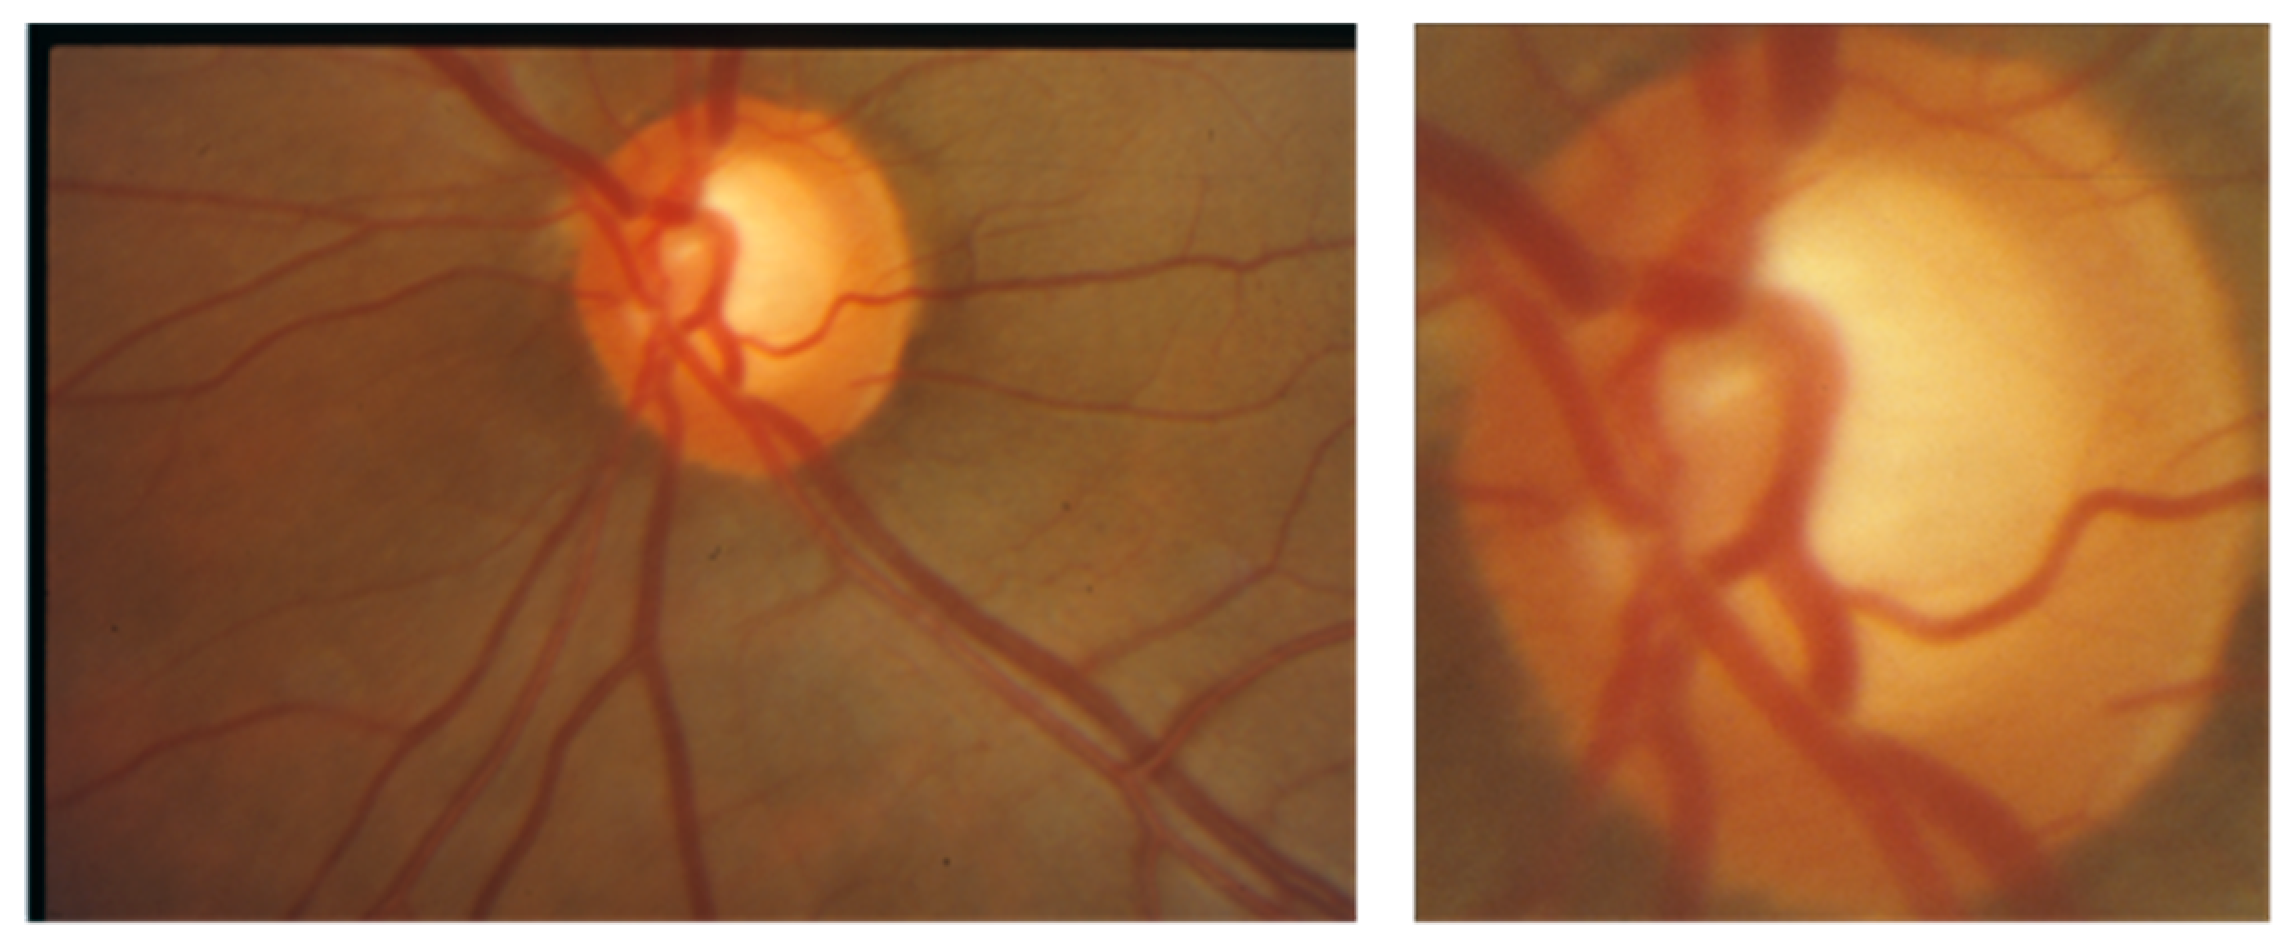
4. Discussion
5. Conclusions
Supplementary Materials
Author Contributions
Funding
Institutional Review Board Statement
Informed Consent Statement
Data Availability Statement
Conflicts of Interest
References
- Parihar, J. Glaucoma: The “Black Hole” of Irreversible Blindness. Med. J. Armed Forces India 2016, 72, 3–4. [Google Scholar] [CrossRef] [PubMed]
- Quigley, H.A.; Broman, A.T. The Number of People with Glaucoma Worldwide in 2010 and 2020. Br. J. Ophthalmol. 2006, 90, 262–267. [Google Scholar] [CrossRef]
- Weinreb, R.N.; Leung, C.K.S.; Crowston, J.G.; Medeiros, F.A.; Friedman, D.S.; Wiggs, J.L.; Martin, K.R. Primary Open-Angle Glaucoma. Nat. Rev. Dis. Primers 2016, 2, 16067. [Google Scholar] [CrossRef]
- Maier, P.C.; Funk, J.; Schwarzer, G.; Antes, G.; Falck-Ytter, Y.T. Treatment of Ocular Hypertension and Open Angle Glaucoma: Meta-Analysis of Randomised Controlled Trials. BMJ 2005, 331, 134. [Google Scholar] [CrossRef]
- Coleman, A.L.; Miglior, S. Risk Factors for Glaucoma Onset and Progression. Surv. Ophthalmol. 2008, 53 (Suppl. S1), S3–S10. [Google Scholar] [CrossRef]
- Gordon, M.O.; Kass, M.A. For the Ocular Hypertension Treatment Study Group. The Ocular Hypertension Treatment Study: Design and Baseline Description of the Participants. Arch. Ophthalmol. 1999, 117, 573–583. [Google Scholar] [CrossRef]
- Kass, M.A.; Heuer, D.K.; Higginbotham, E.J.; Johnson, C.A.; Keltner, J.L.; Miller, J.P.; Parrish, R.K., 2nd; Wilson, M.R.; Gordon, M.O. The Ocular Hypertension Treatment Study: A Randomized Trial Determines That Topical Ocular Hypotensive Medication Delays or Prevents the Onset of Primary Open-Angle Glaucoma. Arch. Ophthalmol. 2002, 120, 701–713, discussion 829–830. [Google Scholar] [CrossRef]
- Shoukat, A.; Akbar, S.; Hassan, S.A.; Iqbal, S.; Mehmood, A.; Ilyas, Q.M. Automatic Diagnosis of Glaucoma from Retinal Images Using Deep Learning Approach. Diagnostics 2023, 13, 1738. [Google Scholar] [CrossRef] [PubMed]
- Doozandeh, A.; Yazdani, S.; Pakravan, M.; Ghasemi, Z.; Hassanpour, K.; Hatami, M.; Ansari, I. Risk of Missed Diagnosis of Primary Open-Angle Glaucoma by Eye Care Providers. J. Curr. Ophthalmol. 2022, 34, 404–408. [Google Scholar] [CrossRef]
- Varma, R.; Lee, P.P.; Goldberg, I.; Kotak, S. An Assessment of the Health and Economic Burdens of Glaucoma. Am. J. Ophthalmol. 2011, 152, 515–522. [Google Scholar] [CrossRef] [PubMed]
- Delgado, M.F.; Abdelrahman, A.M.; Terahi, M.; Miro Quesada Woll, J.J.; Gil-Carrasco, F.; Cook, C.; Benharbit, M.; Boisseau, S.; Chung, E.; Hadjiat, Y.; et al. Management of Glaucoma in Developing Countries: Challenges and Opportunities for Improvement. Clinicoecon. Outcomes Res. 2019, 11, 591–604. [Google Scholar] [CrossRef] [PubMed]
- Berkowitz, S.T.; Finn, A.P.; Parikh, R.; Kuriyan, A.E.; Patel, S. Ophthalmology Workforce Projections in the United States, 2020 to 2035. Ophthalmology 2024, 131, 133–139. [Google Scholar] [CrossRef] [PubMed]
- Adekoya, B.J.; Adepoju, F.G.; Moshood, K.F.; Balarabe, A.H. Challenges in the Management of Glaucoma in a Developing Country; A Qualitative Study of Providers’ Perspectives. Niger. J. Med. 2015, 24, 315. [Google Scholar] [CrossRef]
- Gibson, D.M. Eye Care Availability and Access among Individuals with Diabetes, Diabetic Retinopathy, or Age-Related Macular Degeneration. JAMA Ophthalmol. 2014, 132, 471–477. [Google Scholar] [CrossRef]
- Wang, K.M.; Tseng, V.L.; Liu, X.; Pan, D.; Yu, F.; Baker, R.; Mondino, B.J.; Coleman, A.L. Association between Geographic Distribution of Eye Care Clinicians and Visual Impairment in California. JAMA Ophthalmol. 2022, 140, 577–584. [Google Scholar] [CrossRef] [PubMed]
- Gibson, D.M. The Local Availability of Eye Care Providers and the Vision Health of Adults in the United States. Ophthalmic Epidemiol. 2016, 23, 223–231. [Google Scholar] [CrossRef]
- Wang, F.; Javitt, J.C. Eye Care for Elderly Americans with Diabetes Mellitus. Failure to Meet Current Guidelines. Ophthalmology 1996, 103, 1744–1750. [Google Scholar] [CrossRef]
- Chou, C.-F.; Zhang, X.; Crews, J.E.; Barker, L.E.; Lee, P.P.; Saaddine, J.B. Impact of Geographic Density of Eye Care Professionals on Eye Care among Adults with Diabetes. Ophthalmic Epidemiol. 2012, 19, 340–349. [Google Scholar] [CrossRef] [PubMed]
- Tielsch, J.M.; Sommer, A.; Katz, J.; Royall, R.M.; Quigley, H.A.; Javitt, J. Racial Variations in the Prevalence of Primary Open-Angle Glaucoma. The Baltimore Eye Survey. JAMA 1991, 266, 369–374. [Google Scholar] [CrossRef]
- Stein, J.D.; Kim, D.S.; Niziol, L.M.; Talwar, N.; Nan, B.; Musch, D.C.; Richards, J.E. Differences in Rates of Glaucoma among Asian Americans and Other Racial Groups, and among Various Asian Ethnic Groups. Ophthalmology 2011, 118, 1031–1037. [Google Scholar] [CrossRef]
- Nathan, N.; Joos, K.M. Glaucoma Disparities in the Hispanic Population. Semin. Ophthalmol. 2016, 31, 394–399. [Google Scholar] [CrossRef]
- Zhang, X.; Beckles, G.L.; Chou, C.-F.; Saaddine, J.B.; Wilson, M.R.; Lee, P.P.; Parvathy, N.; Ryskulova, A.; Geiss, L.S. Socioeconomic Disparity in Use of Eye Care Services among US Adults with Age-Related Eye Diseases: National Health Interview Survey, 2002 and 2008. JAMA Ophthalmol. 2013, 131, 1198–1206. [Google Scholar] [CrossRef] [PubMed]
- Gracitelli, C.P.B.; Zangwill, L.M.; Diniz-Filho, A.; Abe, R.Y.; Girkin, C.A.; Weinreb, R.N.; Liebmann, J.M.; Medeiros, F.A. Detection of Glaucoma Progression in Individuals of African Descent Compared with Those of European Descent. JAMA Ophthalmol. 2018, 136, 329–335. [Google Scholar] [CrossRef]
- Stagg, B.; Mariottoni, E.B.; Berchuck, S.; Jammal, A.; Elam, A.R.; Hess, R.; Kawamoto, K.; Haaland, B.; Medeiros, F.A. Longitudinal Visual Field Variability and the Ability to Detect Glaucoma Progression in Black and White Individuals. Br. J. Ophthalmol. 2022, 106, 1115–1120. [Google Scholar] [CrossRef] [PubMed]
- Stein, J.D.; Talwar, N.; Laverne, A.M.; Nan, B.; Lichter, P.R. Racial Disparities in the Use of Ancillary Testing to Evaluate Individuals with Open-Angle Glaucoma. Arch. Ophthalmol. 2012, 130, 1579–1588. [Google Scholar] [CrossRef] [PubMed]
- Murakami, Y.; Lee, B.W.; Duncan, M.; Kao, A.; Huang, J.-Y.; Singh, K.; Lin, S.C. Racial and Ethnic Disparities in Adherence to Glaucoma Follow-up Visits in a County Hospital Population. Arch. Ophthalmol. 2011, 129, 872–878. [Google Scholar] [CrossRef] [PubMed]
- Awidi, A.A.; Wang, J.; Varadaraj, V.; Ali, M.; Cai, C.X.; Sommer, A.; Ramulu, P.Y.; Woreta, F.A. The Impact of Social Determinants of Health on Vision Loss from Cataracts and Cataract Surgery Utilization in the United States-A National Health Interview Survey Analysis. Am. J. Ophthalmol. 2023, 254, 44–53. [Google Scholar] [CrossRef] [PubMed]
- Delavar, A.; Radha Saseendrakumar, B.; Weinreb, R.N.; Baxter, S.L. Racial and Ethnic Disparities in Cost-Related Barriers to Medication Adherence among Patients with Glaucoma Enrolled in the National Institutes of Health All of Us Research Program. JAMA Ophthalmol. 2022, 140, 354–361. [Google Scholar] [CrossRef] [PubMed]
- Davuluru, S.S.; Jess, A.T.; Kim, J.S.B.; Yoo, K.; Nguyen, V.; Xu, B.Y. Identifying, Understanding, and Addressing Disparities in Glaucoma Care in the United States. Transl. Vis. Sci. Technol. 2023, 12, 18. [Google Scholar] [CrossRef] [PubMed]
- Sleath, B.; Blalock, S.; Covert, D.; Stone, J.L.; Skinner, A.C.; Muir, K.; Robin, A.L. The Relationship between Glaucoma Medication Adherence, Eye Drop Technique, and Visual Field Defect Severity. Ophthalmology 2011, 118, 2398–2402. [Google Scholar] [CrossRef]
- Almidani, L.; Bradley, C.; Herbert, P.; Ramulu, P.; Yohannan, J. The Impact of Social Vulnerability on Structural and Functional Glaucoma Severity, Worsening, and Variability. Ophthalmol. Glaucoma 2024, 7, 380–390. [Google Scholar] [CrossRef]
- Velpula, V.K.; Sharma, L.D. Multi-Stage Glaucoma Classification Using Pre-Trained Convolutional Neural Networks and Voting-Based Classifier Fusion. Front. Physiol. 2023, 14, 1175881. [Google Scholar] [CrossRef] [PubMed]
- Kashyap, R.; Nair, R.; Gangadharan, S.M.P.; Botto-Tobar, M.; Farooq, S.; Rizwan, A. Glaucoma Detection and Classification Using Improved U-Net Deep Learning Model. Healthcare 2022, 10, 2497. [Google Scholar] [CrossRef]
- Hemelings, R.; Elen, B.; Schuster, A.K.; Blaschko, M.B.; Barbosa-Breda, J.; Hujanen, P.; Junglas, A.; Nickels, S.; White, A.; Pfeiffer, N.; et al. A Generalizable Deep Learning Regression Model for Automated Glaucoma Screening from Fundus Images. NPJ Digit. Med. 2023, 6, 112. [Google Scholar] [CrossRef] [PubMed]
- Fan, R.; Bowd, C.; Christopher, M.; Brye, N.; Proudfoot, J.A.; Rezapour, J.; Belghith, A.; Goldbaum, M.H.; Chuter, B.; Girkin, C.A.; et al. Detecting Glaucoma in the Ocular Hypertension Study Using Deep Learning. JAMA Ophthalmol. 2022, 140, 383–391. [Google Scholar] [CrossRef] [PubMed]
- Mishra, Z.; Wang, Z.; Xu, E.; Xu, S.; Majid, I.; Sadda, S.R.; Hu, Z.J. Recurrent and Concurrent Prediction of Longitudinal Progression of Stargardt Atrophy and Geographic Atrophy. medRxiv 2024. [Google Scholar] [CrossRef]
- Vuppu, V.M.; Kumari, P.L.S. Early Glaucoma Detection Using LSTM-CNN Integrated with Multi Class SVM. Eng. Technol. Appl. Sci. Res. 2024, 14, 15645–15650. [Google Scholar] [CrossRef]
- Hussain, S.; Chua, J.; Wong, D.; Lo, J.; Kadziauskiene, A.; Asoklis, R.; Barbastathis, G.; Schmetterer, L.; Yong, L. Predicting Glaucoma Progression Using Deep Learning Framework Guided by Generative Algorithm. Sci. Rep. 2023, 13, 19960. [Google Scholar] [CrossRef]
- Jetley, S.; Lord, N.A.; Lee, N.; Torr, P.H.S. Learn to Pay Attention. arXiv 2018, arXiv:1804.02391. [Google Scholar]
- Oktay, O.; Schlemper, J.; Folgoc, L.L.; Lee, M.; Heinrich, M.; Misawa, K.; Mori, K.; McDonagh, S.; Hammerla, N.Y.; Kainz, B.; et al. Attention U-Net: Learning Where to Look for the Pancreas. arXiv 2018, arXiv:1804.03999. [Google Scholar]
- Wang, Z.; Sadda, S.R.; Lee, A.; Hu, Z.J. Automated Segmentation and Feature Discovery of Age-Related Macular Degeneration and Stargardt Disease via Self-Attended Neural Networks. Sci. Rep. 2022, 12, 14565. [Google Scholar] [CrossRef] [PubMed]
- Wang, S.; Wang, Z.; Vejalla, S.; Ganegoda, A.; Nittala, M.G.; Sadda, S.R.; Hu, Z.J. Reverse Engineering for Reconstructing Baseline Features of Dry Age-Related Macular Degeneration in Optical Coherence Tomography. Sci. Rep. 2022, 12, 22620. [Google Scholar] [CrossRef] [PubMed]
- Saha, S.; Wang, Z.; Sadda, S.; Kanagasingam, Y.; Hu, Z. Visualizing and Understanding Inherent Features in SD-OCT for the Progression of Age-Related Macular Degeneration Using Deconvolutional Neural Networks. Appl. AI Lett. 2020, 1, e16. [Google Scholar] [CrossRef] [PubMed]
- Selvaraju, R.R.; Cogswell, M.; Das, A.; Vedantam, R.; Parikh, D.; Batra, D. Grad-CAM: Visual Explanations from Deep Networks via Gradient-Based Localization. In Proceedings of the 2017 IEEE International Conference on Computer Vision (ICCV), Venice, Italy, 29 October 2017; pp. 618–626. [Google Scholar]
- Sandler, M.; Howard, A.; Zhu, M.; Zhmoginov, A.; Chen, L.-C. MobileNetV2: Inverted Residuals and Linear Bottlenecks. In Proceedings of the IEEE Conference on Computer Vision and Pattern Recognition, Salt Lake City, UT, USA, 18–23 June 2018. [Google Scholar]
- Deng, J.; Dong, W.; Socher, R.; Li, L.-J.; Li, K.; Li, F.-F. ImageNet: A Large-Scale Hierarchical Image Database. In Proceedings of the 2009 IEEE Conference on Computer Vision and Pattern Recognition, Miami, FL, USA, 20–25 June 2009; pp. 248–255. [Google Scholar]
- Pedregosa, F.; Varoquaux, G.; Gramfort, A.; Michel, V.; Thirion, B.; Grisel, O.; Blondel, M.; Müller, A.; Nothman, J.; Louppe, G.; et al. Scikit-Learn: Machine Learning in Python. J. Mach. Learn. Res. 2011, 12, 2825–2830. [Google Scholar] [CrossRef]
- Fan, R.; Alipour, K.; Bowd, C.; Christopher, M.; Brye, N.; Proudfoot, J.A.; Goldbaum, M.H.; Belghith, A.; Girkin, C.A.; Fazio, M.A.; et al. Detecting Glaucoma from Fundus Photographs Using Deep Learning without Convolutions: Transformer for Improved Generalization. Ophthalmol. Sci. 2023, 3, 100233. [Google Scholar] [CrossRef] [PubMed]
- Mursch-Edlmayr, A.S.; Ng, W.S.; Diniz-Filho, A.; Sousa, D.C.; Arnold, L.; Schlenker, M.B.; Duenas-Angeles, K.; Keane, P.A.; Crowston, J.G.; Jayaram, H. Artificial Intelligence Algorithms to Diagnose Glaucoma and Detect Glaucoma Progression: Translation to Clinical Practice. Transl. Vis. Sci. Technol. 2020, 9, 55. [Google Scholar] [CrossRef]
- Bowd, C.; Hao, J.; Tavares, I.M.; Medeiros, F.A.; Zangwill, L.M.; Lee, T.-W.; Sample, P.A.; Weinreb, R.N.; Goldbaum, M.H. Bayesian Machine Learning Classifiers for Combining Structural and Functional Measurements to Classify Healthy and Glaucomatous Eyes. Investig. Ophthalmol. Vis. Sci. 2008, 49, 945–953. [Google Scholar] [CrossRef] [PubMed]
- Brigatti, L.; Hoffman, D.; Caprioli, J. Neural Networks to Identify Glaucoma with Structural and Functional Measurements. Am. J. Ophthalmol. 1996, 121, 511–521. [Google Scholar] [CrossRef]
- Grewal, D.S.; Jain, R.; Grewal, S.P.S.; Rihani, V. Artificial Neural Network-Based Glaucoma Diagnosis Using Retinal Nerve Fiber Layer Analysis. Eur. J. Ophthalmol. 2008, 18, 915–921. [Google Scholar] [CrossRef]
- Silva, F.R.; Vidotti, V.G.; Cremasco, F.; Dias, M.; Gomi, E.S.; Costa, V.P. Sensitivity and Specificity of Machine Learning Classifiers for Glaucoma Diagnosis Using Spectral Domain OCT and Standard Automated Perimetry. Arq. Bras. Oftalmol. 2013, 76, 170–174. [Google Scholar] [CrossRef] [PubMed]
- Sugimoto, K.; Murata, H.; Hirasawa, H.; Aihara, M.; Mayama, C.; Asaoka, R. Cross-Sectional Study: Does Combining Optical Coherence Tomography Measurements Using the “Random Forest” Decision Tree Classifier Improve the Prediction of the Presence of Perimetric Deterioration in Glaucoma Suspects? BMJ Open 2013, 3, e003114. [Google Scholar] [CrossRef]
- Liu, L.; Jia, Y.; Takusagawa, H.L.; Pechauer, A.D.; Edmunds, B.; Lombardi, L.; Davis, E.; Morrison, J.C.; Huang, D. Optical Coherence Tomography Angiography of the Peripapillary Retina in Glaucoma. JAMA Ophthalmol. 2015, 133, 1045–1052. [Google Scholar] [CrossRef]
- Chen, A.; Wei, P.; Wang, J.; Liu, L.; Camino, A.; Guo, Y.; Tan, O.; Jia, Y.; Huang, D. Glaucomatous Focal Perfusion Loss in the Macula Measured by Optical Coherence Tomographic Angiography. Am. J. Ophthalmol. 2024, 268, 181–189. [Google Scholar] [CrossRef] [PubMed]
- Takusagawa, H.L.; Liu, L.; Ma, K.N.; Jia, Y.; Gao, S.S.; Zhang, M.; Edmunds, B.; Parikh, M.; Tehrani, S.; Morrison, J.C.; et al. Projection-Resolved Optical Coherence Tomography Angiography of Macular Retinal Circulation in Glaucoma. Ophthalmology 2017, 124, 1589–1599. [Google Scholar] [CrossRef] [PubMed]
- Akil, H.; Chopra, V.; Al-Sheikh, M.; Ghasemi Falavarjani, K.; Huang, A.S.; Sadda, S.R.; Francis, B.A. Swept-Source OCT Angiography Imaging of the Macular Capillary Network in Glaucoma. Br. J. Ophthalmol. 2017, 102, 515–519. [Google Scholar] [CrossRef]
- Tepelus, T.C.; Song, S.; Borrelli, E.; Nittala, M.G.; Baghdasaryan, E.; Sadda, S.R.; Chopra, V. Quantitative Analysis of Retinal and Choroidal Vascular Parameters in Patients with Low Tension Glaucoma. J. Glaucoma 2019, 28, 557–562. [Google Scholar] [CrossRef]
- Mohammadzadeh, V.; Liang, Y.; Moghimi, S.; Xie, P.; Nishida, T.; Mahmoudinezhad, G.; Eslani, M.; Walker, E.; Kamalipour, A.; Micheletti, E.; et al. Detection of Glaucoma Progression on Longitudinal Series of En-Face Macular Optical Coherence Tomography Angiography Images with a Deep Learning Model. Br. J. Ophthalmol. 2024, 108, 1688–1693. [Google Scholar] [CrossRef] [PubMed]
- Nishida, T.; Moghimi, S.; Hou, H.; Proudfoot, J.A.; Chang, A.C.; David, R.C.C.; Kamalipour, A.; El-Nimri, N.; Rezapour, J.; Bowd, C.; et al. Long-Term Reproducibility of Optical Coherence Tomography Angiography in Healthy and Stable Glaucomatous Eyes. Br. J. Ophthalmol. 2023, 107, 657–662. [Google Scholar] [CrossRef]
- Tansuebchueasai, N.; Nishida, T.; Moghimi, S.; Wu, J.-H.; Mahmoudinezhad, G.; Gunasegaran, G.; Kamalipour, A.; Zangwill, L.M.; Weinreb, R.N. Rate of Initial Optic Nerve Head Capillary Density Loss and Risk of Visual Field Progression. JAMA Ophthalmol. 2024, 142, 530–537. [Google Scholar] [CrossRef]
- Wu, J.-H.; Moghimi, S.; Nishida, T.; Mahmoudinezhad, G.; Zangwill, L.M.; Weinreb, R.N. Detection and Agreement of Event-Based OCT and OCTA Analysis for Glaucoma Progression. EYE 2024, 38, 973–979. [Google Scholar] [CrossRef] [PubMed]
- Suh, M.H.; Weinreb, R.N.; Zangwill, L.M. Optic Disc Microvasculature Dropout in Preperimetric Glaucoma. J. Glaucoma 2024, 33, 490–498. [Google Scholar] [CrossRef] [PubMed]
- Wang, X.; Wang, M.; Liu, H.; Mercieca, K.; Prinz, J.; Feng, Y.; Prokosch, V. The Association between Vascular Abnormalities and Glaucoma-What Comes First? Int. J. Mol. Sci. 2023, 24, 3211. [Google Scholar] [CrossRef]
- Galassi, F.; Giambene, B.; Varriale, R. Systemic Vascular Dysregulation and Retrobulbar Hemodynamics in Normal-Tension Glaucoma. Investig. Ophthalmol. Vis. Sci. 2011, 52, 4467–4471. [Google Scholar] [CrossRef] [PubMed]
- Dascalu, A.M.; Stana, D.; Nicolae, V.A.; Cirstoveanu, C.; Vancea, G.; Serban, D.; Socea, B. Association between Vascular Comorbidity and Glaucoma Progression: A Four-Year Observational Study. Exp. Ther. Med. 2021, 21, 283. [Google Scholar] [CrossRef]
- Chung, H.S.; Harris, A.; Evans, D.W.; Kagemann, L.; Garzozi, H.J.; Martin, B. Vascular Aspects in the Pathophysiology of Glaucomatous Optic Neuropathy. Surv. Ophthalmol. 1999, 43 (Suppl. S1), S43–S50. [Google Scholar] [CrossRef]
- Flammer, J.; Orgül, S.; Costa, V.P.; Orzalesi, N.; Krieglstein, G.K.; Serra, L.M.; Renard, J.-P.; Stefánsson, E. The Impact of Ocular Blood Flow in Glaucoma. Prog. Retin. Eye Res. 2002, 21, 359–393. [Google Scholar] [CrossRef] [PubMed]
- Grieshaber, M.C.; Mozaffarieh, M.; Flammer, J. What Is the Link between Vascular Dysregulation and Glaucoma? Surv. Ophthalmol. 2007, 52 (Suppl. S2), S144–S154. [Google Scholar] [CrossRef] [PubMed]
- Shin, J.D.; Wolf, A.T.; Harris, A.; Verticchio Vercellin, A.; Siesky, B.; Rowe, L.W.; Packles, M.; Oddone, F. Vascular Biomarkers from Optical Coherence Tomography Angiography and Glaucoma: Where Do We Stand in 2021? Acta Ophthalmol. 2022, 100, e377–e385. [Google Scholar] [CrossRef] [PubMed]
- Chan, K.K.W.; Tang, F.; Tham, C.C.Y.; Young, A.L.; Cheung, C.Y. Retinal Vasculature in Glaucoma: A Review. BMJ Open Ophthalmol. 2017, 1, e000032. [Google Scholar] [CrossRef]
- Ahmad, S.S. Controversies in the Vascular Theory of Glaucomatous Optic Nerve Degeneration. Taiwan J. Ophthalmol. 2016, 6, 182–186. [Google Scholar] [CrossRef] [PubMed]

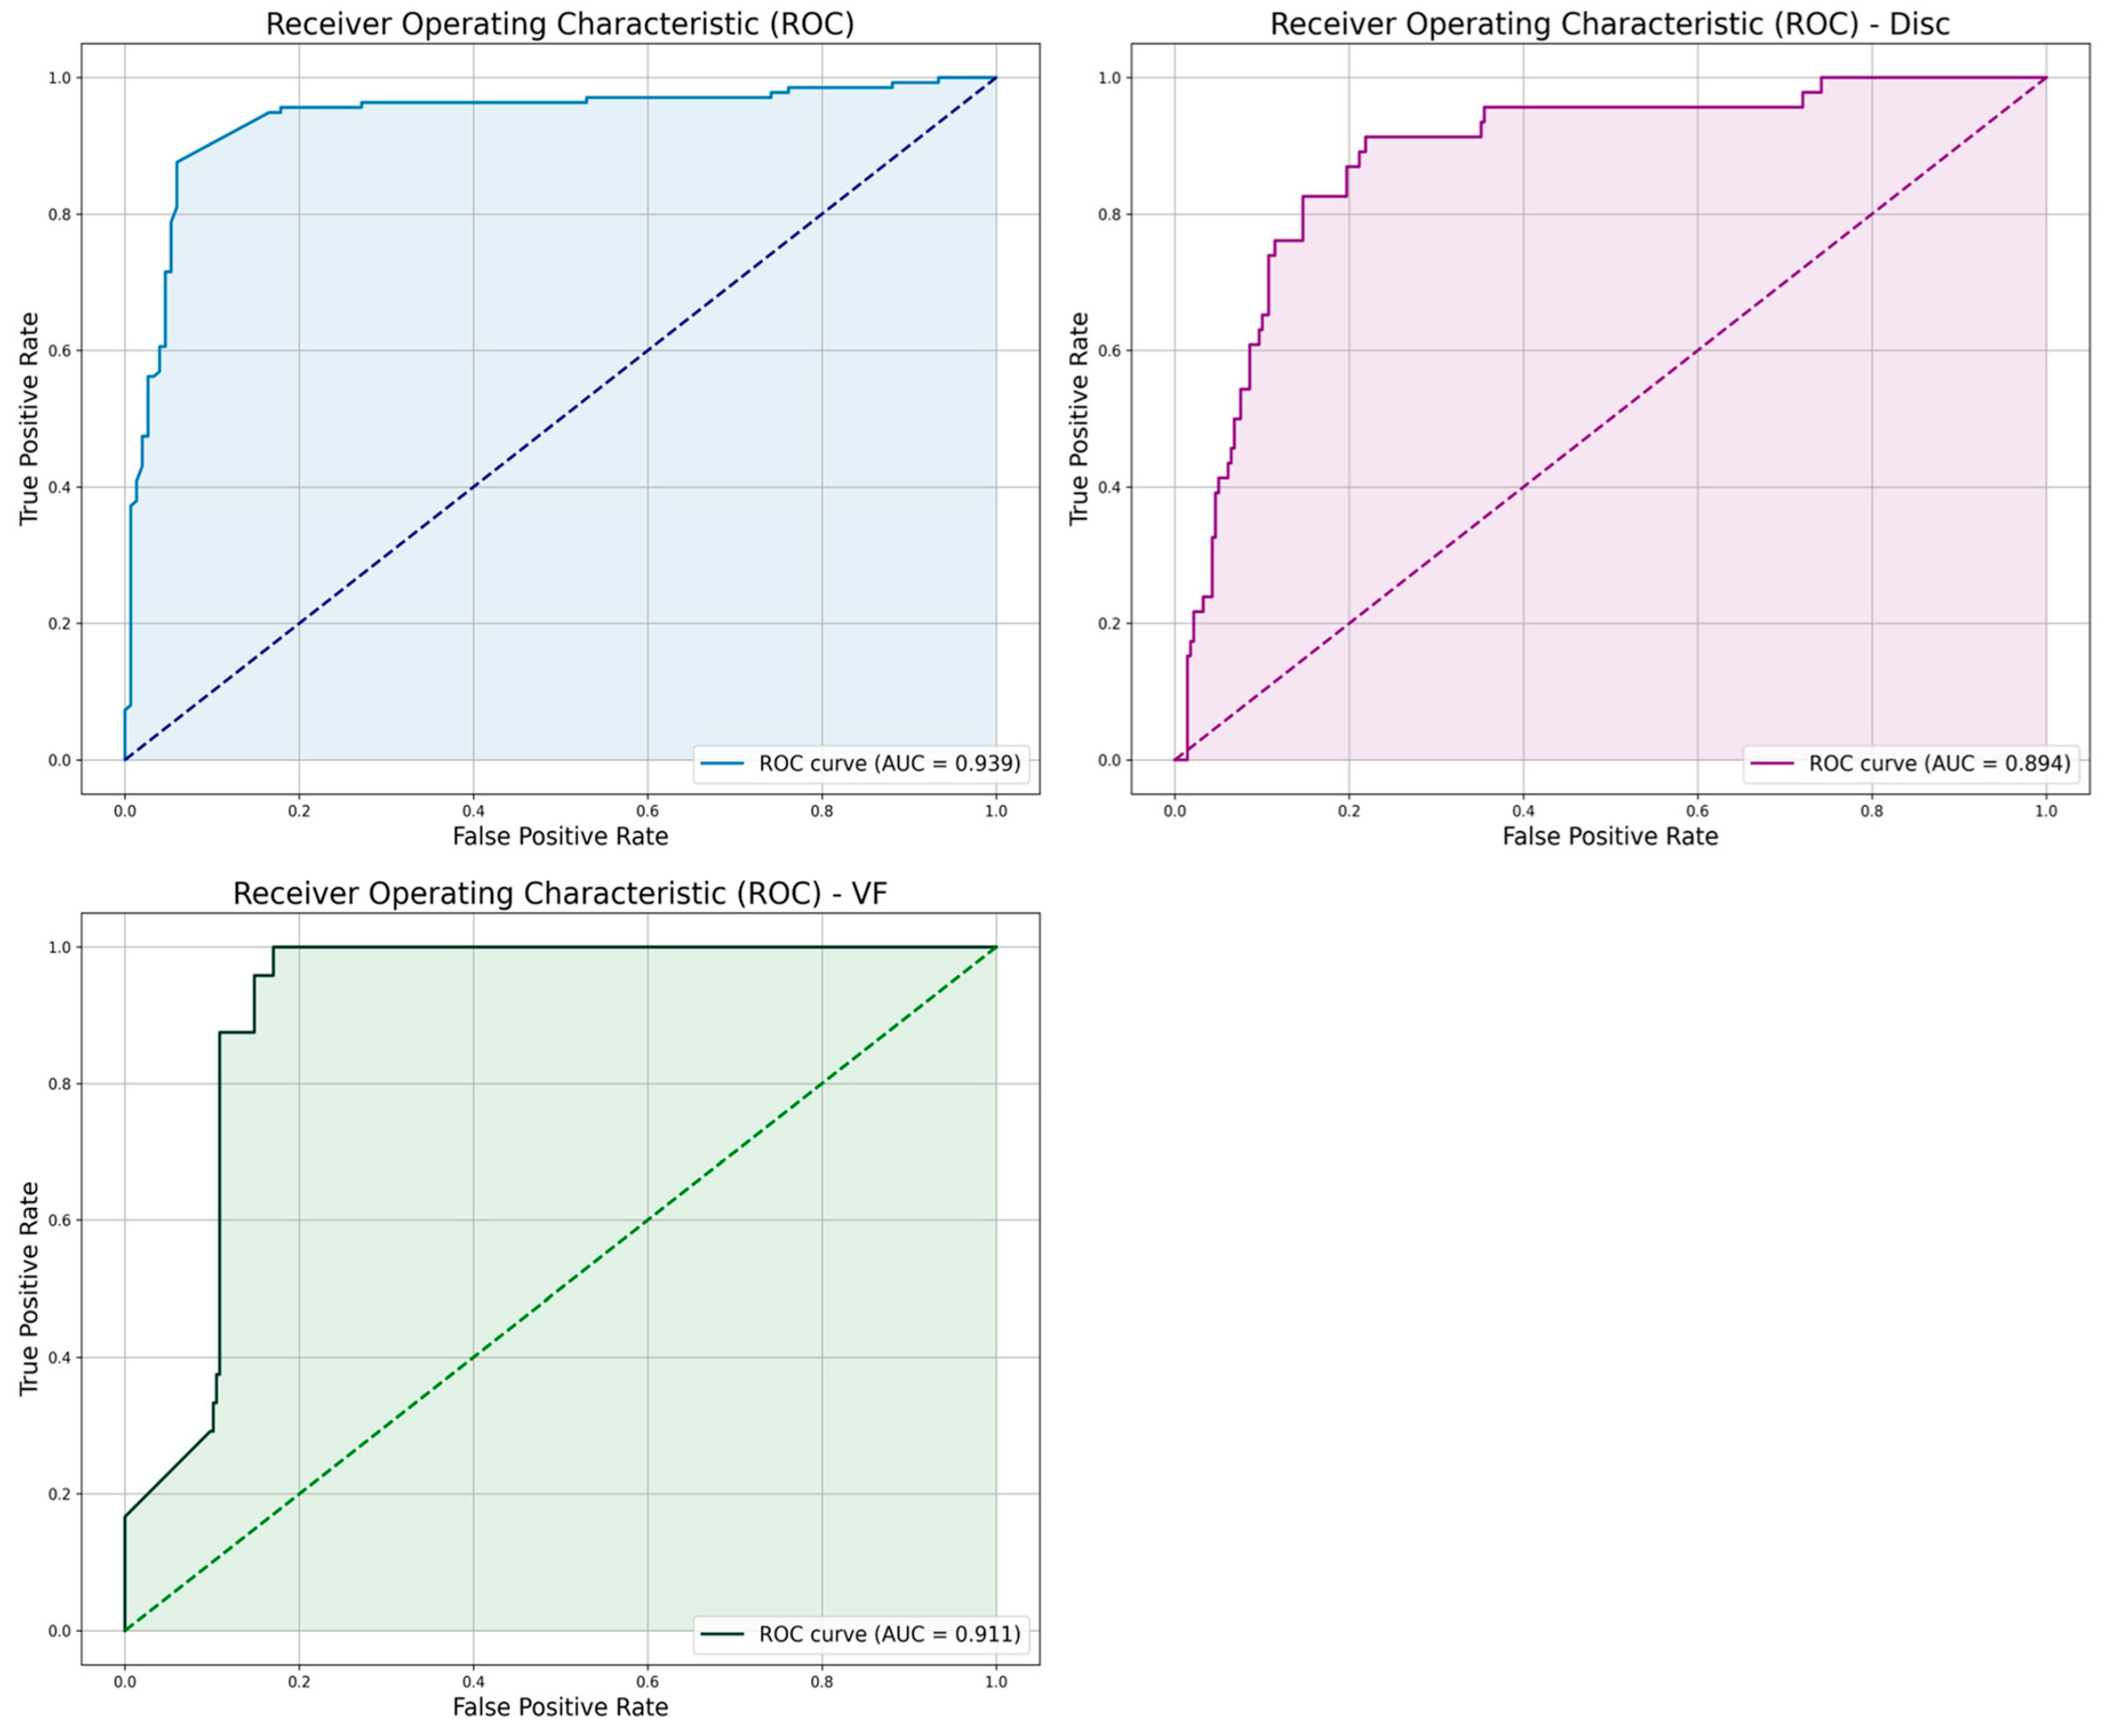
| Metric | “Both” Model | “VF” Model | “Disc” Model |
|---|---|---|---|
| AUC | 0.939 | 0.911 | 0.894 |
| Accuracy | 0.942 | 0.959 | 0.911 |
| F1-Score | 0.963 | 0.804 | 0.743 |
| Precision | 0.984 | 0.813 | 0.646 |
| Recall | 0.895 | 0.565 | 0.875 |
Disclaimer/Publisher’s Note: The statements, opinions and data contained in all publications are solely those of the individual author(s) and contributor(s) and not of MDPI and/or the editor(s). MDPI and/or the editor(s) disclaim responsibility for any injury to people or property resulting from any ideas, methods, instructions or products referred to in the content. |
© 2025 by the authors. Licensee MDPI, Basel, Switzerland. This article is an open access article distributed under the terms and conditions of the Creative Commons Attribution (CC BY) license (https://creativecommons.org/licenses/by/4.0/).
Share and Cite
Majid, I.; Mishra, Z.; Wang, Z.C.; Chopra, V.; Heuer, D.; Hu, Z.J. Automated Detection and Biomarker Identification Associated with the Structural and Functional Progression of Glaucoma on Longitudinal Color Fundus Images. Appl. Sci. 2025, 15, 1627. https://doi.org/10.3390/app15031627
Majid I, Mishra Z, Wang ZC, Chopra V, Heuer D, Hu ZJ. Automated Detection and Biomarker Identification Associated with the Structural and Functional Progression of Glaucoma on Longitudinal Color Fundus Images. Applied Sciences. 2025; 15(3):1627. https://doi.org/10.3390/app15031627
Chicago/Turabian StyleMajid, Iyad, Zubin Mishra, Ziyuan Chris Wang, Vikas Chopra, Dale Heuer, and Zhihong Jewel Hu. 2025. "Automated Detection and Biomarker Identification Associated with the Structural and Functional Progression of Glaucoma on Longitudinal Color Fundus Images" Applied Sciences 15, no. 3: 1627. https://doi.org/10.3390/app15031627
APA StyleMajid, I., Mishra, Z., Wang, Z. C., Chopra, V., Heuer, D., & Hu, Z. J. (2025). Automated Detection and Biomarker Identification Associated with the Structural and Functional Progression of Glaucoma on Longitudinal Color Fundus Images. Applied Sciences, 15(3), 1627. https://doi.org/10.3390/app15031627