1. Introduction
In the treatment of primary and secondary liver cancer, radioembolization with holmium-166 microspheres (
166Ho-RE), also known as SIRT (Selective Internal Radiation Therapy), appears as a promising therapy. This procedure, as in other liver radioembolization techniques (
90Y-based), involves injecting radioactive microspheres into the hepatic artery through a microcatheter placed in the femoral artery [
1].
A small activity of 166Ho microspheres, typically 200-250MBq, serves as a “scout dose” to assess the microspheres’ distribution within the liver and detect any extra-hepatic shunting. This is achieved through a post-scout SPECT/CT scan, which guides the planning and administration of the main treatment involving a higher activity of 166Ho microspheres. After this verification and planning first step, a therapeutic activity of typically 2-6 GBq is injected, mimicking the “scout dose” distribution.
After administering the therapeutic activity, a post-therapy SPECT/CT scan is performed after a suitable interval of time has elapsed. This delay ensures that the SPECT detectors are not saturated by the high count rate immediately following the treatment due mainly to Bremsstrahlung radiation emission [
2]. The second SPECT scan enables the assessment of the doses delivered to both the liver and the tumor.
166Ho is a high-energy beta-emitting radioactive isotope (maximum energy: 1.85 MeV, abundance 49%). It also emits low-energy gamma rays at 80.6 keV (abundance 6.6%), which enables the visualization of microspheres’ distribution through SPECT (Single-Photon Emission Computed Tomography) [
1,
3,
4]. Additionally, there are gamma emissions at higher energies, including 1.34 MeV (0.9%), 1.58 MeV (0.2%), and 1.66 MeV (0.1%) [
5].
When working with
166Ho, it is crucial to account for the presence of Bremsstrahlung radiation and Compton scattering. The high-energy photons in the Bremsstrahlung spectrum can pass through the collimator septa, leading to a reduced image quality and causing inaccurate results [
6].
MC algorithms that simulate scattering within the object have been effective in recovering image information. The Hybrid Recon™ software by Hermes Medical Solutions AB (Stockholm, Sweden) incorporates a scatter modeling method named “convolution-based forced detection”, applying pre-calculated probability density functions of the
166Ho spectrum generated using the PENELOPE MC code [
7,
8].
This approach by Hybrid Recon™ includes a full MC collimator simulation, which comprehensively addresses all photon interactions at the collimator, including both primary and scattered photons, while also considering scatter within the object [
8].
As the interest in post-therapy dosimetry grows [
9], accurate quantification of
166Ho becomes necessary. Thus, properly determining the CF, which is required to convert SPECT image counts into radioactivity concentration units (MBq/mL), plays a critical role in activity quantification [
10,
11]. It is important to note that radioembolization enables direct activity conversion from SPECT scans, as nearly all activity stays within the liver, removing the need for a calibration factor.
It is also essential to address the PVE when discussing
166Ho activity quantification. PVE is an important factor that affects the measurement of activity concentration in emission tomographic imaging and can significantly impact the accuracy of radionuclide uptake determination in quantitative SPECT and PET imaging. To address this issue and potentially correct it, one approach is to use ARC along with the corresponding activity concentration recovery curves [
12].
The primary goal was to enhance the OSEM reconstruction parameters (number of iterations and subsets) for 166Ho SPECT and assess the impact of advanced MC collimator modeling through Hybrid Recon™ on both image quality and quantification. The secondary objectives were to calculate the CF for 166Ho SPECT/CT, assess the impact of reconstruction parameters on the CF, and determine the ARC as a function of sphere volume.
3. Results
Figure 2 shows the
values obtained for each reconstruction with a fixed number of 15 and 8 subsets, respectively, illustrating their relationship with the number of iterations. The coefficient of variation was also calculated as an indicator of image noise and is presented in
Figure 3.
Upon observing
Figure 2, a clear difference becomes evident between the three smaller spheres and the three larger spheres. The contrast recovery coefficients for the smaller spheres are below 10%, whereas those for the larger spheres attain higher values up to 50%.
As expected, noise increases with the number of iterations for both sets of data points. It was also observed that when using 8 subsets, the CV up to the 10th iteration still resulted in an image with less noise than the final reconstruction with 15 subsets.
Figure 4 demonstrates visually the impact of the number of iterations for both fixed subset values.
Both rows display very similar images, as expected, given that the number of iterations in the second row is doubled while the number of subsets is nearly halved compared to the top row. As anticipated, an increasing number of iterations results in images with a higher contrast and increased noise.
In terms of activity quantification, the CF and its associated uncertainty are shown for each reconstruction in
Figure 5, including reconstructions with the same parameters and full MC collimator modeling. Due to the extensive computation time required (which was not feasible with the GPU) and the predictable nature of the results, CF values were only obtained for 1 and 10 iterations, with a fixed number of 8 subsets.
The CFs remain relatively constant with the number of iterations for each subset configuration, with slightly lower values observed for 8 subsets (mean: ) compared to 15 subsets (mean: ). Additionally, it was observed that applying full MC collimator modeling reduced the CF to values ranging between 10.9 and 12.1 cps/MBq.
The ARCs were determined using two distinct methods.
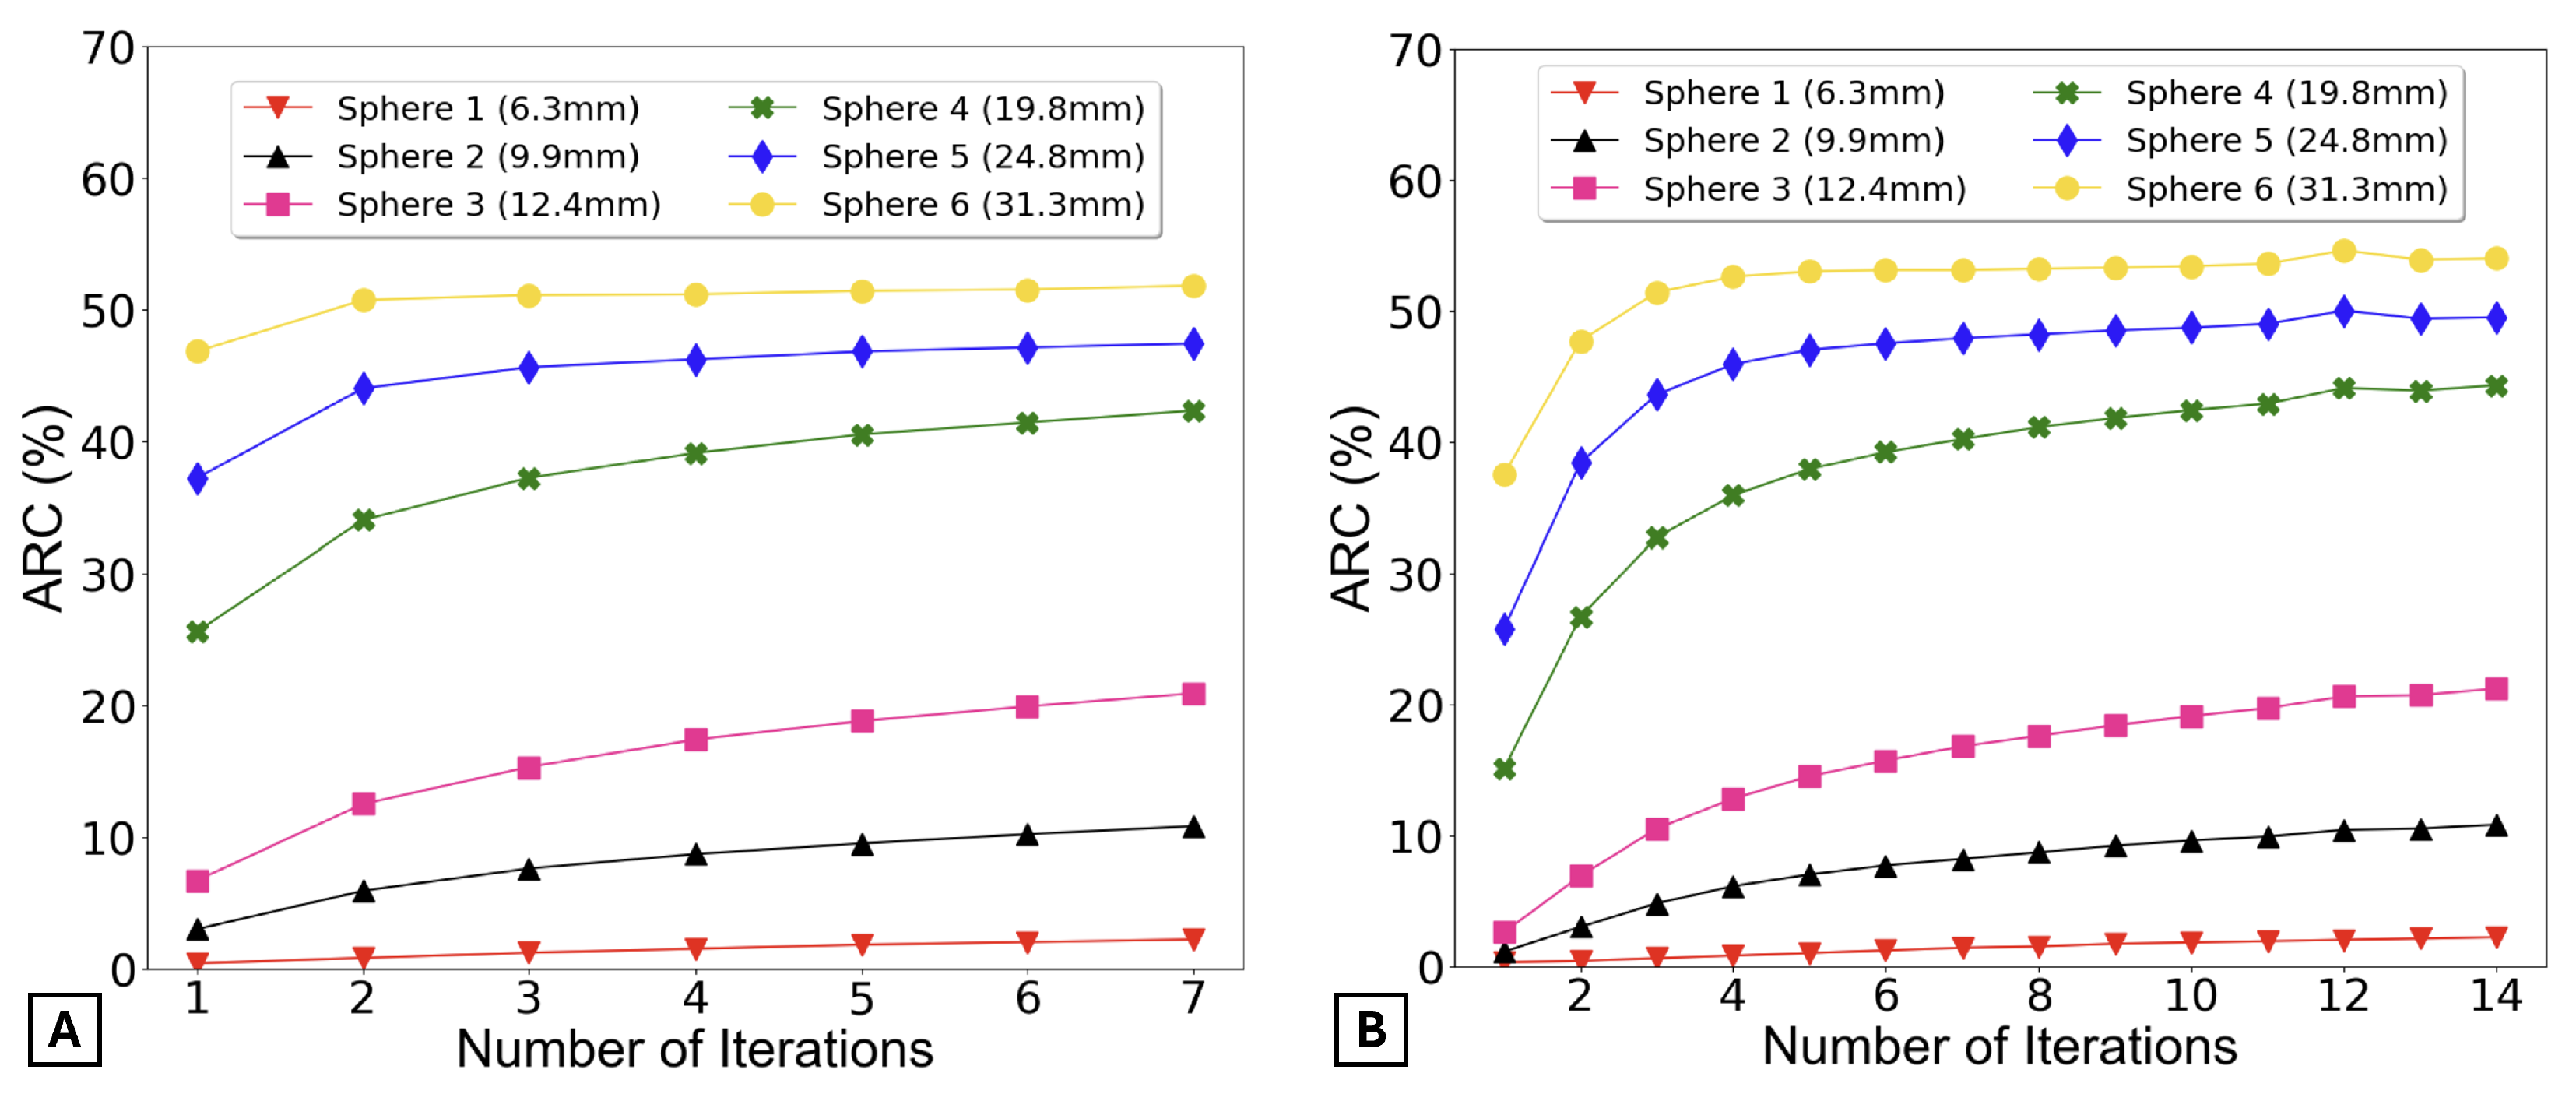
Figure 6 presents the ARC as a function of the number of iterations, calculated using the first method.
By observing
Figure 6, it can be said that the ARCs remain practically constant for all spheres after 5 iterations for 15 subsets (graph A) and 10 iterations for 8 subsets (graph B).
After carefully analyzing the contrast, noise, and activity recovery results for all reconstructions, two different reconstructions were selected for further investigation to assess the impact of full MC collimator modeling on the results. The selected reconstructions were as follows: 5 iterations with 15 subsets and 10 iterations with 8 subsets.
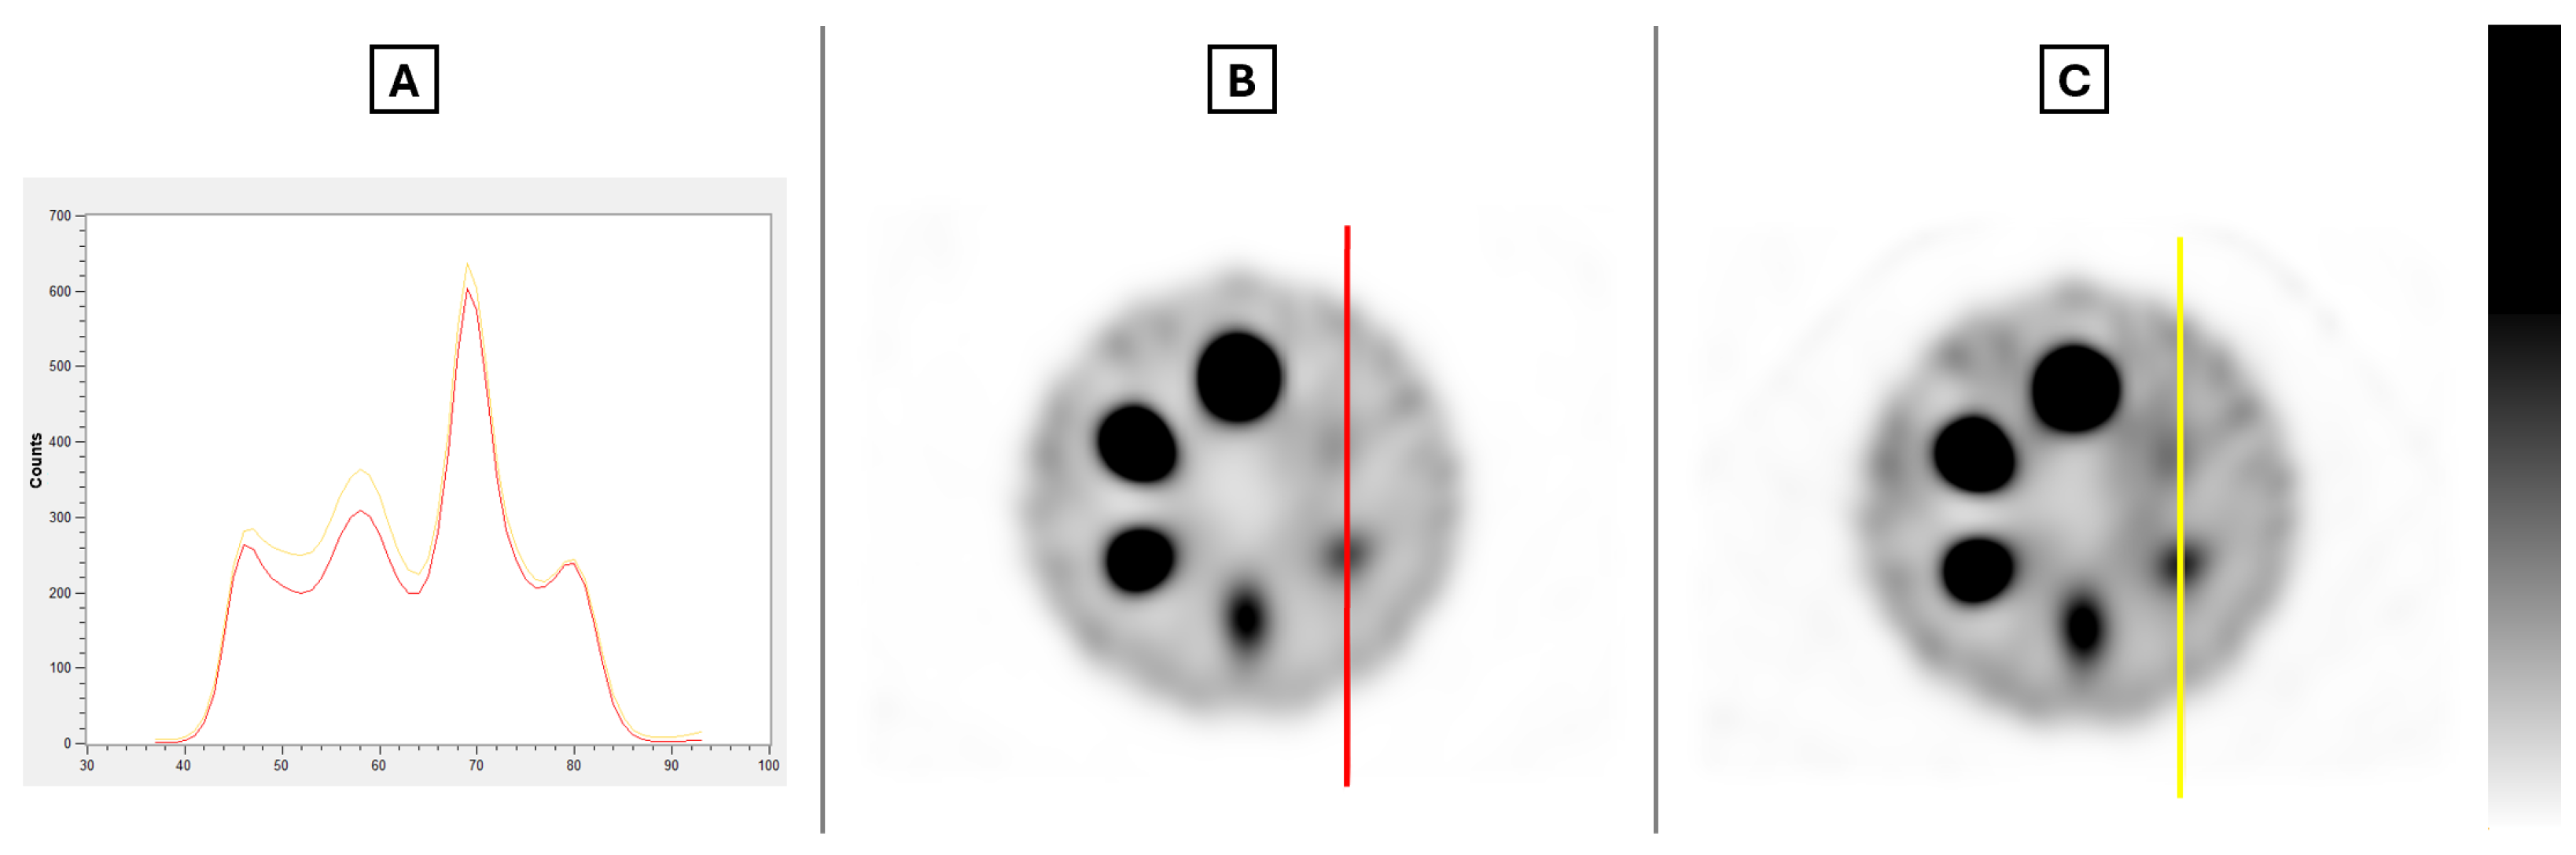
Figure 7 visually demonstrates the impact of full MC collimator modeling, along with a profile of the line present in the images, as the differences in the images are not perceptible to the eye.
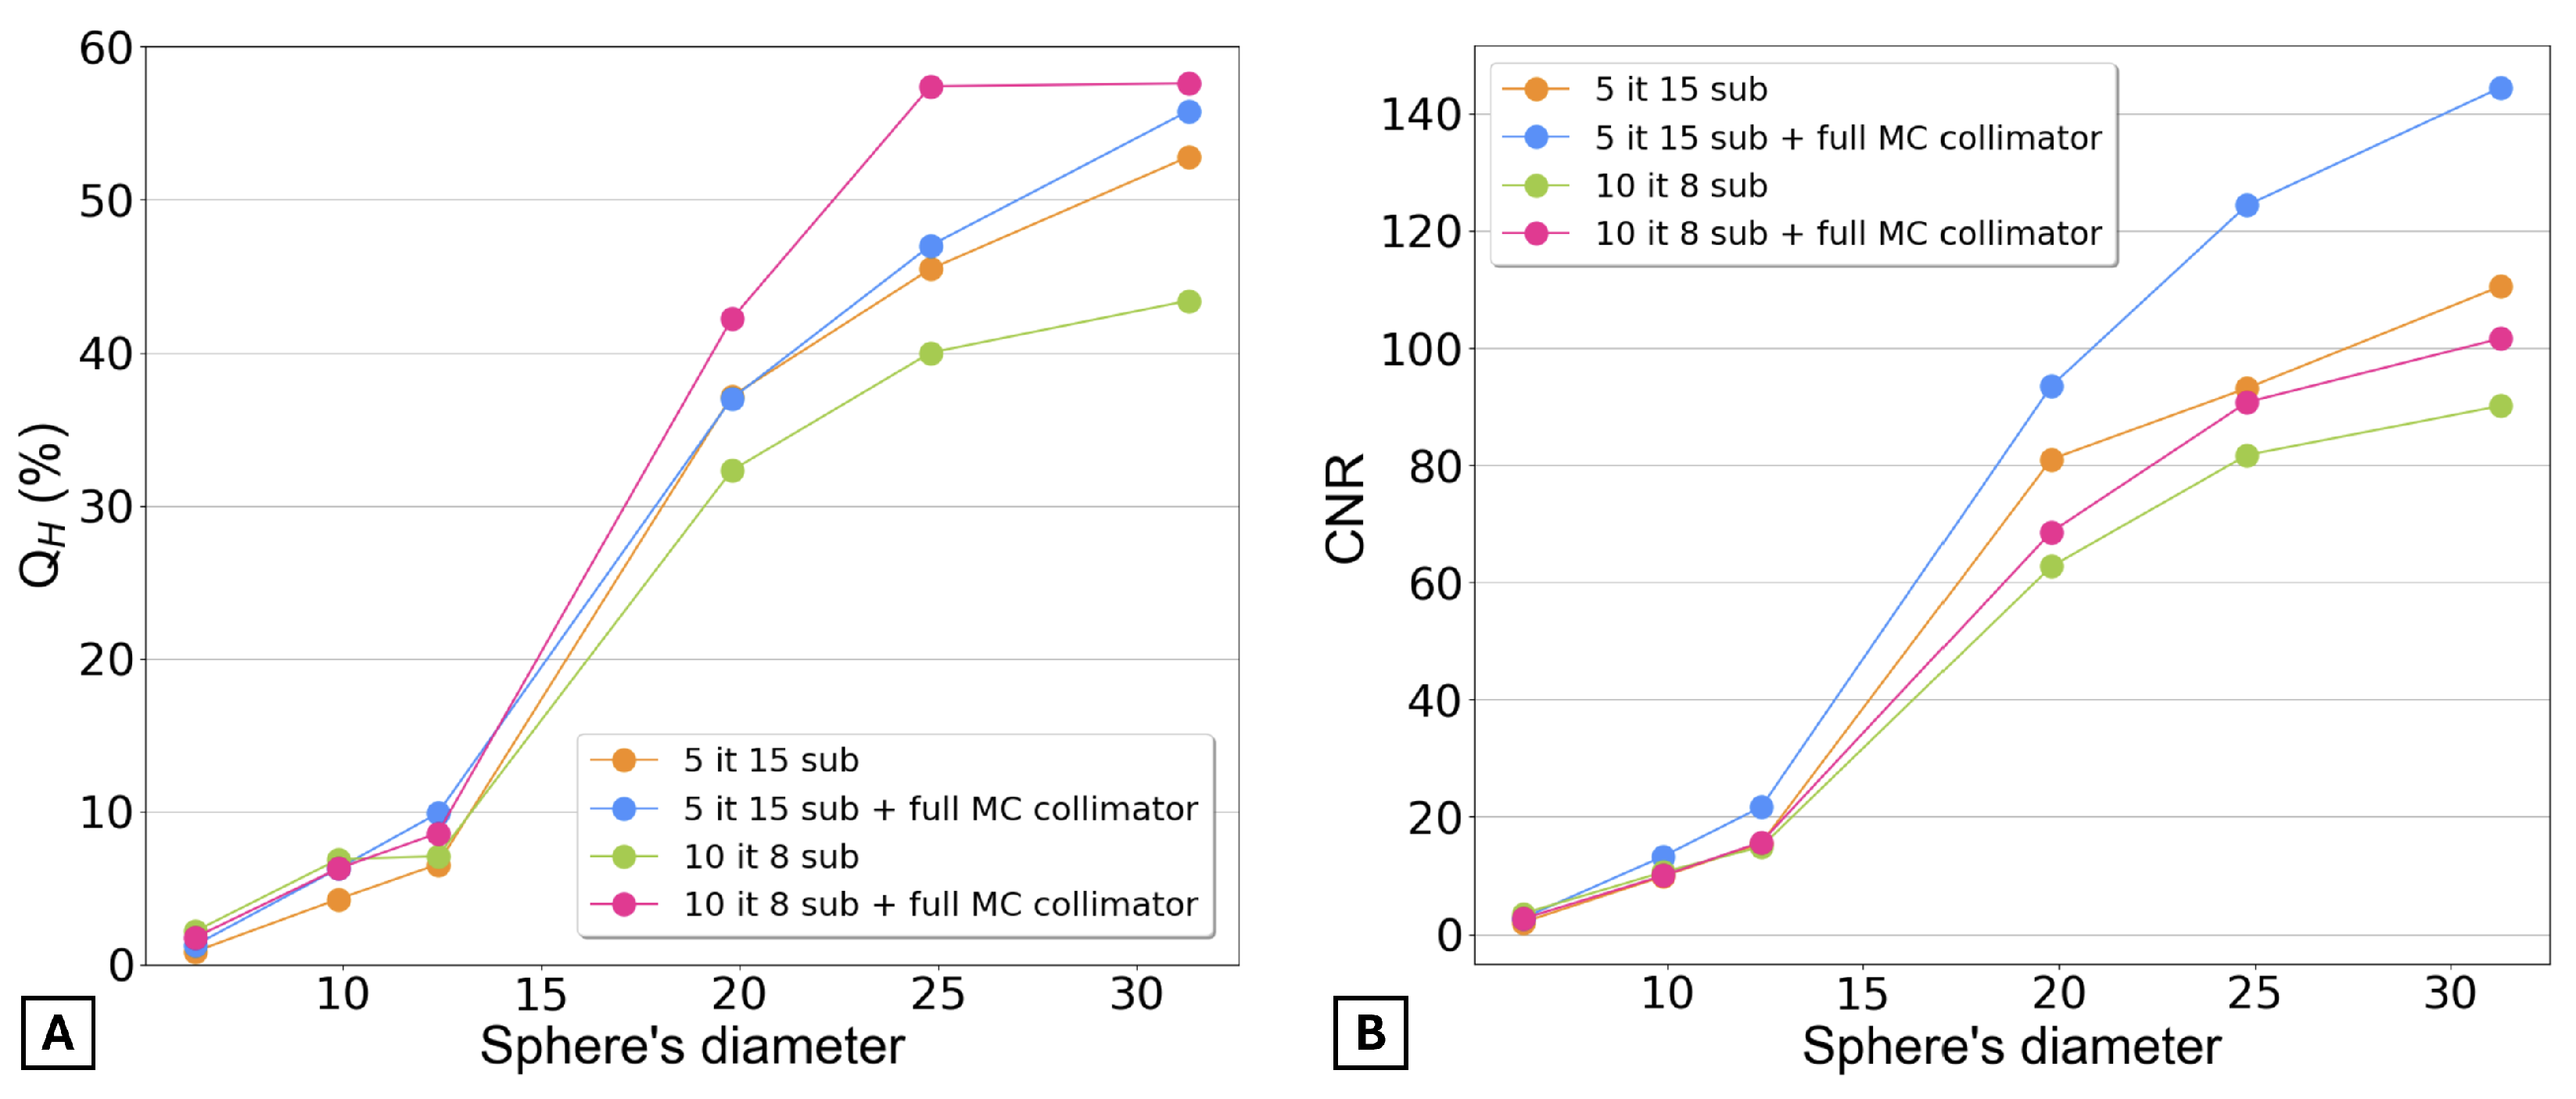
Figure 8 presents the contrast recovery coefficients and the contrast-to-noise ratio for the final four selected reconstructions. Graph A shows that for the three smaller spheres, the contrast is very similar across all four reconstructions. However, for the three larger spheres, the reconstruction with 10 iterations, 8 subsets, and full MC collimator modeling provides the highest contrast. Graph B shows that the CNR was higher for the reconstruction with 5 iterations, 15 subsets, and full MC collimator modeling.
It is also important to note that none of the reconstructions provided a CNR greater than 5 for the smaller sphere, meaning that this sphere was not detectable in any of the images.
As a final result,
Figure 9 displays the ARCs as a function of the sphere’s volume for both methods (Equations (
5) and (
6)). For both graphs, Equation (
7) was fitted to the data points, and the determination coefficients (
) are shown.
Graph A clearly demonstrates that the reconstruction with 10 iterations, 8 subsets, and full MC collimator modeling provides the highest activity recovery. However, Graph B, which uses the EANM guidelines to calculate the ARC, shows that, regardless of the reconstruction, the ARCs are similar across all reconstructions.
4. Discussion
The aim of the presented data on post-SIRT 166Ho SPECT/CT imaging was to examine the impact of OSEM reconstruction parameters and investigate the advantages of full MC collimator modeling in improving image quality and quantification.
The number of iterations used in the OSEM method can impact the qualitative accuracy of the reconstructed images. However, it is important to highlight that as the number of iterations increases, so does the background noise in the images. This may complicate the visual analysis of images, particularly in detecting small lesions. To address this, the study investigated how varying the number of iterations from 1 to 7 while keeping as constant 15 subsets, as well as varying the number of iterations from 1 to 14 with 8 fixed subsets, would affect the and noise values.
By analyzing
Figure 2A, it is possible to verify that
increases with the number of iterations for all spheres (except the smallest one). However, beyond 5 iterations, the contrast coefficients remain relatively constant, showing no significant increase.
When evaluating
Figure 2B, a distinct behavior is observed. The contrast recovery coefficients increase significantly during the initial iterations and then stabilize for the larger spheres. However, for the smaller spheres,
continues to increase linearly.
It was also evident that the coefficient of variation increased correspondingly with the augmented number of iterations in each reconstruction (
Figure 3). This outcome aligns with expectations based on the functioning of the OSEM method, where a higher number of iterations corresponds to increased background noise in the resultant images.
As expected, it was also observed in
Figure 3 that an increase in the number of subsets corresponded to a rise in CV values for both datasets.
By increasing the number of subsets, the projection data are partitioned into smaller segments. This acceleration in segmentation leads to quicker image updates within each iteration, as each subset contributes insights into a smaller region of the image. However, this accelerated updating process can intensify the reconstruction susceptibility to variations present in the input data [
18]. Consequently, the reconstructed image can manifest increased noise, ultimately resulting in a heightened CV, as was observed in these datasets.
Regarding the quantification of 166Ho activity, the study successfully determined the CF for each reconstruction. For each subset value investigated, the CF values were closely aligned, providing a measure of confidence in their consistency. However, when full MC collimator modeling was applied, the CF values were slightly lower. This difference is significant and must be considered to ensure the accuracy and reliability of the CF, confirming its suitability for absolute activity quantification in 166Ho microsphere SPECT/CT imaging.
Additionally,
Figure 6 also verifies that the activity recovery stabilizes rapidly with fewer iterations.
After evaluating image quality and activity quantification, the most suitable OSEM reconstruction parameters were determined based on contrast recovery and activity recovery coefficients. For 15 subsets, 5 iterations provided an optimal balance between noise reduction and accuracy. Increasing iterations to 6 or 7 did not improve contrast but increased noise, making additional iterations unnecessary. Among all reconstructions, 5 iterations with 15 subsets yielded the highest .
Additionally, the reconstruction with 10 iterations and 8 subsets was selected for further analysis, as it achieved high ARC values while maintaining noise levels comparable to the other selected reconstruction.
After identifying the most suitable reconstructions, further investigation was conducted on these two reconstructions and two additional ones with the same parameters but incorporating full MC collimator modeling.
Figure 8 and
Figure 9A demonstrate that the inclusion of full MC collimator modeling enhances the values of both
and ARC.
A significant challenge in 166Ho SPECT/CT image acquisition arises from the limitations of conventional scatter correction techniques, which are optimized for discrete energy spectra. This issue is particularly notable due to the continuous Bremsstrahlung spectrum of 166Ho. The use of Hybrid Recon™, which incorporates scatter modeling within the detector and collimator, represents a valuable advancement in improving the quantification of 166Ho images, as verified in this study.
However, despite the improved results achieved with full MC collimator modeling, a significant limitation is the extended computation time (processor used: 12th Gen Intel® Core™ i7-12700K; no GPU acceleration supported by the MC algorithm), which is often impractical in clinical settings. For instance, reconstructing 5 iterations with 15 subsets required approximately 2 h, while reconstructing 10 iterations with 8 subsets took nearly 5 h when full MC collimator modeling was applied.
Therefore, using 5 iterations with 15 subsets or 10 iterations with 8 subsets without incorporating full MC collimator modeling remains a highly suitable and practical choice for patient data.
Finally, as observed in
Figure 9A, Equation (
7) provides a satisfactory fit for the data from both methods. However, it generally aligns better with the second method, which is expected since Equation (
7), as proposed by [
17], was specifically designed for determining ARC values using the second method.
Additionally,
Figure 9A highlights a clear limitation of using only spheres with diameters up to 31 mm, as the recovery curve fails to reach a plateau. This limitation should be considered in future studies as larger-diameter spheres become available.
In summary, multiple methods for determining ARC values are available. The appropriate approach to performing PVE correction on small volumes depends on their specific usage context and the type of SPECT/CT reconstruction applied. Another significant insight from the ARC values analysis was the substantial potential underestimation of activity in small volumes caused by PVE. This highlights the critical need to account for and rectify PVE in local absorbed dose calculations.


