Article

Influence of Selected Parameters of Medium-Voltage Network on the Value of Voltage Asymmetry Factors

by
Grzegorz Hołdyński
and
Zbigniew Skibko
*
Faculty of Electrical Engineering, Bialystok University of Technology, 15-351 Białystok, Poland
*
Author to whom correspondence should be addressed.
Appl. Sci. 2025, 15(3), 1560; https://doi.org/10.3390/app15031560
Submission received: 9 January 2025 / Revised: 27 January 2025 / Accepted: 3 February 2025 / Published: 4 February 2025

Abstract

:
The correct and safe operation of electricity grids is a fundamental consideration in guaranteeing the supply of electricity with the correct parameters to consumers. One of the key aspects is how neutral point earthing works. In grids with the neutral point grounded by a Petersen coil, it is very important to properly tune its inductance in relation to the natural capacitance of the power grid. This is important both for the proper operation of earth fault protection and from the point of view of power quality, especially voltage asymmetry. Asymmetry of phase voltages in MV networks has a very negative impact on the operation of the railway network supplied by 12-pulse rectifiers. In this paper, the authors present the influence of the detuning factor of the earth fault compensation and the length and cross-section of the line on the value of voltage asymmetry factors. As the analyses carried out have shown, significant (up to 90%) values of the zero-sequence asymmetry factor can occur at low detuning, which can contribute not only to a decrease in the quality of the transmitted electricity but also to the unnecessary activation of protections. The values of the negative-sequence voltage asymmetry factor are much smaller (do not exceed 0.5% in the analysed cases) and do not depend on the network detuning factor. As the distance from the substation increases, an increase in the values of both types of asymmetry factors is also observed, with the relationship already negligibly small at considerable distances (above 20 km).

1. Introduction

The energy transformation that has been taking place in recent years is also affecting distribution networks. The rapid increase in the capacity of photovoltaic installations, wind power plants and electric vehicle charging stations poses challenges to the existing network infrastructure [1,2]. In power grids, there are both differences in loads and in the generation of energy in the individual phases [3,4]. This is the main cause of voltage asymmetry in power grids [5]. Additional factors influencing the asymmetry of voltage levels in individual phases are unequal ground capacitances in medium-voltage lines (especially overhead lines) and incorrect tuning of the earth fault compensating reactor [6]. In addition, photovoltaic [7,8] and wind power plants [9] affect power quality parameters, including the value of voltage asymmetry [10]. Electric car charging stations [11,12] and energy storage [13] can also cause voltage asymmetry. In summary, voltage asymmetry in power grids can have very different causes. The most important ones may include the following:
  • Unbalanced loading on individual phases of a three-phase circuit, which is more often the case on low-voltage networks;
  • Unbalanced generation from single-phase sources, especially small wind and photovoltaic power plants in low-voltage networks;
  • The asymmetrical construction of power lines, consisting mainly of asymmetrical earth capacities, particularly in the case of medium-voltage overhead lines;
  • The method and parameters for earthing the neutral point of the medium-voltage grid.
The value of the grid voltage can be regulated by controlling the active or reactive power produced by photovoltaic power plants [14,15]. The efficiency of these methods depends on the structure of the grid, bearing in mind that the transmission of reactive power causes additional power losses in electric power equipment [16]. Another method of voltage control is shunt connection to the energy storage network, where the active and reactive components of the current are regulated [17]. Additional methods to mitigate voltage asymmetry are based on increasing the cross-section of cables used, installing voltage stabilisers and implementing asymmetry compensation techniques in PV inverters [18]. In many cases, voltage asymmetry is due to asymmetrical loading but mainly in low-voltage grids. Unbalanced currents lead to a reduction in the actual load capacity of power cables and transformers [19]. In addition, load asymmetry significantly affects the differences between actual and estimated values of power quality indicators [20].
The stability of the power system depends primarily on the way the neutral point operates, which can be isolated, earthed directly, through a resistor or a compensation reactor (Petersen coil) [21]. The method of earthing is driven by the requirements for the value of currents and ground overvoltages, so different solutions can be found in different countries [22]. In networks with an isolated neutral point, the zero-sequence component circuit is closed by existing capacitances and leakage in the power network [23]. The capacitive earth fault current can be compensated by an inductive current [24]. For this purpose, an additional earthing transformer is installed in the medium-voltage switchgear, the neutral point of which is earthed by a Petersen coil [25]. Earthing the neutral point of the network through a resistor reduces overvoltages occurring during earth faults. The resistance value of this resistor should allow earth fault currents to flow with a value that ensures the correct operation of the earth fault protection devices installed in the network [26]. Phenomena related to voltage asymmetry are particularly evident in networks earthed through a Petersen coil and must be taken into account, among other things, when determining the operating conditions of earth fault protections [27,28]. In medium-voltage power systems, the permissible values of negative-sequence voltage asymmetry factors αU2 have been defined in the standard [29] as between 0% and 2% (for 95% of the 10-minute average values recorded over a week). In networks with relatively high earth asymmetry, the problem of limiting the voltage U0 during the required Petersen coil tuning level arises. In practice, it is common to dispense with fine compensation and set the detuning at a level that limits the voltage U0 [30]. The correct setting of the compensation reactor also influences the possibility of spontaneous arc extinction occurring during ground faults [31]. Furthermore, in the case of a ground fault, the coil can overcompensate for the short-circuit capacitive current in the network [32]. The residual short-circuit current is not detrimental to the supply equipment in the short term but can lead to serious consequences if the faulted line is not disconnected from the distribution network in time [33].
The effect of earthing the neutral point of the network on the value of the zero-sequence component of the voltage, and thus on the correctness of the operation of the protections, is very often described in the literature. Few works describe the relationship between earth fault compensation and voltage asymmetry in the power network. Incorrect selection of the inductance of a Petersen coil can lead to resonance phenomena. Also, incorrect detuning of the inductance can cause malfunctioning of earth fault protections and the development of voltage asymmetry. The authors decided to fill this research gap by determining the dependence of zero- and negative-sequence voltage asymmetry factors on the detuning factor and the MV line construction.

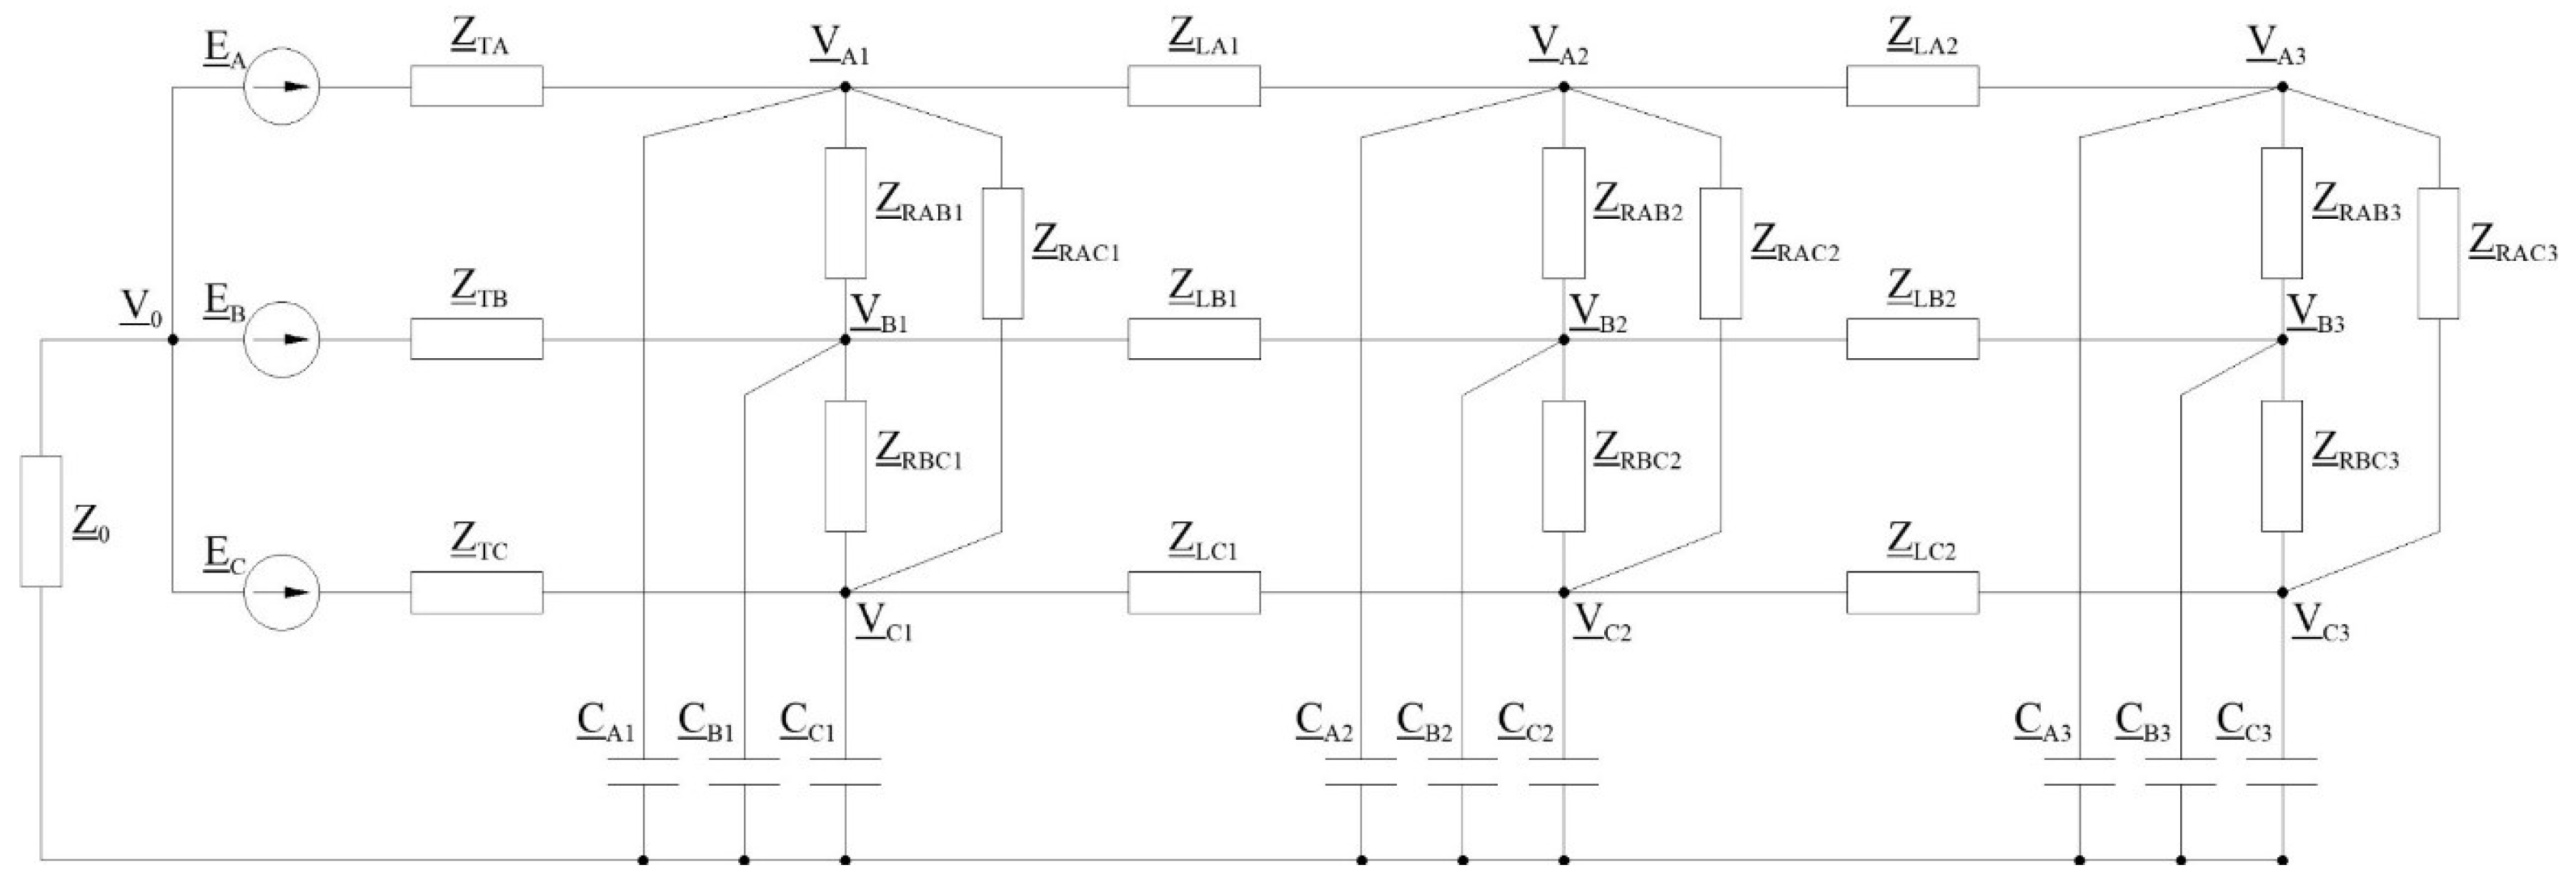
2. Materials and Methods

In order to determine the influence of the neutral point grounding impedance of the MV network on the value of voltage asymmetry factors, an equivalent model of the electric power network was made, as shown in Figure 1.
Using the nodal potential method, the developed model can be described by the following equations:
V 0 1 Z 0 + 1 Z T A + 1 Z T B + 1 Z T C V A 1 · 1 Z T A V B 1 · 1 Z T B V C 1 · 1 Z T C = E A · 1 Z T A E B · 1 Z T B E C · 1 Z T C V 0 · 1 Z T A + V A 1 1 Z T A + 1 Z R A B 1 + 1 Z R A C 1 + 1 Z L A 1 + j ω C A 1 V B 1 · 1 Z R A B 1 V C 1 · 1 Z R A C 1 V A 2 · 1 Z L A 1 = E A · 1 Z T A V 0 · 1 Z T B V A 1 · 1 Z R A B 1 + V B 1 1 Z T B + 1 Z R A B 1 + 1 Z R B C 1 + 1 Z L B 1 + j ω C B 1 V C 1 · 1 Z R B C 1 V B 2 · 1 Z L B 1 = E B · 1 Z T B V 0 · 1 Z T C V A 1 · 1 Z R A C 1 V B 1 · 1 Z R B C 1 + V C 1 1 Z T C + 1 Z R A C 1 + 1 Z R B C 1 + 1 Z L C 1 + j ω C C 1 V C 2 · 1 Z L C 1 = E C · 1 Z T C V A 1 · 1 Z L A 1 + V A 2 1 Z L A 1 + 1 Z R A B 2 + 1 Z R A C 2 + 1 Z L A 2 + j ω C A 2 V B 2 · 1 Z R A B 2 V C 2 · 1 Z R A C 2 V A 3 · 1 Z L A 2 = 0 V B 1 · 1 Z L B 1 V A 2 · 1 Z R A B 2 + V B 2 1 Z L B 1 + 1 Z R A B 2 + 1 Z R B C 2 + 1 Z L B 2 + j ω C B 2 V C 2 · 1 Z R B C 2 V B 3 · 1 Z L B 2 = 0 V C 1 · 1 Z L C 1 V A 2 · 1 Z R A C 2 V B 2 · 1 Z R B C 2 + V C 2 1 Z L C 1 + 1 Z R A C 2 + 1 Z R B C 2 + 1 Z L C 2 + j ω C C 2 V C 3 · 1 Z L C 2 = 0 V A 2 · 1 Z L A 2 + V A 3 1 Z L A 2 + 1 Z R A B 3 + 1 Z R A C 3 + j ω C A 3 V B 3 · 1 Z R A B 3 V C 3 · 1 Z R A C 3 = 0 V B 2 · 1 Z L B 2 V A 3 · 1 Z R A B 3 + V B 3 1 Z L B 2 + 1 Z R A B 3 + 1 Z R B C 3 + j ω C B 3 V C 3 · 1 Z R B C 3 = 0 V C 2 · 1 Z L C 2 V A 3 · 1 Z R A C 3 V B 3 · 1 Z R B C 3 + V C 3 1 Z L C 2 + 1 Z R A C 3 + 1 Z R B C 3 + j ω C C 3 = 0
When transformed to matrix form, Equation (1) will be of the form
Y 0 Y T A Y T B Y T C 0 0 0 0 0 0 Y T A Y A 1 Y R A B 1 Y R A C 1 Y L A 1 0 0 0 0 0 Y T B Y R A B 1 Y B 1 Y R B C 1 0 Y L B 1 0 0 0 0 Y T C Y R A C 1 Y R B C 1 Y C 1 0 0 Y L C 1 0 0 0 0 Y L A 1 0 0 Y A 2 Y R A B 2 Y R A C 2 Y L A 2 0 0 0 0 Y L B 1 0 Y R A B 2 Y B 2 Y R B C 2 0 Y L B 2 0 0 0 0 Y L C 1 Y R A C 2 Y R B C 2 Y C 2 0 0 Y L C 2 0 0 0 0 Y L A 2 0 0 Y A 3 Y R A B 3 Y R A C 3 0 0 0 0 0 Y L B 2 0 Y R A B 3 Y B 3 Y R B C 3 0 0 0 0 0 0 Y L C 2 Y R A C 3 Y R B C 3 Y C 3 × V 0 V A 1 V B 1 V C 1 V A 2 V B 2 V C 2 V A 3 V B 3 V C 3 = E A · Y T A E B · Y T B E C · Y T C E A · Y T A E B · Y T B E C · Y T C 0 0 0 0 0 0
where
Y T A = 1 Z T A Y T B = 1 Z T B Y T B = 1 Z T B
Y L A 1 = 1 Z L A 1 Y L B 1 = 1 Z L B 1 Y L C 1 = 1 Z L C 1
Y L A 2 = 1 Z L A 2 Y L B 2 = 1 Z L B 2 Y L C 2 = 1 Z L C 2
Y R A B 1 = 1 Z R A B 1 Y R B C 1 = 1 Z R B C 1 Y R A C 1 = 1 Z R A C 1
Y R A B 2 = 1 Z R A B 2 Y R B C 2 = 1 Z R B C 2 Y R A C 2 = 1 Z R A C 2
Y R A B 3 = 1 Z R A B 3 Y R B C 3 = 1 Z R B C 3 Y R A C 1 = 1 Z R A C 3
Y 0 = 1 Z 0 + 1 Z T A + 1 Z T B + 1 Z T C
Y A 1 = 1 Z T A + 1 Z R A B 1 + 1 Z R A C 1 + 1 Z L A 1 + j ω C A 1 Y B 1 = 1 Z T B + 1 Z R A B 1 + 1 Z R B C 1 + 1 Z L B 1 + j ω C B 1 Y C 1 = 1 Z T C + 1 Z R A C 1 + 1 Z R B C 1 + 1 Z L C 1 + j ω C C 1
Y A 2 = 1 Z L A 1 + 1 Z R A B 2 + 1 Z R A C 2 + 1 Z L A 2 + j ω C A 2 Y B 2 = 1 Z L B 1 + 1 Z R A B 2 + 1 Z R B C 2 + 1 Z L B 2 + j ω C B 2 Y C 2 = 1 Z L C 1 + 1 Z R A C 2 + 1 Z R B C 2 + 1 Z L C 2 + j ω C C 2
Y A 3 = 1 Z L A 2 + 1 Z R A B 3 + 1 Z R A C 3 + j ω C A 3 Y B 3 = 1 Z L B 2 + 1 Z R A B 3 + 1 Z R B C 3 + j ω C B 3 Y C 3 = 1 Z L C 2 + 1 Z R A C 3 + 1 Z R B C 3 + j ω C C 3
Using Cramer’s method, the system of equations can be solved by determining the values of the characteristic determinants:
W = Y 0 Y T A Y T B Y T C 0 0 0 0 0 0 Y T A Y A 1 Y R A B 1 Y R A C 1 Y L A 1 0 0 0 0 0 Y T B Y R A B 1 Y B 1 Y R B C 1 0 Y L B 1 0 0 0 0 Y T C Y R A C 1 Y R B C 1 Y C 1 0 0 Y L C 1 0 0 0 0 Y L A 1 0 0 Y A 2 Y R A B 2 Y R A C 2 Y L A 2 0 0 0 0 Y L B 1 0 Y R A B 2 Y B 2 Y R B C 2 0 Y L B 2 0 0 0 0 Y L C 1 Y R A C 2 Y R B C 2 Y C 2 0 0 Y L C 2 0 0 0 0 Y L A 2 0 0 Y A 3 Y R A B 3 Y R A C 3 0 0 0 0 0 Y L B 2 0 Y R A B 3 Y B 3 Y R B C 3 0 0 0 0 0 0 Y L C 2 Y R A C 3 Y R B C 3 Y C 3
W O = E A · Y T A E B · Y T B E C · Y T C Y T A Y T B Y T C 0 0 0 0 0 0 E A · Y T A Y A 1 Y R A B 1 Y R A C 1 Y L A 1 0 0 0 0 0 E B · Y T B Y R A B 1 Y B 1 Y R B C 1 0 Y L B 1 0 0 0 0 E C · Y T C Y R A C 1 Y R B C 1 Y C 1 0 0 Y L C 1 0 0 0 0 Y L A 1 0 0 Y A 2 Y R A B 2 Y R A C 2 Y L A 2 0 0 0 0 Y L B 1 0 Y R A B 2 Y B 2 Y R B C 2 0 Y L B 2 0 0 0 0 Y L C 1 Y R A C 2 Y R B C 2 Y C 2 0 0 Y L C 2 0 0 0 0 Y L A 2 0 0 Y A 3 Y R A B 3 Y R A C 3 0 0 0 0 0 Y L B 2 0 Y R A B 3 Y B 3 Y R B C 3 0 0 0 0 0 0 Y L C 2 Y R A C 3 Y R B C 3 Y C 3
W A 1 = Y 0 E A · Y T A E B · Y T B E C · Y T C Y T B Y T C 0 0 0 0 0 0 Y T A E A · Y T A Y R A B 1 Y R A C 1 Y L A 1 0 0 0 0 0 Y T B E B · Y T B Y B 1 Y R B C 1 0 Y L B 1 0 0 0 0 Y T C E C · Y T C Y R B C 1 Y C 1 0 0 Y L C 1 0 0 0 0 0 0 0 Y A 2 Y R A B 2 Y R A C 2 Y L A 2 0 0 0 0 Y L B 1 0 Y R A B 2 Y B 2 Y R B C 2 0 Y L B 2 0 0 0 0 Y L C 1 Y R A C 2 Y R B C 2 Y C 2 0 0 Y L C 2 0 0 0 0 Y L A 2 0 0 Y A 3 Y R A B 3 Y R A C 3 0 0 0 0 0 Y L B 2 0 Y R A B 3 Y B 3 Y R B C 3 0 0 0 0 0 0 Y L C 2 Y R A C 3 Y R B C 3 Y C 3
W B 1 = Y 0 Y T A E A · Y T A E B · Y T B E C · Y T C Y T C 0 0 0 0 0 0 Y T A Y A 1 E A · Y T A Y R A C 1 Y L A 1 0 0 0 0 0 Y T B Y R A B 1 E B · Y T B Y R B C 1 0 Y L B 1 0 0 0 0 Y T C Y R A C 1 E C · Y T C Y C 1 0 0 Y L C 1 0 0 0 0 Y L A 1 0 0 Y A 2 Y R A B 2 Y R A C 2 Y L A 2 0 0 0 0 0 0 Y R A B 2 Y B 2 Y R B C 2 0 Y L B 2 0 0 0 0 Y L C 1 Y R A C 2 Y R B C 2 Y C 2 0 0 Y L C 2 0 0 0 0 Y L A 2 0 0 Y A 3 Y R A B 3 Y R A C 3 0 0 0 0 0 Y L B 2 0 Y R A B 3 Y B 3 Y R B C 3 0 0 0 0 0 0 Y L C 2 Y R A C 3 Y R B C 3 Y C 3
W C 1 = Y 0 Y T A Y T B E A · Y T A E B · Y T B E C · Y T C 0 0 0 0 0 0 Y T A Y A 1 Y R A B 1 E A · Y T A Y L A 1 0 0 0 0 0 Y T B Y R A B 1 Y B 1 E B · Y T B 0 Y L B 1 0 0 0 0 Y T C Y R A C 1 Y R B C 1 E C · Y T C 0 0 Y L C 1 0 0 0 0 Y L A 1 0 0 Y A 2 Y R A B 2 Y R A C 2 Y L A 2 0 0 0 0 Y L B 1 0 Y R A B 2 Y B 2 Y R B C 2 0 Y L B 2 0 0 0 0 0 Y R A C 2 Y R B C 2 Y C 2 0 0 Y L C 2 0 0 0 0 Y L A 2 0 0 Y A 3 Y R A B 3 Y R A C 3 0 0 0 0 0 Y L B 2 0 Y R A B 3 Y B 3 Y R B C 3 0 0 0 0 0 0 Y L C 2 Y R A C 3 Y R B C 3 Y C 3
W A 2 = Y 0 Y T A Y T B Y T C E A · Y T A E B · Y T B E C · Y T C 0 0 0 0 0 Y T A Y A 1 Y R A B 1 Y R A C 1 E A · Y T A 0 0 0 0 0 Y T B Y R A B 1 Y B 1 Y R B C 1 E B · Y T B Y L B 1 0 0 0 0 Y T C Y R A C 1 Y R B C 1 Y C 1 E C · Y T C 0 Y L C 1 0 0 0 0 Y L A 1 0 0 0 Y R A B 2 Y R A C 2 Y L A 2 0 0 0 0 Y L B 1 0 0 Y B 2 Y R B C 2 0 Y L B 2 0 0 0 0 Y L C 1 0 Y R B C 2 Y C 2 0 0 Y L C 2 0 0 0 0 0 0 0 Y A 3 Y R A B 3 Y R A C 3 0 0 0 0 0 Y L B 2 0 Y R A B 3 Y B 3 Y R B C 3 0 0 0 0 0 0 Y L C 2 Y R A C 3 Y R B C 3 Y C 3
W B 2 = Y 0 Y T A Y T B Y T C 0 E A · Y T A E B · Y T B E C · Y T C 0 0 0 0 Y T A Y A 1 Y R A B 1 Y R A C 1 Y L A 1 E A · Y T A 0 0 0 0 Y T B Y R A B 1 Y B 1 Y R B C 1 0 E B · Y T B 0 0 0 0 Y T C Y R A C 1 Y R B C 1 Y C 1 0 E C · Y T C Y L C 1 0 0 0 0 Y L A 1 0 0 Y A 2 0 Y R A C 2 Y L A 2 0 0 0 0 Y L B 1 0 Y R A B 2 0 Y R B C 2 0 Y L B 2 0 0 0 0 Y L C 1 Y R A C 2 0 Y C 2 0 0 Y L C 2 0 0 0 0 Y L A 2 0 0 Y A 3 Y R A B 3 Y R A C 3 0 0 0 0 0 0 0 Y R A B 3 Y B 3 Y R B C 3 0 0 0 0 0 0 Y L C 2 Y R A C 3 Y R B C 3 Y C 3
W C 2 = Y 0 Y T A Y T B Y T C 0 0 E A · Y T A E B · Y T B E C · Y T C 0 0 0 Y T A Y A 1 Y R A B 1 Y R A C 1 Y L A 1 0 E A · Y T A 0 0 0 Y T B Y R A B 1 Y B 1 Y R B C 1 0 Y L B 1 E B · Y T B 0 0 0 Y T C Y R A C 1 Y R B C 1 Y C 1 0 0 E C · Y T C 0 0 0 0 Y L A 1 0 0 Y A 2 Y R A B 2 0 Y L A 2 0 0 0 0 Y L B 1 0 Y R A B 2 Y B 2 0 0 Y L B 2 0 0 0 0 Y L C 1 Y R A C 2 Y R B C 2 0 0 0 Y L C 2 0 0 0 0 Y L A 2 0 0 Y A 3 Y R A B 3 Y R A C 3 0 0 0 0 0 Y L B 2 0 Y R A B 3 Y B 3 Y R B C 3 0 0 0 0 0 0 0 Y R A C 3 Y R B C 3 Y C 3
W A 3 = Y 0 Y T A Y T B Y T C 0 0 0 E A · Y T A E B · Y T B E C · Y T C 0 0 Y T A Y A 1 Y R A B 1 Y R A C 1 Y L A 1 0 0 E A · Y T A 0 0 Y T B Y R A B 1 Y B 1 Y R B C 1 0 Y L B 1 0 E B · Y T B 0 0 Y T C Y R A C 1 Y R B C 1 Y C 1 0 0 Y L C 1 E C · Y T C 0 0 0 Y L A 1 0 0 Y A 2 Y R A B 2 Y R A C 2 0 0 0 0 0 Y L B 1 0 Y R A B 2 Y B 2 Y R B C 2 0 Y L B 2 0 0 0 0 Y L C 1 Y R A C 2 Y R B C 2 Y C 2 0 0 Y L C 2 0 0 0 0 Y L A 2 0 0 0 Y R A B 3 Y R A C 3 0 0 0 0 0 Y L B 2 0 0 Y B 3 Y R B C 3 0 0 0 0 0 0 Y L C 2 0 Y R B C 3 Y C 3
W B 3 = Y 0 Y T A Y T B Y T C 0 0 0 0 E A · Y T A E B · Y T B E C · Y T C 0 Y T A Y A 1 Y R A B 1 Y R A C 1 Y L A 1 0 0 0 E A · Y T A 0 Y T B Y R A B 1 Y B 1 Y R B C 1 0 Y L B 1 0 0 E B · Y T B 0 Y T C Y R A C 1 Y R B C 1 Y C 1 0 0 Y L C 1 0 E C · Y T C 0 0 Y L A 1 0 0 Y A 2 Y R A B 2 Y R A C 2 Y L A 2 0 0 0 0 Y L B 1 0 Y R A B 2 Y B 2 Y R B C 2 0 0 0 0 0 0 Y L C 1 Y R A C 2 Y R B C 2 Y C 2 0 0 Y L C 2 0 0 0 0 Y L A 2 0 0 Y A 3 0 Y R A C 3 0 0 0 0 0 Y L B 2 0 Y R A B 3 0 Y R B C 3 0 0 0 0 0 0 Y L C 2 Y R A C 3 0 Y C 3
W C 3 = Y 0 Y T A Y T B Y T C 0 0 0 0 0 E A · Y T A E B · Y T B E C · Y T C Y T A Y A 1 Y R A B 1 Y R A C 1 Y L A 1 0 0 0 0 E A · Y T A Y T B Y R A B 1 Y B 1 Y R B C 1 0 Y L B 1 0 0 0 E B · Y T B Y T C Y R A C 1 Y R B C 1 Y C 1 0 0 Y L C 1 0 0 E C · Y T C 0 Y L A 1 0 0 Y A 2 Y R A B 2 Y R A C 2 Y L A 2 0 0 0 0 Y L B 1 0 Y R A B 2 Y B 2 Y R B C 2 0 Y L B 2 0 0 0 0 Y L C 1 Y R A C 2 Y R B C 2 Y C 2 0 0 0 0 0 0 0 Y L A 2 0 0 Y A 3 Y R A B 3 0 0 0 0 0 0 Y L B 2 0 Y R A B 3 Y B 3 0 0 0 0 0 0 0 Y L C 2 Y R A C 3 Y R B C 3 0
On this basis, the basic voltage parameters of the line can be determined, depending on their place in the electric power network. The neutral point voltage can be described by the following equation:
U 0 = W 0 W
The voltages on the medium-voltage buses at the HV/MV substation in the individual phases can be determined from the following equations:
U A 1 = W A 1 W U B 1 = W B 1 W U C 1 = W C 1 W
Analogously, the equations for determining the phase voltages in the middle of the MV line can be described as follows:
U A 2 = W A 2 W U B 2 = W B 2 W U C 2 = W C 2 W
and at the end of the MV line
U A 3 = W A 3 W U B 3 = W B 3 W U C 3 = W C 3 W
Taking the above formulas into account, it is possible to determine the equations describing the symmetrical components and the voltage asymmetry factors of the zero-sequence αU0 and negative-sequence αU2 on the MV buses of the HV/MV substations:
α U 01 = U 01 U 11 · 100 % α U 21 = U 21 U 11 · 100 %
where
U 01 = 1 3 · U A 1 + U B 1 + U C 1 U 11 = 1 3 · U A 1 + a · U B 1 + a 2 · U C 1 U 21 = 1 3 · U A 1 + a 2 · U B 1 + a · U C 1 a = e j 2 π 3
Similarly, the symmetrical components and voltage asymmetry factors in the middle of MV line can be described as follows:
α U 02 = U 02 U 12 · 100 % α U 22 = U 22 U 12 · 100 %
where
U 02 = 1 3 · U A 2 + U B 2 + U C 2 U 12 = 1 3 · U A 2 + a · U B 2 + a 2 · U C 2 U 22 = 1 3 · U A 2 + a 2 · U B 2 + a · U C 2
and at the end of the MV line
α U 03 = U 03 U 13 · 100 % α U 23 = U 23 U 13 · 100 %
where
U 03 = 1 3 · U A 3 + U B 3 + U C 3 U 13 = 1 3 · U A 3 + a · U B 3 + a 2 · U C 3 U 23 = 1 3 · U A 3 + a 2 · U B 3 + a · U C 3
The earth fault compensation detuning factor s is calculated from the following equation:
s = 1 ω 2 · C 0 · L 0 1 · 100 %
where ω is the voltage pulsation (2πf), C0 is the total earth capacity of the MV network and L0 is the inductance of the compensation reactor.

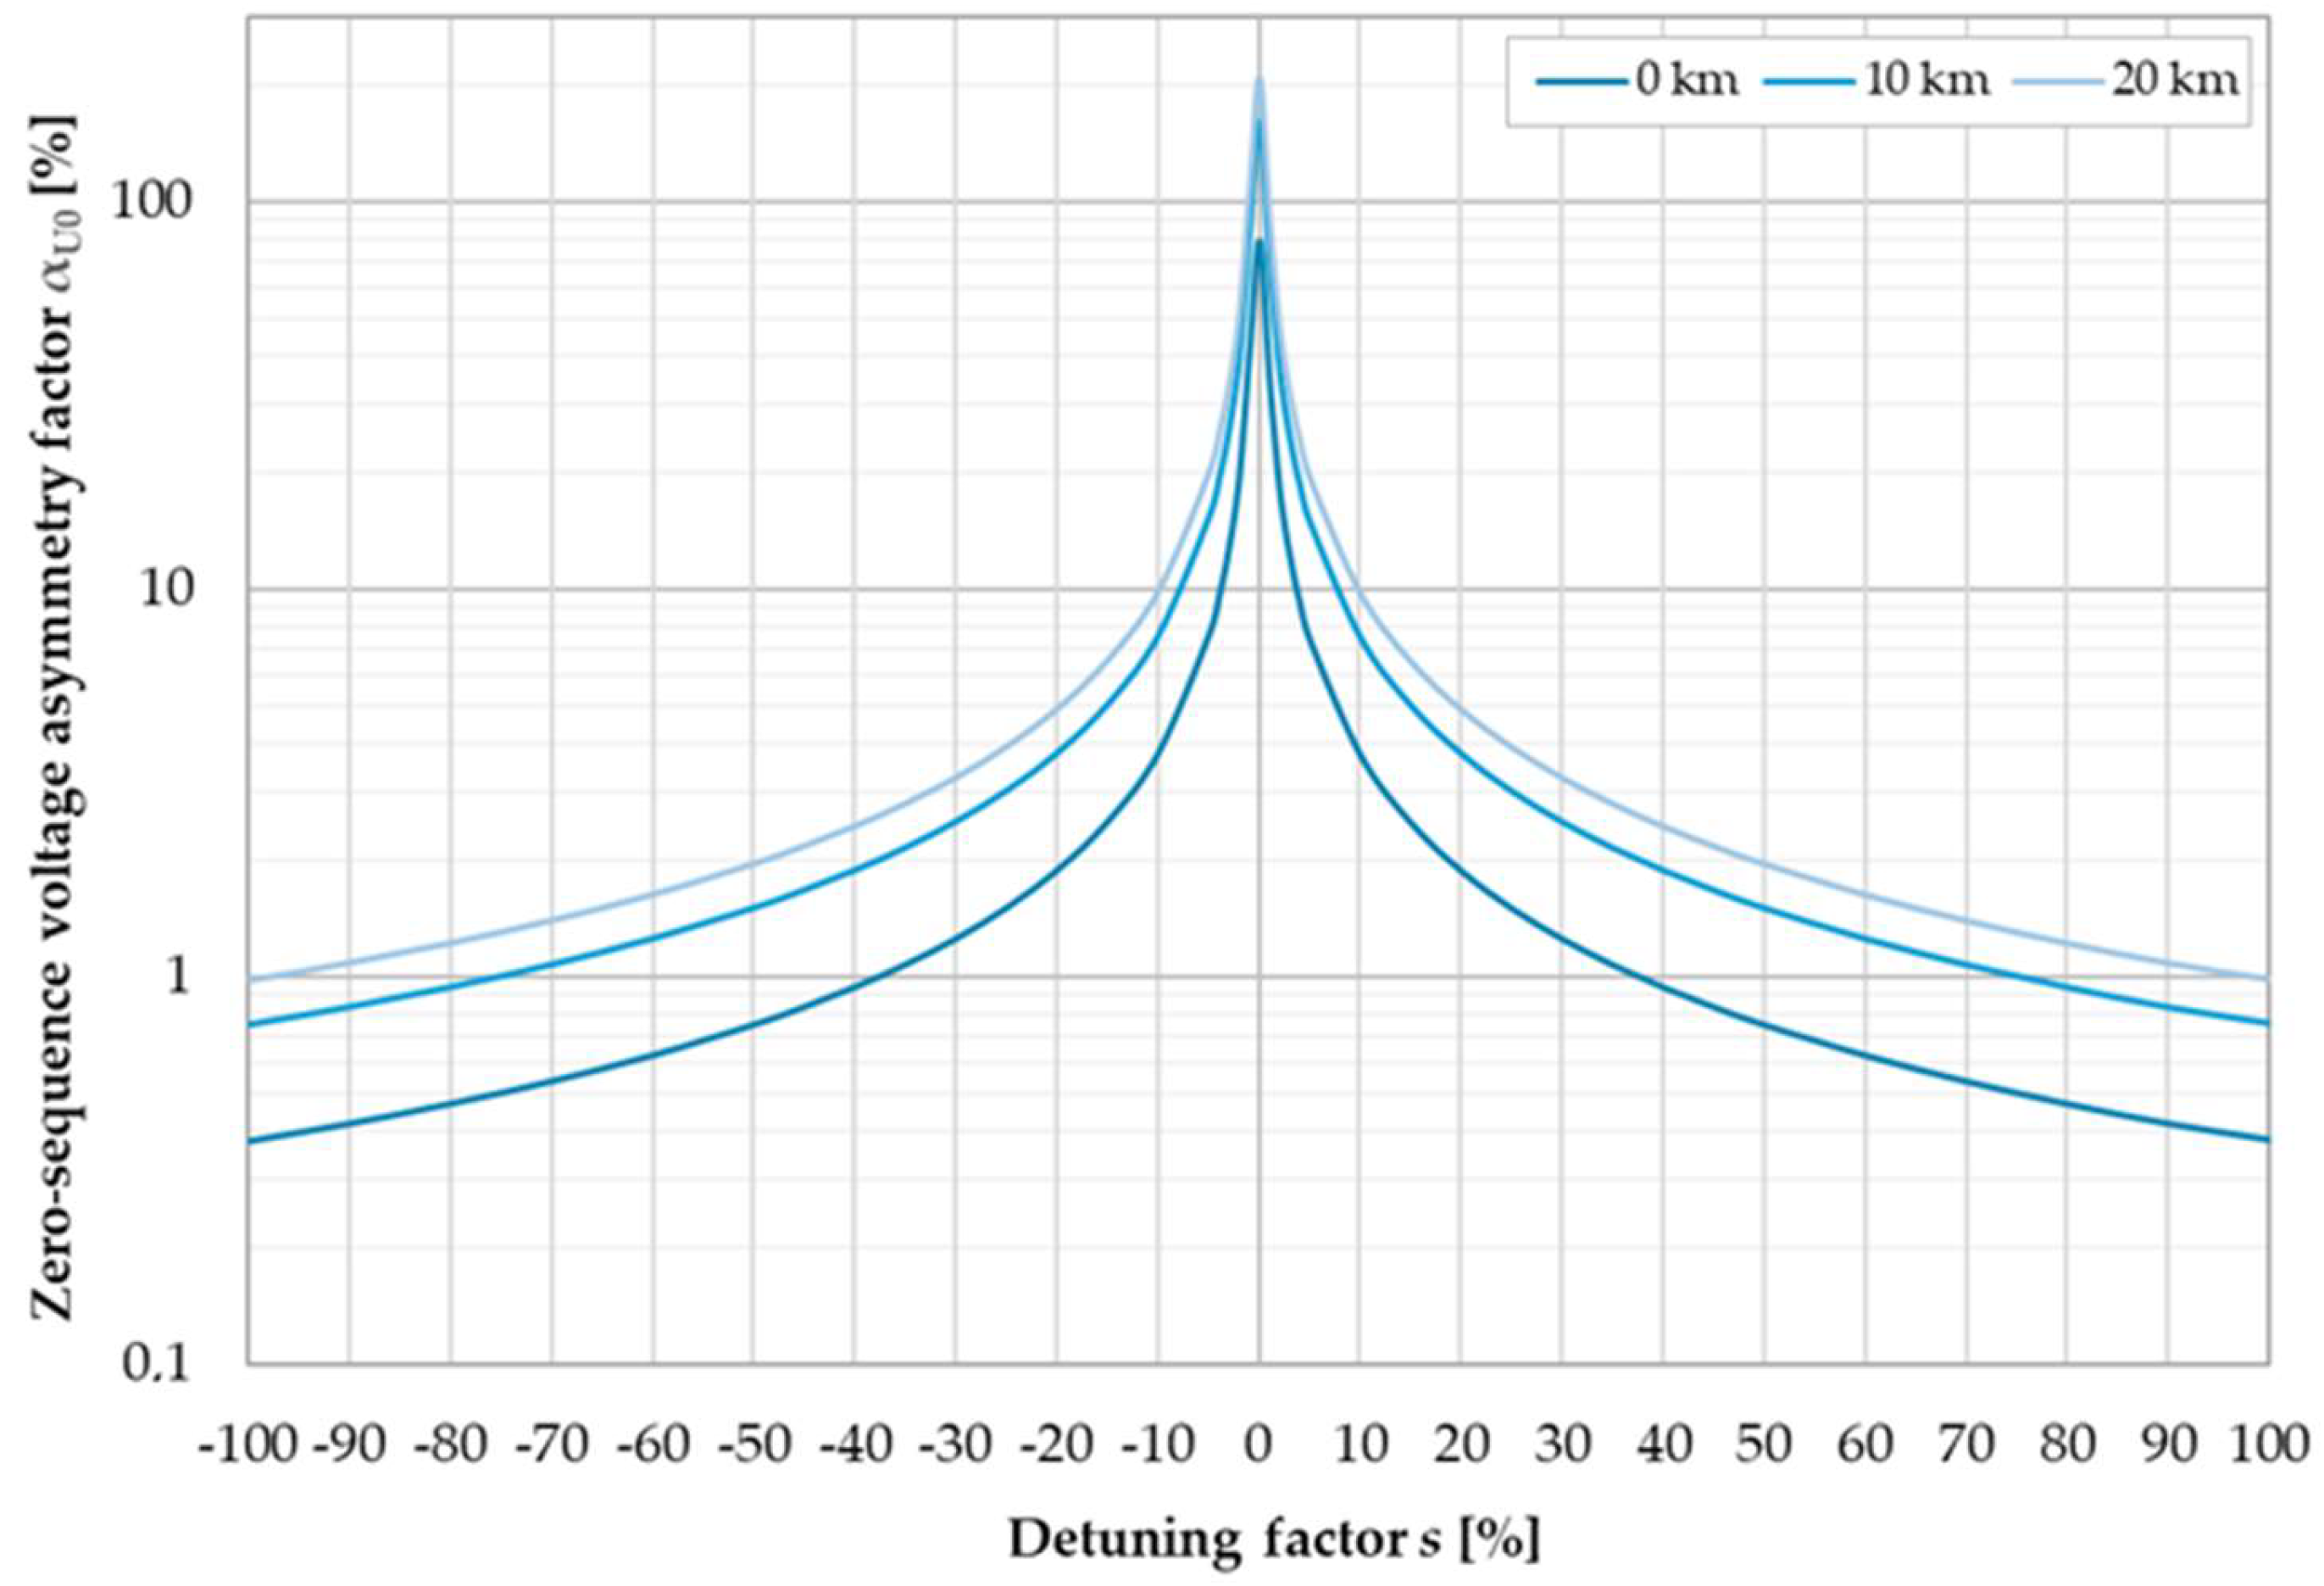
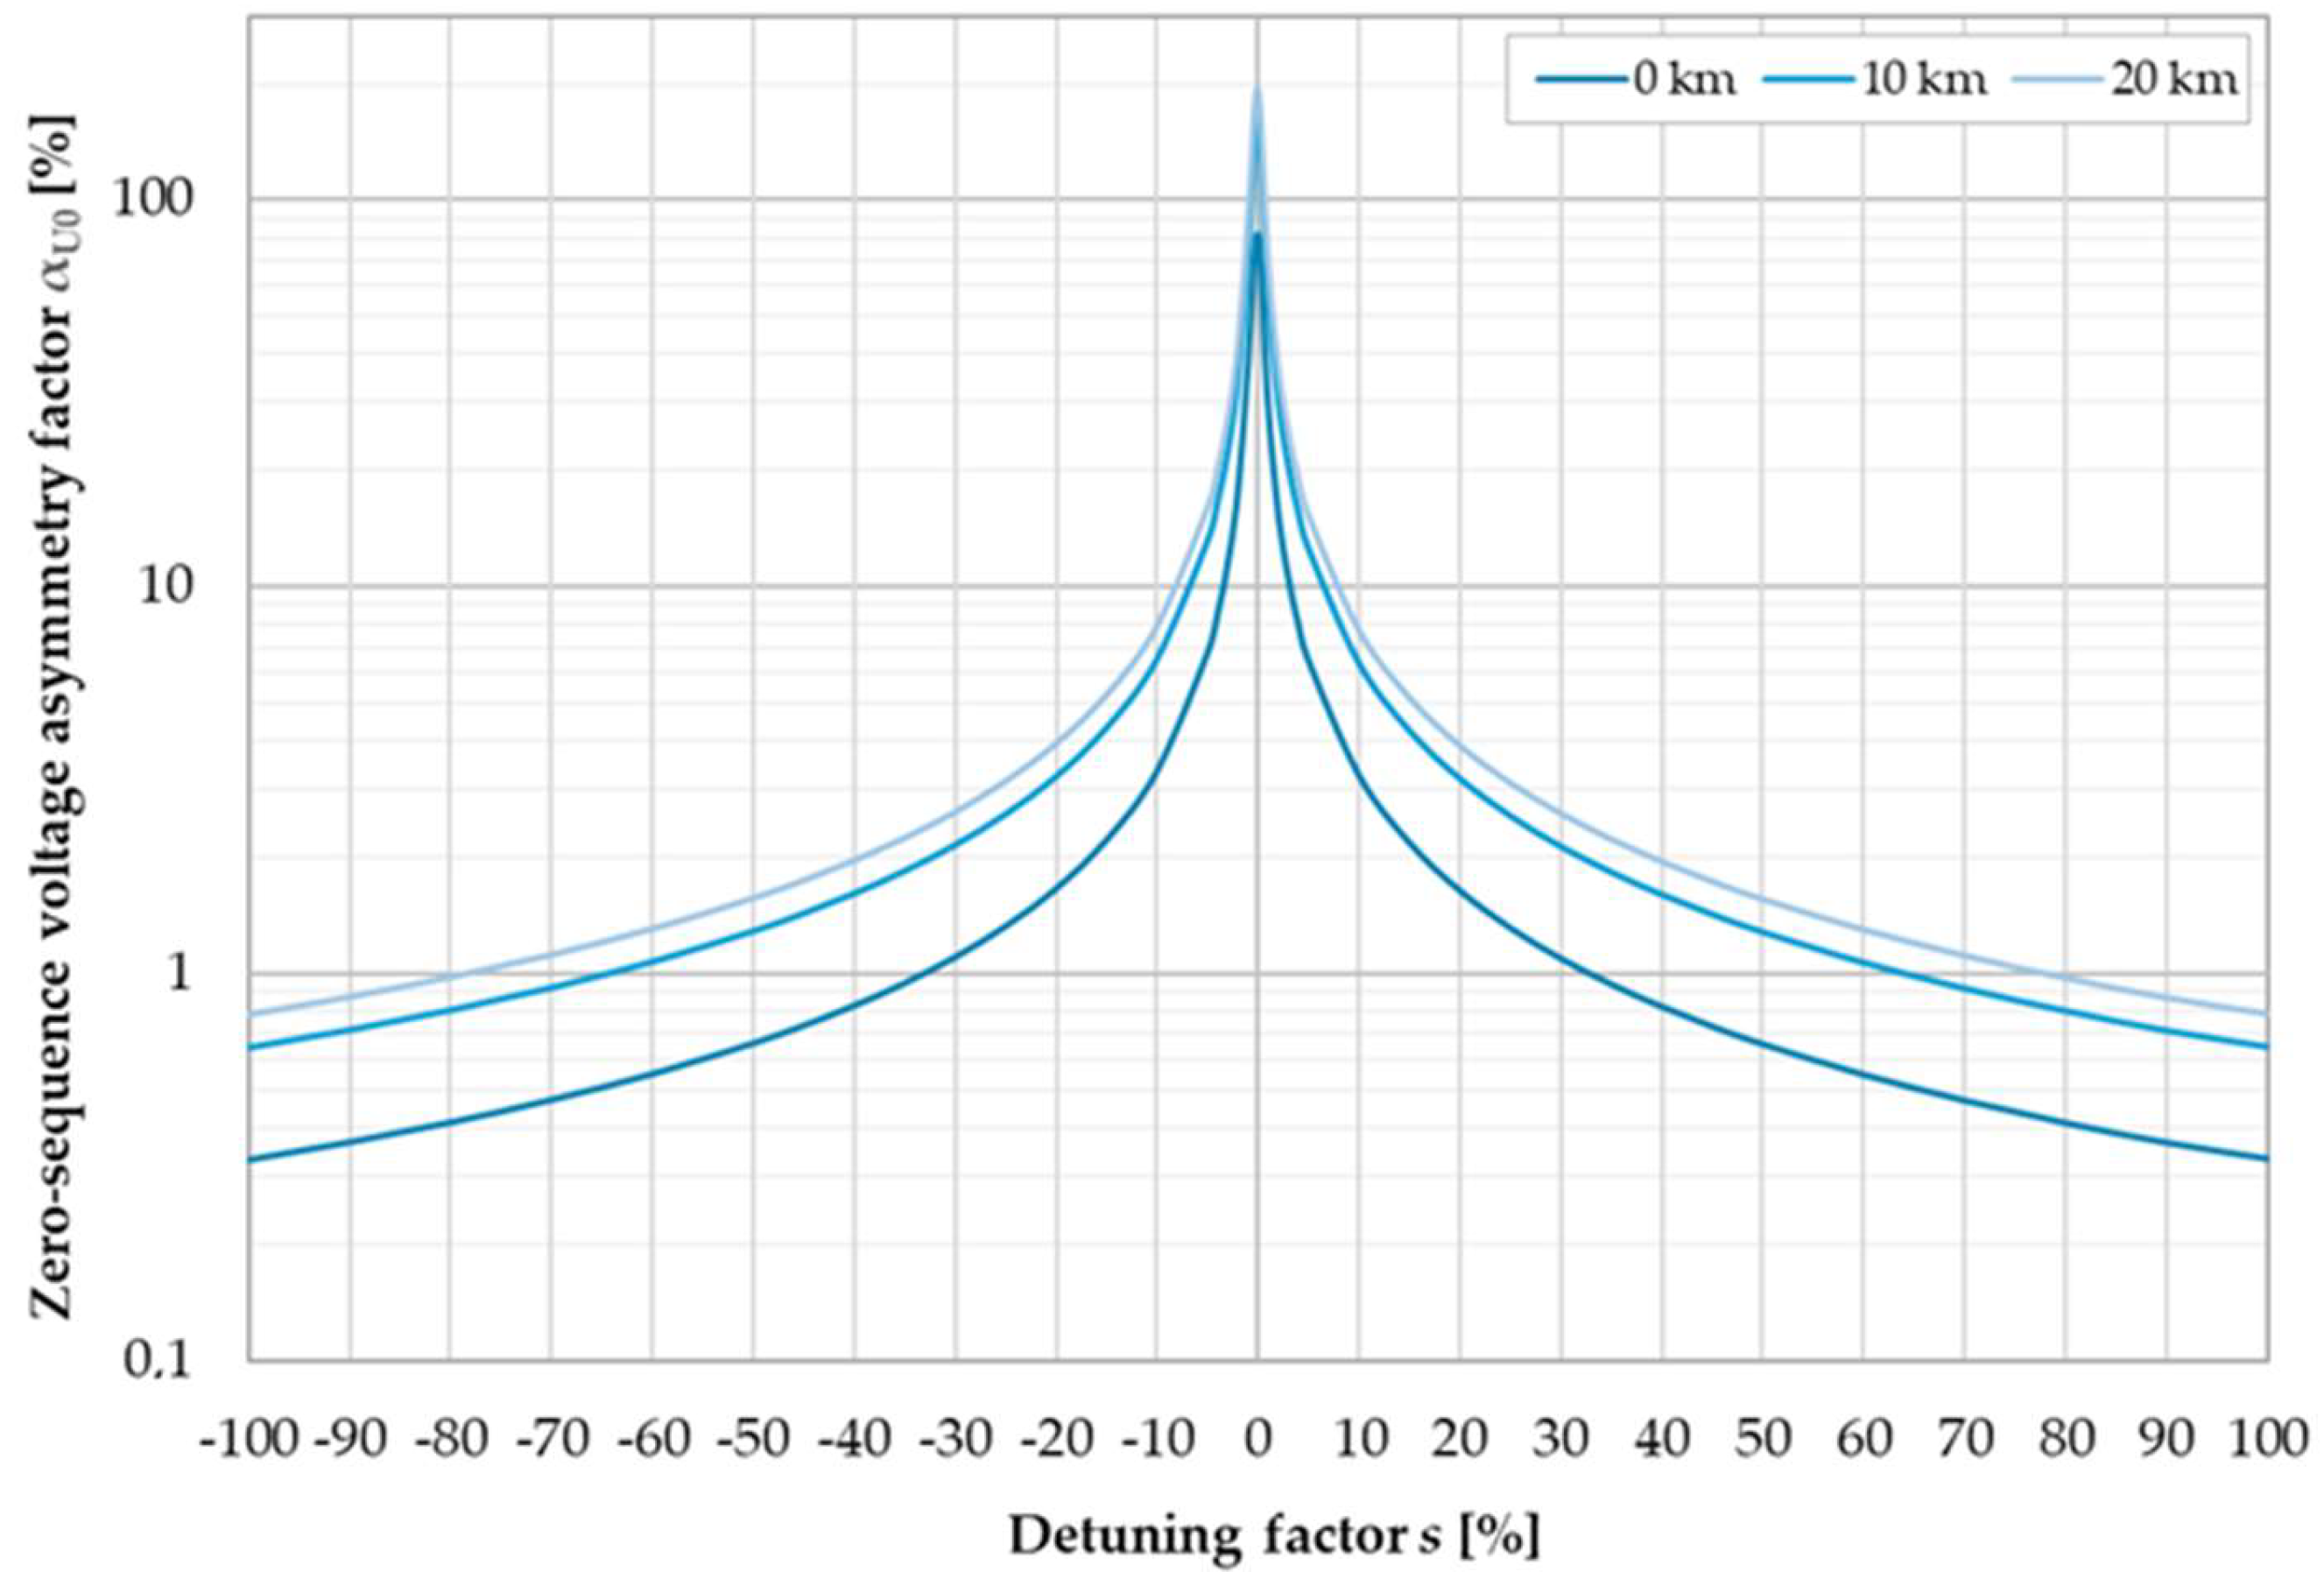
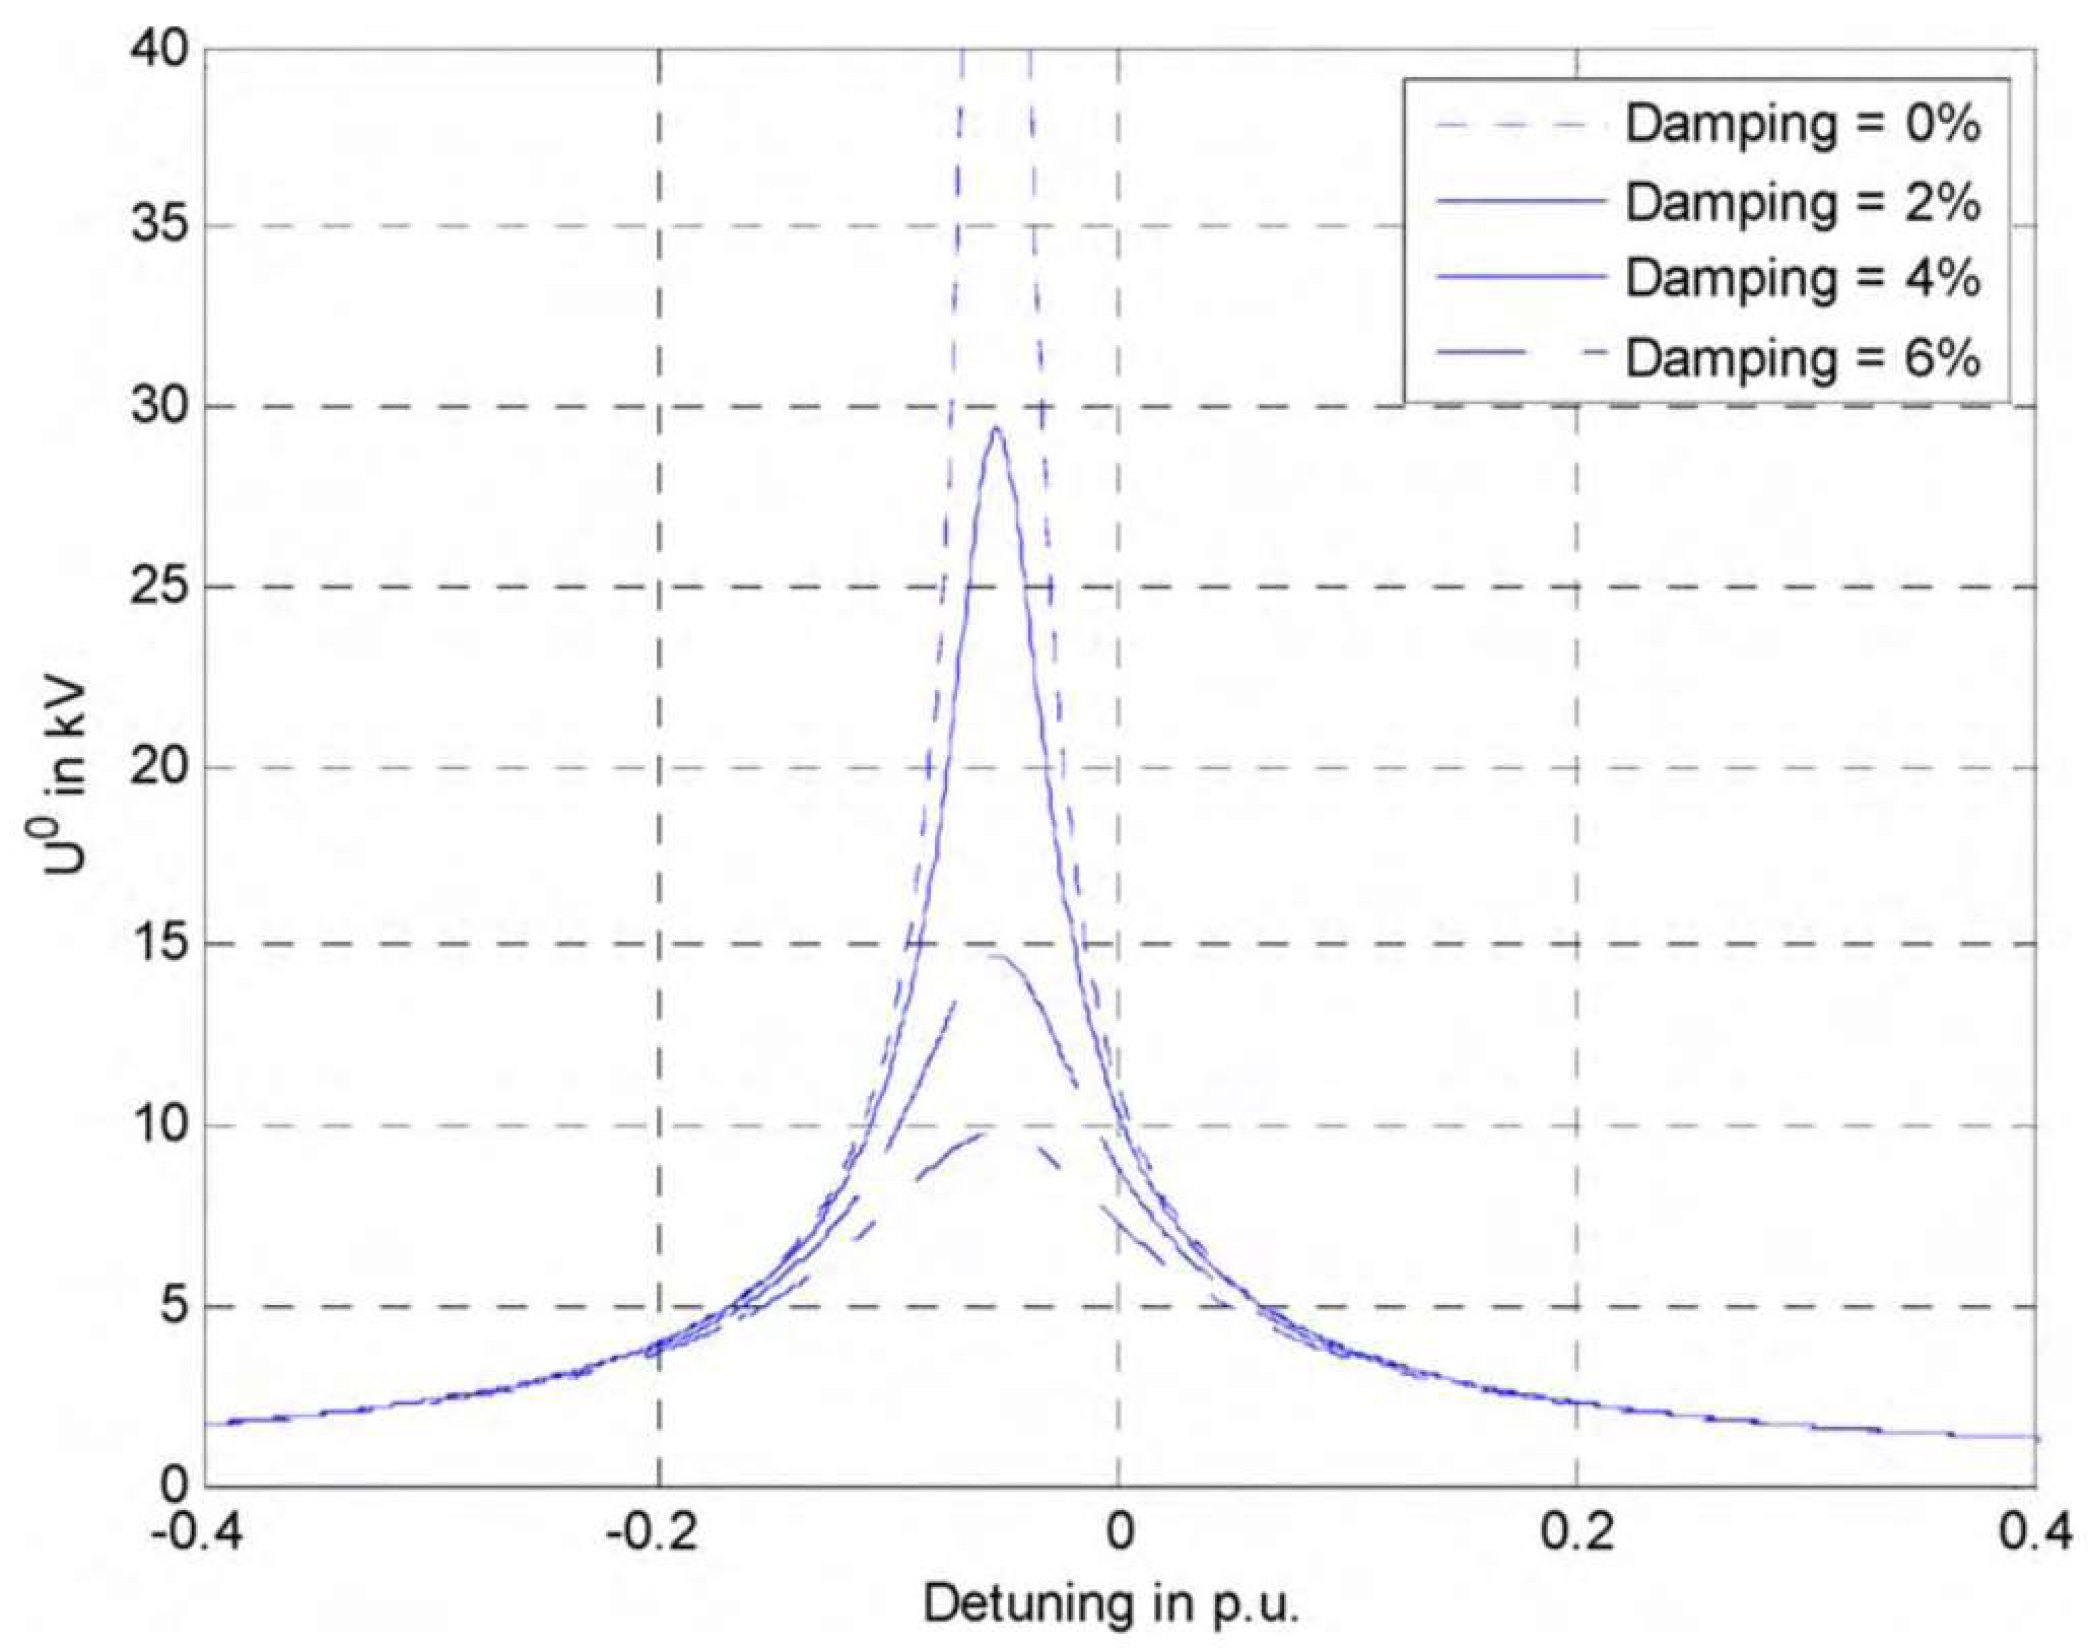
3. Results and Discussion

In order to observe the influence of the detuning value and MV line construction on the value of voltage asymmetry factors, a medium-voltage (15 kV) power system was modelled using the equivalent diagram in Figure 1.
For the calculations, an electric power network supplied from a 110/15 kV transformer with a rated capacity of 16 MVA was taken. A 15 kV overhead line with uninsulated aluminium–steel conductors (ACSR) 20 km long was connected to the transformer station. For the calculations, three variants of conductor cross-section were taken: 35, 50 and 70 mm2. The equivalent parameters of the HV/MV transformer, the power lines taken for the calculations, are shown in Table 1 and Table 2. The line is supplied with symmetrical voltage with the parameters shown in Table 3.
The data for the calculations were taken from the catalogues of the manufacturers of the conductors most commonly used in Poland. Based on these, the equivalent parameters of the power system given in Table 2 were calculated in the PowerFactory software (version 2023). The unbalance of the real three-phase system was represented as an asymmetric line capacitance. Mathcad software (version 14) was used for the analytical calculations. The electrical system analysed in the paper is equivalent to a real existing electric power network.
The analyses presented in this paper only include the case of symmetrical loads. Asymmetrical single-phase load arrangements have a significant effect on voltage asymmetry in low-voltage grids, while in medium-voltage grids the effect is negligible, as the authors showed in their paper [34]. It was assumed that the line is loaded symmetrically at three points, with a power of 0.667 MW (total 2 MW) and a power factor cosφ = 0.95 of an inductive character. The load impedance taken in this case is ZR = 304.34 − j100.43 Ω.
As a result of the analytical calculations, the values of the voltage asymmetry factors were obtained using the equivalent model (Figure 1) and the equations (1 ÷ 20). Figure 2, Figure 3 and Figure 4 show the dependence of the zero-sequence voltage asymmetry factor αU0 as a function of the earth fault compensation detuning factor s for different line cross-sections and lengths.
Analysing the curves shown in Figure 2, Figure 3 and Figure 4, one can first of all find an analogy of their shape, with the curves available in the literature [35,36,37,38], which show the dependence of the voltage U0 depending on the earth fault compensation detuning. An example of the variation in the zero-sequence voltage according to Raunig et al. [36] is shown in Figure 5. The highest value of the zero-sequence voltage asymmetry factor αU0 occurs at resonance (detuning factor s = 0%) and reaches 80–200%. It can be seen that the smaller the cross-section of the line conductors, the higher the value of the asymmetry factor. Increasing the value of the detuning factor to 10% reduces the value of the zero-sequence asymmetry factor αU0 to 3–8%. This means that keeping the inductance of the Petersen coil close to the line capacitance results in a high zero-sequence voltage asymmetry in the network, which can lead to unnecessary tripping of the protections [39]. It is also worth noting that the value of factor αU0 also changes with distance from the substation, with the value increasing as the length of the MV line increases.
An analysis of the curves shown in Figure 6, Figure 7 and Figure 8 indicates that the negative-sequence voltage asymmetry factor αU2 does not depend on the detuning factor s. Only in the vicinity of the resonance values (s = 0%) are there small changes not exceeding 0.1%. Furthermore, the values of the negative-sequence voltage asymmetry factor αU2, for any value of the detuning factor s, are significantly smaller than the values of the zero-sequence voltage asymmetry factor αU0, and do not exceed 0.4% for the cases analysed. Analogously, as before, the values of the negative-sequence voltage asymmetry factor increase with increasing distance from the substation and decrease with increasing conductor cross-section.
In order to verify the correctness of the calculation of voltage asymmetry factors from the equations (1 ÷ 20), for the same grid parameters, a computer model of a section of the electric power network was made using PowerFactory software. Analogous to the analytical model, the modelled network is supplied from a 110/15 kV transformer with a rated power of 16 MVA. Connected to the transformer station are three 15 kV overhead lines with bare aluminium–steel conductors of 35, 50 and 70 mm2, each 20 km long. Each line is loaded every 1 km with a 100 kW transformer station (total of 2 MW in each line) with a power factor cosφ = 0.95 of inductive character. A schematic of this model is shown in Figure 9.
As for the analytical model, simulation calculations were performed for different values of the detuning factor s from −100% to 100%. Graphs of the dependence of the zero-sequence voltage asymmetry factor αU0 as a function of the earth fault compensation detuning factor s are shown in Figure 10, Figure 11 and Figure 12, while the dependence of the negative-sequence voltage asymmetry factor αU2 as a function of factor s is shown in Figure 13, Figure 14 and Figure 15.
By analysing the curves shown in Figure 10, Figure 11 and Figure 12, it can be seen that they are analogous to the analytical calculations. Also, the obtained values of the voltage asymmetry factors remain approximately the same. The highest value of the zero-sequence voltage asymmetry factor occurs at a detuning factor of s = 0%, i.e., at resonance, and is 30–90%. As with the analytical calculation, increasing the value of the detuning factor to 10% reduces the value of the zero-sequence asymmetry factor to 3–8%. It can also be seen that the values of the αU0 factor increase with increasing distance from the substation and decrease with increasing cross-section of the line conductors. In order to analyse in detail the dependence of the zero-sequence voltage asymmetry factor αU0 on the line cross-section and length, Figure 13, Figure 14 and Figure 15 show the determined waveforms for three values of the detuning factor: s = −20%, s = 0% and s = 20%.
At the MV buses of the transformer station, the value of the zero-sequence voltage asymmetry factor αU0 is the smallest and does not depend on the cross-section of the power line conductors. The impact of line construction is only noticeable beyond 2 km and is greater the greater the distance from the station. The variation in αU0 factor values changes in an approximately rectilinear manner up to a length of about 11 km, after which the relationship becomes increasingly smaller (in lines longer than 19 km, the relationship between voltage asymmetry and line length is negligible). The largest values of the zero-sequence voltage asymmetry factor occur for lines with a conductor cross-section of 35 mm2 and decrease as the cross-section increases (line resistance decreases) for any detuning factor. It is worth noting that the zero-sequence voltage asymmetry does not depend on the nature of the detuning (whether there will be under- or over-compensation in the grid).
Figure 16, Figure 17 and Figure 18 show the waveforms (for different conductor cross-sections), showing the relationship between the negative-sequence voltage asymmetry factor αU2 and the network detuning factor s at different points on the line.
An analysis of the curves shown in Figure 16, Figure 17 and Figure 18 shows that, as with the analytical calculations, the negative-sequence voltage asymmetry factor αU2 does not essentially depend on the detuning of the earth fault compensation. Analogously, as before, the values of the αU2 factor increase with increasing distance from the substation and decrease with increasing conductor cross-section.
In order to further determine the influence of the line length on the value of the negative-sequence voltage asymmetry factor αU2, the relationship waveforms were determined for three values of the detuning factor, s = −20%, s = 0% and s = 20%, which are shown in Figure 19, Figure 20 and Figure 21.
In the case of the negative-sequence voltage asymmetry factor αU2, some analogies to the relationships observed in the analysis of the zero-sequence voltage asymmetry factor αU0 are noticeable. In this case, also up to 1 km from the substation, the cross-section of the wires used in the line is not relevant. For distances between 1 and 14 km, the relationship is approximately rectilinear (in the previous case it was 1 km less). In this case, a relationship between the distance from the station and the value of the αU2 factor is evident over the entire range analysed (previously, above 19 km, the influence was already negligibly small), with the highest values of the αU2 factor (as in the case of αU0) observed for the smallest line cross-sections.

4. Conclusions

It is commonly accepted in the literature that the main cause of voltage asymmetry in electric power networks is the unbalanced loading of individual phases, resulting mainly from the work of single-phase loads or sources. As shown in this paper, the value of the zero-sequence voltage asymmetry factors αU0 are also influenced by the earth fault compensation detuning factor, i.e., the reactance of the reactor earthing the neutral point of the MV network (Petersen coil). The values of the αU0 factor can vary in a very wide range from 0.3% to even 90%. No such dependence was observed (except in the case of the resonance condition s = 0%) for the negative-sequence voltage asymmetry factor αU2, which does not depend on the inductance of the Petersen coil installed in the network. As can be seen from the authors’ research and analysis, the values of the zero- and negative- sequence voltage asymmetry factor depend strictly on the distance from the substation and the cross-section of the conductors used for the overhead lines. In both cases, the values of both asymmetry factors decrease as the cross-section increases. Increasing the distance from the substation (independently of the detuning factor) increases the values of the αU0 and αU2 factors, but the effect is noticeably smaller after a certain distance (approx. 18–20 km). The relationships presented in this paper can be very important in the design of earth fault protection to avoid tripping faults and in the design of railway networks to reduce current pulsations.

Author Contributions

Conceptualization, G.H. and Z.S.; methodology, G.H.; software, G.H.; validation, G.H. and Z.S.; formal analysis, G.H.; investigation, G.H.; resources, G.H.; data curation, G.H.; writing—original draft preparation, G.H.; writing—review and editing, Z.S.; visualization, G.H.; supervision, G.H.; project administration, Z.S.; funding acquisition, G.H. and Z.S. All authors have read and agreed to the published version of the manuscript.

Funding

This work was supported by scientific work WZ/WE-IA/7/2023 conducted in the Department of Electrotechnics, Power Electronics and Electrical Power Engineering at Bialystok University of Technology.

Institutional Review Board Statement

Not applicable.

Informed Consent Statement

Not applicable.

Data Availability Statement

Data is contained within the article.

Conflicts of Interest

The authors declare no conflicts of interest.

References

  1. Rafał, K.; Biskupski, J.; Bykuć, S.; Chaja, P. Dynamic Voltage Regulation and Unbalance Compensation in a Low-Voltage Distribution Network Using Energy Storage System. Appl. Sci. 2022, 12, 11678. [Google Scholar] [CrossRef]
  2. Larina, Y.; Galchynska, J.; Kucheruk, P.; Zghurska, O.; Ortina, G.; Al-Nadzhar, F.; Marusei, T.; Kubon, M.; Dzieniszewski, G. Estimation of the Domestic Agricultural Sector Potential for the Growth of Energy Cultures for Bioenergy Fuel Production. Agric. Eng. 2021, 25, 73–82. [Google Scholar] [CrossRef]
  3. Zajkowski, K.; Duer, S.; Paś, J.; Pokorádi, L. Cooperation of a Non-Linear Receiver with a Three-Phase Power Grid. Energies 2023, 16, 1418. [Google Scholar] [CrossRef]
  4. Zajkowski, K.; Duer, S. Decomposition of the Voltages in a Three-Phase Asymmetrical Circuit with a Non-Sinusoidal Voltage Source. Energies 2023, 16, 7616. [Google Scholar] [CrossRef]
  5. Olczykowski, Z. Electric Arc Furnaces as a Cause of Current and Voltage Asymmetry. Energies 2021, 14, 5058. [Google Scholar] [CrossRef]
  6. Möller, F.; Meyer, J. Survey of voltage unbalance and unbalanced power in German public LV networks. In Proceedings of the 2022 20th International Conference on Harmonics & Quality of Power (ICHQP), Naples, Italy, 29 May–1 June 2022. [Google Scholar] [CrossRef]
  7. Hołdyński, G.; Skibko, Z.; Firlit, A.; Walendziuk, W. Analysis of the Impact of a Photovoltaic Farm on Selected Parameters of Power Quality in a Medium-Voltage Power Grid. Energies 2024, 17, 623. [Google Scholar] [CrossRef]
  8. Al-Shetwi, A.Q.; Hannan, M.A.; Jern, K.P.; Alkahtani, A.A.; PG Abas, A.E. Power Quality Assessment of Grid-Connected PV System in Compliance with the Recent Integration Requirements. Electronics 2020, 9, 366. [Google Scholar] [CrossRef]
  9. Skibko, Z.; Tymińska, M.; Romaniuk, W.; Borusiewicz, A. Impact of the Wind Turbine on the Parameters of the Electricity Supply to an Agricultural Farm. Sustainability 2021, 13, 7279. [Google Scholar] [CrossRef]
  10. Hołdyński, G.; Skibko, Z.; Borusiewicz, A. Analysis of the Influence of Load on the Value of Zero-Voltage Asymmetry in Medium-Voltage Networks Operating with Renewable Energy Sources. Energies 2023, 16, 580. [Google Scholar] [CrossRef]
  11. Roy, R.B.; Alahakoon, A.; Arachchillage, S.J. Grid impacts of uncoordinated fast charging of electric ferry. Batteries 2021, 7, 13. [Google Scholar] [CrossRef]
  12. Rodríguez-Pajarón, P.; Hernández, A.; Jovica, V.; Milanović, J.V. Probabilistic assessment of the impact of electric vehicles and nonlinear loads on power quality in residential networks. Int. J. Electron. Power Energy Syst. 2021, 129, 106807. [Google Scholar] [CrossRef]
  13. Bozalakov, D.; Mnati, M.J.; Laveyne, J.; Desmet, J.; Vandevelde, L. Battery storage integration in voltage unbalance and overvoltage mitigation control strategies and its impact on the power quality. Energies 2019, 12, 1501. [Google Scholar] [CrossRef]
  14. Ghosh, S.; Rahman, S.; Pipattanasomporn, M. Distribution Voltage Regulation Through Active Power Curtailment With PV Inverters and Solar Generation Forecasts. IEEE Trans. Sustain. Energy 2017, 8, 13–22. [Google Scholar] [CrossRef]
  15. Nejabatkhah, F.; Li, Y.W. Flexible Unbalanced Compensation of Three-Phase Distribution System Using Single-Phase Distributed Generation Inverters. IEEE Trans. Smart Grid 2017, 10, 1845–1857. [Google Scholar] [CrossRef]
  16. Kaur, M.; Ghosh, S. Effective Loss Minimization and Allocation of Unbalanced Distribution Network. Energies 2017, 10, 1931. [Google Scholar] [CrossRef]
  17. Prístavka, M.; Findura, P.; Beloev, I.; Kuboń, M.; Hrdá, V.; Kovalyshyn, S.; Shchur, T. Verification of the Measurement System in a Production Organization. Agric. Eng. 2022, 26, 81–90. [Google Scholar] [CrossRef]
  18. Shigenobu, R.; Nakadomari, A.; Hong, Y.-Y.; Mandal, P.; Takahashi, H.; Senjyu, T. Optimization of Voltage Unbalance Compensation by Smart Inverter. Energies 2020, 13, 4623. [Google Scholar] [CrossRef]
  19. Weckx, S.; Driesen, J. Load balancing with EV chargers and PV inverters in unbalanced distribution grids. IEEE Trans. Sustain. Energy 2015, 6, 635–643. [Google Scholar] [CrossRef]
  20. Ciontea, C.I.; Iov, F. A Study of Load Imbalance Influence on Power Quality Assessment for Distribution Networks. Electricity 2021, 2, 77–90. [Google Scholar] [CrossRef]
  21. Kahingala, T.D.; Perera, S.; Agalgaonkar, A.P.; Jayatunga, U. Determining the Impact of Line Asymmetries on Network Voltage Unbalance based on Balanced Load Flow Studies. In Proceedings of the 2018 Australasian Universities Power Engineering Conference (AUPEC), Auckland, New Zealand, 27–30 November 2018. [Google Scholar] [CrossRef]
  22. Kuliński, K.; Heyduk, A. Ground Fault in Medium-Voltage Power Networks with an Isolated Neutral Point: Spectral and Wavelet Analysis of Selected Cases in an Example Industrial Network Modeled in the ATP-EMTP Package. Energies 2024, 17, 1532. [Google Scholar] [CrossRef]
  23. Sołjan, Z.; Hołdyński, G.; Zajkowski, M. CPC-Based Minimizing of Balancing Compensators in Four-Wire Nonsinusoidal Asymmetrical Systems. Energies 2021, 14, 1815. [Google Scholar] [CrossRef]
  24. Lin, X.; Chen, H.; Xu, K.; Xu, J. Time Estimation Algorithm of Single-Phase-to-Ground Fault Based on Two-Step Dimensionality Reduction. Energies 2023, 16, 4921. [Google Scholar] [CrossRef]
  25. Hołdyński, G.; Skibko, Z. Influence of neutral point work on the voltage asymmetry in MV power network. Przegląd Elektrotechniczny 2013, 9, 190–192. (In Polish) [Google Scholar]
  26. Toader, D.; Greconici, M.; Vesa, D.; Vintan, M.; Solea, C.; Maghet, A.; Tatai, I. The Influence of the Characteristics of the Medium Voltage Network on the Single Line-to-Ground Fault Current in the Resistor Grounded Neutral Networks. Designs 2021, 5, 53. [Google Scholar] [CrossRef]
  27. Şolea, C.; Toader, D.; Vintan, M.; Greconici, M.; Vesa, D.; Tatai, I. The influence of insulation active power losses on the single line-to-ground fault in medium voltage electrical networks with resonant grounding. In Proceedings of the 10th International Conference on Modern Power Systems (MPS), Cluj-Napoca, Romania, 21–23 June 2023. [Google Scholar]
  28. Yang, D.; Lu, B.; Lu, H. High-Resistance Grounding Fault Detection and Line Selection in Resonant Grounding Distribution Network. Electronics 2023, 12, 4066. [Google Scholar] [CrossRef]
  29. EN 50160; Voltage Characteristics of Electricity Supplied by Public Electricity Networks. CENELEC: Brussels, Belgium, 2022.
  30. Lorenc, J.; Staszak, B.; Handke, J. Modified method of the automated earth fault compensation in mv network with earth fault asymmetry. Zesz. Nauk. Wydziału Elektrotechniki Autom. PG 2017, 53, 65–69. [Google Scholar]
  31. Zhang, F.; Xue, Y.; Li, G.; Xu, B. A Method for Measuring and Adjusting the Detuning of Resonant Grounding Systems With Transient Information After Arc Extinction. IEEE Trans. Power Deliv. 2023, 38, 496–504. [Google Scholar] [CrossRef]
  32. Sadeh, J.; Bakhshizadeh, E.; Kazemzadeh, R. A new fault location algorithm for radial distribution systems using modal analysis. Int. J. Electr. Power Energy Syst. 2013, 45, 271–278. [Google Scholar] [CrossRef]
  33. Guo, Z.; Yao, J.; Yang, S.; Zhang, H.; Mao, T.; Dong, T. A new method for non-unit protection of power transmission lines based on fault resistance and fault angle reduction. Int. J. Electr. Power Energy Syst. 2014, 55, 760–769. [Google Scholar] [CrossRef]
  34. Hołdyński, G.; Skibko, Z.; Walendziuk, W. Power and Energy Losses in Medi-um-Voltage Power Grids as a Function of Current Asymmetry—An Example from Po-land. Energies 2024, 17, 3706. [Google Scholar] [CrossRef]
  35. Marciniak, L. Asymmetry parameters for zero sequence component in medium voltage networks. Prz. Elektrotechniczny 2020, 96, 25. [Google Scholar] [CrossRef]
  36. Raunig, C.; Schmautzer, E.; Fickert, L.; Achleitner, G.; Obkircher, C. Displacement voltages in resonant grounded grids caused by capacitive coupling. In Proceedings of the CIRED 2009—20th International Conference and Exhibition on Electricity Distribution—Part 1, Prague, Czech Republic, 8–11 June 2009; pp. 1–4. [Google Scholar] [CrossRef]
  37. Raunig, C.; Obkircher, C.; Achleitner, G.; Schmautzer, E.; Fickert, L. Calculation of neutral to earth voltage levels in compensated high voltage networks influenced by cross coupling. In Proceedings of the 2008 Power Quality and Supply Reliability Conference, Parnu, Estonia, 27–29 August 2008; pp. 151–156. [Google Scholar] [CrossRef]
  38. Lorenc, J.; Staszak, B.; Handke, J. Ground Fault Compensation Effectiveness Conditions in MV Grids with Significant To-Ground Unbalance. Acta Energetica 2018, 37, 81–87. [Google Scholar]
  39. Andruszkiewicz, J.; Lorenc, J.; Olejnik, B.; Weychan, A.; Staszak, B. Method of Reducing the Effects of Repeated Ignition during Earth Faults in Compensated Medium Voltage Networks. Energies 2024, 17, 93. [Google Scholar] [CrossRef]
Figure 1. Equivalent model of MV electric power network with neutral point earthed by a reactor (earth fault compensation). Z0—earthing impedance of the MV network neutral point; EA, EB, EC—electromotive force induced in the HV/MV transformer windings; ZTA, ZTB, ZTC—impedances of the HV/MV transformer; CA1, CB1, CC1, CA2, CB2, CC2, CA3, CB3, CC3—ground capacitances of the MV overhead line at the beginning, middle and end of the line; ZRAB1, ZRBC1, ZRAC1, ZRAB2, ZRBC2, ZRAC2, ZRAB3, ZRBC3, ZRAC3—load impedance at the beginning, middle and end of the line; ZLA1, ZLB1, ZLC1, ZLA2, ZLB2, ZLC2—equivalent impedance of individual MV line sections.
Applsci 15 01560 g001
Figure 2. Graph of the relationship αU0 = f(s) for an MV line with a 35 mm2 conductor cross-section for the analytical model.
Applsci 15 01560 g002
Figure 3. Graph of the relationship αU0 = f(s) for an MV line with a 50 mm2 conductor cross-section for the analytical model.
Applsci 15 01560 g003
Figure 4. Graph of the relationship αU0 = f(s) for an MV line with a 70 mm2 conductor cross-section for the analytical model.
Applsci 15 01560 g004
Figure 5. Graph of the relationship zero-sequence voltage U0 depending on the earth fault compensation detuning factor determined by Raunig et al. [38].
Applsci 15 01560 g005
Figure 6. Graph of the relationship αU2 = f(s) for an MV line with a 35 mm2 conductor cross-section for the analytical model.
Applsci 15 01560 g006
Figure 7. Graph of the relationship αU2 = f(s) for an MV line with a 50 mm2 conductor cross-section for the analytical model.
Applsci 15 01560 g007
Figure 8. Graph of the relationship αU2 = f(s) for an MV line with a 70 mm2 conductor cross-section for the analytical model.
Applsci 15 01560 g008
Figure 9. Schematic of the computer model of the electric power grid under study.
Applsci 15 01560 g009
Figure 10. Graph of the relationship αU0 = f(s) for an MV line with a 35 mm2 conductor cross-section for the computer model.
Applsci 15 01560 g010
Figure 11. Graph of the relationship αU0 = f(s) for an MV line with a 50 mm2 conductor cross-section for the computer model.
Applsci 15 01560 g011
Figure 12. Graph of the relationship αU0 = f(s) for an MV line with a 70 mm2 conductor cross-section for the computer model.
Applsci 15 01560 g012
Figure 13. Graph of the dependence of the αU0 factor on distance from the HV/MV substation for different MV line conductor cross-sections at a detuning factor of s = −20%.
Applsci 15 01560 g013
Figure 14. Graph of the dependence of the αU0 factor on distance from the HV/MV substation for different MV line conductor cross-sections at a detuning factor of s = 0%.
Applsci 15 01560 g014
Figure 15. Graph of the dependence of the αU0 factor on distance from the HV/MV substation for different MV line conductor cross-sections at a detuning factor of s = 20%.
Applsci 15 01560 g015
Figure 16. Graph of the relationship αU2 = f(s) for an MV line with a 35 mm2 conductor cross-section for the computer model.
Applsci 15 01560 g016
Figure 17. Graph of the relationship αU2 = f(s) for an MV line with a 50 mm2 conductor cross-section for the computer model.
Applsci 15 01560 g017
Figure 18. Graph of the relationship αU2 = f(s) for an MV line with a 70 mm2 conductor cross-section for the computer model.
Applsci 15 01560 g018
Figure 19. Graph of the dependence of the αU2 factor on distance from the HV/MV substation for different MV line conductor cross-sections at a detuning factor of s = −20%.
Applsci 15 01560 g019
Figure 20. Graph of the dependence of the αU2 factor on distance from the HV/MV substation for different MV line conductor cross-sections at a detuning factor of s = 0%.
Applsci 15 01560 g020
Figure 21. Graph of the dependence of the αU2 factor on distance from the HV/MV substation for different MV line conductor cross-sections at a detuning factor of s = 20%.
Applsci 15 01560 g021
Table 1. Equivalent parameters of the HV/MV transformer.
ParameterValueUnit
Impedance ZTA0.0848 + j1.7829Ω
Impedance ZTB0.0848 + j1.7829Ω
Impedance ZTC0.0848 + j1.7829Ω
Table 2. Equivalent parameters of MV overhead lines.
ParameterValueUnit
Cross-section355070mm2
Impedance ZLA0.9005 + j0.78950.6545 + j0.77880.4886 + j0.7688Ω/km
Impedance ZLB0.9005 + j0.78950.6545 + j0.77880.4886 + j0.7688Ω/km
Impedance ZLC0.9005 + j0.78950.6545 + j0.77880.4886 + j0.7688Ω/km
Capacitance CLA−j0.007315−j0.007494−j0.007671μF/km
Capacitance CLB−j0.007597−j0.007796−j0.007993μF/km
Capacitance CLC−j0.007315−j0.007494−j0.007671μF/km
Table 3. Supply voltages.
ParameterValueUnit
Voltage EA8660 ej0⁰V
Voltage EB8660 e−j120⁰V
Voltage EC8660 ej120⁰V
Disclaimer/Publisher’s Note: The statements, opinions and data contained in all publications are solely those of the individual author(s) and contributor(s) and not of MDPI and/or the editor(s). MDPI and/or the editor(s) disclaim responsibility for any injury to people or property resulting from any ideas, methods, instructions or products referred to in the content.

