
Engineering Properties of Television Plastic Shell Waste (TPSW) to Replace Part of Sand–Cement Mortar

 , , and
Abstract
1. Introduction
2. Experimental Design
2.1. Experimental Materials
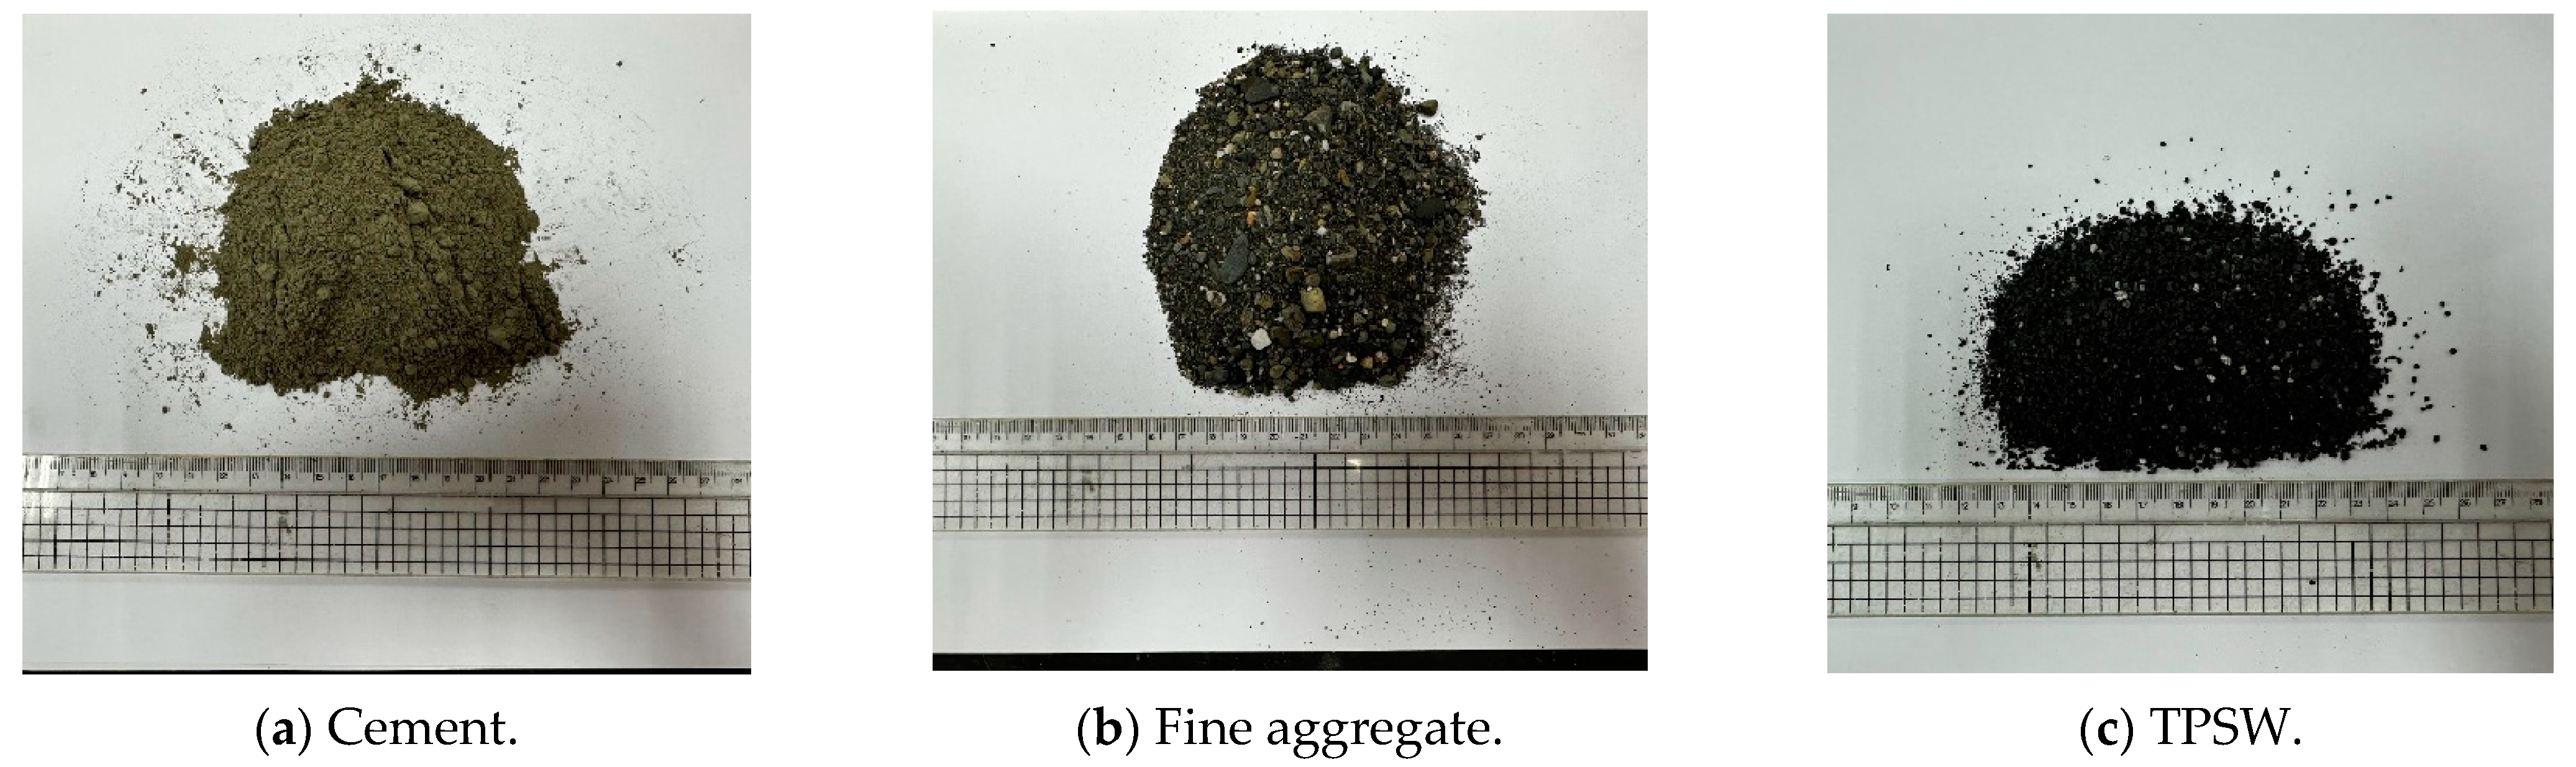
- Fine aggregate: River sand from the Laolong River. The saturated surface dry specific gravity was tested according to the CNS 487 specifications [46]. The saturated surface dry specific gravity was 2.65, and the water absorption was 1.9%. Its appearance is shown in Figure 1b, and its physical properties are shown in Table 2.
- TPSW: The TV shell was made of HIPS and was provided by the manufacturer. The TPSW originally appeared in the form of black flakes. After being crushed by a crusher, the TPSW appeared in the form of a black powder. Its appearance is shown in Figure 1c, and its physical properties are shown in Table 2.
2.2. Test Methods and Items
- (1)
- Slump: according to the ASTM C109 specification, a mini-slump cone was used to conduct a test, and the slump method was used to measure the consistency of the fresh cement mortar to determine the workability of the mortar.
- (2)
- Slump flow: according to the ASTM C230 specification, which mainly measures the standard flow value of the cement mortar.
- (3)
- Setting time: according to the ASTM C403 specification to measure the standard water consumption of cement, the initial setting time and final setting time of the cement were used as a reference for understanding the properties of the cement and concrete construction.
- (4)
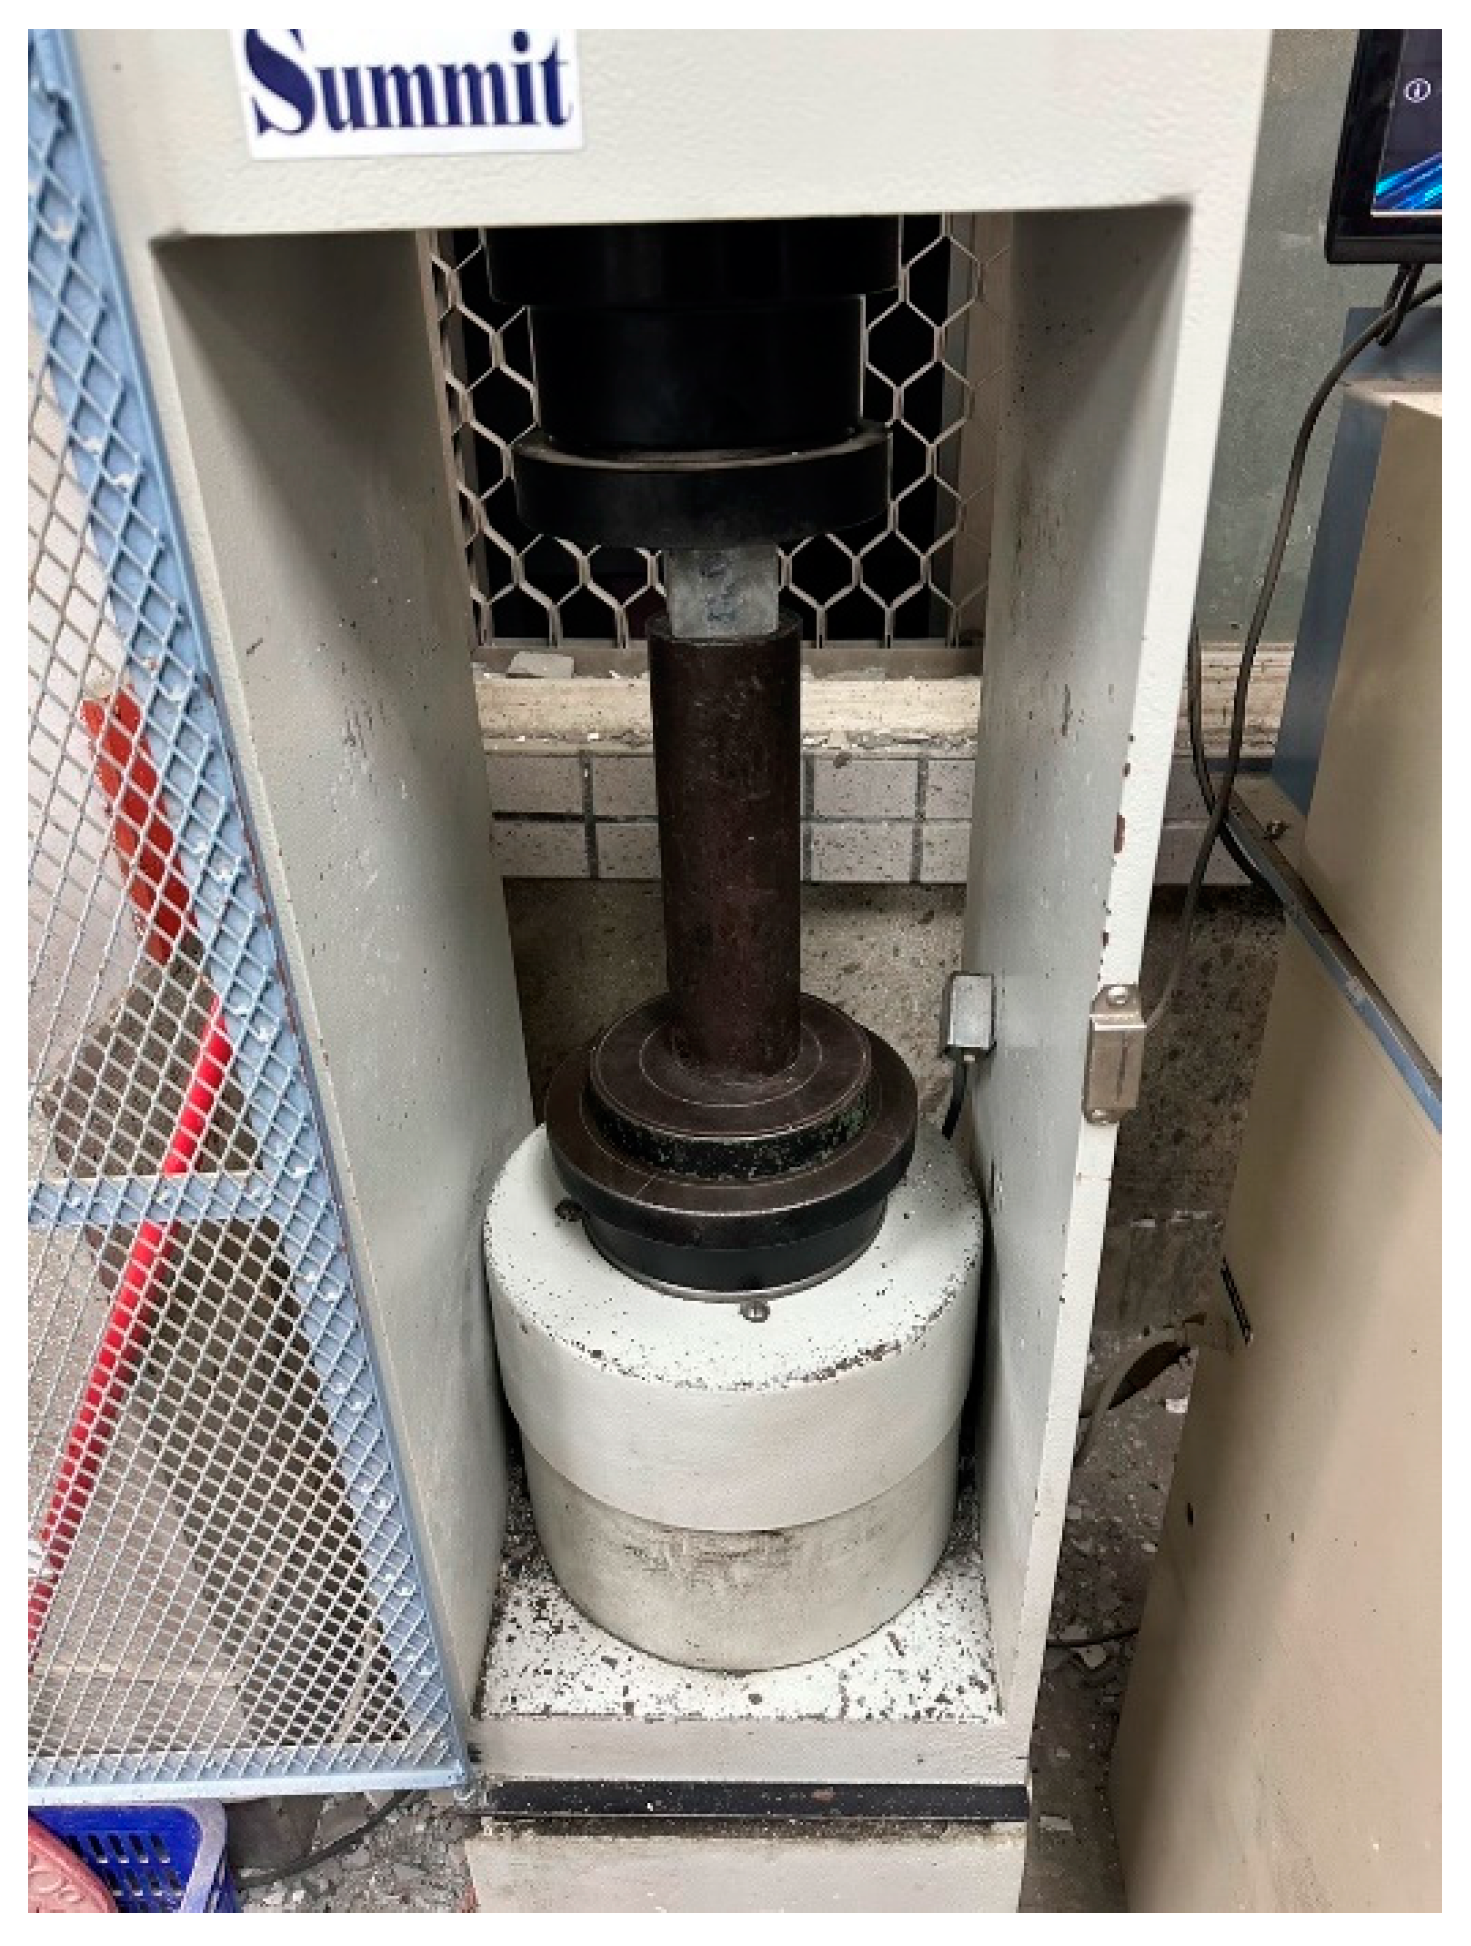
- Compressive strength: According to the ASTM C109 specifications, compressive tests were conducted at each age set by the institute to test the pressure-resistant properties of the various cement mortars. The schematic diagram of the testing process is shown in Figure 2.
- (5)
- Flexural strength: the flexural strength of the standard cement mortar was measured according to the ASTM C348 specifications.
- (6)
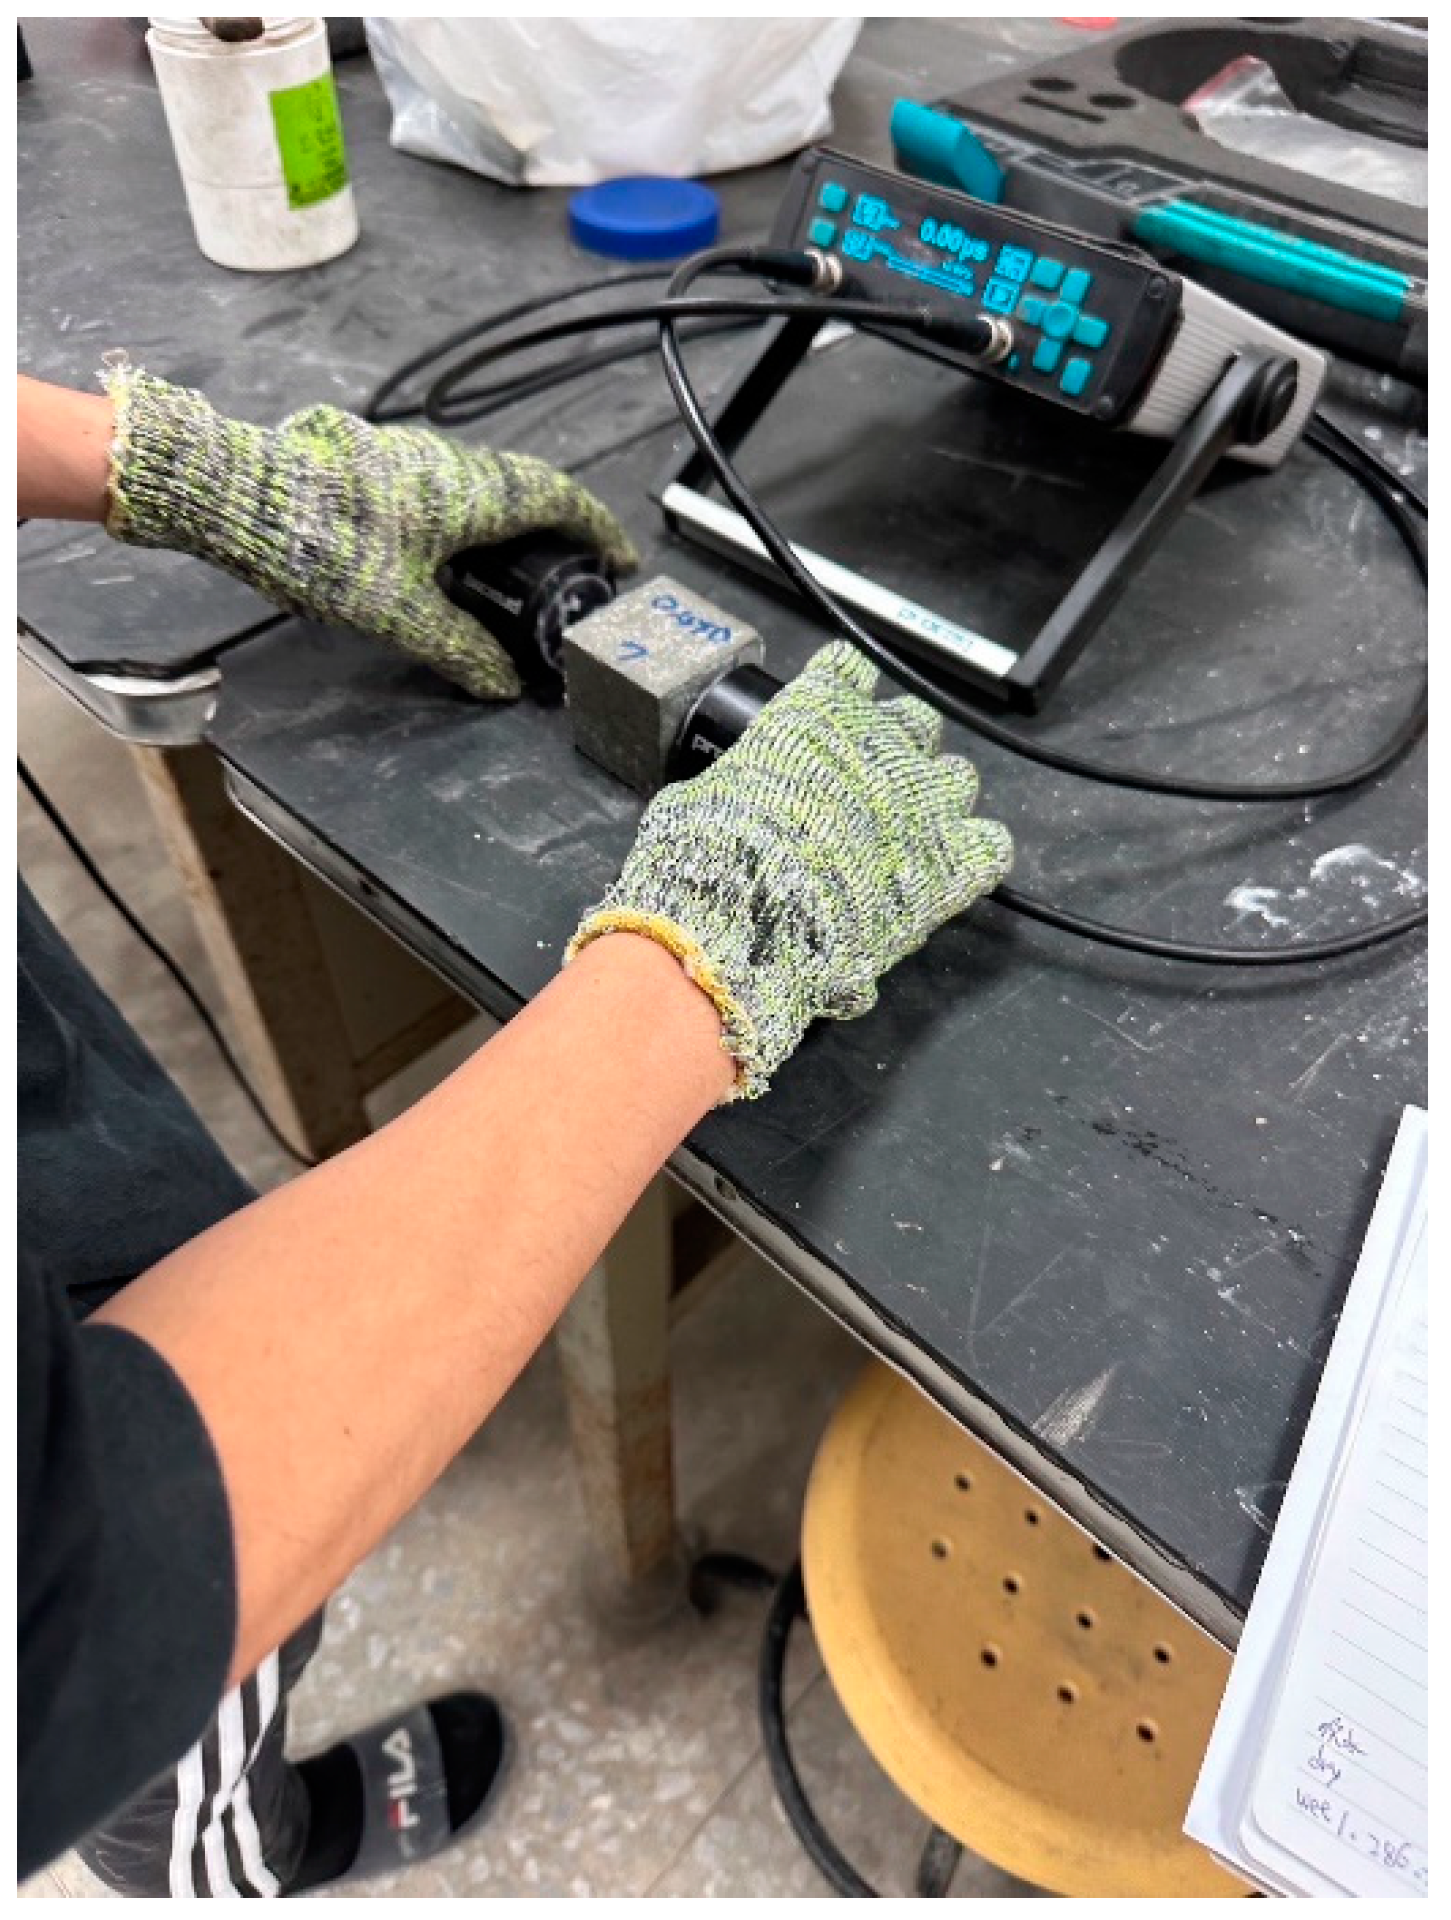
- Ultrasonic pulse velocity: The ultrasonic detector used complied with the ASTM C597 specifications and was used to measure the velocity of the ultrasonic waves that passed through the interior of the test object. This process measured the time it took for the ultrasound to travel through the specimen. By analyzing the transmission speed of the ultrasound in the different materials, insights into the internal conditions of the specimens could be obtained. Specifically, this test determined the transmission speed of a vibration energy pulse within the concrete component.
- (1)
- Water absorption: according to the ASTM C1585 specification, the specimen was put through the immersion test, and the water absorption was calculated after measuring the dry and saturated mass.
- (2)
- Resistance to sulfate corrosion: referring to the ASTM C1012 specification, the specimen was soaked in sodium sulfate solution, 5 cycles were performed, the weight loss was observed, and the weight loss rate was calculated.
- (3)
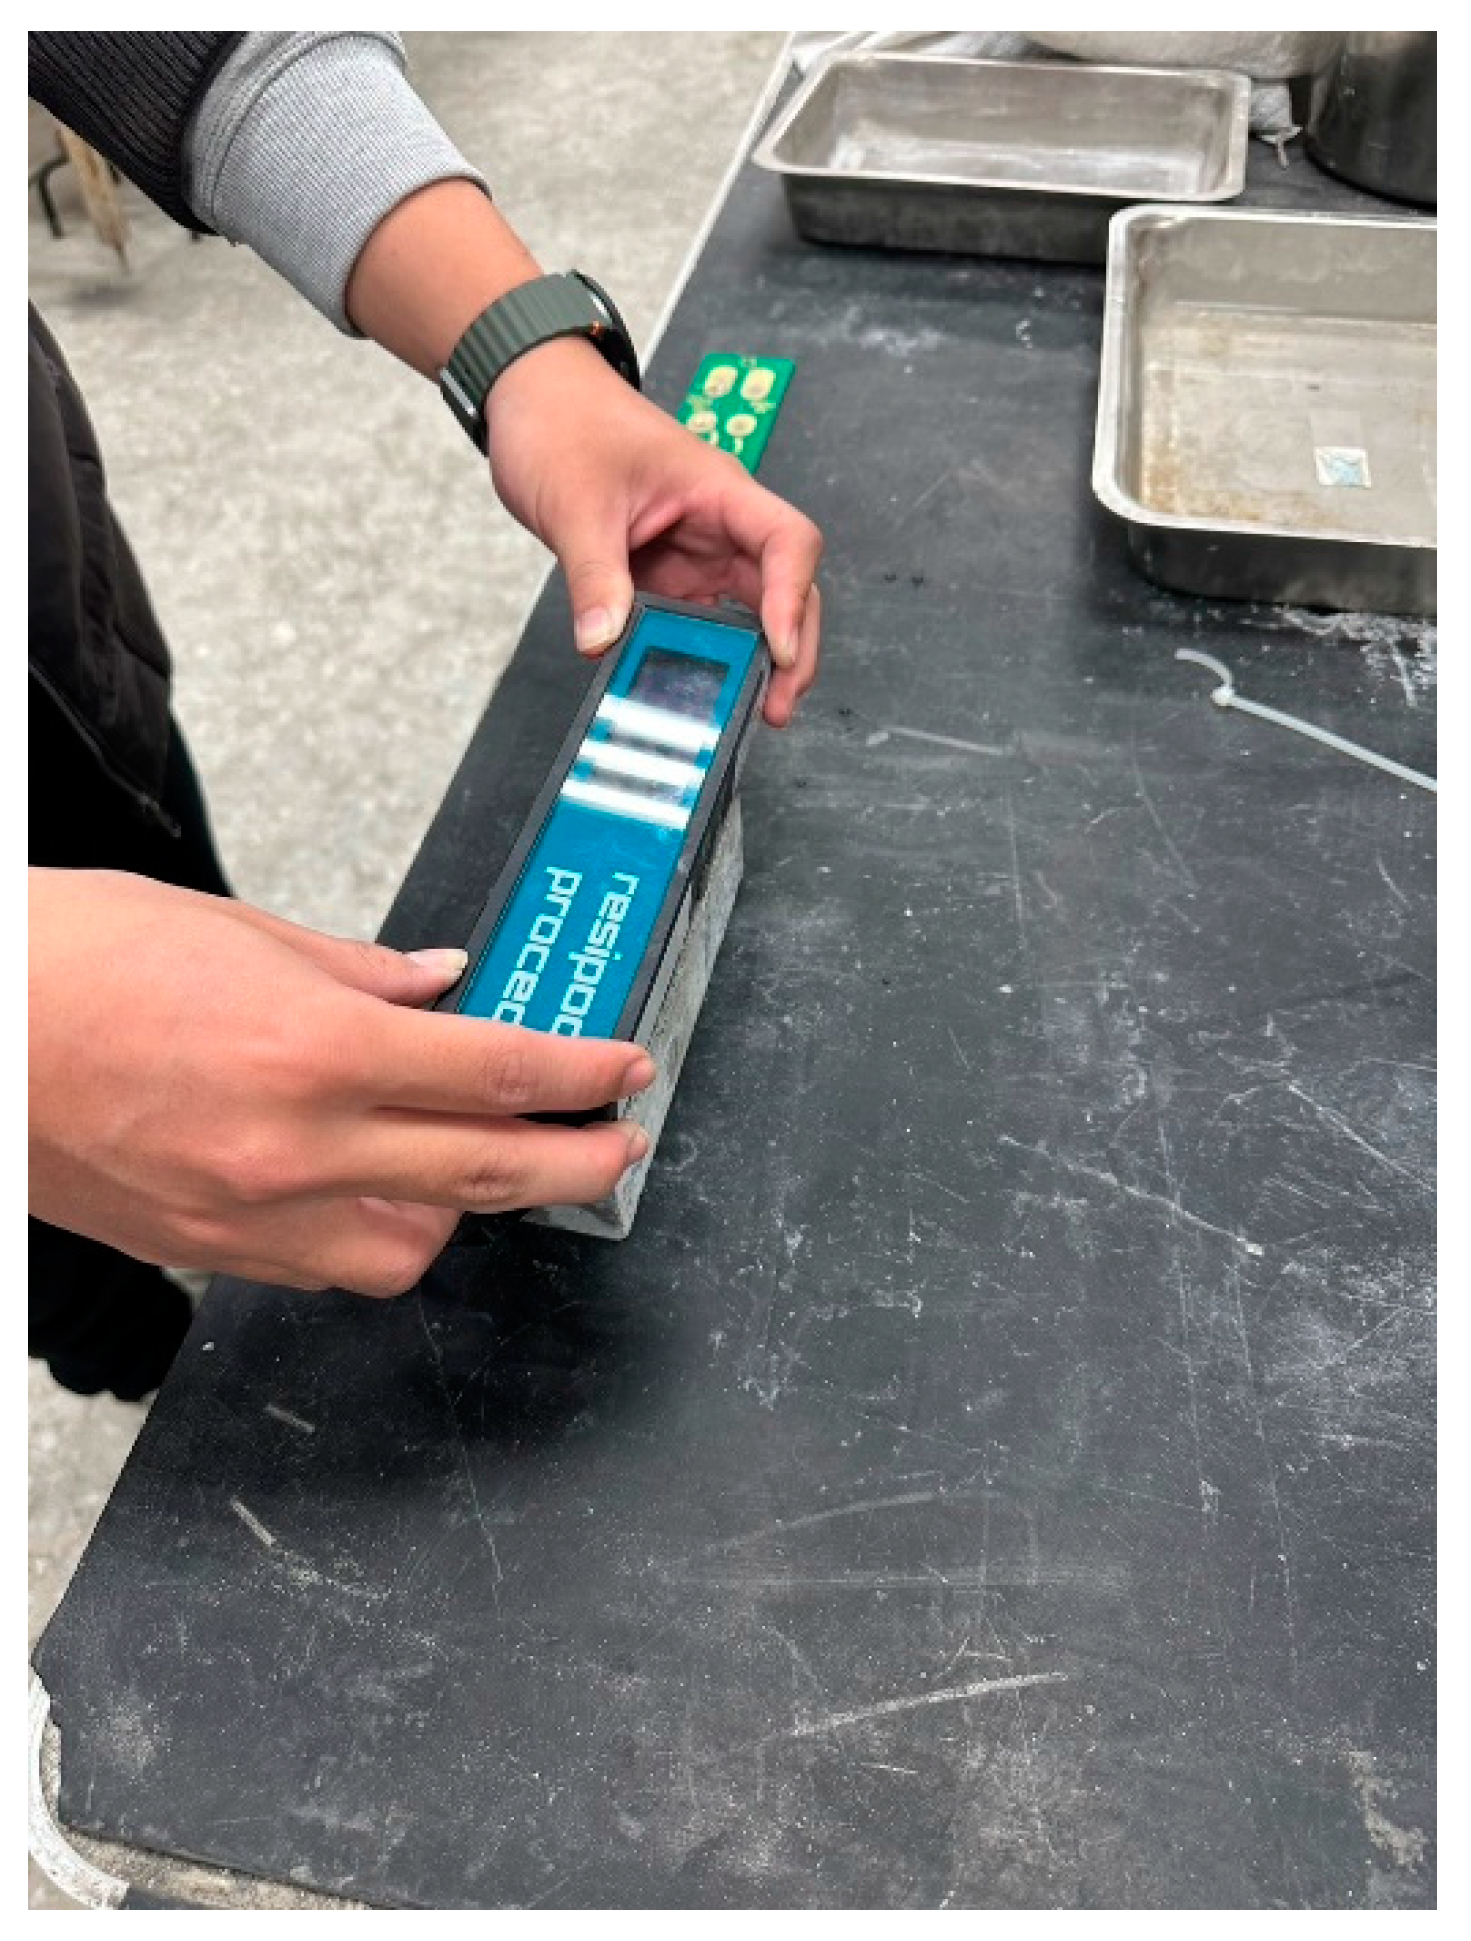
- Resistance: According to the ASTM C876 specification, by measuring the resistance value, when the resistance value was larger, the current flowing through the test object was smaller. The schematic diagram of the resistance testing process is shown in Figure 4.
3. Results and Analysis
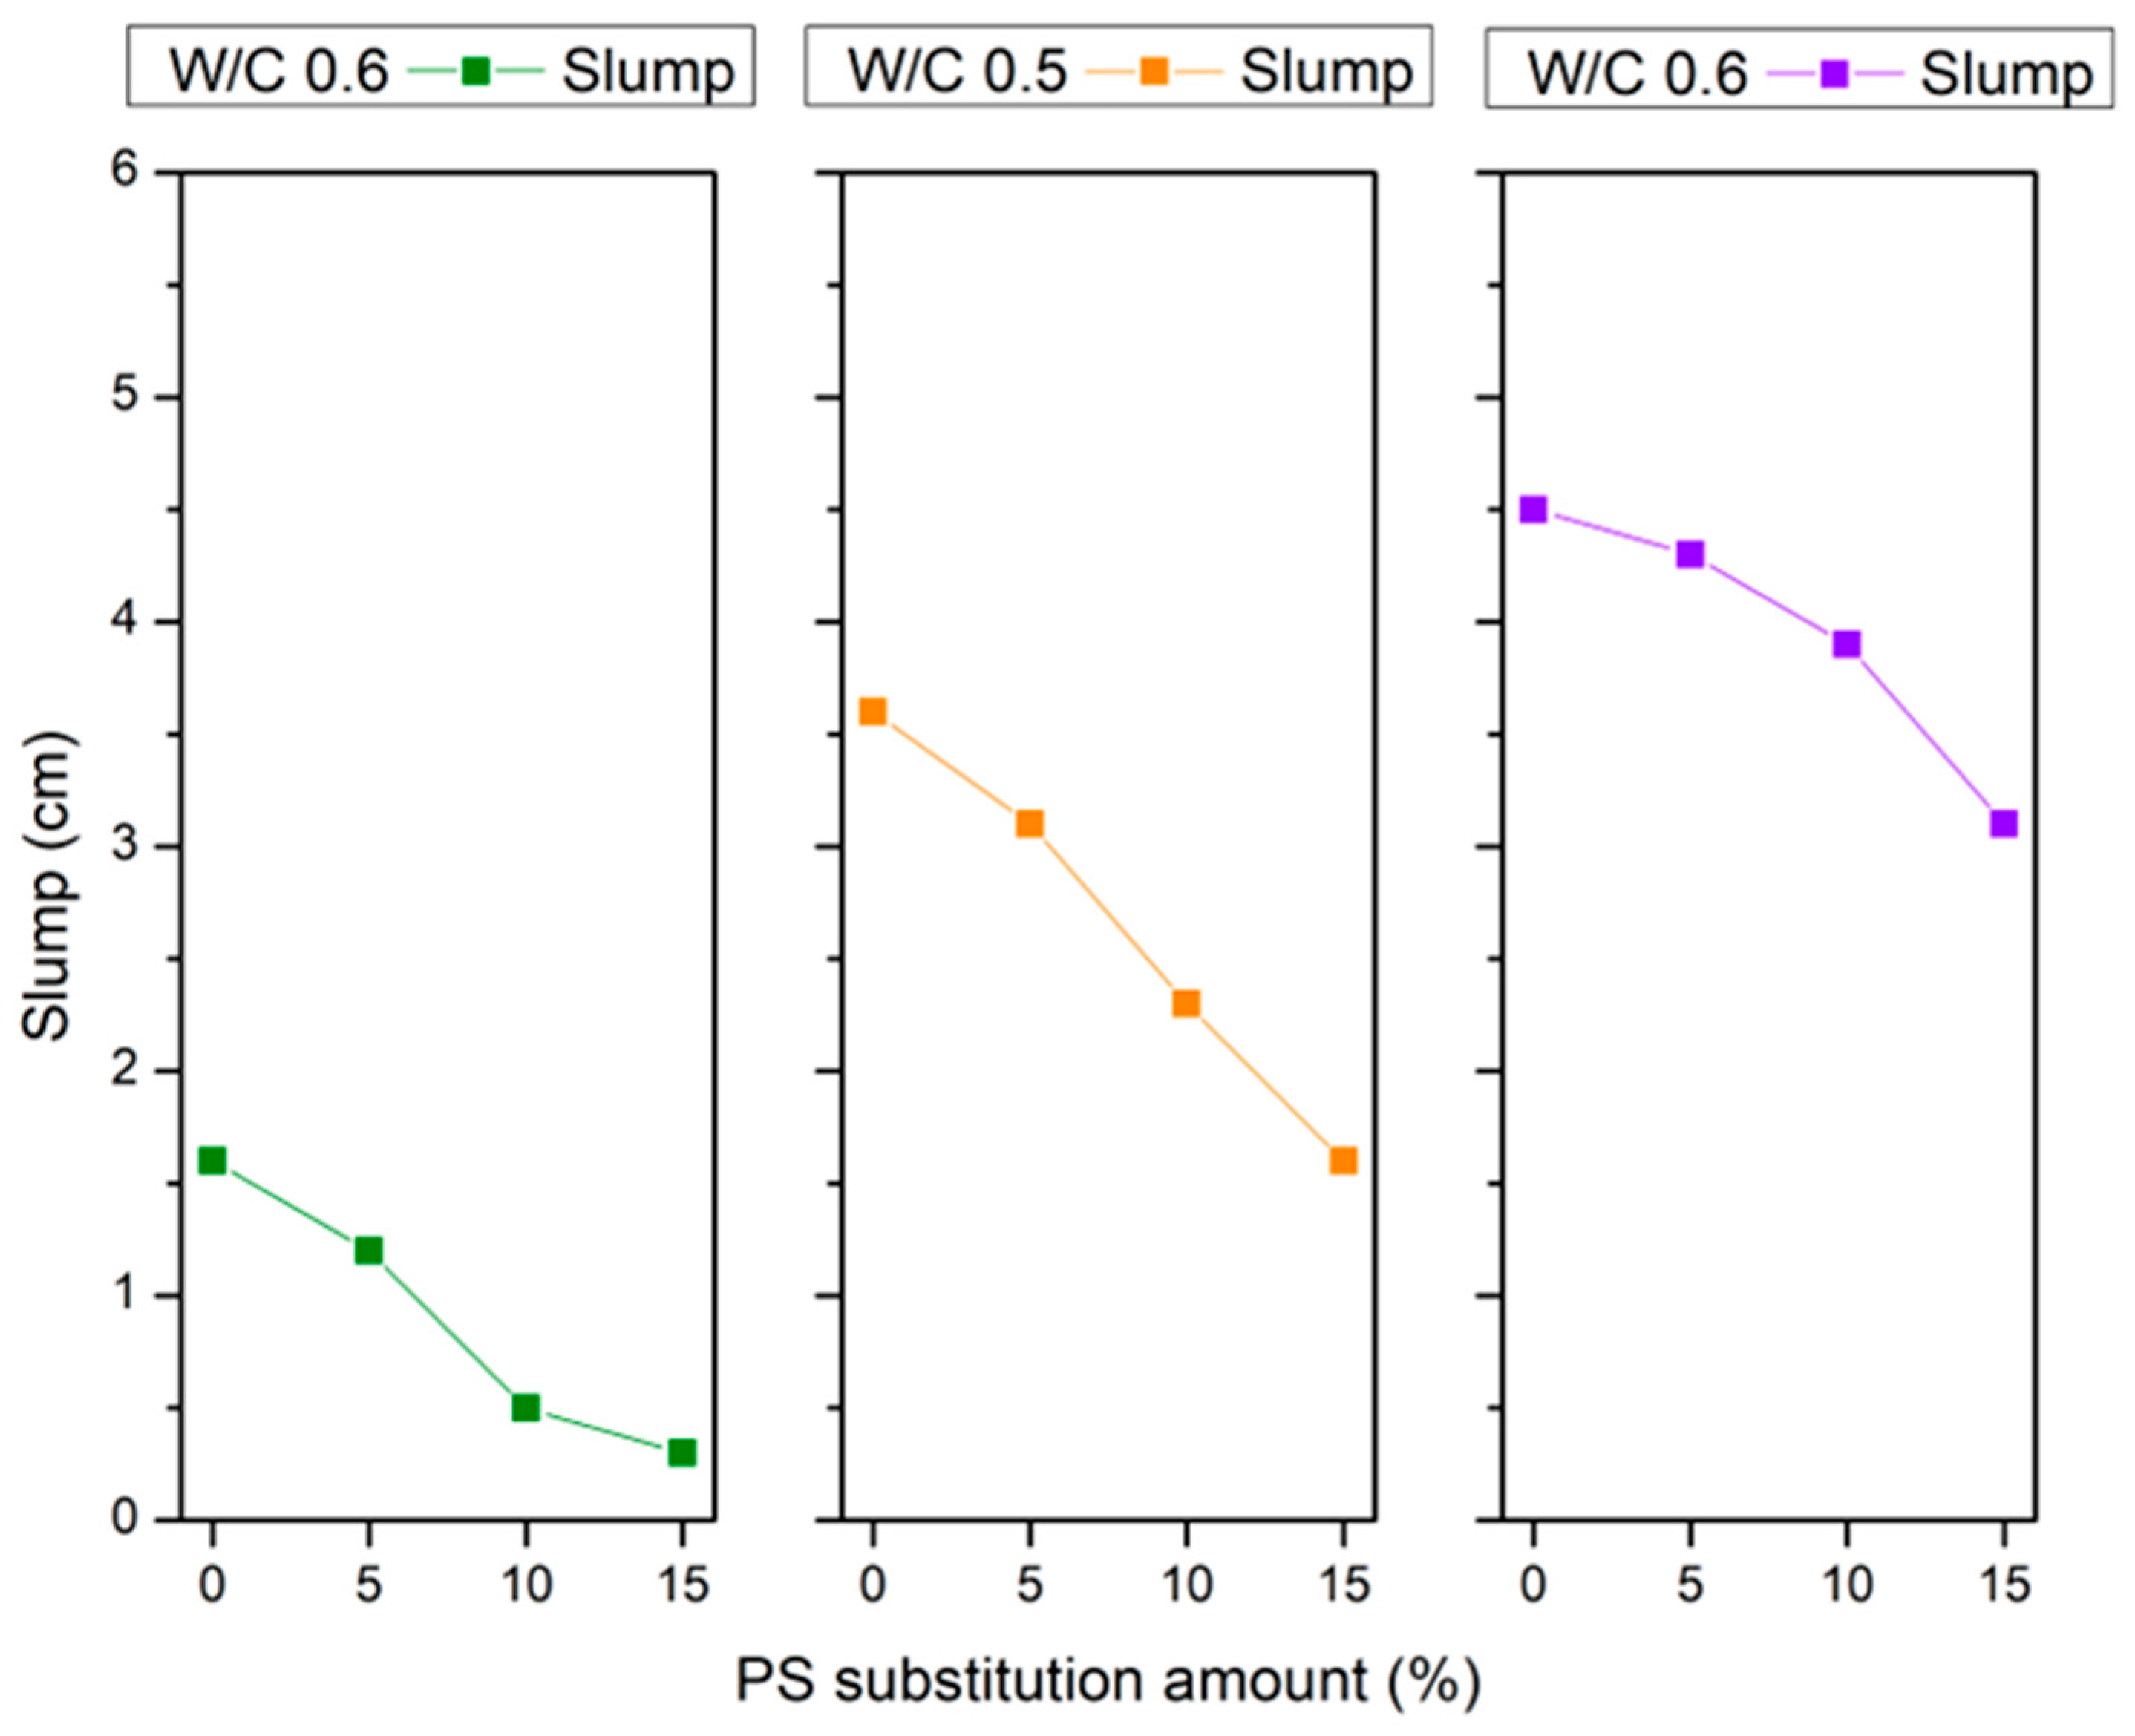
3.1. Slump
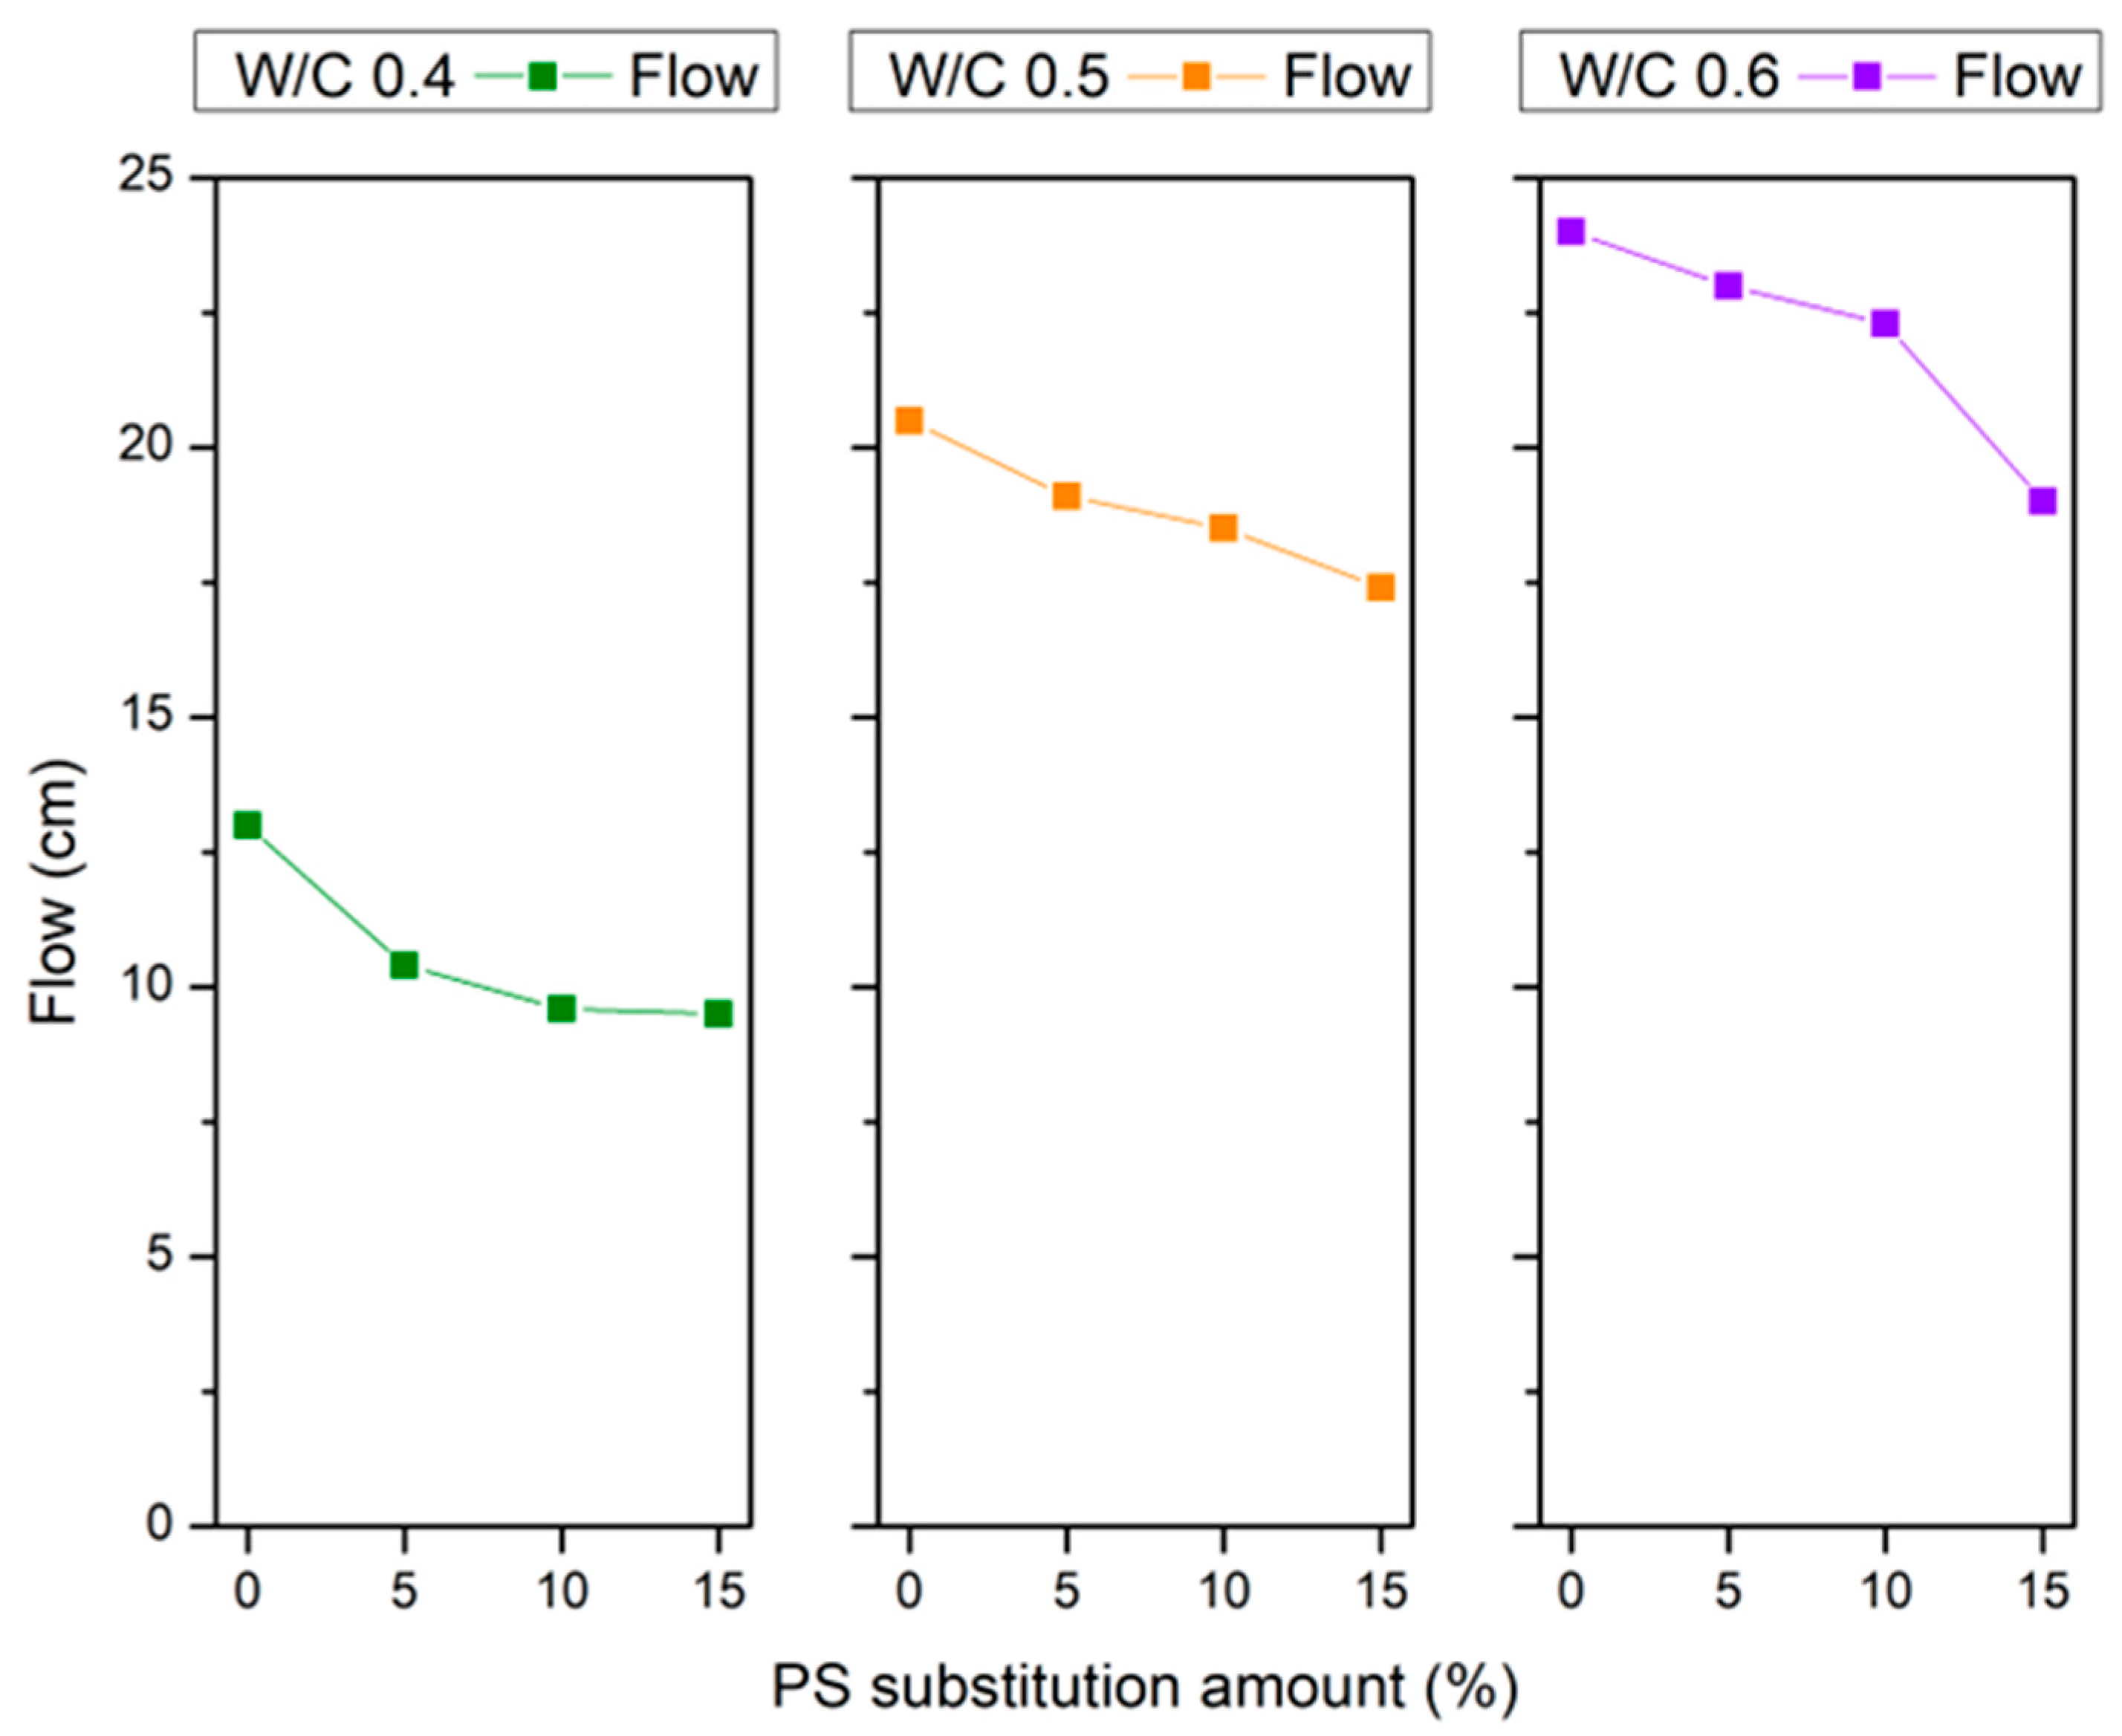
3.2. Slump Flow
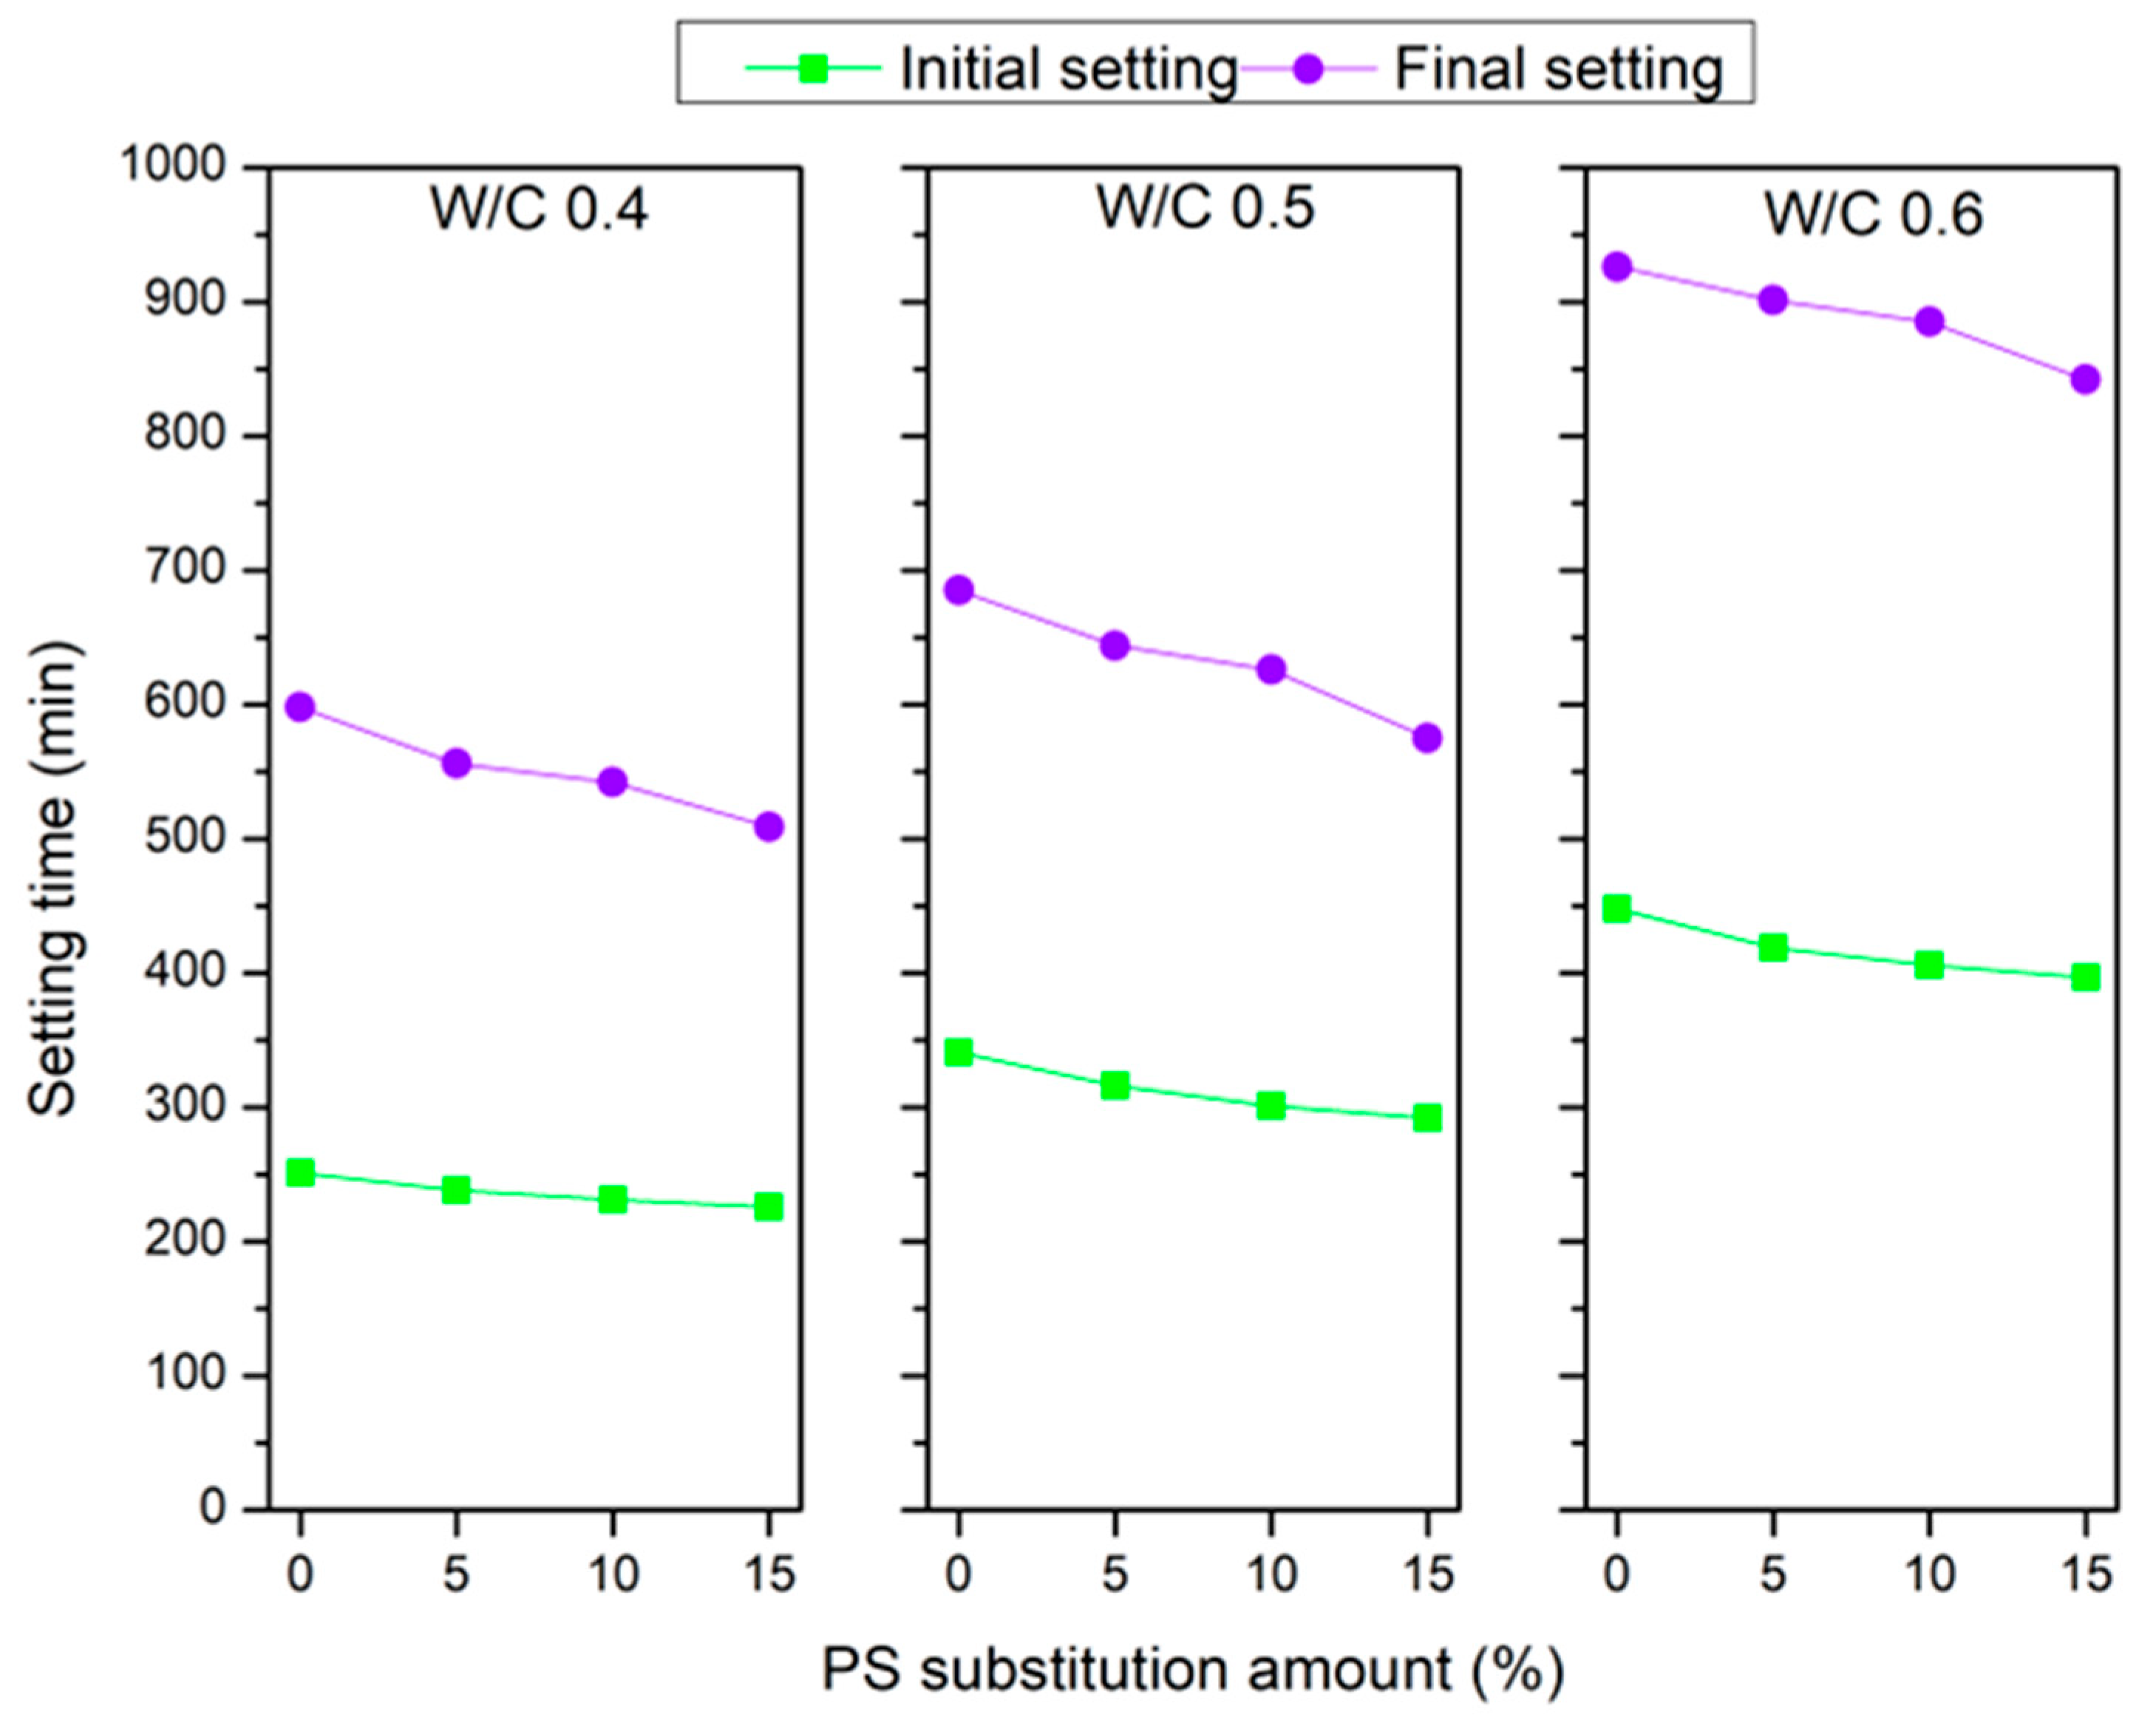
3.3. Setting Time
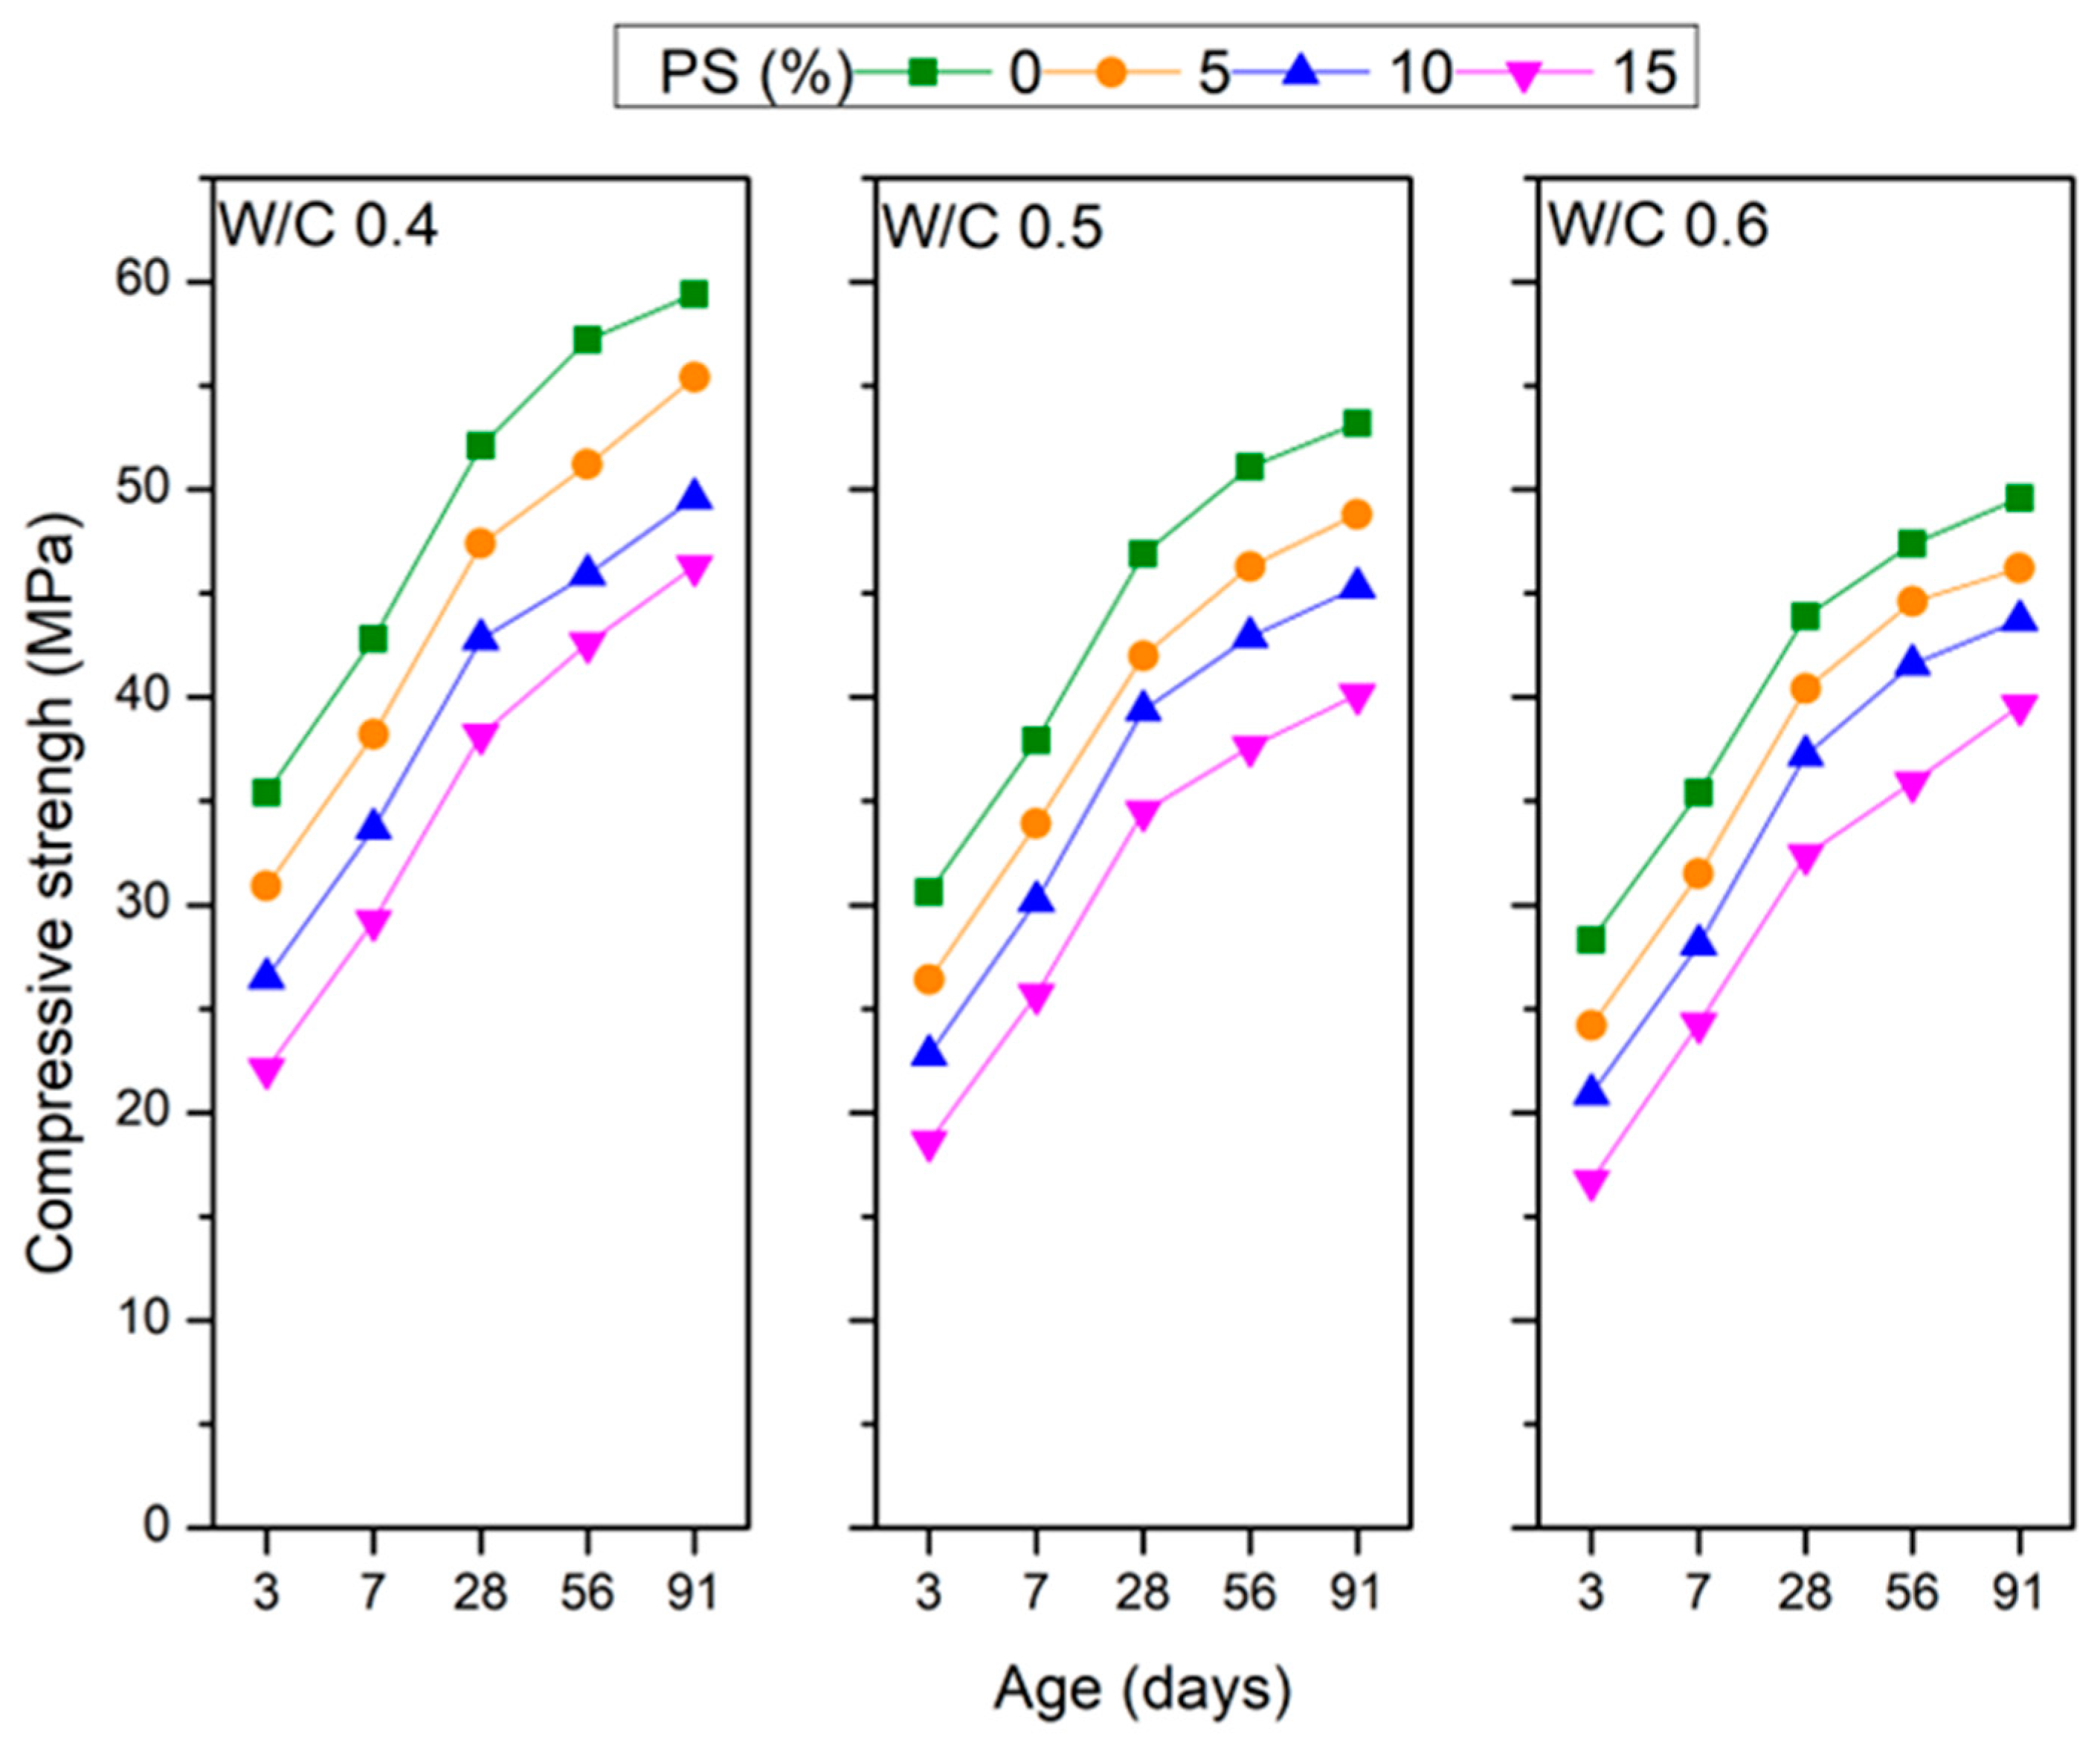
3.4. Compressive Strength
3.5. Flexural Strength
3.6. Ultrasonic Pulse Velocity
3.7. Water Absorption Rate
3.8. Resistance to Sulfate Attack
3.9. Surface Resistivity
3.10. SEM Analysis
4. Conclusions
- The slump and slump flow of the cement mortar made by replacing sand with the TPSW decreased as the amount of TPSW added increased. Since the TPSW was less smooth than natural sand, the slump and slump flow were reduced. When the W/C increased, the slump and slump flow increased due to the increase in the water content. When the setting time was prolonged, the W/C ratio had a greater impact than the substitution amount.
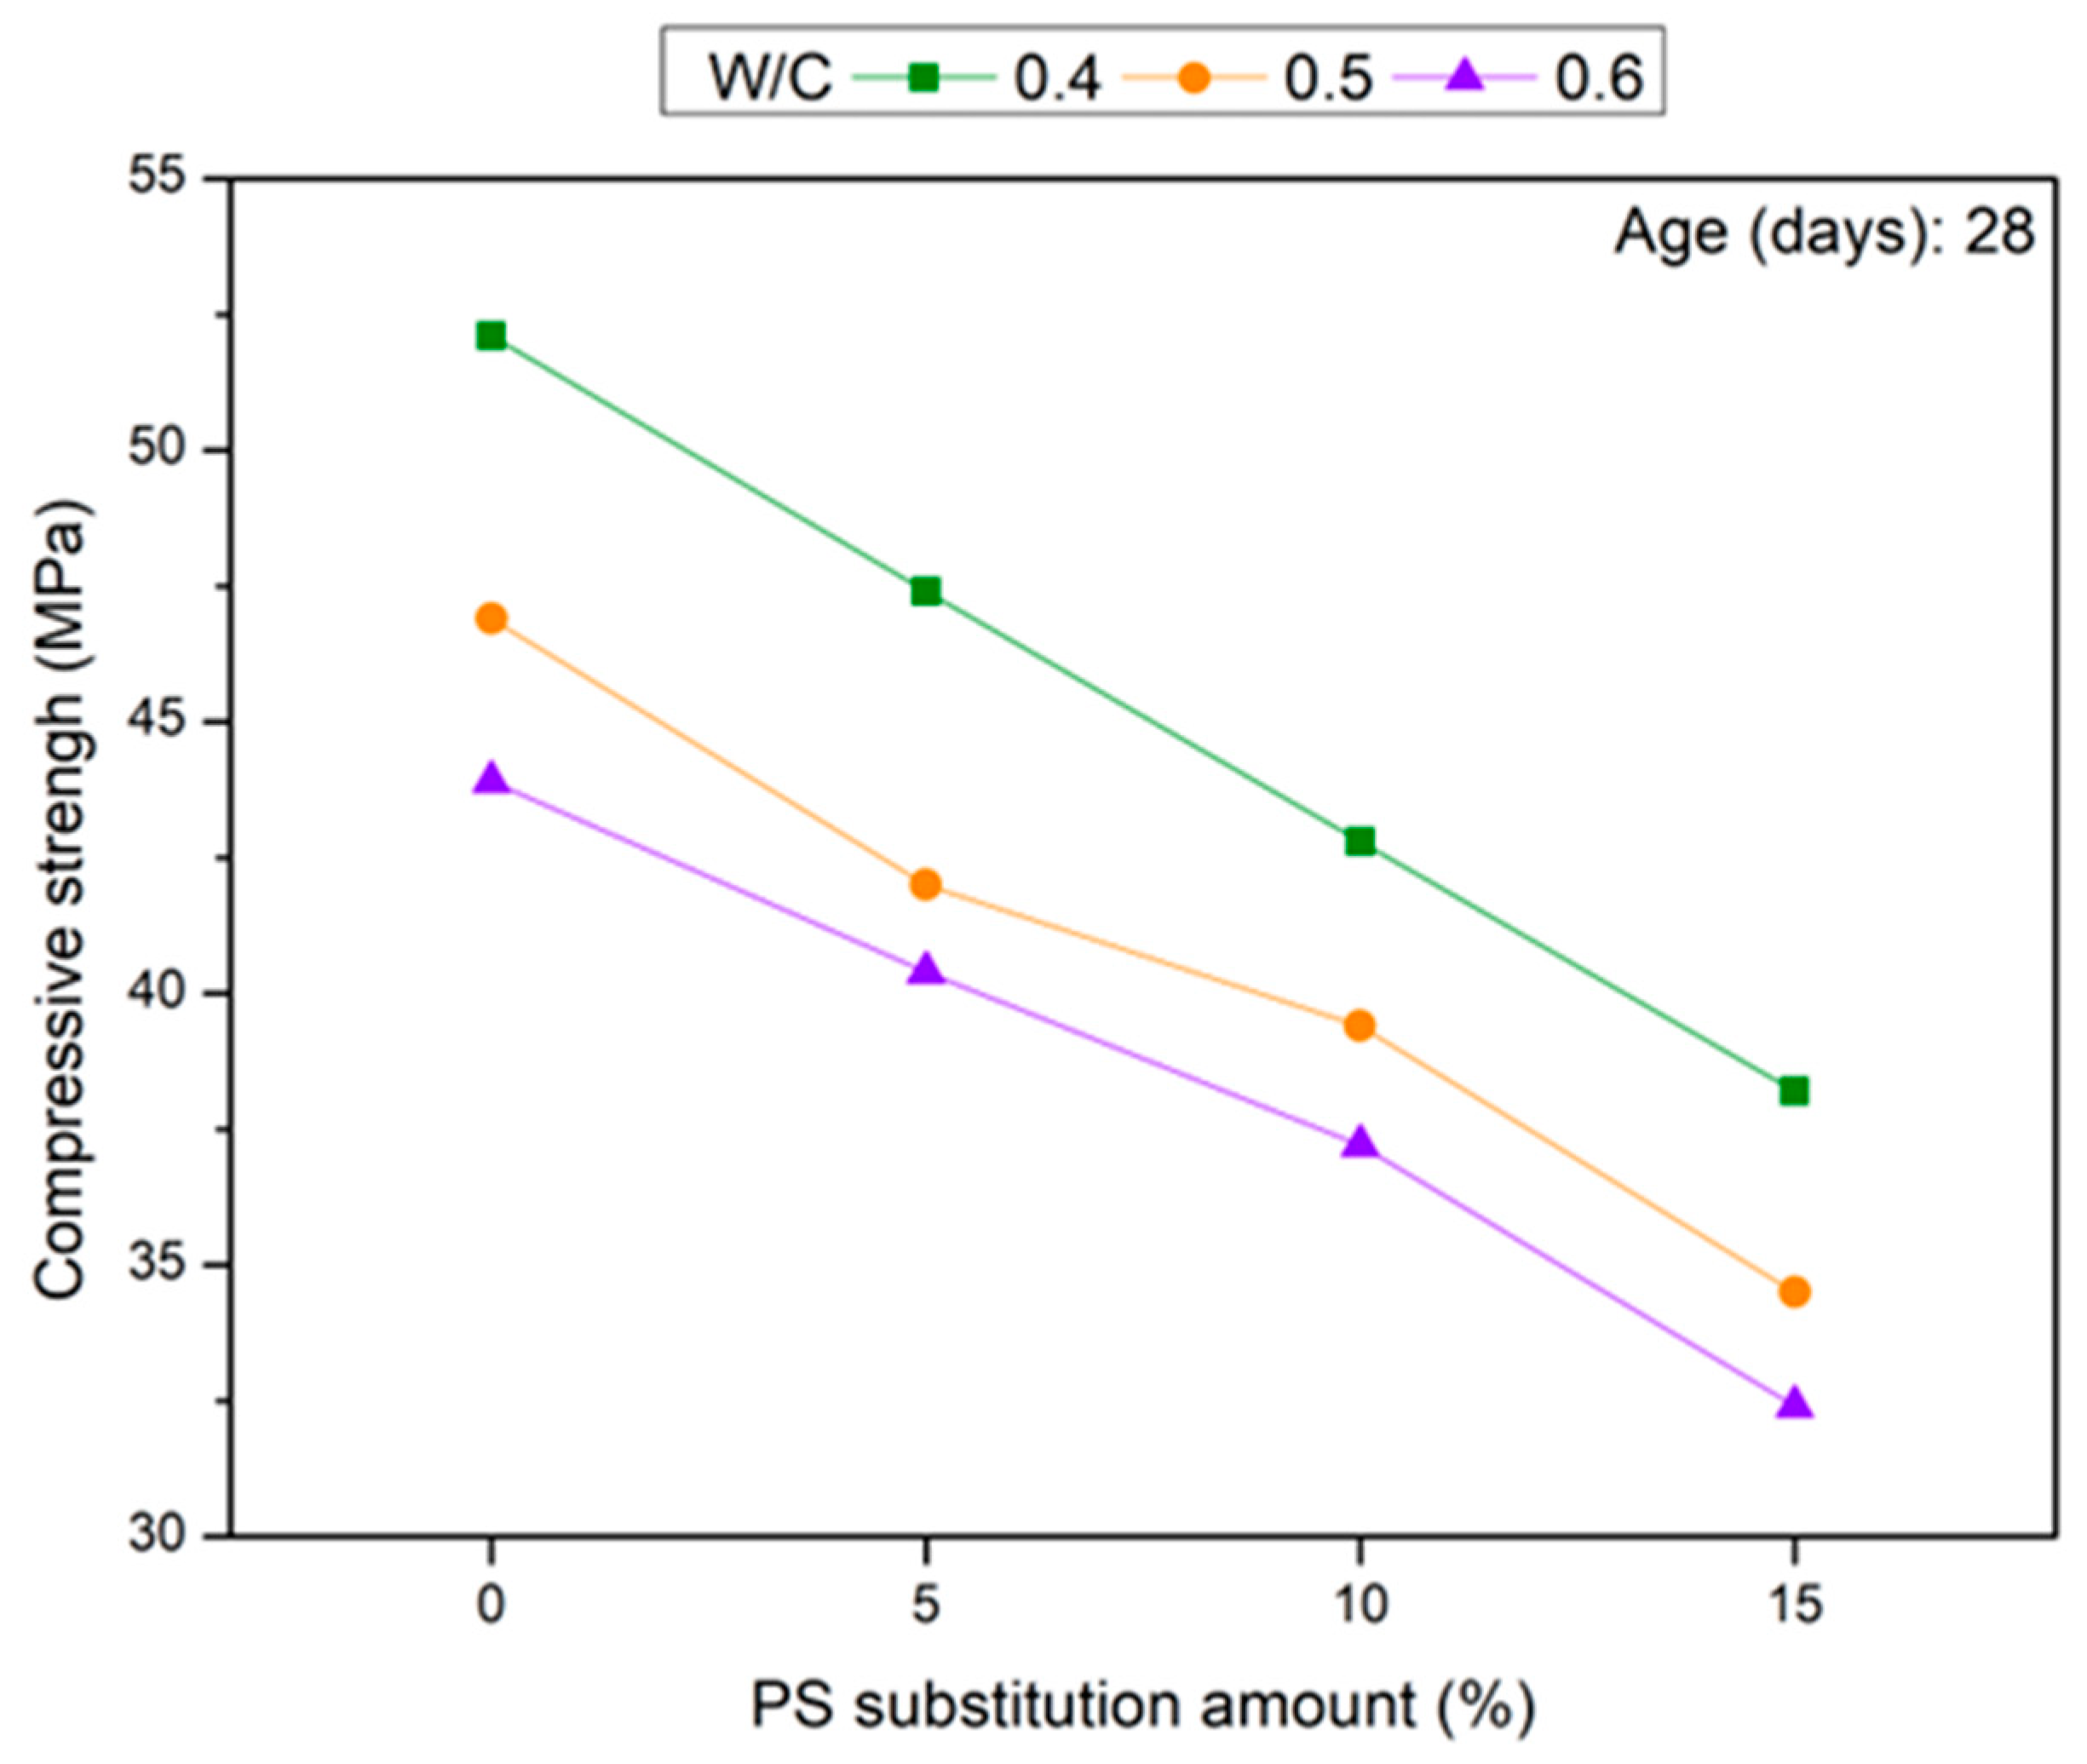
- The compressive strength decreased as the amount of TPSW substitution increased because the waste PS was less water-absorbent than natural sand during mixing, which resulted in more water molecules. The cementing ability was degraded and pores were formed. A W/C of 0.5 and a TPSW substitution amount of 5% could effectively achieve the economic benefits of waste recycling.
- As the amount of TPSW added increased, the flexural strength decreased. When the W/C was 0.5 and at the age of 91 days, the strength was reduced by 9.4% when the substitution amount was 5%. When the substitution amount exceeded 10%, the strength was reduced by more than 10%, showing that a W/C of 0.5 and a TPSW substitution amount of 5% were the most effective at removing waste for waste recycling.
- Since the ultrasonic pulse velocity depends on the internal density of the specimen, when the W/C was 0.4 and the TPSW substitution amount was 5% at the age of 56 days, the ultrasonic pulse velocity was greater than 4500 m/s, indicating that the specimen quality was good. As the substitution amount and W/C increased, pores were formed inside, so the ultrasonic pulse velocity decreased. The velocity increased with age.
- As the W/C and the waste PS substitution amount increased, the number of pores in the specimen increased, and the number of internal pores increased; at later ages, the water absorption distinctly decreased. The water absorption had a relative relationship with the ultrasound and strength. The higher the ultrasonic pulse velocity was, the denser the specimen, the lower the water absorption, and the greater the strength.
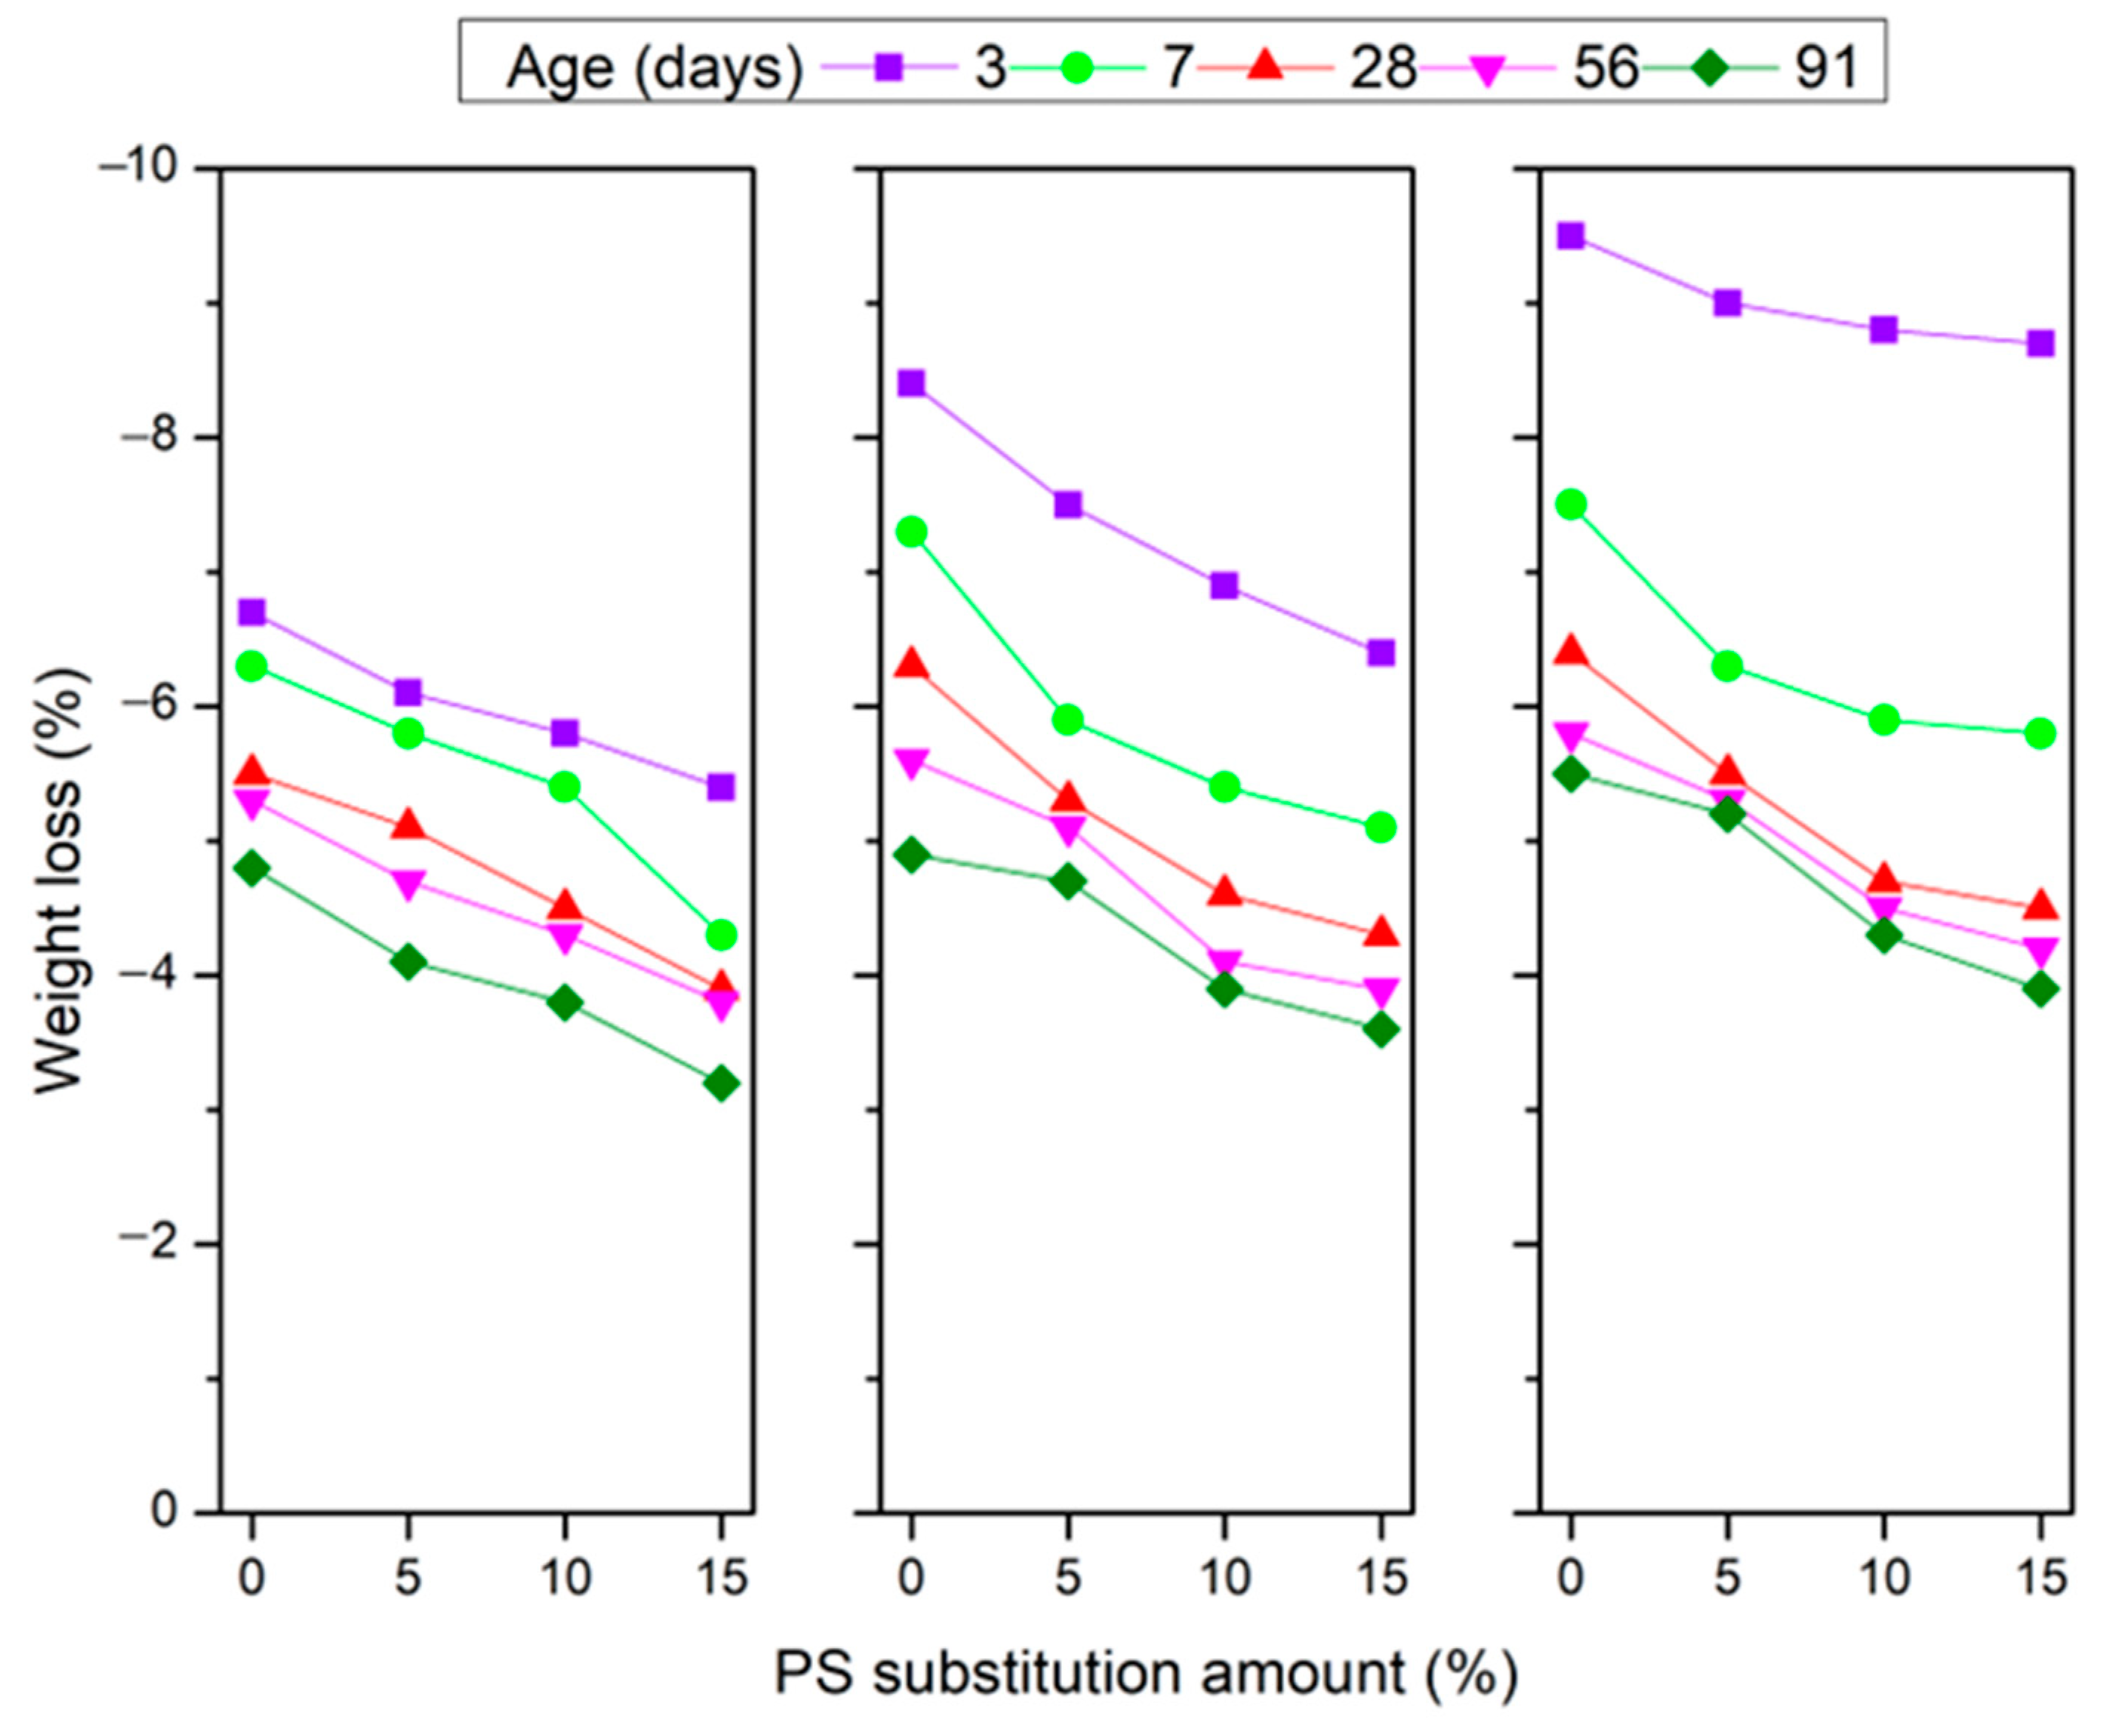
- The weight loss results for the cement mortar show that the W/C ratio had a greater impact than the substitution amount. The weight loss increased with the W/C. As the substitution amount increased and as the sulfate resistance of the TPSW became greater than that of the natural sand, the weight loss tended to decrease. The weight loss was greater at an early age. The hydration was relatively complete at late ages, so the weight loss of the specimen tended to decrease.
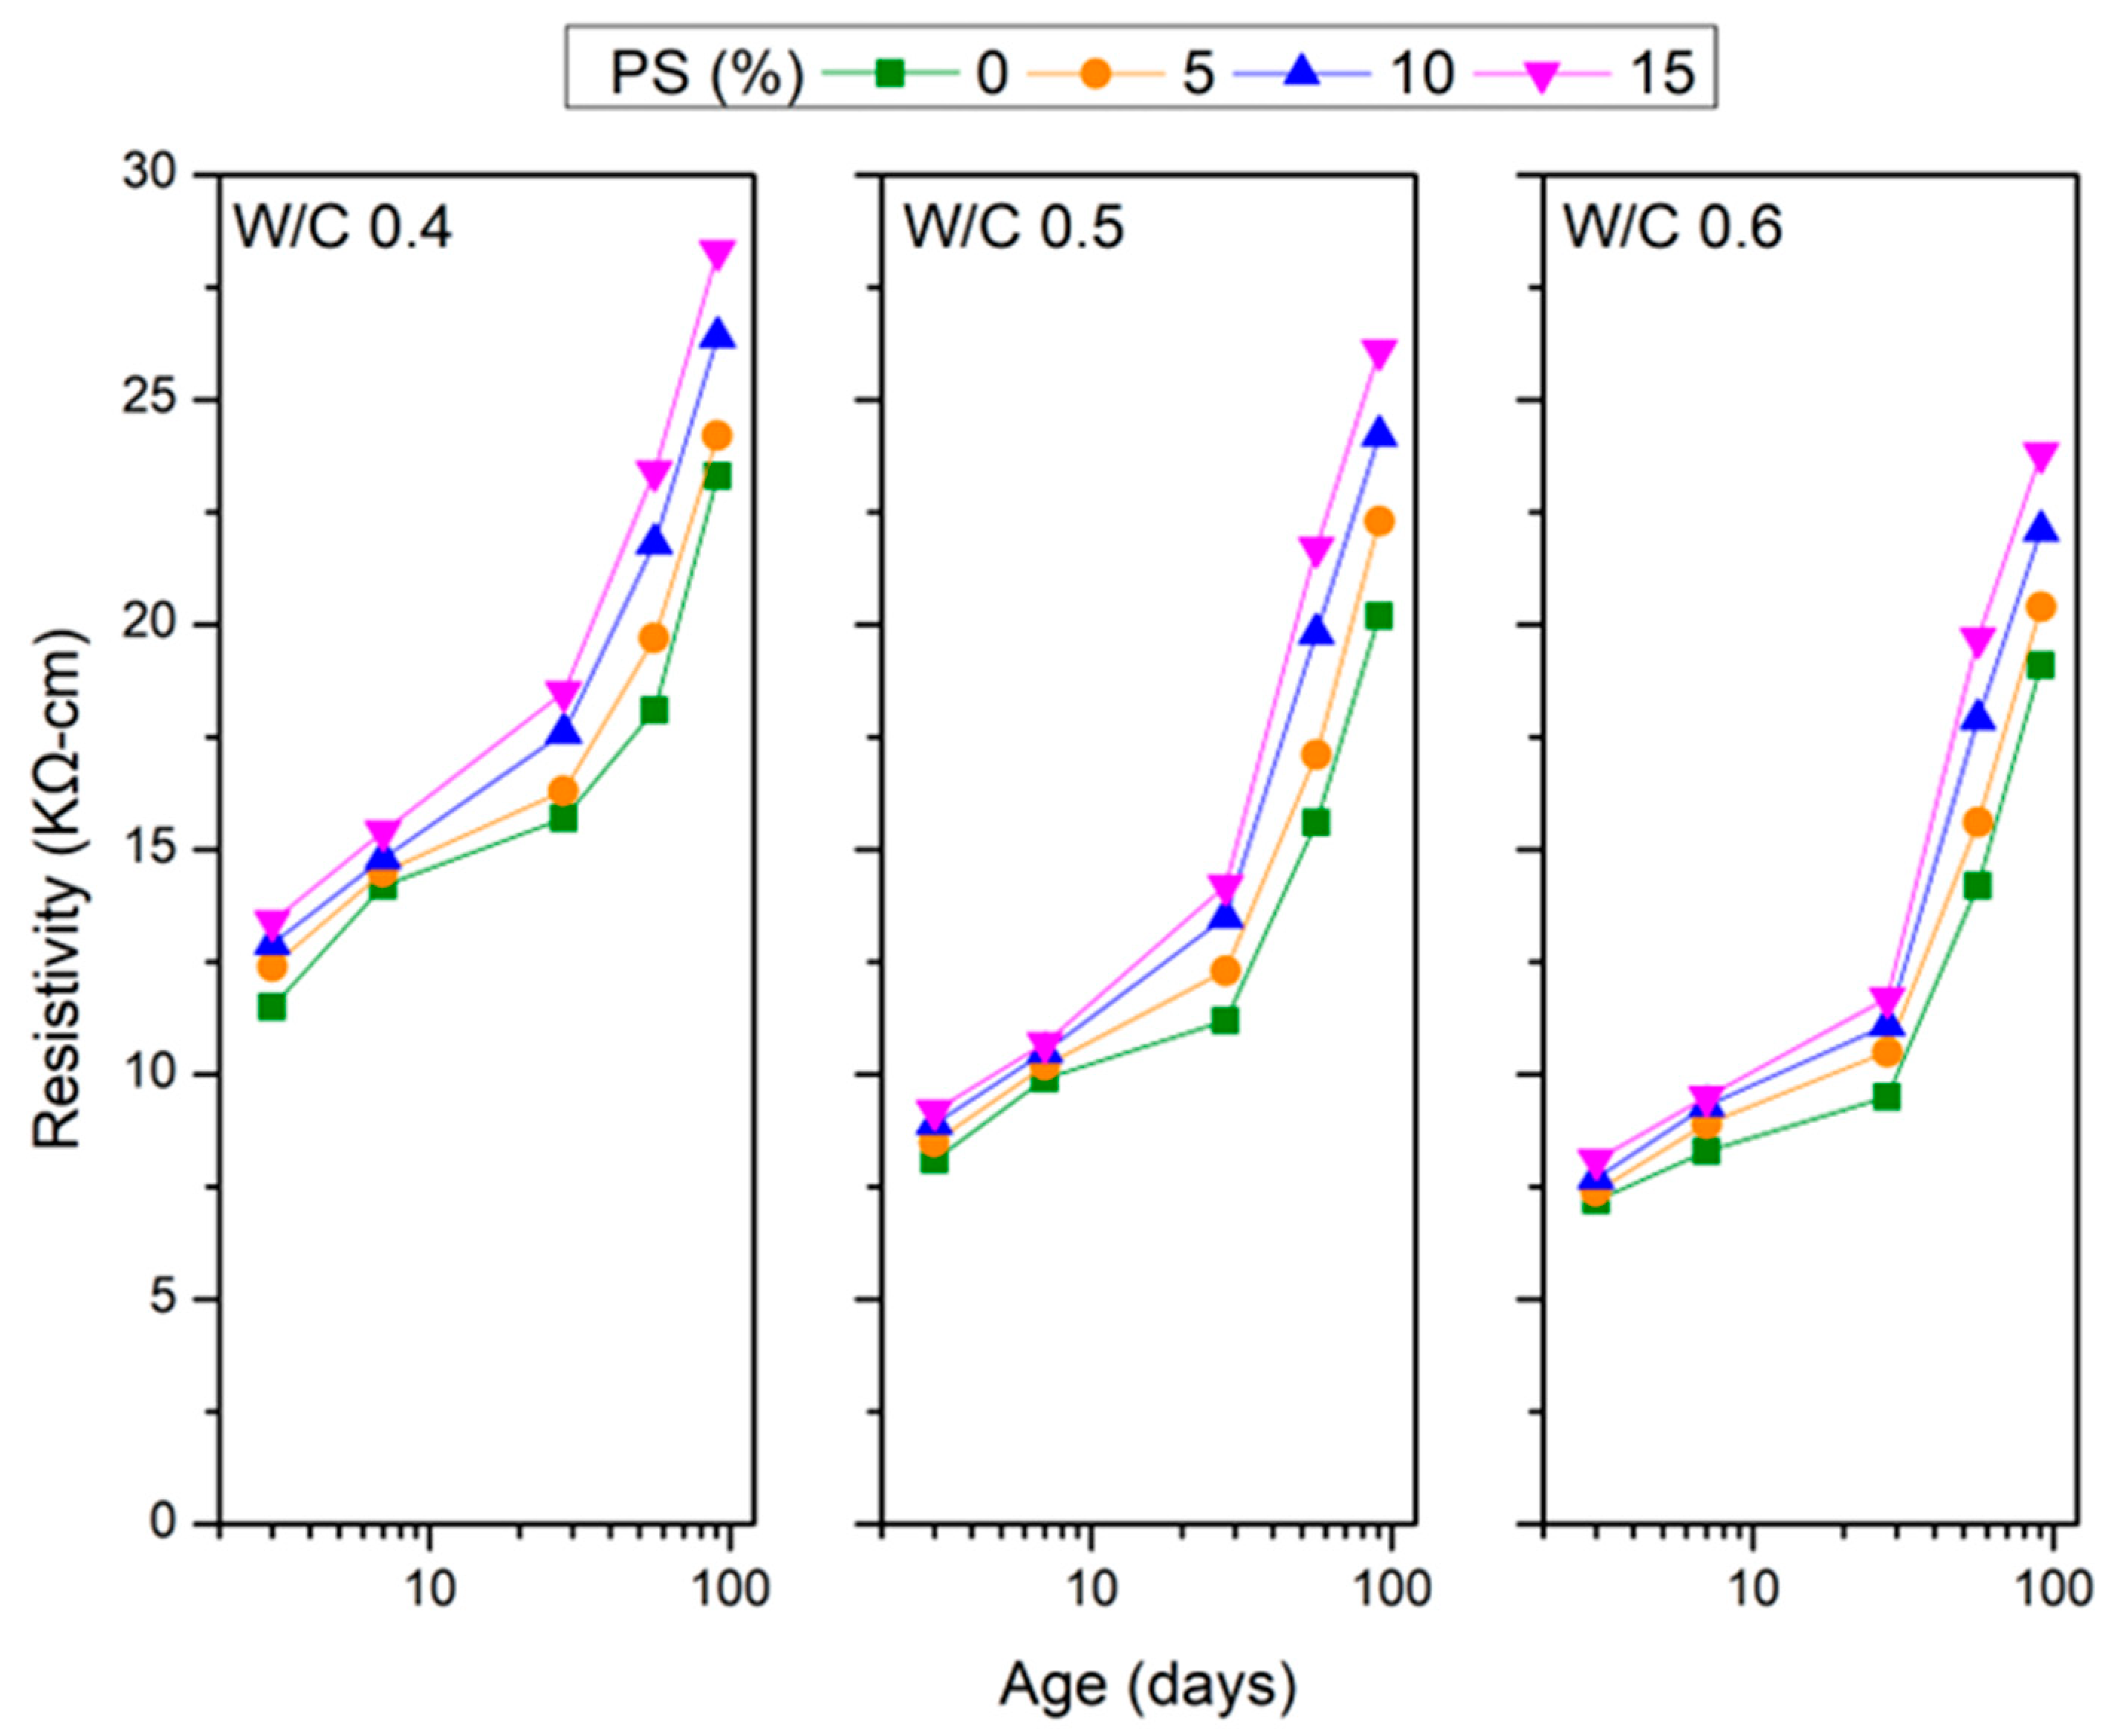
- The resistivity decreased as the W/C increased. Since the TPSW had a higher resistivity than natural sand, the resistivity increased with the substitution amount and age.
Author Contributions
Funding
Institutional Review Board Statement
Informed Consent Statement
Data Availability Statement
Conflicts of Interest
References
- Wang, P.-K.; Lin, J.-Y.; Yang, C.-P.; Cheng, T.-M. The Island Habitat: Environmental Survey Report of Taiwan. Rhythms Monthly; Tzu Chi Culture & Communication Foundation: Taipei, Taiwan, 2007. [Google Scholar]
- Wen, F.-L. Study on Engineering Properties of Cement Mortar with Adding and Cement Replacement by PE and GGBFS. Master’s Thesis, National Kaohsiung University of Science and Technology, Kaohsiung, Taiwan, 2022. [Google Scholar]
- Rasmussen, S.C. From parkesine to celluloid: The birth of organic plastics. Angew. Chem. 2021, 133, 8090–8094. [Google Scholar] [CrossRef]
- Revathi, S.; Suresh, D.; Anwar, S.T. Behavior of concrete with PET bottles as fibers & silica fume as partial replacement of cement. Mater. Today Proc. 2023. [Google Scholar] [CrossRef]
- Jassim, A.K. Recycling of polyethylene waste to produce plastic cement. Procedia Manuf. 2017, 8, 635–642. [Google Scholar] [CrossRef]
- Lin, J.-W. Study on Engineering Properties of Cement Mortar with Adding Abandoned PE. Master’s Thesis, National Kaohsiung University of Science and Technology, Kaohsiung, Taiwan, 2022. [Google Scholar]
- El-Seidy, E.; Chougan, M.; Sambucci, M.; Al-Kheetan, M.J.; Valente, M.; Ghaffar, S.H. Lightweight alkali-activated materials and ordinary Portland cement composites using recycled polyvinyl chloride and waste glass aggregates to fully replace natural sand. Constr. Build. Mater. 2023, 368, 130399. [Google Scholar] [CrossRef]
- Małek, M.; Jackowski, M.; Łasica, W.; Kadela, M. Characteristics of recycled polypropylene fibers as an addition to concrete fabrication based on Portland cement. Materials 2020, 13, 1827. [Google Scholar] [CrossRef]
- Gregorova, V.; Ledererova, M.; Stefunkova, Z. Investigation of influence of recycled plastics from cable, ethylene vinyl acetate and polystyrene waste on lightweight concrete properties. Procedia Eng. 2017, 195, 127–133. [Google Scholar] [CrossRef]
- Olofinnade, O.; Chandra, S.; Chakraborty, P. Recycling of high impact polystyrene and low-density polyethylene plastic wastes in lightweight based concrete for sustainable construction. Mater. Today Proc. 2021, 38, 2151–2156. [Google Scholar] [CrossRef]
- Akinyemi, B.A.; Ojediran, J.; Olawale, O.; Ayanwola, S. Efficacy of expanded polystyrene as fine aggregate in cement mortars modified with latex paint as an alternative to polymer admixture. J. Mech. Behav. Mater. 2020, 29, 163–168. [Google Scholar] [CrossRef]
- Al-Mansour, A.; Chen, S.; Xu, C.; Peng, Y.; Wang, J.; Ruan, S.; Zeng, Q. Sustainable cement mortar with recycled plastics enabled by the matrix-aggregate compatibility improvement. Constr. Build. Mater. 2022, 318, 125994. [Google Scholar] [CrossRef]
- Ohemeng, E.A.; Ekolu, S.O. Strength prediction model for cement mortar made with waste LDPE plastic as fine aggregate. J. Sustain. Cem.-Based Mater. 2019, 8, 228–243. [Google Scholar] [CrossRef]
- Hung, C.-C.; Chang, J.-N.; Wang, H.-Y.; Wen, F.-L. Effect of adding waste polyethylene and GGBFS on the engineering properties of cement mortar. Appl. Sci. 2022, 12, 12665. [Google Scholar] [CrossRef]
- Lin, K.-T.; Hung, C.-C.; Wang, H.-Y.; Wen, F.-L. Polyethylene (PE) Waste Minimization Study of Cement Mortar with Adding PE Content under Different W/B Ratios. Buildings 2022, 12, 2117. [Google Scholar] [CrossRef]
- Doughmi, K.; Baba, K.; Nounah, A. Mechanical properties of eco-friendly cement based composite mortars plastic fiber reinforced partially replaced by natural pozzolan and marble waste. Mater. Today Proc. 2023, in press. [Google Scholar] [CrossRef]
- Ferrándiz-Mas, V.; García-Alcocel, E. Durability of expanded polystyrene mortars. Constr. Build. Mater. 2013, 46, 175–182. [Google Scholar] [CrossRef]
- Ferrándiz-Mas, V.; Sarabia, L.A.; Ortiz, M.C.; Cheeseman, C.R.; García-Alcocel, E. Design of bespoke lightweight cement mortars containing waste expanded polystyrene by experimental statistical methods. Mater. Des. 2016, 89, 901–912. [Google Scholar] [CrossRef]
- Koksal, F.; Mutluay, E.; Gencel, O. Characteristics of isolation mortars produced with expanded vermiculite and waste expanded polystyrene. Constr. Build. Mater. 2020, 236, 117789. [Google Scholar] [CrossRef]
- Petrella, A.; Di Mundo, R.; Notarnicola, M. Recycled expanded polystyrene as lightweight aggregate for environmentally sustainable cement conglomerates. Materials 2020, 13, 988. [Google Scholar] [CrossRef]
- Maaroufi, M.; Belarbi, R.; Abahri, K.; Benmahiddine, F. Full characterization of hygrothermal, mechanical and morphological properties of a recycled expanded polystyrene-based mortar. Constr. Build. Mater. 2021, 301, 124310. [Google Scholar] [CrossRef]
- Qin, Y.; Dong, L.; Lu, H.; Zhan, L.; Xu, Z. Debromination process of Br-containing PS of E-wastes and reuse with virgin PS. J. Hazard. Mater. 2022, 431, 128526. [Google Scholar] [CrossRef]
- Chen, J.H. Study on Engineering Properties of Ready-Mixed Soil Material with Applied of Recycled Materials. Master’s Thesis, National Kaohsiung University of Applied Sciences, Kaohsiung, Taiwan, 2012. [Google Scholar]
- Jhou, J.-W. Investigating the Properties of Lightweight Concrete Containing High Contents of Recycled Green Building Materials. Master’s Thesis, National Kaohsiung University of Applied Sciences, Kaohsiung, Taiwan, 2013. [Google Scholar]
- Chang, S.-C. A Study of Engineering Properties and Prediction Models Development for Cement Mortar added with Recycled Materials and Piezoelectric Powders. Master’s Thesis, National Kaohsiung University of Applied Sciences, Kaohsiung, Taiwan, 2016. [Google Scholar]
- Ay, H.; Wang, H.-Y.; Huan, C.-F.; Lin, X.-H. The application of energy-saving and carbon-reducing materials in public engineering projects. In Energy-Saving and Carbon Reduction Training and Promotion; Kaohsiung, Taiwan, 2011. [Google Scholar]
- Lou, B.; Shen, H.; Liu, B.; Liu, J.; Zhang, S. Recycling secondary aluminum dross to make building materials: A review. Constr. Build. Mater. 2023, 409, 133989. [Google Scholar] [CrossRef]
- John, N.J.; Khan, I.; Patel, A. Evaluation of the crushing characteristics of industrial waste aggregates as construction materials. Constr. Build. Mater. 2023, 403, 133111. [Google Scholar] [CrossRef]
- Deng, J.; Guo, J.; Zhou, X.; Zhou, P.; Fu, X.; Zhang, W.; Lin, K. Hazardous substances in indoor dust emitted from waste TV recycling facility. Environ. Sci. Pollut. Res. 2014, 21, 7656–7667. [Google Scholar] [CrossRef] [PubMed]
- Xiao, S.; Dong, H.; Geng, Y.; Brander, M. An overview of China’s recyclable waste recycling and recommendations for integrated solutions. Resour. Conserv. Recycl. 2018, 134, 112–120. [Google Scholar] [CrossRef]
- Matsuto, T.; Jung, C.H.; Tanaka, N. Material and heavy metal balance in a recycling facility for home electrical appliances. Waste Manag. 2004, 24, 425–436. [Google Scholar] [CrossRef]
- Bederina, M.; Marmoret, L.; Mezreb, K.; Khenfer, M.; Bali, A.; Quéneudec, M. Effect of the addition of wood shavings on thermal conductivity of sand concretes: Experimental study and modeling. Constr. Build. Mater. 2007, 21, 662–668. [Google Scholar] [CrossRef]
- Wang, R.; Zhang, T.; Wang, P. Waste printed circuit boards nonmetallic powder as admixture in cement mortar. Mater. Struct. 2012, 45, 1439–1445. [Google Scholar] [CrossRef]
- Nematchoua, M.K.; Tchinda, R.; Orosa, J.A.; Andreasi, W.A. Effect of wall construction materials over indoor air quality in humid and hot climate. J. Build. Eng. 2015, 3, 16–23. [Google Scholar] [CrossRef]
- Jang, H.S.; So, S.Y. The properties of cement-based mortar using different particle size of grinding waste insulator powder. J. Build. Eng. 2015, 3, 48–57. [Google Scholar] [CrossRef]
- de Brito, J.; Ferreira, J.; Pacheco, J.; Soares, D.; Guerreiro, M. Structural, material, mechanical and durability properties and behavior of recycled aggregates concrete. J. Build. Eng. 2016, 6, 1–16. [Google Scholar] [CrossRef]
- Wang, R.; Meyer, C. Performance of cement mortar made with recycled high impact polystyrene. Cem. Concr. Compos. 2012, 34, 975–981. [Google Scholar] [CrossRef]
- Senthil Kumar, K.; Baskar, K. Development of ecofriendly concrete incorporating recycled high-impact polystyrene from hazardous electronic waste. J. Hazard. Toxic Radioact. Waste 2015, 19, 04014042. [Google Scholar] [CrossRef]
- Aocharoen, Y.; Chotickai, P. Compressive mechanical properties of cement mortar containing recycled high-density polyethylene aggregates: Stress–strain relationship. Case Stud. Constr. Mater. 2021, 15, e00752. [Google Scholar] [CrossRef]
- Pacheco-Torgal, F.; Ding, Y.; Jalali, S. Properties and durability of concrete containing polymeric wastes (tyre rubber and polyethylene terephthalate bottles): An overview. Constr. Build. Mater. 2012, 30, 714–724. [Google Scholar] [CrossRef]
- Sharma, R.; Bansal, P.P. Use of different forms of waste plastic in concrete—A review. J. Clean. Prod. 2016, 112, 473–482. [Google Scholar] [CrossRef]
- Siddique, R.; Khatib, J.; Kaur, I. Use of recycled plastic in concrete: A review. Waste Manag. 2008, 28, 1835–1852. [Google Scholar] [CrossRef]
- Babafemi, A.J.; Šavija, B.; Paul, S.C.; Anggraini, V. Engineering properties of concrete with waste recycled plastic: A review. Sustainability 2018, 10, 3875. [Google Scholar] [CrossRef]
- Alkhrissat, T. Impact of adding waste polyethylene (PE) and silica fume (SF) on the engineering properties of cement mortar. Case Stud. Chem. Environ. Eng. 2024, 9, 100731. [Google Scholar] [CrossRef]
- ASTM C150 specification; Standard Specification for Portland Cement, Page Count: 8. American Society for Testing and Materials: Philadelphia, PA, USA, 2012. [CrossRef]
- CNS 487 specification; Method of Test for Density, Relative Density (Specific Gravity), and Absorption of Fine Aggregate, Page Count: 9. Chinese National Standards: Taiwan, China, 2013.
- ASTM C109 specification; Standard Test Method for Compressive Strength of Hydraulic Cement Mortars (Using 2-in. or 50 mm Cube Specimens), Page Count: 11. American Society for Testing and Materials: Philadelphia, PA, USA, 1994. [CrossRef]
- ASTM C230 specification; Standard Specification for Flow Table for Use in Tests of Hydraulic Cement, Page Count: 7. American Society for Testing and Materials: Philadelphia, PA, USA, 2021. [CrossRef]
- ASTM C403 specification; Standard Test Method for Time of Setting of Concrete Mixtures by Penetration Resistance, Page Count: 7. American Society for Testing and Materials: Philadelphia, PA, USA, 2017. [CrossRef]
- ASTM C348 specification; Standard Test Method for Flexural Strength of Hydraulic Cement Mortars, Page Count: 6. American Society for Testing and Materials: Philadelphia, PA, USA, 2021. [CrossRef]
- ASTM C597 specification; Standard Test Method for Pulse Velocity Through Concrete, Page Count: 4. American Society for Testing and Materials: Philadelphia, PA, USA, 2016. [CrossRef]
- ASTM C1585 specification; Standard Test Method for Measurement of the Rate of Absorption of Water by Hydraulic-Cement Concretes, Page Count: 6. American Society for Testing and Materials: Philadelphia, PA, USA, 2020. [CrossRef]
- ASTM C1012 specification; Standard Test Method for Length Change of Hydraulic-Cement Mortars Exposed to a Sulfate Solution, Page Count: 9. American Society for Testing and Materials: Philadelphia, PA, USA, 2024. [CrossRef]
- ASTM C876 specification; Standard Test Method for Corrosion Potentials of Uncoated Reinforcing Steel in Concrete, Page Count: 8. American Society for Testing and Materials: Philadelphia, PA, USA, 2015. [CrossRef]


| Year | 2013 | 2014 | 2015 | 2016 | 2017 |
|---|---|---|---|---|---|
| Waste TV | 1,181,004 | 1,118,701 | 1,099,031 | 1,021,742 | 26,219,398 |
| Year | 2018 | 2019 | 2020 | 2021 | 2022 |
| Waste TV | 24,411,871 | 22,601,103 | 28,280,353 | 29,026,482 | 30,560,227 |
| Physical Properties | Cement | Sand | TPSW |
|---|---|---|---|
| Specific gravity | 3.15 | 2.65 | 1.17 |
| Fineness modulus | 3450 | 3.09 | 3.04 |
| Water absorption rate (%) | - | 1.9 | 0.1 |
| W/C | RM (%) | TPSW | Sand | Cement | Water |
|---|---|---|---|---|---|
| 0.4 | 0 | 0 | 1567 | 570 | 228 |
| 5 | 78 | 1488 | |||
| 10 | 157 | 1410 | |||
| 15 | 235 | 1332 | |||
| 0.5 | 0 | 0 | 1482 | 539 | 270 |
| 5 | 74 | 1408 | |||
| 10 | 148 | 1334 | |||
| 15 | 222 | 1260 | |||
| 0.6 | 0 | 0 | 1407 | 511 | 307 |
| 5 | 70 | 1336 | |||
| 10 | 141 | 1266 | |||
| 15 | 211 | 1196 |
| No. | Item | Specification | Purpose |
|---|---|---|---|
| 1 | Slump | ASTM C109 [47] | Determine the consistency of the freshly mixed cement mortar and determine the workability |
| 2 | Slump flow | ASTM C230 [48] | Determine the standard fluidity value in the cement mortar |
| 3 | Setting time | ASTM C403 [49] | Understand the properties of the cement and reference for concrete construction |
| 4 | Compressive strength | ASTM C109 [47] | As a reference for the mechanical strength of the specimen |
| 5 | Flexural strength | ASTM C348 [50] | Determine the bonding strength of the cement mortar |
| 6 | Ultrasonic pulse velocity | ASTM C597 [51] | Understand the internal conditions of the specimen |
| 7 | Water absorption rate | ASTM C1585 [52] | Understand the internal porosity of the specimen |
| 8 | Resistant to sulfate attack | ASTM C1012 [53] | Work out the weight loss of the cement mortar |
| 9 | Resistivity | ASTM C876 [54] | Evaluating the corrosion activity of steel within the specimen |
Disclaimer/Publisher’s Note: The statements, opinions and data contained in all publications are solely those of the individual author(s) and contributor(s) and not of MDPI and/or the editor(s). MDPI and/or the editor(s) disclaim responsibility for any injury to people or property resulting from any ideas, methods, instructions or products referred to in the content. |
© 2025 by the authors. Licensee MDPI, Basel, Switzerland. This article is an open access article distributed under the terms and conditions of the Creative Commons Attribution (CC BY) license (https://creativecommons.org/licenses/by/4.0/).
Share and Cite
Hung, C.-C.; Wu, C.-H.; Wang, H.-Y.; Lo, C.-F.; Wang, C.-C.; Tsai, S.-L. Engineering Properties of Television Plastic Shell Waste (TPSW) to Replace Part of Sand–Cement Mortar. Appl. Sci. 2025, 15, 1559. https://doi.org/10.3390/app15031559
Hung C-C, Wu C-H, Wang H-Y, Lo C-F, Wang C-C, Tsai S-L. Engineering Properties of Television Plastic Shell Waste (TPSW) to Replace Part of Sand–Cement Mortar. Applied Sciences. 2025; 15(3):1559. https://doi.org/10.3390/app15031559
Chicago/Turabian StyleHung, Chang-Chi, Chung-Hao Wu, Her-Yung Wang, Chun-Fu Lo, Chien-Chih Wang, and Shen-Lun Tsai. 2025. "Engineering Properties of Television Plastic Shell Waste (TPSW) to Replace Part of Sand–Cement Mortar" Applied Sciences 15, no. 3: 1559. https://doi.org/10.3390/app15031559
APA StyleHung, C.-C., Wu, C.-H., Wang, H.-Y., Lo, C.-F., Wang, C.-C., & Tsai, S.-L. (2025). Engineering Properties of Television Plastic Shell Waste (TPSW) to Replace Part of Sand–Cement Mortar. Applied Sciences, 15(3), 1559. https://doi.org/10.3390/app15031559